Do Small Classes Reduce the Achievement Gap between Low ... · Reducing class size can potentially...
46
1 Do Small Classes Reduce the Achievement Gap between Low and High Achievers? Evidence from Project STAR by Spyros Konstantopoulos Northwestern University
Transcript of Do Small Classes Reduce the Achievement Gap between Low ... · Reducing class size can potentially...

1
Do Small Classes Reduce the Achievement Gap between Low and High
Achievers? Evidence from Project STAR
by
Spyros Konstantopoulos
Northwestern University

2
Abstract
Given that previous findings on the social distribution of the effects of small
classes have been mixed and inconclusive, in the present study I attempted to shed
light on the mechanism through which small classes affect the achievement of
low- and high-achieving students. I used data from a 4-year large-scale
randomized experiment (project STAR) to examine the effects of small classes on
the achievement gap. The sample consisted of nearly 11,000 elementary school
students who participated in the experiment from kindergarten to grade 3. Meta-
analysis and quantile regression methods were employed to examine the effects of
small classes on the achievement gap in mathematics and reading (Stanford
Achievement Test). The results consistently indicated that higher-achieving
students benefited more from being in small classes in early grades than other
students. The findings also indicated that although all types of students benefited
from being in small classes, reductions in class size did not reduce the
achievement gap between low and high achievers.

3
The effects of class size on student achievement have been of great interest to
educational researchers and policy makers the last 2 decades. Reducing class size
to boost student achievement is a policy option that has gained considerable
attention nationwide. Currently, many states and school districts have enacted or
are considering class size reduction with the objective of improving academic
achievement.
Studies that used high-quality experimental data have consistently
demonstrated the positive effects of small classes on average student achievement
for all students (e.g., Finn & Achilles, 1990; Krueger, 1999; Nye, Hedges, &
Konstantopoulos, 2000b). Specifically, these studies indicated that the average
student achievement in small classes (15 students on average) was significantly
higher than in regular classes (22 students on average). These findings suggest
that reducing class size is a promising intervention that increases academic
achievement on average for all students.
However, it is tempting to imagine class size reduction as an educational
intervention that increases academic achievement for all students and reduces the
achievement gap between lower- and higher-achieving students by producing
larger gains for low achievers. The important question of whether class size
reduction can reduce the achievement gap and hence affect the academic
achievement of low- and high-achieving students differently has not been fully
answered thus far. In the present study we attempted to answer this question by

4
examining differences in achievement variability between small and regular-size
classes using data from a 4-year, large-scale, randomized experiment conducted in
Tennessee in the mid 1980s. We also examined differences in achievement
between students in small and in regular classes in the upper and lower tails of the
achievement distribution. Observed differences in achievement variability along
these dimensions would indicate that small classes have varied effects on different
groups of students.
Examining Effects of Class Size Reduction on the Achievement Gap
Previous work on the effects of class size has focused exclusively on estimating
mean differences in student achievement between small and regular-size classes
(Kruger, 1999; Nye, Hedges, & Konstantopoulos, 2000b). However, focusing on
average differences of achievement distributions between these types of classes is
only one way to evaluate effects of class size. A more complete assessment of the
effects would also examine differences in the variability of student achievement
between small and regular classes as well as varied effects of small classes in the
upper and lower tails of the achievement distribution. Specifically, differences in
variability (in a specific outcome) between treatment and control groups in
experimental studies provide important evidence about interactions between
treatments and individuals’ characteristics (see Bryk & Raudenbush, 1988). For
example, differences in achievement variability between treatment and control

5
groups may indicate that a treatment has differential effects on different groups of
students; that is, some student groups may benefit more from being exposed to the
treatment than others. This notion of interaction between treatments and
individual characteristics goes back to the pioneering work of Cronbach and
Snow (1977). In this study we followed Cronbach’s and Snow’s definition about
interactions and examined whether different groups of students (such as low and
high achievers) benefit more or less from receiving a treatment (being in small
classes).
Reducing class size can potentially affect the means as well as the
variances of the achievement distributions of small and regular-size classes. That
is, class size reduction can also produce differences in the variability of student
achievement between the two types of classes. Class size reduction can affect
student achievement variability in three ways. The variability of student
achievement in small classes may be: (a) less than in regular classes, (b) larger
than in regular classes, or (c) similar to that in regular classes. Less variability in
student achievement in small classes (than in regular classes) suggests that the
achievement gap between lower- and higher-achieving students is smaller in these
types of classes. In contrast, larger variability in student achievement in small
classes (than in regular classes) implies that the achievement gap between lower-
and higher-achieving students is wider in small classes. Similar variability in
student achievement in small and in regular classes suggests that the achievement

6
gap between lower- and higher-achieving students is similar in both types of
classes. In addition, differences in achievement variability between small and
regular classes may indicate that achievement differences in the middle of the
achievement distribution are qualitatively different from achievement differences
in the tails. For example, achievement differences between low achievers in small
and in regular classes may be significantly smaller or larger than achievement
differences between average- or high-achieving students in these classes.
Hypotheses about the Class Size Mechanism
Class size reduction can affect the achievement gap in three ways. First, if high
achievers benefit more than low achievers from being in small classes, then one
would expect more variability in student achievement in small classes than in
regular classes. In this case the achievement distribution in small classes will have
a higher mean and a larger standard deviation than the achievement distribution in
regular classes. This may also indicate that achievement differences between
students in small and in regular classes are larger in the upper tail of the
achievement distribution (higher-achieving students) than in the lower tail (lower-
achieving students). If this hypothesis were true, then small classes would not
close the achievement gap between the two groups of students. Second, if low
achievers benefit more from being in small classes, then one would expect smaller
variability in achievement in small classes than in regular classes. In this case the

7
achievement distribution in small classes will have a higher mean and a smaller
standard deviation than the achievement distribution in regular classes. This may
also indicate that achievement differences between students in small and regular
classes are larger at the lower end of the achievement distribution (lower-
achieving students) than at the upper end (higher-achieving students). If this
hypothesis were true, then small classes would close the achievement gap
between low and high achievers because low achievers would benefit more than
other students from being in smaller classes. Third, if small and regular classes
help higher- and lower-achieving students similarly, then one would expect the
variability in achievement in small and regular classes to be comparable. In this
case the achievement distribution in small classes will have a higher mean than
that in regular classes but a comparable standard deviation. That is, the
achievement distribution in small classes is simply shifted to the right by about
one-fifth of a standard deviation, which is the average achievement benefit
reported in previous studies (e.g., Nye et al., 2000b). If this hypothesis were true,
then small classes would have no effect on the achievement gap between low and
high achievers because low, average, and high achievers would benefit equally
from being in small classes.
There are a variety of ways to investigate these hypotheses. First, one
could examine the differential effects of small classes on the achievement of low-
achieving, minority, and disadvantaged students. Some recent studies investigated

8
this issue and found weak evidence that small classes help these types of students
more than others (e.g., Nye, Hedges, & Konstantopoulos, 2000a, 2002, 2004a).
Alternatively, one could examine differences in the variability of achievement in
small and regular classes. Notice that differences in achievement variability
between the two types of classes indicate that the treatment has varied effects
across different types of students (e.g., high and low achievers). That is, the
effects of the treatment may be different in the lower and upper tails of the
achievement distribution. In the present study we examined differences in the
variability of achievement between small and regular classes as well as
differences in the upper and lower tails of the achievement distribution in an
attempt to better understand the class size mechanism. We use data from a 4-year,
large-scale, randomized experiment conducted in Tennessee in the mid 1980s.
This study also addressed issues related to the internal validity of Project STAR
such as student switching among different types of classes and more-than-
intended variability in actual class size within different types of classes.
Research on Educational Interventions
Prior research has shown that treatments can affect both the mean and the
variance of a continuous outcome of interest. Studies evaluating effects of
educational interventions have indicated that such programs can change not only
average student achievement but the variability in achievement as well. For

9
example, research on resource allocation in schools has indicated that an
important criterion variable for reform programs that aim to equalize school
funding is not the average per-pupil expenditure across school districts but the
variability of per-pupil expenditure across school districts (Bowles & Levin,
1968; Monk, 1981). Reviews of research where students are assigned to different
learning conditions (e.g., tutoring, mastery learning, and conventional) have also
reported differences among the three conditions in average achievement as well as
in achievement variability (Bloom, 1984). Cross-national comparisons of student
achievement have also shown that countries with larger achievement gains in
central tendency also had larger gains in achievement variability (Coleman,
1985). Specifically, Japan had not only the largest average achievement gain but
the largest gain in achievement variability as well. In addition, significant
associations between school size, variation in mathematics course taking, sector
(private or public school), and variability in achievement have also been reported
using High School and Beyond data (Raudenbush & Bryk, 1987). Nonetheless, in
the present study it was not obvious how class size reduction will affect
achievement variability. Thus, we predicted that achievement variability in small
classes would be different from that in regular classes (a nondirectional
hypothesis).
Studies of Class Size

10
The effects of class size reduction on achievement have been examined
empirically via various research designs over the past few decades. Numerous
experimental and quasi-experimental studies have investigated the effects of class
size on student achievement and have been reviewed by Glass and Smith (1979),
Glass, Cahen, Smith, and Filby (1982), Hedges and Stock (1983), and Mosteller,
Light, and Sacks (1996). Overall, these reviews have indicated that class size
reduction has positive effects on student achievement and that these effects
become larger as the class size becomes smaller. Nonetheless, the majority of the
studies have been small-scale and short term, and although their results may have
high internal validity, the generality of their findings may be limited.
Another line of research has examined the effects of class size reduction
via education production function studies (see e.g., Hanushek, 1986). Typically
such studies compute the association between class size and achievement,
adjusting for important student variables such as race/ethnicity, social class, and
previous achievement. The interpretation of the results of these econometric
studies has been controversial. Although some reviewers have argued that the
effects of class size are small and in many studies statistically insignificant (e.g.,
Hanushek, 1989), others have contended that the magnitude of the estimates of
the mean differences in student achievement is a better way to assess class size
effects than statistical significance (e.g., Greenwald, Hedges, & Laine, 1996;
Hedges, Laine, & Greenwald, 1994). Although most of these studies were large-

11
scale and hence their results may have high external validity, their internal
validity may be limited because it is not obvious that the association between
class size and achievement is causal (that is, class size may be endogenous). For
example, it is likely that achievement defines class membership. In addition,
omitted-variable bias is possible in these large-scale observational studies, and
this can bias estimates of class size effects. Finally, the key independent variable
(class size) is typically constructed using school size and number of teachers in
the school, and hence it is not an accurate but an aggregate measure of class size.
The Tennessee Class Size Experiment
The Tennessee class size experiment, or Project STAR (Student-Teacher
Achievement Ratio), is discussed in detail elsewhere (see, e.g., Krueger, 1999;
Nye, Hedges, & Konstantopoulos, 2000b). The experiment involved students in
79 elementary schools in 42 districts in Tennessee. During the first year of the
study, within each school, kindergarten students were assigned randomly to
classrooms in one of three treatment conditions: smaller classes (with 13 to 17
students), larger classes (with 22 to 26 students), or larger classes with a full-time
classroom aide. Teachers were also assigned randomly to classes of different
types. The assignments of students to classroom types were maintained through
the third grade for students who remained in the study. Some students entered the
study in the first grade and subsequent grades and were assigned randomly to

12
classes at that time. Teachers at each subsequent grade level were also assigned
randomly to classes as the experimental cohort passed through the grades.
Districts had to agree to participate for 4 years, allow school visits for verification
of class sizes, interviewing, and data collection, including extra student testing.
They also had to allow research staff to assign pupils and teachers randomly to
class types and to maintain the assignment of students to class types from
kindergarten through grade 3.
Project STAR has high internal validity because, within each school,
students and teachers were assigned randomly to classes of different sizes. In
addition, because project STAR is a large-scale randomized experiment that
includes a broad range of schools and districts (urban, rural, wealthy, and poor) it
likely has higher external validity than smaller-scale studies. Moreover, the study
was part of the everyday operation of the schools that participated and hence there
is a lower likelihood that novelty effects affected the class size estimates.
Previous Findings from Project STAR
Early analyses of Project STAR data indicated that small classes had
positive effects on student achievement (Finn & Achilles, 1990). More recent
analyses that considered validity threats (e.g., attrition, switching) also
demonstrated that small classes increase student achievement (Krueger, 1999;
Nye et al., 2000b). Other analyses have shown long-term positive effects of class

13
reduction on student performance (Finn, Gerber, Achilles, & Boyd-Zaharias,
2001; Krueger & Whitmore, 2001; Nye, Hedges, & Konstantopoulos, 1999).
Project STAR data have also been used to examine the differential effects
of class size on the achievement of low-achieving, minority, and disadvantaged
students. An early study reported that class size reduction had larger positive
effects for minority students (Finn & Achilles, 1990). These average differences
were significant for reading achievement for the first 2 years of the experiment.
However, more recent studies that used modern and more appropriate statistical
methods could not fully replicate the early findings. For example, Nye et al.
(2000a) found weak evidence that class size reduction had larger benefits for
minority students. The gain was only observed in reading in one of the model
specifications that the researchers examined. The differential effects of small
classes for disadvantaged students were statistically insignificant in all
specifications. In a subsequent study Nye Hedges, and Konstantopoulos (2002)
examined the differential effects of small classes for low-achieving students and
found no evidence of additional benefits for these students. However, that study
involved students who participated in project STAR for 2 consecutive years, and
thus did not include new participants who joined the study the following year.
Finally, a more recent study that used follow-up data from Project STAR
indicated that being in small classes for 4 years may subsequently decrease the
race/ethnic achievement gap in reading in grades 4 to 8 (Nye, Hedges, &

14
Konstantopoulos, 2004a). Nonetheless, overall there is weak evidence of
differential effects of small classes for low-achieving, minority, and
disadvantaged students.
In the present study we examined how class size reduction affected the
achievement gap between low and high achievers. To determine whether small
classes had differential effects on different types of students, we computed
differences in achievement variability between small and regular classes, and
differences in achievement at the upper and lower tails of the achievement
distribution. Given previous findings about the differential effects of small
classes, one would expect that differences in achievement variability between
smaller and larger classes should be small and insignificant and that the small-
class effect for lower achievers would not be as important. This is actually the
null hypothesis, which states that the variability in achievement between smaller
and larger classes is zero and that all students benefit equally from being in small
classes. However, given the results from studies of educational interventions, one
would expect that class size reduction may increase the mean and the variability
in achievement. This would indicate that small classes have higher variability in
achievement than regular classes and that high achievers may benefit more from
being in small classes than other students. If that were the case, then class size
reduction would not reduce the achievement gap.
Method
15
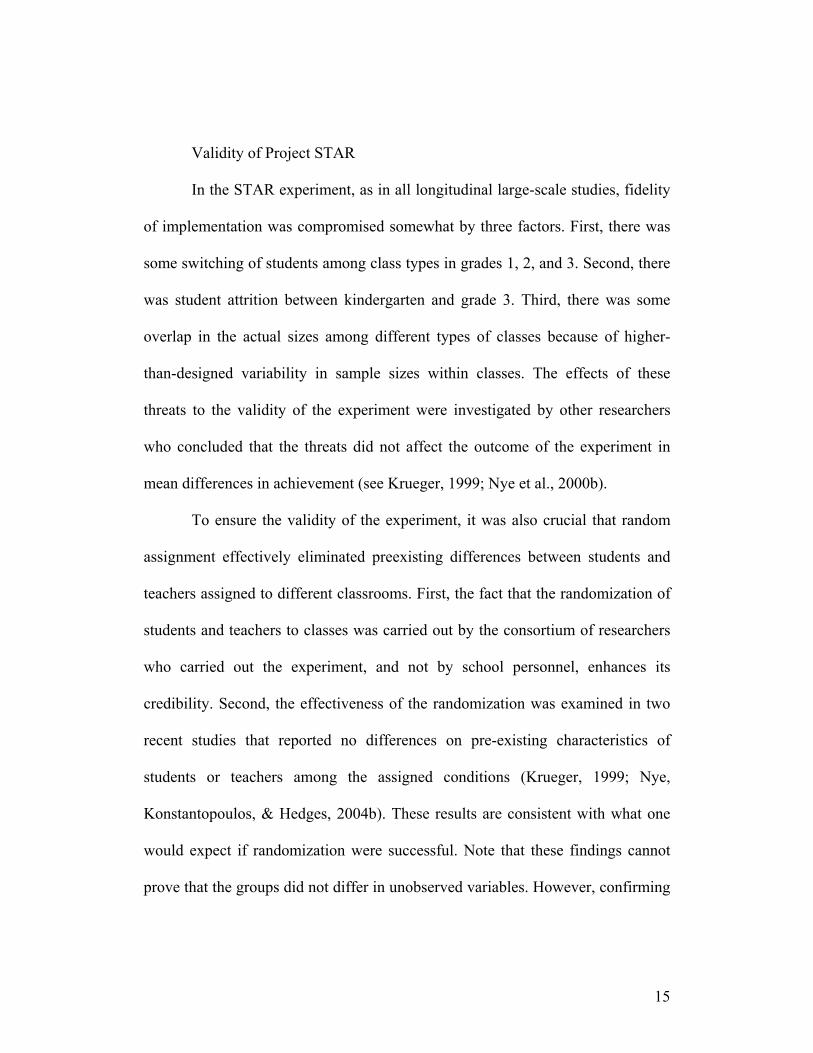
Validity of Project STAR
In the STAR experiment, as in all longitudinal large-scale studies, fidelity
of implementation was compromised somewhat by three factors. First, there was
some switching of students among class types in grades 1, 2, and 3. Second, there
was student attrition between kindergarten and grade 3. Third, there was some
overlap in the actual sizes among different types of classes because of higher-
than-designed variability in sample sizes within classes. The effects of these
threats to the validity of the experiment were investigated by other researchers
who concluded that the threats did not affect the outcome of the experiment in
mean differences in achievement (see Krueger, 1999; Nye et al., 2000b).
To ensure the validity of the experiment, it was also crucial that random
assignment effectively eliminated preexisting differences between students and
teachers assigned to different classrooms. First, the fact that the randomization of
students and teachers to classes was carried out by the consortium of researchers
who carried out the experiment, and not by school personnel, enhances its
credibility. Second, the effectiveness of the randomization was examined in two
recent studies that reported no differences on pre-existing characteristics of
students or teachers among the assigned conditions (Krueger, 1999; Nye,
Konstantopoulos, & Hedges, 2004b). These results are consistent with what one
would expect if randomization were successful. Note that these findings cannot
prove that the groups did not differ in unobserved variables. However, confirming

16
that differences in variables that were measured were not observed makes the
probability that there are differences in unobserved variables smaller.
In randomized experiments such as project STAR, participants (e.g.,
students, teachers) have an equal probability of being assigned to treatment
groups (e.g., small classes, regular classes, and regular classes with a classroom
aide). This suggests that the students (and teachers) assigned to different class
types have similar observed and unobserved characteristics. In turn, this indicates
that random assignment is orthogonal to observed and unobserved characteristics.
The fact that there is no evidence that randomization was not successful facilitates
the causal argument in the present study. That is, when randomization is
successful, differences in central tendency and variability in achievement are due
entirely to the treatment effect. Hence, the causal argument for differences in
average achievement holds also for differences in achievement variability. In
Project STAR this suggests that the only source of variance heterogeneity in
achievement between smaller and larger classes is the differential effect of the
treatment (see Raudenbush & Bryk, 1987).
Statistical Analysis
The first part of the analysis involved differences in achievement
variability, and hence the outcome variable was the variability in achievement in
each classroom, which we computed following the methods provided by
Raudenbush and Bryk (1987). The first step involved the computation of the

17
within classroom residuals. Because students are nested within classrooms we
used a two-level model to compute the student-level residuals. Specifically, the
first-level model for student i in classroom j is
0 1 2 3ij j j ij j ij j ij ijY FEMALE MINORITY LOWSES eβ β β β= + + + + ,
where Y represents mathematics or reading achievement for student i in
classroom j, FEMALE is a dummy variable for gender, SES is a dummy variable
for free or reduced-price lunch eligibility, MINORITY is a dummy variable for
minority group membership (indicating that the student was Black, Hispanic, or
Asian), and e is a student- and classroom-specific residual. The idea was to adjust
for student characteristics in order to compute the residual variation in
achievement in each classroom net of student effects. The second-level model for
the classroom specific intercept is
0 00j jβ γ η= + ,
where 00γ is the average student achievement across all classrooms, and jη is a
classroom-specific random effect. The remaining level one coefficients were
treated as fixed at the second level. According to Raudenbush and Bryk (1987),
the computation of achievement variability within each classroom involves the
level one residuals in each classroom and the degrees of freedom involved in the
computation of the achievement variability in each classroom. Namely,
( )^
2 /j ij je vθ = ∑ ,

18
where θ is the residual achievement variation in class j, e represents the student-
specific residuals in class j, and vj indicates the degrees of freedom with which θ
is estimated. In our case
1j jv n= − ,
where n is the number of students in classroom j. Further, Raudenbush and Bryk
(1987) recommend the log transformation of θ and provide an unbiased estimator
namely
^11/ 2(log( ) )j j jd vθ −= + .
The term dj now represents the residual variability in achievement in classroom j
and has a known variance 1 / 2jv− . Because the variance of each classroom-
specific outcome is known, and these variances differ among classrooms
(heterogeneity of variance), the most appropriate method for analyzing these data
is meta-analysis (Konstantopoulos & Hedges, 2004; Raudenbush & Bryk, 2002).
Specifically, we ran a two-level (mixed effects) meta-analytic model that is
expressed in a single level equation as
0 1j j j jd SMALLCLASS u eδ δ= + + + ,
where 0δ is the average variability in achievement across all classrooms, 1δ is the
average difference in achievement variability between small and regular classes
that needs to be computed, SMALLCLASS is a dichotomous variable (1 if small
class and 0 otherwise) that represents random assignment, uj is a classroom-

19
specific random effect and e is the usual error term. The most important
coefficient is 1δ , which represents the average difference in achievement
variability between small and regular classes. We conducted analyses for
mathematics and reading achievement separately for each grade, that is, the
analyses were repeated eight times. We also ran models adjusting for possible
school effects, because students and teachers were not randomly assigned to
schools. All analyses were repeated using fixed-effects models for meta-analysis
also. Our sample consisted of 325 classrooms in kindergarten, 337 classrooms in
the first grade, 324 classrooms in the second grade, and 326 classrooms in the
third grade.
The second part of the analysis involved differences in achievement
between students in small and in regular classes at the upper and lower tails of the
achievement distribution. Specifically, we used quantile regression to estimate the
small-class effect at various points on the achievement distribution (see
Bushinsky, 1998; Koenker & Bassett, 1978). We ran quantile regressions for
mathematics and reading test scores separately for each grade (k, 1, 2, and 3). In
each grade mathematics and reading achievement scores were regressed on small-
class assignment (taking the value of 1 if a student was in a small class and 0
otherwise). Gender, race/ethnicity, and lower socioeconomic status (SES) were
included as covariates. We examined the small-class effect at the lower tail (e.g.,
20
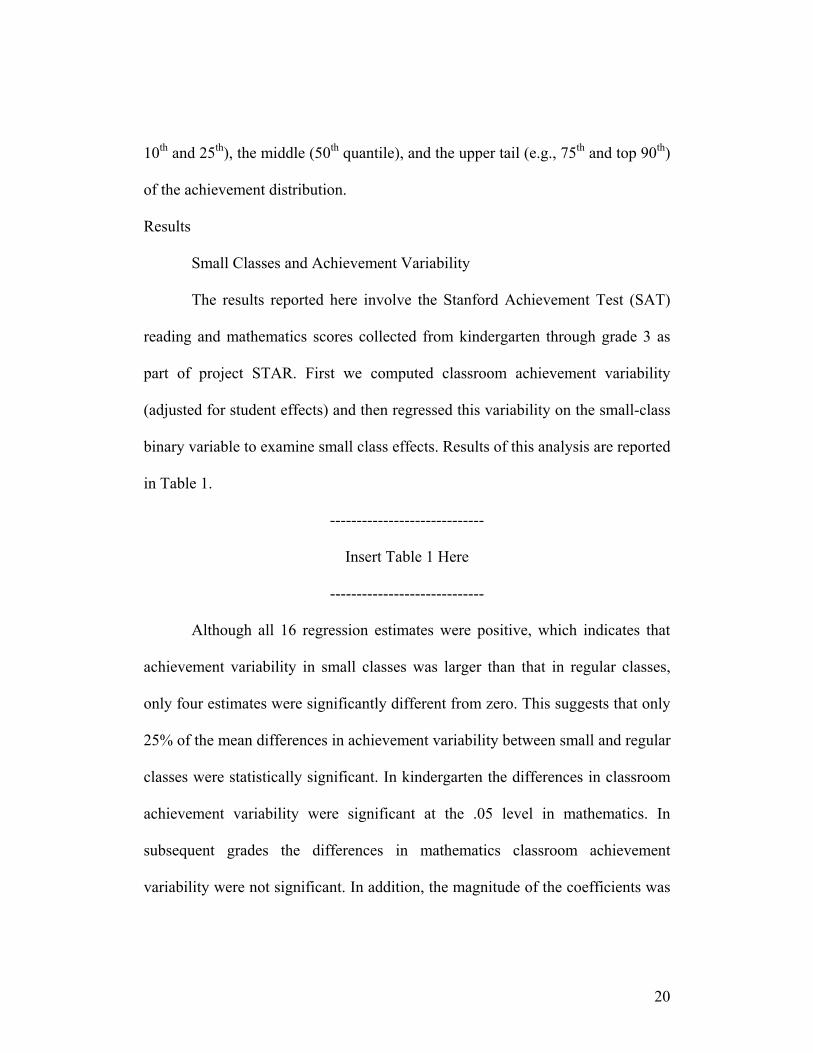
10th and 25th), the middle (50th quantile), and the upper tail (e.g., 75th and top 90th)
of the achievement distribution.
Results
Small Classes and Achievement Variability
The results reported here involve the Stanford Achievement Test (SAT)
reading and mathematics scores collected from kindergarten through grade 3 as
part of project STAR. First we computed classroom achievement variability
(adjusted for student effects) and then regressed this variability on the small-class
binary variable to examine small class effects. Results of this analysis are reported
in Table 1.
-----------------------------
Insert Table 1 Here
-----------------------------
Although all 16 regression estimates were positive, which indicates that
achievement variability in small classes was larger than that in regular classes,
only four estimates were significantly different from zero. This suggests that only
25% of the mean differences in achievement variability between small and regular
classes were statistically significant. In kindergarten the differences in classroom
achievement variability were significant at the .05 level in mathematics. In
subsequent grades the differences in mathematics classroom achievement
variability were not significant. In addition, the magnitude of the coefficients was

21
smaller in grades 1, 2, and 3. This suggests that, in mathematics, class size
differences in variability were observed in the first year of the study.
The results in reading were comparable. Specifically, the coefficients in
kindergarten and first grade were larger than those in grades 2 and 3. In grade 1
the differences in classroom achievement variability were statistically significant
at the .05 level in reading. In other grades the differences in reading achievement
variability were not significant. This indicates that, in reading, class size
differences in variability are occurred in the second year of the study. Thus, class
size differences in achievement variability were observed for both mathematics
and reading mainly during the first 2 years of the study (kindergarten and first
grade).
Intention-to-Treat Analysis
As in any large-scale, long-term experiment, the implementation of
Project STAR deviated from the experimental design. One limitation was that in
grades 1, 2, and 3, students who were assigned initially to a specific type of class
in one year switched to other types of classes the next year. For example, in the
first grade students who were assigned to regular-size and regular-size-with-an-
aide classes were randomized again to receive the other treatment condition.
Studies have shown that about 50% of the students assigned to one type of regular
class in kindergarten were reassigned to the other type of regular-size class in the

22
first grade (Krueger, 1999; Nye et al., 2000b). With the exception of student
switching between regular and regular classes with aide in first grade, the
nonrandom transition rates of students among treatment conditions ranged from
two to nine percent across grades (see Nye et al., 2000b). It is noteworthy that the
transition rates from regular to small classes were consistently eight to nine
percent between grades, whereas transition rates from small to regular classes
were much lower (2%-4%).
Because student transitions among types of classes were nonrandom, it is
possible that the estimates of the class size effects are biased. Research that
examined mean differences in achievement between small and regular classes
showed no evidence of bias (Krueger, 1999; Nye et al., 2000b). In the present
study we examined whether student switching among different types of classes
affected differences in achievement variability between small and regular classes.
One way to examine the possible effects of this switching is to estimate effects of
the treatment as it was originally assigned the first year a student entered the
study. This is equivalent to the intention-to-treat analysis typically used in clinical
trials. Suppose a student is assigned to a regular class in kindergarten and
switches to a small class in first grade. In the intention-to-treat analysis, this
student is assumed to be part of the regular-size class in the first grade, although
he or she actually received a different type of treatment in that grade. The idea is
that, if the intention-to-treat analysis produces estimates of the treatment effect

23
that are similar to the estimates obtained from the analysis that defines treatment
as it was actually received, switching between classrooms would not compromise
the internal validity of the experiment. For each grade (1, 2, and 3) we constructed
a new variable that we called “original” assignment as a dichotomous variable
taking the value of one if a student was originally assigned to a small class and
zero otherwise. Then, we reran the analysis discussed earlier in the analysis
section for mathematics and reading for grades 1, 2, and 3.
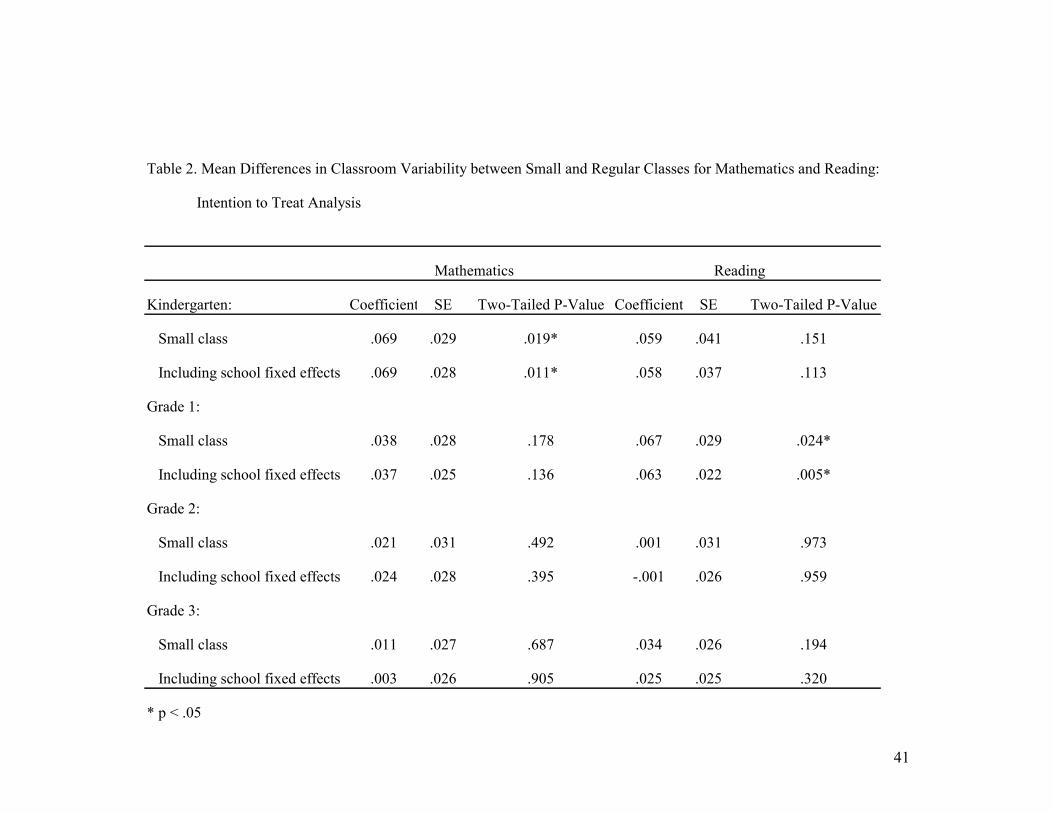
The results of this analysis are reported in Table 2. The structure of Table
2 is identical to that of Table 1. The results of the intention to treat analysis are
qualitatively similar to and consistent with those reported in Table 1. Fifteen out
of 16 regression estimates (about 94%) were positive, but only four of the
estimates were statistically significant. In kindergarten the differences in
classroom variability were statistically significant at the .05 level in mathematics.
As in Table 1, the magnitude of the coefficients was smaller in grades 1, 2 and 3.
The results for reading were comparable. The coefficients in kindergarten and
first grade were larger than those in grades 2 and 3. In first grade the differences
in classroom variability were statistically significant at the .05 level in reading. In
other grades the differences in reading achievement variability were not
significant. Overall these results also indicated that class size differences in
achievement variability are observed for both mathematics and reading mainly
during the first 2 years of the study (kindergarten and first grade).

24
-----------------------------
Insert Table 2 Here
-----------------------------
Actual Class Size and Achievement Variability
Although the experimental design had targeted a certain range of class size
for each type of classroom (13 to 17 for smaller classes and 22 to 26 for larger
classes), there was more than intended variation in small and regular classes. That
is, the actual class size ranged from 11 to 20 for small classes and from 15 to 29
for regular classes (see Table 3). As Table 3 shows, there was a modest overlap
between the actual class sizes of the three treatment conditions. This larger-than-
intended variability in actual class size for each type of classroom and the modest
overlap between small and regular classes may have affected the estimate of the
treatment effect. Hence, a more complete analysis would examine the association
between actual class size and classroom variability in achievement.
-----------------------------
Insert Table 3 Here
-----------------------------
To conduct this analysis, one needs to construct actual class size and
include it as the main independent variable in the meta-analysis regression. This
approach, however, has the disadvantage that, although target class size is

25
assigned randomly, actual class size is not and may be a result of nonrandom
unobserved factors that may also be related to the outcome. That is, any relation
between actual class size and achievement variability is not necessarily a causal
effect. A common way to overcome this problem is to use random assignment as
an instrumental variable (IV) for actual class size (see, e.g., Angrist, Imbens, &
Rubin, 1996; Nye et al., 2004b). In the IV regression, actual class size is regressed
on random assignment and the predicted values of this regression are used in the
meta-analysis regression as the main independent variable. The advantage of this
procedure is that it yields estimates of the causal effects of actual class size.
The results of this analysis are reported in Table 4. The structure of Table
4 is identical to that of Tables 1 and 2 and the results are similar to those reported
in Tables 1 and 2. Specifically, although all 16 regression estimates were negative
as expected, only four estimates were significantly different from zero. In
kindergarten the differences in classroom variability were statistically significant
at the .05 level in mathematics. Again, the magnitude of the coefficients was
smaller in grades 1, 2 and 3. The results for reading were comparable. The
coefficients in kindergarten and first grade were larger than those in grades 2 and
3. In first grade the association between class size and classroom achievement
variability was statistically significant at the .05 level in reading. In other grades
the coefficients were not significant. Overall these results also indicated that class
size differences in achievement variability were observed for both mathematics

26
and reading mainly during the first 2 years of the study (kindergarten and first
grade). It should be noted that all analyses were replicated using also fixed-effects
models for meta-analysis and the results were similar to those obtained using
mixed-effects models.
-----------------------------
Insert Table 4 Here
-----------------------------
Achievement Differences at the Upper and Lower Tails of the
Achievement Distribution
Results from the previous analyses suggested that the small-class effect
may not be distributed uniformly across the achievement distribution. In fact, the
results indicated that the small-class advantage may be larger at the upper tail of
the achievement distribution. If high achievers benefit more from being in small
classes, then the small-class advantage at the upper tail must be larger than that at
the middle part or at the lower tail of the achievement distribution.
Results of the quantile regression analyses are summarized in Table 5. All
estimates are in standard deviation units. As expected, all coefficients in the
median (or robust) regression were positive, significantly different from zero, and
ranged between one-seventh and one-fourth of a standard deviation. These results
were similar to those reported in previous studies that estimated mean differences

27
(see Nye et al., 2000b). The estimates at the lower tail were also positive but
smaller than those at the median or at the upper tail of the achievement
distribution. Nonetheless, 50% of the estimates at the tenth quantile (grades 1 and
3) and all estimates at the twenty-fifth quantile were statistically significant. This
indicates that lower-achieving students benefited from being in small classes. At
the upper tail all estimates (75th and 90th quantiles) were positive and statistically
significant. The magnitude of the coefficients indicated that the small class effect
was consistently larger for high achievers than for other students. All coefficients
estimated in the upper tail of the achievement distribution were much larger than
those obtained from the middle or the lower tails. In Kindergarten mathematics
the coefficient at the ninetieth quantile was more than twice as large as the
coefficient at the fiftieth quantile and nearly four times as large as the coefficient
at the tenth quantile. In kindergarten reading the difference in achievement
between the median and the ninetieth quantile was much smaller (17%), but the
difference between the tenth and the ninetieth quantile estimates was still large. In
the first grade, the difference in achievement between the median and the
ninetieth quantile was nearly 25% both in mathematics and reading achievement.
-----------------------------
Insert Table 5 Here
-----------------------------

28
Although these results seem to support the notion that higher-achieving
students may benefit more than other students from being in small classes in the
same types of classes, one needs to examine whether the estimates across the
different quantiles were statistically significant. Table 6 summarizes t-tests that
examined this question. The first column of Table 6 indicates that in grades K and
2 the differences between the small-class effect at the tenth and the ninetieth
quantiles were statistically significant at the .05 level in mathematics. Also, in
grade 1 differences between the small-class effects at the tenth and the ninetieth
quantiles were statistically significant at the .05 level in reading. This indicates
that in some grades the very high achievers benefited significantly more from
being in small classes than did very low achievers. This finding partly replicates
that from the previous analyses that pointed to significant differences in
achievement variability in kindergarten in mathematics and grade 1 in reading.
The results in column 2 indicate that 50% of the differences between the estimates
at the twenty-fifth and the seventy-fifth quantiles were statistically significant.
The results in columns 3 and 4 show that some differences between the estimates
at the fiftieth and the tenth or ninetieth quantiles were statistically significant.
Overall, these results provided some evidence that higher achievers benefited
more than other students from being in smaller classes. However, these results do
not indicate that low achievers are better off in regular classes, that is, all types of
students benefit from being in small classes.

29
-----------------------------
Insert Table 6 Here
-----------------------------
Conclusion
Previous work that used Project STAR data provided consistent evidence that
being in small classes in early grades leads to higher student achievement on
average. Given that class size reduction is an educational intervention that
benefits all students by increasing their achievement it is tempting to expect that it
could also reduce the achievement gap between higher and lower achievers.
However, previous research provided weak or no evidence that reducing class size
benefits lower-achieving students more than other students (Nye et al., 2002). The
present study examined differences in achievement variability between smaller
and larger classes and differences at the upper and lower tails of the achievement
distribution in an attempt to better understand the effects of class size reduction
on the achievement gap.
Our results suggest that small classes produce significantly higher
variability in achievement than regular classes in kindergarten in mathematics and
in first grade in reading. The differences favoring small classes were more
pronounced and significant in the first 2 years of the experiment (kindergarten and
first grade) and smaller and insignificant in the last 2 years of the experiment

30
(grades 2 and 3). Overall the results indicate that class size reduction increases not
only achievement for all students on average, but the variability in student
achievement as well (at least in the first two grades). In addition, results from the
quantile regression analyses provided additional evidence that all types of
students benefited from being in small classes, and that high-achieving students
may have benefited even more.
These findings suggest differential effects of small classes across different
types of students, that is, some types of students benefit more than others from
being in small classes. Specifically, due to the larger variability in achievement in
small classes, the difference (or distance) in achievement between high and low
achievers is greater in those classes than in regular classes in kindergarten and
first grade. If the achievement distributions in small and regular classes had the
same mean but different variances (e.g., larger variances in small classes), then
one would argue that high achievers may benefit more from being in small classes
than in regular classes, whereas low achievers may benefit less. However, the
achievement distributions differ in the means as well because smaller classes have
a higher mean. This still indicates that higher achievers may benefit more from
being small classes, but, given the considerable average difference in achievement
(nearly 0.2 SD) low achievers in small classes would benefit at least as much as
low achievers in regular classes because the small-class achievement distribution
is shifted to the right. Results of the quantile regression analysis support this

31
notion showing that high achievers benefit even more from being in small classes,
but low achievers benefit as well. Nonetheless, the achievement gap between
lower and higher achievers is still larger in small classes than in regular classes in
some grades. This suggests no evidence that manipulating class size can reduce
the achievement gap between lower- and higher achieving students.
Our analyses also addressed the possible effects of validity threats such as
student switching between types of classrooms, and larger variability than
intended by design in actual class size, which resulted in overlap in actual class
size between smaller and larger classes. The results of these analyses were
consistent with those in the original analysis and further supported the notion that
achievement variability is larger in small classes especially during kindergarten
and first grade. This again suggests that high achievers may benefit even more
from being small classes than in other types of classes, at least in kindergarten and
first grade. However, we did not find any evidence of additional benefits of small
classes for lower achievers. This result should be interpreted with caution. It does
not necessarily mean that lower-achieving students are better off in larger classes,
because all students benefit from being in small classes.
These results shed some more light on the mechanism through which
small classes may benefit students. One hypothesis is that in small classes
teachers are more likely to identify lower achievers and hence they are more
likely to provide instruction designed to benefit these students in the early grades.

32
However, our findings did not support this hypothesis. Another hypothesis is that
teachers are also more likely to identify higher-achieving students in small classes
and thus are more likely to provide effective strategies that benefit these students
more. Alternatively, it is plausible that the instructional practices in small classes
benefit higher achievers more. That is, high-achieving students may be more
engaged (or motivated) in learning than other students in small classes. Possibly
high achievers take more advantage of the opportunities or teacher practices that
take place in small classes or create more opportunities for learning in small
classes than lower-achieving students in small classes or other students in other
classes, especially in the first 2 years of school (kindergarten and first grade). One
possibility is that the effects of small classes accrued mainly in the first and
second years of the study. Some researchers has discussed that possibility and
showed that the cumulative effects of small classes diminish over time in
mathematics (Nye, Hedges, & Konstantopoulos, 2001). Typically in the first 2
years of schooling students learn what behaviors are expected in school. This
means that teachers spend considerable time on management and behavior-related
issues. It is likely that in smaller classes these issues are addressed in a shorter
time than in regular classes, and this in turn means that in kindergarten and first
grade more time is spent on learning and instruction in small classes. High
achievers in small classes may take advantage of this and engage more in learning
than other students. Hence, they may have steeper learning trajectories in the first

33
2 years of school than other students or in later grades. By grade 2, students
typically know what is expected in elementary school and hence it is likely that
the time spent on management issues and learning and instruction is comparable
in small and regular classes. It is difficult to know exactly what the mechanism
might be. Our results, however, indicate that higher-achieving students benefit
even more from being in small classes mainly in Kindergarten and first grade.
In addition, it should be noted that the results reported in this study are
depended on the outcome used. Specifically, although SAT tests are used widely
in elementary schools, it is not obvious that they portray accurately the teacher
practices in small and regular classes or the content covered at each grade level.
SAT are norm-referenced tests that are not particularly well-aligned with the
curriculum taught at each grade level. Suppose for example, that teachers in small
classes spend more time to help low achievers master the specified curriculum,
but they also spend time helping high achievers develop learning skills beyond the
specified curriculum or grade level. Suppose also, that tests such as SAT measure
achievement that is not necessarily curriculum specific. Because SAT is not a
criterion-referenced test designed to gauge mastery learning, it is possible that it
would not provide evidence of the achievement gap due only to the specified,
taught curriculum. Hence, it is possible that the achievement gap in terms of the
specified curriculum is greatly reduced, but that reduction would not be evident in
the results of measures that are not particularly well-aligned with the curriculum

34
taught. It would be possible then, that a criterion-referenced test would have
provided different results.
Although this study helped us better understand the effects of small
classes on student achievement, the mechanism is still not clearly defined.
Unfortunately, data about practices in different types of classrooms are not
available. Such detailed observational data could have unveiled the mechanism of
small-class effects via information about instructional processes and interactions
between students and teachers. A new randomized experiment with the objective
of collecting high-quality observational data in the classrooms would provide
invaluable information about the effects of small classes.

35
References
Angrist, J., Imbens, G. W., & Rubin, D. B. (1996). Identification of causal effects
using instrumental variables. Journal of the American Statistical
Association, 91, 444-472.
Bloom, B. S. (1984). The two sigma problem: The search for methods of group-
instruction as effective as one-to-one tutoring. Educational Researcher,
13(6), 4-16.
Bowles, S., & Levin, H. M. (1968). The determinants of scholastic achievement:
An appraisal of some recent evidence. Journal of Human Resources, 3, 3-
24.
Bryk, A. S., & Raudenbush, S. W. (1988). Heterogeneity of variance in
experimental studies: A challenge to conventional interpretations.
Psychological Bulletin, 104, 396-404.
Buchinsky, M. (1998). Recent advances in quantile regression models: A practical
guideline for empirical research. Journal of Human Resources, 33, 89-126.
Coleman, J. S. (1985). Schools, families, and children (Nora and Edward Ryerson
Lecture). Chicago: University of Chicago.
Cronbach, L. J., & Snow, R. E. (1977). Aptitudes and instructional methods. New
York: Irvington.

36
Finn, J D., & Achilles, C. M. (1990). Answers and questions about class size: A
statewide experiment. American Educational Research Journal, 27, 557-
577.
Finn, J D., Gerber, S. B., Achilles, C. M., & Boyd-Zaharias, J. (2001). The
enduring effects of small classes. Teachers College Record, 103, 145-183.
Glass, G. V., Cahen, L.S., Smith, M. E., & Filby, N. N. (1982). School class size:
Research and policy. Beverly Hills, CA: Sage.
Glass, G. V., & Smith, M. E. (1979). Meta-analysis of research on class size and
achievement. Educational Evaluation and Policy Analysis, 1, 2-16.
Greenwald, R., Hedges, L. V., & Laine, R. D. (1996). The effects of school
Resources on student achievement, Review of Educational Research, 66,
361-396.
Hanushek, E. A. (1986). The economics of schooling: Production and efficiency
in public schools. Journal of Economic Literature, 24, 1141-77.
Hanushek, E. A. (1989). The impact of differential expenditures on school
performance. Educational Researcher, 18, 45-51.
Hedges, L. V., Laine, R., & Greenwald, R. (1994). Does money matter: A meta-
analysis of studies of the effects of differential school inputs on student
outcomes. Educational Researcher, 23, 5-14.

37
Hedges, L. V., & Stock, W. (1983). The effects of class size: An examination of
rival hypotheses. American Educational Research Journal, 20, 63-85.
Koenker, R., & Bassett, G. (1978). Regression quantiles. Econometrica, 46, 33-
50.
Konstantopoulos, S., & Hedges, L.V. (2004). Meta-analysis. In D. Kaplan (Ed.),
Handbook of quantitative methodology for the social sciences (pp. 281
-297). New York: Sage.
Krueger, A. B. (1999). Experimental estimates of education production functions.
Quarterly Journal of Economics, 114, 497-532.
Krueger, A. B., & Whitmore, D. M. (2001). The effect of attending a small class
in the early grades on college-test taking and middle school test results:
Evidence from project STAR. Economic Journal, 111, 1-28.
Monk, D. H. (1981). Toward a multilevel perspective on the allocation of
educational resources. Review of Educational Research, 51, 215-236.
Mosteller, F., Light, R. J., & Sachs, J. A. (1983). Sustained inquiry in education:
Lessons learned from skill grouping and class size. Harvard Educational
Review, 66, 797-842.
Nye, B., Hedges, L.V., & Konstantopoulos, S. (1999). The long-term effects of
small classes: A five-year follow-up of the Tennessee class size
experiment. Educational Evaluation and Policy Analysis, 21, 127-142.

38
Nye, B., Hedges, L.V., & Konstantopoulos, S. (2000a). Do the disadvantaged
benefit from the small classes? Evidence from the Tennessee class size
experiment. American Journal of Education, 109, 1-26.
Nye, B., Hedges, L.V., & Konstantopoulos, S. (2000b). Effects of small classes
on academic achievement: The results of the Tennessee class size
experiment. American Educational Research Journal, 37, 123-151.
Nye, B., Hedges, L.V., & Konstantopoulos, S. (2001). Are the effects of small
classes cumulative? Evidence from the Tennessee class size experiment.
Journal of Educational Research, 94, 336-345.
Nye, B., Hedges, L.V., & Konstantopoulos, S. (2002). Do low achieving students
benefit more from small classes? Evidence from the Tennessee class size
experiment. Educational Evaluation and Policy Analysis, 24, 201-217.
Nye, B., Hedges, L.V., & Konstantopoulos, S. (2004a). Do minorities experience
larger lasting benefits from small classes? Evidence from a five-year
follow-up of theTennessee class size experiment. Journal of Educational
Research, 98, 94-100.
Nye, B., Konstantopoulos, S, & Hedges, L.V. (2004b). How Large are Teacher
Effects? Educational Evaluation and Policy Analysis, 26, 237-257.
Raudenbush, S. W., & Bryk, A. S. (1987). Examining correlates of diversity.
Journal of Educational Statistics, 12, 241-269.

39
Raudenbush, S. W., & Bryk, A. S. (2002). Hierarchical linear models. Thousand
Oaks, CA: Sage.

40
Table 1. Mean Differences in Classroom Variability between Small and Regular Classes for Mathematics and Reading
Mathematics Reading
Kindergarten: Coefficient SE Two-Tailed P-Value Coefficient SE Two-Tailed P-Value
Small class .069 .029 .019* .059 .041 .151
Including school fixed effects .069 .028 .011* .058 .037 .113
Grade 1:
Small class .033 .028 .236 .069 .029 .017*
Including school fixed effects .033 .024 .168 .061 .022 .006*
Grade 2:
Small class .025 .030 .397 .012 .030 .700
Including school fixed effects .035 .027 .186 .007 .025 .784
Grade 3:
Small class .011 .026 .662 .032 .025 .199
Including school fixed effects .006 .024 .799 .016 .024 .514
* p < .05
41
Table 2. Mean Differences in Classroom Variability between Small and Regular Classes for Mathematics and Reading:
Intention to Treat Analysis
Mathematics Reading
Kindergarten: Coefficient SE Two-Tailed P-Value Coefficient SE Two-Tailed P-Value
Small class .069 .029 .019* .059 .041 .151
Including school fixed effects .069 .028 .011* .058 .037 .113
Grade 1:
Small class .038 .028 .178 .067 .029 .024*
Including school fixed effects .037 .025 .136 .063 .022 .005*
Grade 2:
Small class .021 .031 .492 .001 .031 .973
Including school fixed effects .024 .028 .395 -.001 .026 .959
Grade 3:
Small class .011 .027 .687 .034 .026 .194
Including school fixed effects .003 .026 .905 .025 .025 .320
* p < .05

42
Table 3. Distribution of Actual Class Size among Types of Classes and Grades
Grade K Grade 1 Grade 2 Grade 3
Class Size Small Regular Regular/Aide Small Regular Regular/Aide Small Regular Regular/Aide Small Regular Regular/Aide
11 2
12 8 2 3 2
13 19 14 16 15
14 22 18 27 17
15 23 1 31 32 31
16 31 1 16 1 29 1 31 1
17 24 4 1 33 1 19 27
18 1 2 6 2 6 10 1
19 7 6 3 4 3 1 3 3 5 4
20 6 6 1 10 6 2 1 9 3
21 14 12 18 18 7 11 11 12
22 20 20 27 15 23 21 13 16
23 16 21 19 20 20 21 10 14
24 19 14 16 11 22 25 15 14

43
Table 3 Continued
Grade K Grade 1 Grade 2 Grade 3
Class Size Small Regular Regular/Aide Small Regular Regular/Aide Small Regular Regular/Aide Small Regular Regular/Aide
25 6 6 7 9 9 15 16 15
26 4 3 5 9 6 7 5 12
27 1 6 2 4 4 1 5 8
28 1 1 2 1 2 6
29 1 2 2 2 2 2
Total 127 99 99 124 114 99 133 100 107 140 89 107
Average 14.96 22.16 22.54 15.52 22.47 23.20 15.16 23.29 23.32 15.53 23.42 23.77

44
Table 4. Effects of Actual Class Size on Classroom Variability for Mathematics and Reading
Mathematics Reading
Kindergarten: Coefficient SE Two-Tailed P-Value Coefficient SE Two-Tailed P-Value
Small class -.009 .004 .017* -.008 .006 .160
Including school fixed effects -.009 .004 .010* -.008 .005 .125
Grade 1:
Small class -.004 .004 .274 -.009 .004 .021*
Including school fixed effects -.004 .003 .190 -.008 .003 .006*
Grade 2:
Small class -.003 .004 .404 -.001 .004 .708
Including school fixed effects -.004 .003 .193 -.0008 .003 .795
Grade 3:
Small class -.001 .003 .683 -.004 .003 .220
Including school fixed effects -.0007 .003 .817 -.002 .003 .555
* p < .05

45
Table 5. Achievement Differences between Small and Regular Classes at Various
Quantiles for Mathematics and Reading
Mathematics:
Grade: 10th Quantile 25th Quantile 50th Quantile 75th Quantile 90th Quantile
K .084 .105* .147* .178* .356*
1 .162* .209* .255* .302* .325*
2 .090 .112* .157* .236* .247*
3 .100* .126* .138* .151* .201*
Reading:
Grade:
K .063 .158* .189* .252* .221*
1 .145* .145* .236* .290* .299*
2 .152* .152* .152* .217* .261*
3 .078 .104* .207* .182* .207*
* p < .05

46
Table 6. T-tests Indicating Differences in Quantile Regression Estimates
Mathematics:
Grade: 10th Vs 90th Quantile25th Vs 75th Quantile 10th Vs 50th Quantile90th Vs 50th Quantile
K 2.854* 1.105 1.038 2.313*
1 1.934 2.151* 2.541* .913
2 2.169* 2.687* 1.159 1.332
3 1.465 .688 .639 1.161
Reading:
Grade:
K 1.468 2.243* 2.737* .368
1 2.651* 3.452* 1.801 1.355
2 1.742 1.264 .000 2.270*
3 1.835 1.465 2.638* .000
* p < .05