Do Population Control Policies Induce More Human Capital ... · Do Population Control Policies...
52
ECONOMIC GROWTH CENTER YALE UNIVERSITY P.O. Box 208629 New Haven, CT 06520-8269 http://www.econ.yale.edu/~egcenter/ CENTER DISCUSSION PAPER NO. 933 Do Population Control Policies Induce More Human Capital Investment? Twins, Birthweight, and China’s ‘One Child’ Policy Mark R. Rosenzweig Yale University and Junsen Zhang Chinese University of Hong Kong March 2006 Notes: Center Discussion Papers are preliminary materials circulated to stimulate discussions and critical comments. The research in this paper was supported in part by NIH grant RO1 HD046144. The survey used in the paper was supported by grant CUHK4358/01H from the Research Grants Council of the Hong Kong Special Administrative Region. We also wish to thank Junjian Yi and Linda Yung for excellent research assistance. This paper can be downloaded without charge from the Social Science Research Network electronic library at: http://ssrn.com/abstract=893056 An index to papers in the Economic Growth Center Discussion Paper Series is located at: http://www.econ.yale.edu/~egcenter/research.htm
Transcript of Do Population Control Policies Induce More Human Capital ... · Do Population Control Policies...

ECONOMIC GROWTH CENTER
YALE UNIVERSITY
P.O. Box 208629New Haven, CT 06520-8269
http://www.econ.yale.edu/~egcenter/
CENTER DISCUSSION PAPER NO. 933
Do Population Control Policies Induce MoreHuman Capital Investment?
Twins, Birthweight, and China’s ‘One Child’ Policy
Mark R. RosenzweigYale University
and
Junsen ZhangChinese University of Hong Kong
March 2006
Notes: Center Discussion Papers are preliminary materials circulated to stimulate discussionsand critical comments.
The research in this paper was supported in part by NIH grant RO1 HD046144. Thesurvey used in the paper was supported by grant CUHK4358/01H from the ResearchGrants Council of the Hong Kong Special Administrative Region. We also wish to thankJunjian Yi and Linda Yung for excellent research assistance.
This paper can be downloaded without charge from the Social Science Research Networkelectronic library at: http://ssrn.com/abstract=893056
An index to papers in the Economic Growth Center Discussion Paper Series is located at:http://www.econ.yale.edu/~egcenter/research.htm

Do Population Control Policies Induce More Human Capital Investment?Twins, Birthweight, and China’s ‘One Child’ Policy
Mark R. Rosenzweig and Junsen Zhang
Abstract
In this paper we use a new data set describing households with and without twin children in
China to quantify the trade-off between the quality and quantity of children using the incidence
of twins that for the first time takes into account effects associated with the lower birthweight
and closer-spacing of twins compared to singleton births. We show that examining the effects of
twinning by birth order, net of the effects stemming from the birthweight deficit of twins, can
provide upper and lower bounds on the trade-off between family size and average child quality.
Our estimates indicate that, at least in one area of China, an extra child at parity one or at parity
two, net of birthweight effects, significantly decreases the schooling progress, the expected
college enrollment, grades in school and the assessed health of all children in the family. We also
show that estimates of the effects of twinning at higher parities on the outcomes of older children
in prior studies do not identify family size effects but are confounded by inter-child allocation
effects because of the birthweight deficit of twins. Despite the evident significant trade-off
between number of children and child quality in China, however, the findings suggest that the
contribution of the one-child policy in China to the development of its human capital was
modest.
JEL Codes: J13, I12, I21
Keywords: Family size, Birthweight, Schooling, China

1
Among the policy instruments employed in low-income countries to advance economic
development are programs designed to reduce the size of families. One motivation has been that
reductions in family size free up resources for investments in the human capital of the
population. Supporting this idea is the influential model of Becker and Lewis (1973), which
suggests that decreases in the quantity of children will induce more resources to be allocated to
each child so that average child quality will increase. The challenge for empirical research has
been to find sources of exogenous variation in family size to quantify the trade-off between
family size and child quality implied by the Becker-Lewis quantity-quality (Q-Q) model in order
to assess the efficacy of these programs for human development.
Recently a number of studies (Caceres (2004), Black et al. (2005a), Angrist et al. (2005),
Qian (2006)) have used twinning to assess the impact of an exogenous increase in the number of
children on measure of child quality. The methodology employed, based on the first uses of
twins to assess responses to exogenous increases in fertility (Rosenzweig and Wolpin (1980a,
1980b)), is to estimate the effect of an extra birth at parity N on the quality of children at parities
N - i, i=birth order, for all women who had at least N births. In particular, the incidence of twins
at N is used as an instrument to predict the total of number of children born in a two-stage
procedure. In all these studies measures of schooling of the parity N-i children, however, are not
significantly affected or only marginally affected by whether or not those children have
additional younger siblings due to twinning. The authors conclude that there is therefore little or
no support for the quantity-quality trade-off implied by the Q-Q model.
These twin-based studies do not, however, examine the impact of total family size on
children of parity N (or higher); i.e., the impact on the quality of the twins themselves is ignored.

2
It is possible that the quality of the twins is lower than singleton births at N, and that the decline
in the quality for the parity N births is significant. If so, the basic prediction of the Q-Q model
that increases in total number of children reduces average quality would not be rejected.
However, the finding that the quality of the N - i children is unaffected clearly is not consistent
with one basic assumption of the Q-Q model, that quality is the same for all children.
Although there is no explicit discussion of why the impact of the twins themselves is
excluded from consideration, except by Caceres, presumably it is because twins are not
comparable to singleton births. And, indeed, twins are different from singleton births in a very
important way - the weight at birth of twins is substantially lower than that of singleton births.
Figures 1 and 2 depict the distribution of birthweights from the US white population for twins
and non-twins, based on the Minnesota Twins Registry (Behrman and Rosenzweig (2004) and
the US National Longitudinal Survey 1979, and the birthweight distributions for twins and non-
twins born in China based on the survey data we use in this paper, described below. In both
countries, the average birthweight of a singleton birth is almost 30 percent higher than that of a
twin, approximately a 1.5 pound difference at birth.
Recently, studies exploiting difference in birthweight between twins have shown that
birthweight has significant effects on not only survival but on schooling attainment, earnings and
other adult outcomes (Behrman and Rosenzweig (2004), Almond et al. (2005), Black et al.
(2005b)). The birthweight deficit of twins therefore is likely to result in twins being significantly
lower quality on average than non-twins, net of family size effects.
A key issue for assessing the evidence from twins studies examining the effect of
twinning on non-twins is thus whether, and how, the birthweight deficit of twins affects

1Angrist et al. and Conley and Glauber use the gender composition of first and second-order births (gender sameness) as an instrument for fertility. Studies have shown that children’sgender composition affects whether the parents of the children live together (Ananat and
3
investments in non-twins within the family. A number of models in the literature suggest that
parents will allocate resources differentially across their children based on difference in birth
endowments that affect the returns to resource investments (Becker and Tomes (1976),
Hanushek (1992), Behrman et al. (1982)). If the endowments of twins are lower than those of
singleton births, then twinning not only may lower average resources per child due to increases
in family size, but it also may re-allocate resources differentially across children of different
birth order. How parents respond to the differences in endowments between twins and non-twins
within the family thus will affect inferences about the effects of twinning on non-twins. In short,
if parents allocate resources within the family according to birth endowments, then the ceteris
paribus effect of family size is not identified using twins unless the relationship between
twinning and child endowments is taken into account.
The use of twinning as an instrument requires that all variables correlated with the
incidence of twin be taken into account. Rosenzweig and Wolpin (1980a), Caceres (2004), Black
et al. (2005a) and Angrist et al. (2005) control for the mother’s age at birth at parity N because
maternal age affects twinning and may be correlated as well with the outcome variables.
However, none of the researchers using twinning to identify family size effects have taken into
account or mentioned the birthweight deficit of twins. Caceres (2004) and other researchers who
use alternative methods for identifying the causal impact of family size on child quality (e.g.,
Conley and Glauber (2005) and Qian (2006)), mention that spacing may have an independent
effect on quality and thus that use of twins may be invalid.1 However, unlike for birthweight, no

Michael (2004), Dahl and Moretti (2004)), which may have an independent effect on children’shuman capital. Conley thus restricts his sample to intact couples, but does not deal with theconsequent choice-based sampling problem. In the data we use in which parities only exceed twoif there are twins, we cannot use this variable as an instrument. We do show, however, thatgender sameness affects the allocation of resources to children net of family size effects.
2China began its one-child-per-family policy in 1979. Under this policy, each householdis allowed to have only one child, although rural population are typically allowed to have asecond child (but no more) in recognition of the reality in rural areas of the need for male labor(McElroy and Yang (2000)).
4
evidence is adduced that spacing has significant effects, net of family size, on child quality. And
no researchers have gone on to show how the differential spacing of twins may affect
investments to non-twin children and thus inferences about the Q-Q trade-off.
In this paper, we use unique new survey data on families with twins and with singleton
births aged 7 through 18 in China to estimate the trade-off between family size and child quality
based on a framework incorporating elements of the Q-Q model but allowing for heterogeneity
in child endowments, birth spacing, and parents inter-child resource allocations. The survey data
provide a number of advantages over the data sets that have been used to study the impact of
family size on child quality. First, because of China’s “one child” policy2, which is strictly
enforced in the urban areas from which the survey data is from, twinning on the first birth results
in one exogenous extra birth. In many developed countries twinning at low parities has a
substantially smaller effect on total family size so that inferences about family size effects are
less precise for the general population (all those who have one or more births). Second, in rural
areas of the survey site, all families are permitted to have two children, so it is possible to
replicate the parity-N twins methodology, at N=2, to look at the impact of twinning on both the
twins and the non-twins within the family. Again, in this population, restrictions on family size
5
are strictly enforced so that twinning at the second birth results in one extra child on average.
Third, information on the birthweights of all children were obtained in the survey so that it is
possible to take into account the birthweight effect of twinning and to estimate biases resulting
from lack of control for birthweight. Fourth, information was elicited not only on schooling
attainment but on performance in school and on parental inputs to children, including child-
specific parental time and expenditures. The latter information can be used to directly estimate
how birthweight endowments influence the allocation of resources across children at different
birth orders. Fifth, information was also obtained on contemporaneous child anthropometrics and
assessed health status, permitting estimates of family size effects on nutrition and health.
In the first part of the paper, we set out the illustrative models to show how lack of
control for the lower endowments of twins biases inferences about the effects of increasing
family size on child quality for children of different birth order. In particular, it is shown that the
sign of the bias will differ by birth order and will depend on whether or not parents on net
reinforce or compensate for variation in endowments. We also show, however, that if parents
treat twins more equally than non-twins or if there are economies of scale associated with twins
in part because of the closer spacing of twins that researchers have mentioned, resource
allocations to twins and non-twins within the family may also differ even net of endowment
effects. The effects of twinning on twins and on non-twins, however, bounds the true effect of
the number of children on average child quality, with the effects on non-twins being the lower
bound.
In particular, in the case in which parents reinforce differences in endowments, as found
in Behrman et al. (1994) and as we find in our data, we show that the effects of twinning at

6
parity N not accounting for endowments on singleton siblings will be a positive biased estimate
of the lower-bound estimate of the effects of increasing N on average Q. For the same reasons,
however, estimates of twinning at parity N on the twins themselves will be a biased negative
estimate of the upper bound effect. Controlling for endowments (birthweight), estimates of
twinning at parity-N on the twins and on the older siblings provides, respectively, lower and
upper bounds of the average Q-Q tradeoff, if spacing effects are important. The absence of a
negative effect of twinning at the Nth birth on the quality of the parity-N-i children found in
recent studies thus can be explained by our model. Because the lower birthweight of the twins is
not controlled for and because parents treat twins more equally than non-twins, a re-allocation of
resources from twins to the N-i children may completely offset the negative effect of quantity on
average child quality.
In the second part of the paper we describe the survey and show that twinning is indeed
orthogonal to parental characteristics in our sample but that birthweight, in both the urban and
rural populations, is substantially lower for twins. We also show that child gender on the first
birth does not affect the probability of having a second birth in either population, and that control
over family size is strictly enforced in both urban and rural areas (at different parity). In part
three, we use the data to show empirically, using information on educational expenditures per
child, that parents allocate more resources to children with higher birthweight, so that estimates
of family size effects on non-twins induced by twinning without control for birthweight will
indeed be too small.
In part four, we estimate the effects of twinning at the first birth in the urban population
on schooling progress, expected schooling attainment and school grades. We show, consistent

7
with parental reinforcement, that the negative effects of adding one birth due to twinning on
these child quality outcomes are significantly biased negatively when birthweight is not taken
into account. Controlling for birthweight, the estimates still show that the extra child reduces all
four measures of child quality. The point estimates from adding one child are similar in
magnitude to those obtained from high-quality studies assessing the impact of major schooling
interventions and health intervention. We also find that children in two-child versus children in
one-child families, net of birthweight, have lower (subjectively assessed) health, but not lower
BMI, height or weight.
In the fifth section, we estimate the effects of twinning at parity two in the rural
population on both parity-one and parity-two births. Again, the patterns of birthweight
coefficients and the change in the parity-specific coefficients associated with twinning on the
outcome measures when birthweight is included in the specification are consistent with
endowment reinforcement, so that the parity-one effects are too positive when birthweight is not
controlled for. The positive biases for first-born family size effects resulting from not taking into
account the birthweight deficit of twins are as high as 60 percent. The estimates controlling for
birthweight, however, again are consistent with a quality-quantity trade-off, in this case whether
looking at first births or second births, with the difference in birth-order effects controlling for
birthweight being quiet small. School progress, expected schooling attainment, math grades,
literature grades, and assessed health are significantly lower for both parity-one and parity two
children in the families with twins on the second birth net of birthweight differences between
twins and non-twins.
In section six we use the twins data to explore economies of scale issues. There are three

3Qian (2006) seeks to directly identify the effect of the one-child policy on child quality,in addition to employing the parity-N twins methodology, by examining how a relaxation of theone-child policy for households with a girl on the first birth affected the school enrollment of thefirst-born girls relative to households with one boy. Although she finds a marginally negativeeffect on first-borns’ schooling using the twins method, the relaxation “effect” on schoolenrollment of first-borns is positive. She attempts to reconcile these results by conjecturing thatthe twins estimate overstates the negative effect. Our results show that in fact the twins results,because they do not take into account the lower endowments of twins and parentalreinforcement, understate the negative effect of increased family size. Our results for parity-onetwinning also show that (twin) children in two-child families are significantly worse off thansingle children, net of the birthweight deficit.
8
- does increasing family size increase public goods expenditures? Are there economies of scale
unique to twins? And are there economies of scale associated with children being the same sex?
We find evidence answering all three affirmatively. In particular, households with twins are
more likely to have an internet connection, total minutes spent by parents helping each child with
their homework is higher for twins than non twins, and sharing a room is substantially more
likely and clothes expenditures higher per child when twins are same sex. The latter two results
call into question using sex composition as an instrument for fertility, unless clothing and
privacy are separable from schooling in the utility function of parents.
In the final section, we use our estimates to assess the effects of China’s one-child policy
on the human capital of children. Investigators have used spatial and temporal variation in the
administration of the policy to assess the effects of the one-child policy on fertility. It is unlikely
that such variation is orthogonal to the demand for children, and indeed in our data the fact that
rural households are allowed two children and urban households one child clearly reflects
governmental policy that is responsive to the differential demand for children (family labor)
across sub-populations. Existing studies of the fertility effects in China derived from varying
treatments thus are likely to overstate the effects of the policy.3 These estimates of the fertility

9
effects, however, are small, suggesting, combined with the range of effects we have estimated of
how reduced family size increases children’s human capital, that the effects of China’s one-child
policy on resource investments in children in China have not played a major role in China’s
economic development, despite the evident trade-off between quantity and quality.
1. The Identification of the Quantity Effect on Child Quality Using Twins
Studies using twins to identify the effects of family size on child quality usually examine
the effects of having twins on the quality of non-twins. This is done in part because of the
recognition that twin births are distinct from singleton births. Estimates comparing families with
and without twins might therefore, if twins are included in the comparison, only identify
differences between twin and singleton births. However, all of these studies ignore decisions
about resource allocations across children within the family, which has been shown to depend on
the inherent or endowed characteristics of children. That twin births do differ from singleton
births therefore can affect inferences about the effects of changes in the quantity of children of
given endowments on child quality if the effects are obtained for children of any order. In
particular, the effect of having a twin at pregnancy order i on a child of order j will reflect both
the effect of having an extra birth and any shift in resources to or from the twins in response to
the different endowments of the twins.
To fix ideas, consider first the simplest model of child quality in which a family with one
child with an endowment e1 and a fixed budget constraint seeks to maximize average child
quality Q and has n births at the second pregnancy, where
(1) Q = (nh2' + h1)/(1 + n).
The quality h1 of the order-one child is determined by the amount of resources Z1 allocated to the

10
child and by its endowment according to the production function
(2) h1 = h(Z1, e1),
for which hZ1>0, he1>0, and hZ1e1>0.
For simplicity we assume that the children produced from the second pregnancy are
identical to each other but not necessarily to the first child. Each of the second-order children has
an endowment e2 and their average quality h2' is produced according to the production function
(3) h2' = h(Z2', e2), hZ2'>0, he2>0, and hZ2e2'>0,
where Z2' is the per-child resources allocated to each of the second-pregnancy children. The
budget constraint is given by
(4) nαZ2'p2 + Z1p1 = Y,
where Y=total income allocated to children, perhaps from a two-stage budgeting process, and the
pi are the prices of the Z-goods allocated to the children of order i. Equation (4) is the standard
interactive Q-Q budget constraint for the second births - with children of order 2 treated equally
- except that the parameter α allows for economies of scale in the production of quality for the
second-birth (twin) children. Twins differ from singleton births for three reasons: they have
lower endowments, they are likely to be treated more equally because of their closer spacing
than children born at different times, and there may be additional economies of scale in rearing
them - e.g., parental reading to children. If α<1, there are scale economies, with Z2' being a pure
public good for α=0. Initially we will assume that α=1 so that twins only differ from singletons
in endowments and in being treated with equality.
Maximization of average quality entails allocating resources across the children such that
marginal returns are equal across birth orders.

4dZ1/de2 = hZ2e2/[n-1hZ2Z2 + hZ1Z1]>0, dZ2/de2 = -hZ2e2/[hZ2Z2 + nhZ1Z1]<0 because hZ2e2>0,hZ1Z1<0 and hZ2Z2<0.
11
(5) hZ1p2 = hZ2'p1
Because of the fixity of the budget constraint, whatever the allocation of resources across
children, the elasticity of average Z per child with respect to n is -n/(1 + n). If the production
functions are the same across children, endowments are equal and the prices of the Z goods also
do not differ across births (p1=p2 =p) then all children receive equal resources, whether they are
twins or not, and the elasticity of the amount of Zi goods with respect to the number of children n
born at order two is -n/(1 + n) for children at any birth order i. Looking at the effect of increasing
the number of children at order n on the allocation of resources to either order-two or order-one
children provides the same elasticity.
However, if twins have lower endowments than singleton first births, the elasticity of Zi
allocated to each child i with respect to an increase in the number of children at order two, ηZin, is
not equal to -n/(1 + n) and differs by birth order. In particular, if the endowments of the order-
two children depend on the number of children due to twinning then
(6) ηZin = ηe2nεZie2 - n/(1 + n),
where ηe2n=the elasticity of increasing n with respect to the endowment of the second child and
εZie2=the elasticity of resources allocated to child of order i with respect to a change in the
endowment of order-two children.
If n increases because of twinning, the elasticity of the order-two child endowment with
respect to n, ηe2n, is negative. And, it can be shown that in this model εZie2<0 for i=1 and εZie2>0
for i=2 - parents will allocate more of the fixed resources to children with higher endowments.4
12
Thus, the relationship between the number of second-order children (as determined by twinning)
and the quality of or resources devoted to the first child will underestimate the negative effect of
increasing family size by n on average child quality. And the stronger the fall in endowments
associated with twins and the larger the effect of endowments on the returns to child investments
the larger will be the upward bias. Of course, for the same reason, the relationship between the
number of second-birth children and the resources allocated to them will overstate the effect of
family size on average child quality.
These “biases” by birth order, given by the first term in (6), arise not just due to that fact
that twins have lower endowments but because the optimizing family will re-allocate resources
away from the lower-endowment children to the higher-endowment child. If these re-allocations
are sufficiently strong, it is possible that in families with twins on the second birth, the quality of
the first child will be no less than that of first-born children in families with only a singleton
second birth, as found in recent studies using twins. As can be seen, however, this difference
does not represent the trade-off between average child quality and the number of children.
In the simple quality maximization model, investments in children always reinforce
endowment differentials. If parents seek to balance resources across children, however, the
biases due to inter-child resource allocations cannot be known a priori. However, in that case
even if endowments (and prices) are the same across all children, the relationship between the
number of second-birth children and the resources allocated to the first or second children will
always differ, and the effect on resources allocated to the first-born will understate the effect of a
change in family size on average per-child resources if parents treat twins more equally. To see
this, assume that the same family maximizes the utility function

13
(7) V=V(h2', h1),
where, again it is assumed that the children of order two are identical and parents only care about
their average quality h2'. Parents care about the human capital distribution across children by
birth order, however, and will distribute resources across the children of different birth order
according to their preferences for equality and according to the differential returns to child
resources. For simplicity, assume that the production functions for child quality are given by
(8) hi = h(Ziei).
Maximization of (7), subject to (4) and (8), yields the first-order condition
(9) Vh2hZ2'p1e2/nα = Vh1hZ1p2e1.
Parents will seek in this model to equate the marginal returns from each birth order. From (9) it
can be seen that as the number of second-order children n increases per-child resources allocated
to the order-two children are more heavily “discounted” in utility terms, leading to the
reallocation of resources to the first child, with the discounting being smaller the greater the
degree of scale economies; that is, as α approaches 0. This is because in the absence of complete
twins scale economies, allocating the same resources to the order-one child has a higher return
than allocating the same resources to the order-two children, as those resources are divided
among the n births.
In this model, the response of investments in children to a change in the number of order-
two births via twinning differs by birth order for two reasons: the (more) equal treatment of
twins and their lower endowments. More formally, conditional on endowments, the effect of an
increase in the number of second-order children n on the resources allocated to the first child Z1
in elasticity form is

14
(10) ηZ1n|e = -α[εZ1YΦ + ηZ1p1c],
where ηZ1p1c is the compensated own price elasticity for the resources allocated to the first child,
εZ1Y is the income elasticity, and Φ = nαZ2'p2/Y. The first term is negative, and reflects the loss in
available per-child resources as the number of children increases as long as economies of scale
are not complete. The second term, however, is positive. It is a price effect that arises because an
increase in the number of second-parity children makes it more expensive relative to the first
child to increase their average resources, again as long as Z does not become a pure public good.
Thus the family re-allocates resources to the first child. The rise in costs per child due to an
increase in the number of children, along with the assumption that (order-two) children will
receive the same resources, are the essential features of the original Q-Q model. The equal-
treatment assumption is plausible for twins, but it is not necessarily realistic for children of
different birth orders. If so, the effect of twinning at the second birth on resources allocated to
the first birth will understate the reduction in resources to children on average due to the
resource constraint alone.
In contrast to the ambiguous effect of a rise in second-parity n on the allocation of
resources to the first child, for the second children the negative resource-constraint effect is
reinforced by the reallocation effect - parents move resources Z2 away from the (twin) children
both because there are less resources available per child and because increasing their average
quality is more expensive, net of any endowment differences:
(11) ηZ2n|e = α[-εZ2YΦ + ηZ2p2c].
The reduction in resources allocated to the parity-two children due to twinning at parity two will
thus overstate the effect due to the resource constraint alone.

15
The effect of twinning at parity two on order-one and order-two births inclusive of the
effects due to the lower endowments of twins depends on whether parents reinforce or
compensate for endowment differences across children. It can be shown that the elasticity of
resources provided to the first child with respect to a change in the endowment of the second
child can be written as
(12) εZ1e2 = ηZ1p1c + εZ1YΦ.
The first term in (12) is negative and the second is positive, so the resource allocation effect
arising from a change in the endowment of the second-order children on the resources allocated
to the first child can be either positive or negative, unlike in the first model in which parents did
not care about distribution.
The total effect of twinning in the second pregnancy on the resources allocated to the first
child inclusive of (i) the more equal treatment of twins due to their closer spacing compared with
singletons and (ii) allocation effects due to the lower endowments of twins is thus
(13) ηZ1n =[ηne2 - α]{εZ1YΦ + ηZ1p1c}
Expression (13) indicates that if parents on net reinforce endowment differences (εZ1e2<0 in (12)),
then the following is implied by the model:
1. If the lower endowments of twins are not taken into account, the absolute value of the
difference in the effect of twinning on the second pregnancy on order-two and order-one children
will be greater than if the endowment differences are taken into account. That is, the
understatement of the effect of increasing the quantity of children on average child quality from
examining the effect of twinning in the second pregnancy on the quality of the first child will be
greater than that obtained conditional on endowments ((10) versus (13)). Given reinforcement

16
and a utility function in which parents care about children of different birth order, therefore not
taking into account the endowment deficit of twins could lead to the quality of first-borns being
no less in families with twins at the second pregnancy compared with families with two singleton
births;
2. The effect of twinning on the second pregnancy on the outcomes of second-(first-)
birth children provides an upper (lower) bound on the average negative effect on child outcomes
of increasing family size, net of endowment differences, if parents treat twins with equality ((10)
versus (11)).
If parents, however, attempt to compensate for endowment differences, the effect of
second-birth twinning on either the outcomes of first-birth or second-order children can be either
an over or under-estimate of the average effect of increasing child quantity on child quality.
Indeed, expression (13) shows that if there are strong economies of scale in child-rearing for
twins (α60), the relationship between twinning on the second birth and the resources allocated to
the first child will only reflect the inter-child allocation effect, which can be of any sign, rather
than the quantity effect on quality. To identify the effect of anti-natalist policies on the quality
(outcomes) of children using twins therefore requires information not just on child outcomes but
on endowments at birth as well as information on the inputs allocated to children.
2. The Data
The data that we use for this study are derived from the Chinese Child Twins Survey
(CCTS), the first large-scale survey based on a sample of child twins of which we are aware. The
survey was designed and overseen by the authors and carried out by the Urban Survey Unit
(USU) of the National Bureau of Statistics (NBS) in late 2002 and early 2003 in the Kunming

17
district of China. Kunming is the capital of Yunnan province, located in the far southwestern
corner of China, and is one of China's relatively undeveloped provinces. Kunming has a total
population of about 5 million with about 34 percent of the population residing in officially-
designated urban areas. The CCTS includes a probability sample of households with twins aged
between 7 and 18 and a probability sample of households with non-twins in the same age range.
Based on existing child questionnaires in the United States and elsewhere, the survey covered a
wide range of information on children’s education, including inputs of parental time and money
and outcomes such as grades and schooling attainment and measures of child health, including
information on each child’s weight at birth and current weight and height. Respondent parents
and children were separately interviewed and interviewers were instructed to separate children in
different rooms, and from each other, when answering the child part of the questionnaire.
Households with child twins aged between 7 and 18 were designated as the eligible
population. These were initially identified by USU according to whether children had the same
birth year and month in the age interval and the same relation with the household head using data
from the 2000 population census for Kunming. The addresses of the eligible households were
obtained from the census office and actual child twins were then determined by household visits.
For the purposes of comparison, households with non-twin children in the same age group were
also surveyed. For every child twin household identified, the fourth household on the right hand
side of the same block was chosen to locate a non-twin child household. (If the fourth household
was not an eligible household, interviewers would continue to go to the fifth, sixth etc.). From
the population census, 2300 pairs of potential twins were identified, with1694 households (3462

5The gap is due to the fact that in some households the pairs of children were not actuallytwins, some households had provided incorrect information on child age in the census, and somehouseholds had moved between the census date (2000) and the survey date (2002) as well asrefusal and inability to locate households because of unclear addresses in mountain areas.
6Families with twins on the second birth are excluded.
18
children) with twins interviewed successfully.5 Of these, 1300 households had twins on the first
birth and 394 households (those exempted from the one-child-per-family policy) had twins on
the second birth.1693 households (1892 children) with no twins provided information in the
survey.
The specifics of the one-child-per-family policy and its enforcement vary from one place
to another in China. In Kunming, the one-child policy is strictly enforced in the urban area. Rural
households, however, are encouraged to have one child but are exempted from the strict one-
child policy (Family Planning Commission of Yunnan Province, 2003). In China, a rural-urban
divide for any area is made by the administration, and there is little a household can do to take
advantage of the policy difference across the boundary. Table 1 shows the distribution of family
size for mothers aged 35 and over in the Kunming population, based on the CCTS data, for four
groups: urban, non-exempt households with and without twins on the first birth and rural,
exempt households with and without twins on the first birth.6 As can be seen, less than six
percent of the non-exempt households without a twin had more than one child, while virtually all
households in the non-exempt population with a twin on the first birth had only two total
children. In contrast, in the exempt areas over 40 percent of households without twins had more
than one child, although only 8 percent of households with a twin on the first birth, and no
subsequent twins, had three children.

7Given that there are no additional valid instruments for fertility and that the coefficientof twinning is one in the fertility equation for the non-exempt population, there is no informationgained by using twinning on the first birth as an instrument. Similarly, twinning on the secondbirth for the exempt population of families with two or more births has a coefficient virtuallyidentical to one in the fertility regression (not shown).
8We will see below that gender composition may not be a valid instrument for fertility,even if the gender of first-born children is not exogenous, as in many areas of China (Qian(2006).
19
Because of strict enforcement, twinning on the first birth, but not child gender, is a
powerful predictor of total family size in the urban, non-exempt population. An OLS regression
of total children on twinning on the first birth for that population results in a coefficient that is
almost one on a dummy variable indicating first-birth twinning, as seen in column one of Table
2. For exempt households, the same regression yields a coefficient of .66 (column two of Table
2). In contrast, for both non-exempt households and exempt households with no twins on the first
birth (columns one and four), the first child being a girl does not predict total fertility.7 Only
exempt households with twins on the first birth who are both girls appear to have additional
children (column three), but on average less than a tenth of a child more.8
Use of twinning to assess the effects of exogenous changes in fertility on child
investments and outcomes requires that parity-specific twinning be randomly distributed in the
population (net of mother’s age at birth). Table 3 provides descriptive statistics on the parents
and children in the survey data for same four groups as used in Table 1 based on exempt status
and twinning on the first birth. If twinning is random, the characteristics of the parents with and
without twins on the first birth (but not necessarily the children) should be the same within each
exemption category. This is confirmed in Table 3 - t-tests applied to the means of the mother’s
and father’s schooling attainment and mother’s age at the time of the survey, displayed in the

9The statistics for the non-exempt population are 0.72, 0.71 and 1.86 for mother’sschooling, father’s schooling and mother’s age, respectively and 2.95 for mother’s age at firstbirth.
10The statistics are 18.4, 17.1 and 3.70 for mother’s schooling, father’s schooling andmother’s age, respectively and 4.42 for mother’s age at first birth.
11Indeed, the less stringent fertility limitation for the “exempt” rural population isexplicitly because of the higher demand for family labor and thus children.
12As seen in Figures 1 and 2 the average difference in birthweights across singleton andtwins births is similar to that found by Behrman and Rosenzweig (2004) based on informationobtained from the US Minnesota Twins Survey and the National Longitudinal Survey of Youth.
20
bottom panel of Table 3, indicate non-rejection of the hypothesis of equality within each
exemption category across parents with and without twins on the first birth. However, as
expected, mother’s age at first birth is statistically significantly different for twins and non-twins
households.9 On the other hand the policy rules evidently differ non-randomly across
households. The same tests indicate that among the families without twins on the first birth,
parents in the exempt and non-exempt populations have statistically significant different
schooling levels and ages.10 Differences in policy rules thus cannot be used to assess the impact
of fertility limitations, and comparisons based on twinning must be made within each exemption
category.11
3. Birthweight and Family Resource Allocations
The differences across children in post-birth outcomes in the top panel of Table 3 reflect
both the impact of twinning on child outcomes within groups and differences in parental
characteristics across groups. Clearly, however, twinning does not merely have an effect on child
outcomes by altering total fertility. Within either exemption group children who are not twins
weighed almost 30 percent more at birth than did twins.12 Given that twins parents and non-twins

21
parents are essentially identical, these differences in weight at birth reflect differences in nutrient
intake in the womb, which have been shown to have important effects on outcomes independent
of fertility effects (Behrman and Rosenzweig, 2004; Black et al. 2005b). Studies exploiting
differences in birthweights within identical twin pairs identify the effects of nutrient intakes in
the womb on outcomes. They do not, however, indicate how birthweight effects are mediated, if
at all, by parental resource allocation behavior, which as shown in section 1 can influence the
direction of differences in twins effects on outcomes between twins and non-twins within the
family and can determine whether twinning effects on child outcomes are useful for identifying
the effects of reducing family size on child quality.
To estimate directly whether and how parents allocate resources to children differing in
birthweight, we need an input measure that is not a pure public good. The CCTS provides
information on parental educational expenditures for each child. The measure includes expenses
for tuition, fees for tutors, books and special classes. We estimate the following equation:
(14) Zij = βeij + γekj + µj + ζij,
where Zij=educational input for child i in family j, eij=child i’s birthweight, ekj= child k’s
birthweight, β=own endowment effect, γ=cross endowment effect (=0 if only one child),
µj=unobserved family effect, ζij=unobserved (to parents) child specific endowment. If parents
reinforce endowment differences, then β>0 and γ<0; compensation implies β<0 and γ>0.
A major problem in identifying the effects of birthweight on parental behavior is that
birthweight itself reflect prenatal inputs. Thus, for example, parents who prefer child quality may
both have higher birthweight children and provide more post-birth resources to children, leading
to a spurious positive relationship between weight at birth and post-birth outcomes. Thus, in (14)

13Genetic endowment differences between twins may be correlated with their differencesin birthweight. In that case the coefficient on birthweight from the between-twins estimatorcannot be interpreted as the effect purely of nutritional intake. It can be interpreted, however, asthe effect of endowments, inclusive of genetics and womb intakes, on subsequent parentalinvestments.
22
µj may be correlated with the eij and ekj, so that least squares estimates of the β and γ parameters
will be biased. One way to eliminate this source of bias is to sweep out the family fixed effect
and estimate (14) based on cross-sibling differences. Differencing across i and k yields in j yields
(15) ∆Zij = (β - γ)∆eij + ∆ζij,
where ∆ is the cross-sib difference operator. The within-family estimator identifies only the
difference between the own and cross effect β - γ, which is, however, unambiguously positive for
reinforcement and negative if there is compensation. Differences in the ζij may reflect parental
child-specific pre-natal investments in children which may have a serially-correlated component.
For example, children born early in the parents’ life-cycle may have less resources than children
born later, which may affect differences in resource allocations at every stage of each child’s life
cycle. The within-family estimator may thus not yield consistent estimates of birthweight effects
on child input allocations. However, differencing across twins eliminates this source of
correlation between child-specific birthweights and ζij. Differences in birthweight between twins
cannot be due to decisions made by parents.13
Table 4 reports least-squares, within-family and with-twin-pair estimates of the
relationship between birthweight and schooling expenditures for children aged 7-14. The age
range is truncated in order to minimize the proportion of school leavers in the sample. If 15
through 18-year olds were included, the expenditure input variable would be highly correlated
with schooling outcomes (school attainment, enrollment), as those not in school receive little

14The estimates are virtually identical with these children included.
15Recall that less than six percent of the households have two children.
16The between-sib estimator is consistent even if families with two singleton children aredifferent from families with one child in the exempt sample as long as such differences areimpounded in the family fixed effect µj.
23
tutoring and there is no tuition. Less than two percent of those children aged 7-14 are not in
school, and these children are excluded from the sample. The included children are thus all
school-goers.14 The first two columns of Table 4 report the estimate of β for first-birth singletons
in the non-exempt sample in which there are no second children.15 The estimate of the own
birthweight effect on schooling expenditures is positive and statistically significant, indicating
reinforcement. The second column reports estimates from a specification including parental
schooling characteristics; inclusion of these reduces the estimated β coefficient by 36%, but the
estimate is still statistically significant. In the third column, based on families with two singleton
children in the exempt sample, the within-family estimate of the difference between the own and
cross birthweight effect β - γ is also positive, again indicating reinforcement.16 And, the within-
twin-pair estimator of the same object, reported in the last column of Table 4, estimated for all
families with twins on the first birth (exempt and non-exempt), is also positive, although it is
about half of the between-sib estimate. The latter point estimate indicates that a difference of
about three-quarters of a kilogram in birthweight - the average difference in birthweight between
twins and singletons - is associated with a reinforcing shift in schooling expenditures of about 4
percent (the average expenditure is about 500 yuan).
4. Estimates of Child Quantity Effects Using First Birth Twins
In this section we present estimates of how an exogenous increase in the quantity of

24
children affects schooling and health outcomes by comparing children in households with first-
birth twins (total family size = 2) and non-twins (total family size = 1) in the non-exempt sample
of households. The equation we estimate is
(16) Hij = ηTj + δeij + λaij + εij,
where Tj=1 if the child is in a household with a first-birth twin pair, aij is the age of the mother at
child i’s birth, and εij is an error term subsuming all other determinants of the outcome Hij. As
shown in Rosenzweig and Wolpin (1980b), because twinning is correlated with the mother’s age,
and her age may be correlated with investments in children, it is necessary to control for
maternal age at birth. Net of the effects of mother’s age, Tj is uncorrelated with the error term.
Almost all studies using twins to estimate fertility effects have subsequently included maternal
age at birth. Similarly, however, because twinning reduces birthweight which affects resource
allocations, birthweight must be controlled for or Tj would be correlated with the error term
(containing eij). No studies using twins have controlled for the birthweight of the twins. The
findings in Table 4 that parents reinforce birthweight differences suggest that eij and εij are
positively correlated so that exclusion of birthweight from the specifications will result in a
negative bias in the coefficient on the twinning variable, as parental behavior reinforces the
tendency of low-birthweight children to also accumulate less post-birth human capital.
Table 5 presents the twins-first estimates for four educational outcomes. Because many
of the children have not completed their schooling, information was elicited from parents on the
expected schooling attainment of each of their children. Seven categories of schooling were
provided in the questionnaire, conforming to the major stages in the Chinese educational system.
From these data we constructed an indicator variable for whether the parents expected the child

17The categories are junior high, senior high, technical/vocational, junior college,university, post-graduate, doctoral degree. Ordered logit was used to estimate equation (16)using all seven categories. The results (available from the authors by request) were not differentqualitatively from those reported in Table 5 for the college category.
18The negative coefficients on birthweight Table 5 are consistent with reinforcement andby themselves reject the hypothesis that parents fully compensate for the lower endowments oftwins.
19The percentage effect is η(.791)(1-.791)/.791, where η is the logit coefficient.
25
to attend college.17 In this urban sample, 79 percent of parents expected their child to attend
college. The three other educational outcome measures used are the number of years of
completed schooling of the child as of the time of the survey (schooling progress), the child’s
most recent math grade and the child’s most recent literature grade. In all specifications the
child’s age and its square are included along with the mother’s age at birth. Two specifications
are presented, with and without inclusion of the child’s birthweight.
All of the estimates, except that for the literature grade, indicate that being in a family
with two twin children rather than one child reduces schooling expectations, schooling progress,
and school performance significantly for the children, whether or not birthweight is controlled
for. Moreover, in all cases, inclusion of birthweight as a control variable substantially reduces
the estimated effect of family size as indicated by twinning, by from 20 percent for the expected
college and literature grade coefficients to 15 percent for that for schooling progress, consistent
with the findings that parents reinforce endowments.18 The logit point estimates indicate that the
expected probability of a child attending college is 14 percent lower in families with two
children, net of birthweight differences, compared with families with one child.19 In terms of
schooling progress, the estimates from the specification including birthweight indicate that an
extra birth, net of birthweight differences, results in a reduction in years of schooling by .23

26
years, or 4.1 percent.
Our estimates of the impact of fertility reduction on schooling progress are comparable to
estimated schooling attainment effects associated with program interventions designed to
increase schooling attainment. In particular, we can compare our estimate of the effect of
reducing fertility from two children to one to estimates from three methodologically strong
studies, two of which examine the impact of direct and ambitious school intervention programs.
Duflo (2003) finds, using differences in differences based on Census data, that the INPRES
school building program in Indonesia in the mid 1970's, which doubled the number of schools
per district in five years, increased mean schooling attainment by .12 to .19 years. Schultz (2004)
finds, exploiting the randomized allocation of the Mexican Progresa program, that the provision
of subsidies to schooling equaling about 40 percent of adult wages increased schooling
attainment by .66 years (10 percent). Finally, Miguel and Kremer find, based on a randomized
intervention study, that provision of a de-worming pill increased the number of years of
schooling by .14 years per treated child, inclusive of externalities. The first two of these studies
did not examine school performance, but the Miguel-Kremer study could find no effect on test
scores from the treatment. Our point estimates of the effects of fertility-reduction on school
performance are also relatively small - a decrease in the math grade of 2.5 percent, and little
effect on the literature grade from doubling family size, given weight at birth.
We can also use the CCTS to look at child health outcomes. In common with other
surveys, the parents were asked to assess each child’s health status in four categories - excellent,
good, average, and bad. We constructed a variable indicating whether or not the child’s health
was assessed as excellent or good. In addition, the children’s weight and height were elicited,

27
from which we constructed each child’s body-mass index (BMI). Table 6 presents the twins-first
estimates of fertility on these health measures, again in specifications with and without the
inclusion of birthweight. As for schooling attainment, the point estimates for all health measures
are substantially reduced when birthweight is included. In this case, however, differences in
birthweight across twins and non-twins evidently account for all of the statistically significant
differences in the health assessment, height and BMI across children in families with one child
and with two twin children on the first birth. However, net of birthweight, children in the two-
child families weigh almost one kilogram less.
5. Estimates of Child Quantity Effects Using Second-Birth Twins
In this section we assess the effects of exogenously increasing the number of children at
parity two on child quality by examining the impact of twinning on the second birth among
households with two or more children in the exempt population. This sample, of 1709 children in
exempt households with and without twins on the second birth (and no twins on the first birth),
enables us to estimate the effects of having an additional child at the second birth, via twinning,
on both second-birth and first-birth children. As noted, the effects of second-birth twinning on
second-birth and first-birth outcomes provides upper and lower bounds, respectively, on the
average impact of exogenously increasing family size net of changes in endowments, given
parental reinforcement of child endowments and the relative costliness of increasing the average
quality of twins compared with singletons. To tighten these bounds requires that, in addition to
taking into account the relationship between maternal age at the second birth and twinning in the
second pregnancy, we control for the birthweight of second births. This is because of the
correlation between twinning and own birthweight. Thus we include the average birthweight for

28
second births when there are twins and the birthweight of the second-born child when the second
child is not a twin to take into account the effect of twinning on birthweight at parity two. Note
that although it is necessary to control for the birthweight of the second births, because twinning
on the second birth is neither affected by nor affects the birthweight of the first child born, in
contrast to maternal age at parity two and the birthweight of parity-two children, it is not
appropriate to include the (endogenous) birthweight of the first birth in the specification.
The equation we estimate is thus
(17) Hij = η0Tj + η1(Tj x Fij) + η2Fij + δ1e2j* + δ2(e2j*x Fij) + λaij + ζij,
where Tj=1 if the child is in a household with a second-birth twin pair, Fij=1 if child i is a
singleton first-born, e2j*=the (average) birthweight of the second-birth children (twins), and
aij=the mother’s age at the second birth. In (17), in addition to allowing for a direct birth order
effect on human capital outcomes η2, in accord with models in which parents allocate resources
across children according to their relative endowments the relationship between the birthweight
of the second birth and child quality H are also allowed to differ by birth order (one or two in
this case). Indeed, reinforcement implies that δ1>0 and δ2<0, so that omission of the birthweights
of the second-birth children would bias upward η1 (the difference in the twinning effect between
first-born and second-borns) and bias downward η0. However, estimation of (17) by least squares
does not yield consistent estimates of δ1, δ2, or λ.. Second-birth birthweight and maternal age are
only included in (17) so that consistent estimates are obtained of the parity-specific twinning
effects η0, for second-birth children, and η0 + η1, for first birth children, as in expressions (10)
and (11). Expressions (10) and (11) from the Q-Q model incorporating parental inter-child
resource allocations implies that η0<0 and η1>0, net of birthweight effects.

20The derivatives are based on the calculations -.372(1-.372).424 and -.791(1-.791).685for the rural and urban populations respectively.
29
Table 7 reports the estimates of equation (17) for the four schooling outcome measures.
As in the non-exempt sample of households, the estimates of twinning effects on the educational
outcomes of twins are all negative and statistically significant, and are biased negatively (except
for the completed schooling measure) when birthweight is not controlled for. The biases are
again large, ranging from 13 percent for the literature grade to 35 percent for the college
enrollment outcome. Comparing the own twin effects estimates in Table 5 and 7 that control for
birthweight, we find that the effect of adding a child on expected college attendance, net of
birthweight effects, are similar (-.11 and -.10).20 However, because only 37 percent of rural
parents expected their child on average to attend college (as opposed to 79 percent in the urban
population), twinning among the second-bears reduces the likelihood of college attendance by 27
percent. The coefficients on schooling progress and the math grade are also higher in absolute
value than those estimated from the non-exempt sample, by approximately 50%, and are double
that for the literature grade in the urban sample. There is no reason to expect these coefficients to
be the same across samples, as the parity of the births are different and the exempt population is
rural and the non-exempt population urban. Given that most populations in low-income countries
are rural and any changes in fertility are likely to operate at higher parities, the stronger negative
own twin effects in the rural sample are likely to be more relevant to other developing countries.
The estimates of twins effects on twins, however, as noted, are upper bound estimates of
quantity effects on average child quality. What of the estimates for the first births? For all
dependent variables, the estimate of η1 is positive, indicating that the effect of twinning on the

30
second pregnancy is less negative on first-birth than second-birth children, consistent with the Q-
Q framework and parental reinforcement. And, not accounting for the lower birthweight of
second-birth twins biases upward the first-child coefficient for all but the schooling progress
variable, leading to upward biased estimates of fertility effects for first-births, again consistent
with the framework and parental reinforcement. Indeed, the patterns of signs for the birthweight
coefficients are also consistent with reinforcement, as given by expression (12), except in the
schooling progress equation. The upward biases in the coefficients identifying the difference
between first- and second-birth effects of twinning for the expected college and grade outcomes
are substantial: 35, 18.5 and 60 percent, respectively, when the birthweight of the second-births
is not included in the specification.
For none of the outcomes is the fertility effect on the quality of the first births (η0 + η1)
non-negative when birthweight is taken into account. Moreover, the hypothesis, controlling for
birthweights, of equal effects of increasing the number of children (from two to three) on
schooling outcomes for second and first births cannot be rejected except, again, for the schooling
progress measure. Even for that outcome, however, the point estimate for the first child
indicates that an extra child at parity two decreases schooling progress by a statistically
significant .23 years for first children. Thus, the estimates indicate that an extra exogenous birth
at parity two reduces the average schooling progress of the children by from .23 (4.4 percent)
years to .65 years (13 percent). Interestingly, this range approximately spans the educational
attainment effects of the INPRES and Progresa schooling programs, as estimated by Duflo and
Schultz, respectively, and exceeds the schooling effect of de-worming. The preferred point
estimates for the expected college attendance outcome suggest that an added birth at parity two

31
reduces the likelihood of college attendance by 27 percent for all children, net of birthweight.
And finally, even if we use the statistically insignificant point estimates of the difference
between first and second-birth effects, the bounds on the estimates for the negative family size
effects on school grades are very tight - between -2.6 and -3.1 (-3.2 and 3.8 percent) and -1.9 and
-2.4 (-2.3 and -2.9 percent) for the math and literature grades, respectively.
The estimates in Table 8 indicate that the incidence of good or excellent health is also
significantly lower for both first- and second-order births in families with three rather than two
children. The point estimates for the assessed health measure indicate that, accounting for
birthweight differences, the effect of increasing family size from two to three children lowers the
probability of the children being in good or excellent health by from 5.2 to 11 percent. The
results with respect to anthropometrics, however, are different from those for schooling
measures. With and without controls for birthweight, we cannot reject the hypotheses that adding
a third birth does not reduce either the weight, height or body mass index of the first child. All of
the effects are on the second-order children. And these negative effects are not eliminated,
except perhaps for height, when accounting for birthweight differences across twin and singleton
births. Twins are almost three kilograms lighter for given age than singletons at parity two, but
first-bears are no lighter whether or not they have one or two younger siblings.
6. Public Goods, Twinning and Household Size
The elasticities of educational outcomes with respect to family size implied by our
estimates are modest, particularly in the urban sample - the urban sample estimates indicate that
doubling family size at most reduces the expected probability of attending college by 14 percent
and years of schooling by 4.1 percent, respectively, implying elasticities of .14 and .04. The rural

32
sample estimates, perhaps more relevant to developing countries in general, suggest, however,
that decreasing family size by 50% would increase the probability of college attendance by from
6 to 27 to percent and schooling progress by from 4.6 to 13 percent, implying elasticities of
educational outcomes with respect to family size of between 12 to 54 percent and 9 to 26
percent.
As suggested by the model, however, it is possible that using twins to estimate the effects
of decreasing family size on parental investments in children, even accounting for endowment
effects, may understate the negative impact of reducing family size on child quality because of
scale economies. Scale economies may exist from increasing the number of singleton births, but
they may be greater for twins because of their closer spacing. We can use the CCTS to look for
evidence of both general and twin-specific economies of scale in child inputs. The gender of
children may also be associated with scale economies. For example, children of the same gender
may be more likely to share clothing or a room compared with children of different genders. This
is important in part because gender composition has been used as an instrument for fertility,
which implies that gender composition net of family size effects has no effect on the allocation
of child goods.
We look at the effect of twinning on the first birth on four different child inputs using the
non-exempt household sample. We modify equation (15) by adding a variable for whether or not
the twins are the same gender. The first input we look at is per-child expenditures on clothing.
Parents were asked how much they spend on clothing for each child. Clothing is presumably
mostly a private good, but less so if children can at less cost share clothing, such as when they
are of the same gender. We assume that if parents purchase an article of clothing that is worn by

33
N children the expenditure on that item will be allocated to each child by more than 1/N. We
also look at the effect of number of children on an indicator of whether a child has his or her own
room, a clearly private good. Again we would expect that children of the same gender can share
a room at less cost than children of different genders. Thus, in both of these cases we would
expect that adding children reduces the amount or likelihood of the private good being allocated
to a child, with, however, such private goods becoming more public if children are of the same
gender.
We also consider two household public goods. The first of these would appear to be
especially ‘public’ for twins - time spent by parents providing homework assistance to each
child. Such activities as reading and providing instruction have strong economies of scale - the
marginal minute spent providing instruction has a higher payoff in terms of total child quality
when there are two children compared with one, especially for children of the exact same age if
not abilities. On the other hand, we would not expect the sex composition of children to
significantly affect the return to this good. In the CCTS the children report separately the amount
of minutes parents spend with them in this activity. Presumably the children do not fully
discount time spent by their parents with them if that time is shared with their sibling. Finally,
the second household public good we examine is whether the household is connected to the
internet. This is a classic public good that would have added benefits the larger is family size; the
role of gender composition is unclear, however.
Table 9 reports the estimates of the effects on the four goods of adding a child by
twinning on the first birth for the non-exempt households, controlling again for mother’s age at
birth, the child’s age and its square (not shown) and birthweight. In a second specification we

34
allow the effect of increasing family size to differ by whether or not the twins are of the same
gender. The estimates in the first column indicate that for child clothing, increasing the number
of children marginally decreases per-child expenditures. However, this effect is evidently diluted
because of scale economies associated with gender composition. When an indicator of whether
the twins are the same gender is added to the specification, in column two, the effect of adding a
second child almost doubles in absolute value, with, as expected twins of the same sex less
deprived of clothing goods. The point estimate suggests that twins of opposite gender receive 18
percent less clothing expenditures compared with children in one-child families, but the deficit in
clothing is reduced to 6.9 percent if the twins are of the same gender. Clearly gender
composition matters directly for this child good.
The estimates in columns three and four also show that the effect of increasing family
size on the probability of a child having his/her own room is also affected by gender
composition. The point estimates indicate that adding a child that is of different gender than the
first child reduces the probability that each child has his or her own room by 46 percent; the
estimates also suggest that the probability each child shares a room if the twins are of the same
gender is almost one. In contrast, the estimates indicate that time spent by parents assisting each
child with homework, columns four and five, actually increases with the addition of one child.
This is direct evidence that, at least for twins, the per-child cost of increasing the quality of
children actually decreases as the quantity of children increases for one important child quality
input because of scale economies. For this evidently partially public good, however, gender
composition does not seem to matter. The point estimates suggest that adding a twin sibling, net
of birthweight effects, increases the amount of parental homework assistance each child receives

35
by 18.3 percent. Finally, the estimates in the penultimate column indicate that households with
twins are also 61 percent more likely to have an internet connection compared with households
that only have one child. If we add the gender composition of the twins to the specification,
however, we cannot distinguish gender from quantity effects - the two variables are jointly
significant at the .043 level, but each coefficient is not precisely estimated. Both are positive.
7. Conclusion
In this paper we have used a new data set to quantify the trade-off between the quality
and quantity of children using the (random) incidence of twins that for the first time takes into
account effects associated with the lower birthweight and closer-spacing of twins compared to
singleton births. We show that examining the effects of twinning by birth order, net of the effects
stemming from the birthweight deficit of twins, can provide upper and lower bounds on the
trade-off between family size and average child quality. Our estimates indicate that, at least in
one area of China, an extra child at parity one or at parity two, net of birthweight effects,
significantly decreases the schooling progress, the expected college enrollment, grades in school
and the assessed health of all children in the family. And the quantitative effects on schooling are
at least as large as those found in methodologically sound studies assessing the impact of major
school and health interventions.
We have also shown, however, that prior estimates of the effects of twinning at higher
parities on the outcomes of older children do not identify family size effects but are confounded
by inter-child allocation effects because of the birthweight deficit of twins. In our data, because
parents evidently provide more human capital resources to children with higher endowments
(reinforcement), not taking into account the birthweight deficit results in upward biased

36
estimates of the trade-off between quantity and quality when such estimates are based on
outcomes for the older singleton siblings of the twins, as in the existing literature. The absence of
a negative effect of twinning at the Nth birth on the quality of the parity-N-i children found in a
number of recent studies thus can be explained by our model and empirical results. Because the
birthweight of the twins is not controlled for in those studies, the positive bias that arises due to
reinforcing behavior with respect to the higher birth weight of the N-i children may offset the
negative effect of quantity on quality, as we show in our data. Our findings and those in the prior
literature do, however, point to the importance of birth order effects, not taken into account in
the simplest form of the Q-Q model.
We also find evidence of significant scale economies, which are also not taken into
account in the simple Q-Q model. In particular we found that households with twins were
significantly more likely to have an internet connection. This suggests that as electronic public
goods such as televisions and computers become more prevalent, the quantity-quality trade-off
may become less strong. Economies of scale were also found with respect to gender sameness -
siblings of the same gender were significantly more likely to share a room and had more clothing
than siblings of different gender. These findings suggest that estimates identifying family size
effects using gender sameness as an instrument require restrictions on preference functions.
What do our estimates imply for the effects of China’s “one-child” policy on resource
investments in China? To answer this question requires, in addition to our estimates, estimates of
the effects of the policy on family size. Two studies have made use of the temporal and spatial
variation in the administration of the policy to identify fertility effects. McElroy and Yang
(2000) exploit the cross-sectional variation in the magnitude of fines for disobeying the policy.

37
Qian (2006) examines the impact on fertility of relaxing the restriction on family size in some
rural areas if they have a girl on the first birth. It is likely that estimates based on these policy
variations are biased upward; the variation in governmental administration of the policies is
likely to be responsive to differentials in the demand for children. The fact that in Kunming rural
households are allowed to have two children and urban households only one clearly suggests that
government policies take into account differentials in the demand for children (family labor).
The estimates from these studies of the impact of the policy on fertility are small,
however - McElroy and Yang estimate that removal of the policy would increase fertility by only
a third of a child. Qian finds that in families with girls, relaxation of the policy led to an average
increase in family size of only .25 children. If we take the higher estimate of .33 and our upper
bound estimates (but net of birthweight effects) of the effects of family size variation on
measures of child human capital, we can compute upper-bound estimates of the impact of the
one-child policy on human development in China. Table 10 reports these effects, which suggests
that the policy at most increased schooling attainment by 4 percent, the probability of attending
college by less than 9 percent, school grades by one percent, and the incidence of good or
excellent health by less than four percent. Overall, despite the evident significant trade-off
between number of children and child quality in China, these findings suggest that the
contribution of the one-child policy in China to the development of its human capital was modest
at best.

38
References
Almond, Douglas, Kenneth Chay, and David Lee, “The Costs of Low Birth Weight,”QuarterlyJournal of Economics, August 2005, 1031-1083.
Ananat, Elizabeth O. and Guy Michaels, “The Effect of Marital Breakup on the Income andPoverty of Children,” MIT Working Paper, 2004.
Angrist, Joshua D., Victor Lavy and Analia Schlosser, “New Evidence on the Causal LinkBetween the Quantity and Quality of Children,” July 2005.
Becker, Gary S. and H.G. Lewis, “On the Interaction Between the Quantity and Quality ofChildren,” Journal of Political Economy 81, 2, October 1973, pp. S279-S288.
Becker, Gary S. and Nigel Tomes, “Child Endowments and the Quantity and Quality ofChildren,” Journal of Political Economy 84,2, October 1976, pp. S143-S162.
Behrman, Jere R., Robert A. Pollak, and Paul Taubman, “Parental Preferences and Provision forProgeny,” Journal of Political Economy 90:1, February 1982, pp. 52-73.
Behrman, Jere R., Mark R. Rosenzweig and Paul Taubman, “Endowments and the Allocation ofSchooling in the Family and in the Marriage Market: The Twins Experiment," Journal ofPolitical Economy, December 1994
Behrman, Jere R. and Mark R. Rosenzweig, “Returns to Birthweight,”Review of Economics andStatistics, May 2004.
Black, Sandra E., Paul J. Devereux, and Kjell G. Salvanes, “The More the Merrier? The Effect ofFamily Size and Birth Order on Children's Education,” Quarterly Journal of Economics 120, May 2005, pp. 669-700.
Black, Sandra E., Paul J. Devereux, and Kjell G. Salvanes, “From the Cradle to the LaborMarket? The Effect of Birth Weight on Adult Outcomes,” 2005
Caceres, Julio, “Impact of Family Size on Investment in Child Quality: Multiple Births as aNatural Experiment,” University of Maryland, 2004.
Conley, Dalton and Rebecca Glauber, “Parental Educational Investment and Children'sAcademic Risk: Estimates of the Effects of Sibship Size and Birth Order from ExogenousVariation in Fertility,” New York University, 2005.
Dahl, Gordon B. and Enrico Moretti, “The Demand for Sons: Evidence from Divorce, Fertilityand Shotgun Marriage,” NBER Working Paper No. W10281, 2004.

39
Duflo, Esther, “Schooling and Labor Market Consequences of School Construction in Indonesia:Evidence from an Unusual Policy Experiment,” American Economic Review, Vol. 91, No. 4,September 2001, pp. 795-813
Family Planning Commission of Yunnan Province. Regulations on Population and FamilyPlanning in Yunnan Province. 2003.
Hanushek, Eric, “The Trade-off Between Child Quantity and Quality,” The Journal of PoliticalEconomy 100, February 1992, pp. 84-117.
McElroy, Marjorie and Dennis Tao Yang, “Carrots and Sticks: Fertility Effects of China’sPopulation Policies,” American Economic Review 90, 2, Papers and Proceedings, May 2000, pp.389-392.
Miguel, Edward and Michael Kremer, “Worms: Identifying Impacts on Education and Health inthe Presence of Treatment Externalities,” Econometrica 72(1), January 2004, pp. 159-217.
Qian, Nancy, “Quantity-Quality and the One Child Policy: The Positive Effect of Family Size onSchool Enrollment in China,” January 2006.
Rosenzweig, Mark R. and Kenneth I. Wolpin, “Testing the Quantity-Quality Model of Fertility:The Use of Twins as a Natural Experiment,” Econometrica, January 1980a.
Rosenzweig, Mark R. and Kenneth I. Wolpin, “Life-Cycle Labor Supply and Fertility: CausalInferences from Household Models,” Journal of Political Economy, June 1980b.
Schultz, T. Paul, “School Subsidies for the Poor: Evaluating the Mexican Progresa PovertyProgram,” Journal of Development Economics 74, 1, 2004, pp.199-250.

Figure 1. Distribution of Birthweight (Kilograms):Singleton Births in the NLSY and Twins in the Minesota Twins registry
Figure 2. Distribution of Birthweight (Kilograms):Singleton Births and Twins in Kunming, China
0
10
20
30
40
50
60
70
80
1-1.99 2-2.99 3-3.99 4+
TwinsSingletons
0
10
20
30
40
50
60
70
80
1-1.99 2-2.99 3-3.99 4+
TwinsSingletons

Table 1Distribution of Fertility for Women Aged 35+, by Exemption Status and Twinning
Non-exempt, no first-birthtwins
Non-exempt, first-birthtwins
Exempt, no first-birthtwins
Exempt, first-birthtwins
One child 94.4% 0 59.0 0
Two children 5.6 99.1 40.3 92.2
Three children 0 0.9 0.7 7.8

Table 2OLS Determinants of Children Ever Born by Exemption Status
Sample Non-exempt ExemptExempt, only
first-birth twinsExempt, no
first-birth twins
First-birth twins .961(93.5)
.662(31.1)
- -
Both twins girls - - .0689(2.54)
-
Both twins boys - - .0134(0.14)
-
Identical pair - - -.0229(0.96)
-
First-birth girl -.0034(0.33)
.0291(1.40)
- .0228(0.71)
N 1260 1662 667 995
All specification include the mother’s age and age at first birth.

Table 3Descriptive Statistics by Sample: Children and Parents
Sample No Twins-First Families Twins-First Families
Fertility Rules Non-exempt Exempt Non-exempt Exempt
Children 7-18
Birthweight 3.14(.486)
3.11(.454)
2.43(.495)
2.46(.478)
Years of schooling 5.57(3.08)
4.92(3.32)
5.77(3.23)
5.29(2.89)
Math grade 87.0(13.6)
81.5(14.6)
84.1(15.9)
79.2(16.7)
Literature grade 87.2(11.4)
81.6(12.2)
85.7(12.2)
80.0(14.0)
Weight (kg) 36.7(13.8)
33.7(13.7)
36.2(12.7)
34.9(12.4)
Height (cm) 141.1(22.6)
132.9(25.9)
142.8(18.5)
138.6(19.6)
BMI 17.7(5.00)
18.5(4.13)
17.2(3.05)
17.7(3.14)
N 696(635) b 1421(1096) 1221(1137) 1424(1170)
Parents
Mother’s years of schooling 3.85(1.45)
2.81(1.19)
3.71(1.47)
2.63(1.16)
Father’s years of schooling 4.12(1.61)
3.08(1.28)
4.01(1.61)
2.88(1.22)
Mother’s age 36.3(4.28)
35.3(4.55)
37.4(4.92)
36.6(4.98)
Mother’s age at first birth 24.8(3.06)
23.5(3.05)
25.6(3.54)
24.8(3.96)
Number of children 1.05(.224)
1.40(.500)
2.01(.114)
2.07(.260)
N 659 996 606 669aStandard deviation in parentheses.bSample size for children with field-specific grades in parentheses.

Table 4Effects of Birthweight on Parental Schooling Expenditures per Child:
Children Aged 7-14
Sample First-Birth SingletonsFirst- and Second-Birth Singletons
First-BirthTwins
Estimation Procedure OLS Within-Family Within-Twin
Birthweight(kilograms)
138.9(2.90)a
88.6(2.01)
59.4(1.96)
29.4(1.95)
Age of child 43.1(3.43)
56.7(4.79)
45.2(5.69)
-
Female child 78.2(1.31)
68.9(1.23)
2.75(0.14)
.814(0.08)
Mother completedhigh school
- 480.8(5.32)
- -
Mother some college - 773.0(4.18)
- -
Father completed highschool
- 161.5(2.39)
- -
Father some college - 557.3(3.93)
- -
Intercept (First birth) -242.6(1.00)
-480.9(2.13)
-19.6(0.75)
-8.99(1.11)
Number of children 1430 1430 612 1882aRobust t-statistics in parentheses.

Table 5Estimates of First-Birth Twinning on Educational Outcomes: Non-exempt Sample (N=1909)
Dependentvariable
ExpectedCollege
Enrollment
Years ofSchoolingCompleted
Math Grade LiteratureGrade
Estimationprocedure
Logit GLS GLS GLS
First-birth twins -.858(5.61)a
-.685(3.65)
-.276(4.85)
-.230(3.34)
-2.58(3.50)
-2.12(2.27)
-1.18(2.04)
-.944(1.37)
Girl .337(2.46)
.372(1.28)
.145(2.40)
.154(2.58)
-.132(0.18)
-.0522(0.07)
2.32(4.27)
2.38(4.34)
Birthweight - .253(1.60)
- .0641(1.27)
- .652(0.76)
- .369(0.62)
All specifications include the child’s age, age squared and the mother’s age at first birth.aAbsolute values of t-statistics in parentheses corrected for error clustering at the householdlevel.

Table 6Estimates of First-Birth Twinning on Health Outcomes: Non-exempt Sample (N=1909)
Dependent variableHealth Good or
Excellent Weight (kg) Height (cm) BMI
Estimationprocedure/variable
Logit GLS GLS GLS
First-birth twins -.539(3.65)a
-.231(1.29)
-2.24(5.78)
-.980(1.98)
-1.08(1.79)
.166(0.22)
-.585(2.86)
-.244(0.96)
Girl .202(1.48)
.263(1.90)
-2.11(6.35)
-1.84(5.38)
-2.09(4.23)
-1.82(3.59)
-.232(1.36)
-.164(0.92)
Birthweight - .352(2.90)
- 1.81(5.14)
- 1.80(3.58)
- .482(2.92)
All specifications include the child’s age, age squared and the mother’s ageat first birth.aAbsolute values of t-statistics in parentheses corrected for error clusteringat the household level.

Table 7Estimates of Second-Birth Twinning on Educational Outcomes of Twins and First-birth Non-Twins:
Exempt Sample of Households with Two or More Children (N=1709)
Dependent variableExpected College
EnrollmentYears of Schooling
Completed Math Grade Literature Grade
Estimation procedure Logit GLS GLS GLS
Second-birth twins -.658(4.77)a
-.424(2.21)
-.626(5.48)
-.649(5.67)
-3.65(2.99)
-3.10(2.44)
-2.78(2.51)
-2.41(2.05)
Second-birth twins x first-birth(non-twin)
.490(2.81)
.327(1.78)
.319(1.78)
.424(2.21)
.672(0.39)
.548(0.31)
1.34(0.98)
.533(0.37)
First-birth (non-twin) -.225(1.74)
1.12(1.90)
-.274(2.28)
-1.11(1.83)
-.615(0.56)
.176(0.03)
-.160(0.17)
6.39(1.28)
Mean birthweight of secondbirth
- .626(2.96)
- -.0616(0.42)
- 1.42(1.07)
- .985(0.77)
Mean birthweight second birthx first-birth (non-twin)
- -.444(2.28)
- .280(1.34)
- -.253(0.14)
- -2.19(1.35)
All specifications include the child’s age, age squared and sex and the mother’s age at second birth.aAbsolute values of t-statistics in parentheses corrected for error clustering at the household level.

Table 8Estimates of Second-Birth Twinning on Health Outcomes of Twins and First-birth Non-Twins:
Exempt Sample of Households with Two or More Children (N=1709)
Dependent variable Health Good orExcellent Weight Height BMI
Estimation procedure Logit GLS GLS GLS
Second-birth twins -.776(3.19)a
-.658(2.51)
-3.06(6.40)
-2.93(5.80)
-2.71(2.86)
-1.89(1.90)
-1.27(3.63)
-1.58(3.85)
Second-birth twins x first-birth(non-twin)
.351(1.83)
.347(1.66)
2.84(4.85)
2.43(3.89)
2.55(2.62)
2.15(2.09)
1.35(3.99)
1.40(3.58)
First-birth (non-twin) -.417(2.25)
-.407(0.43)
-2.88(6.98)
.381(0.20)
-2.06(2.70)
1.55(0.49)
-1.34(4.97)
-1.99(1.49)
Mean birthweight of secondbirth
- .314(1.13)
- .348(0.63)
- 2.24(1.84)
- -.860(1.85)
Mean birthweight second birthx first-birth (non-twin)
- -.001(0.01)
- -1.09(1.78)
- -1.20(1.18)
- .211(0.51)
All specifications include the child’s age, age squared and sex and the mother’s age at second birth.aAbsolute values of t-statistics in parentheses corrected for error clustering at the household level.
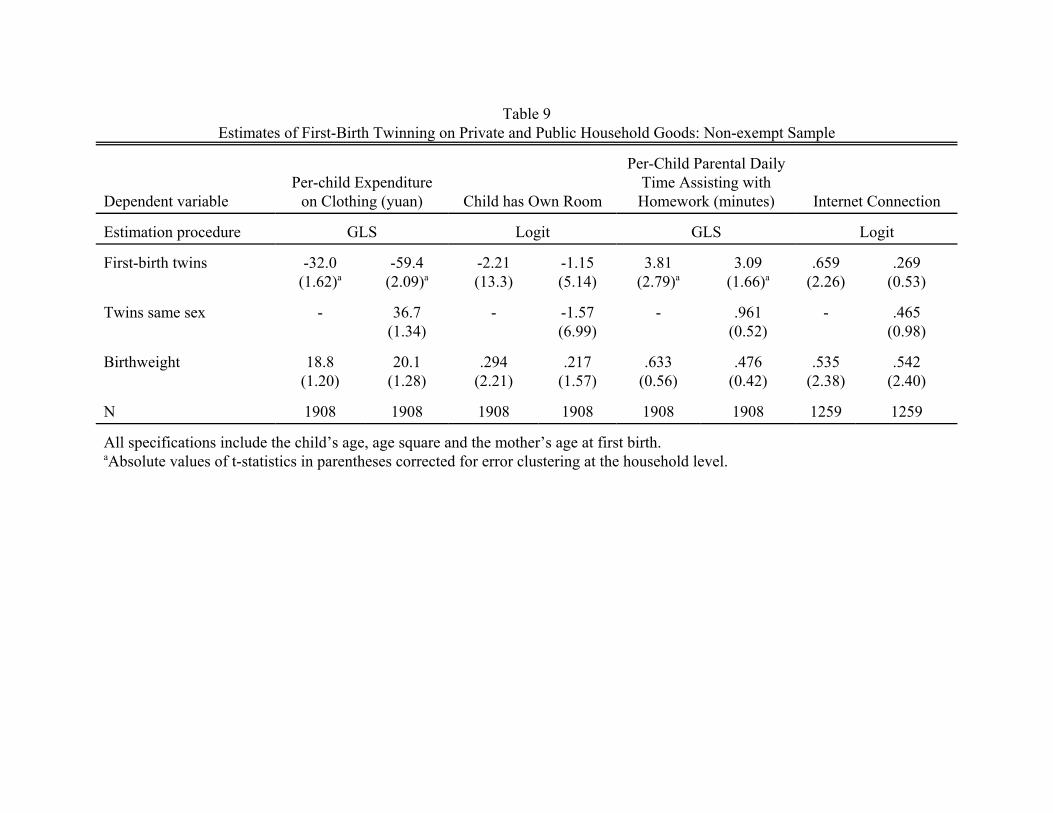
Table 9Estimates of First-Birth Twinning on Private and Public Household Goods: Non-exempt Sample
Dependent variablePer-child Expenditure
on Clothing (yuan) Child has Own Room
Per-Child Parental DailyTime Assisting withHomework (minutes) Internet Connection
Estimation procedure GLS Logit GLS Logit
First-birth twins -32.0(1.62)a
-59.4(2.09)a
-2.21(13.3)
-1.15(5.14)
3.81(2.79)a
3.09(1.66)a
.659(2.26)
.269(0.53)
Twins same sex - 36.7(1.34)
- -1.57(6.99)
- .961(0.52)
- .465(0.98)
Birthweight 18.8(1.20)
20.1(1.28)
.294(2.21)
.217(1.57)
.633(0.56)
.476(0.42)
.535(2.38)
.542(2.40)
N 1908 1908 1908 1908 1908 1908 1259 1259
All specifications include the child’s age, age square and the mother’s age at first birth.aAbsolute values of t-statistics in parentheses corrected for error clustering at the household level.

Table 10The Q-Q Trade-Off and Upper Bound Estimates of the Percentage Increase in Human Capital Measures from the One-Child Policy
Outcome Schooling ProgressProportion
Attending College Math Grade Literature GradeProportion Good or
Excellent Health
Q-Q Trade-Offa -13 -27 -3.8 -2.90 -11
Policy Effectb 4.3 8.9 1.3 1.0 3.6aBased on the rural population estimates, second births (Tables 7 and 8).bFirst row x -0.33, the McElroy-Yang policy effect on family size.