Canfield Local School District Ohio’s Next Generation Assessments.
Upload
hoangkhanhCategory
view
217download
0
Report IEA-PVPS T14-08:2017
Do It Locally: Local Voltage Support by Distributed Generation – A Management Summary Management Summary of IEA Task 14 Subtask 2 –
Recommendations Based on Research and Field
Experience

INTERNATIONAL ENERGY AGENCY PHOTOVOLTAIC POWER SYSTEMS PROGRAMME
Do It Locally: Local Voltage Support by Distributed Generation – A Management Summary
Management Summary of IEA Task 14 Subtask 2 –
Recommendations Based on Research and Field Experience
IEA PVPS Task 14, Subtask 2, Activity 2.8 IEA-PVPS T14-08:2017
January 2017
Authors: M. Kraiczy
L. Al Fakhri1, [email protected] T. Stetz2, [email protected]
M. Braun1,3, [email protected]
1 Fraunhofer IWES, Germany
2 TH Mittelhessen University of Applied Sciences, Germany
3 University of Kassel, Germany
ii
Contents
Contents ............................................................................................................................................................ ii Abbreviations and Acronyms ........................................................................................................................... iii Foreword .......................................................................................................................................................... iv Abstract ............................................................................................................................................................ vi 1. Introduction ............................................................................................................................................... 1 2. Technical Background ................................................................................................................................ 2
2.1. DG Voltage Support .......................................................................................................................... 2 2.2. Control Structures ............................................................................................................................ 4
3. Regulatory Framework .............................................................................................................................. 5 4. Impact on Grid Operation and Planning .................................................................................................... 7
4.1. Impact on the Grid Hosting Capacity ................................................................................................ 7 4.1.1. Technical Potential ...................................................................................................................... 8 4.1.2. Cost-Benefit-Analysis .................................................................................................................. 9 4.2. Impact on the Reactive Power Demand of Distribution Grids ....................................................... 11 4.3. Impact on existing Voltage Regulation Schemes ............................................................................ 13 4.4. Impact on the Voltage Stability of Distribution Grids ..................................................................... 15
5. Combined Active and Reactive Power Control ........................................................................................ 16 6. New Trends.............................................................................................................................................. 17 7. Conclusion ............................................................................................................................................... 18 References ....................................................................................................................................................... 20
iii
Abbreviations and Acronyms
DG Distributed Generator
DMS Distribution Management System
DSO Distribution System Operator
ENTSO-E European Network of Transmission System Operators for Electricity
HV High Voltage
LV Low Voltage
MV Medium Voltage
OLTC On-Load Tap Changer
PCC Point of Common Coupling
PHIL Power Hardware in-the-loop
PV Photovoltaic
RES Renewable Energy Source
TSO Transmission System Operator
VR Voltage Regulator
iv
Foreword The International Energy Agency (IEA), founded in November 1974, is an autonomous body within the framework of the Organization for Economic Co-operation and Development (OECD) that carries out a comprehensive programme of energy co-operation among its 23 member countries. The European Commission also participates in the work of the Agency. The IEA Photovoltaic Power Systems Programme (IEA-PVPS) is one of the collaborative R & D agreements established within the IEA and, since 1993, its participants have been conducting a variety of joint projects in the applications of photovoltaic conversion of solar energy into electricity. The overall programme is headed by an Executive Committee composed of one representative from each participating country or organization, while the management of individual Tasks (research projects / activity areas) is the responsibility of Operating Agents. Information about the active and completed tasks can be found on the IEA-PVPS website www.iea-pvps.org The main goal of Task 14 is to promote the use of grid-connected PV as an important source of energy in electric power systems. The active national experts from 15 institutions from around the world are collaborating with each other within Subtask 2 – High Penetration PV in Local Distribution Grids – in order to share the technical and economical experience, to increase the amount of distribution grid integrated PV. These efforts aim to reduce barriers for achieving high penetration levels of distributed renewable systems.
v
Acknowledgements
The Management Summary has been prepared by the Subtask 2 leader Fraunhofer IWES
(Germany) with valuable contributions from several IEA-PVPS Task 14 members and other
international experts: Barry Mather (NREL, USA), Benoît Bletterie (AIT, Austria), Pieter
Vingerhoets (KU Leuven, Belgium), Kenn Frederiksen (Kenergy, Denmark), Kazuhiko Ogimoto
(Univ. of Tokyo, Japan), Koichi Asano (NEDO, Japan), Stathis Tselepis (CRES, Greece), Christof
Bucher (Basler & Hofmann, Switzerland) and Antonis Marinopoulos (ABB, Sweden).
The German contribution is supported by the German Federal Ministry for Economic Affairs
and Energy and the “Forschungszentrum Jülich GmbH (PTJ)” within the frame-work of the
project “HiPePV2” (FKZ: 0325785).
The work of AIT within IEA-PVPS Task 14 is funded in the frame of the IEA Research
Cooperation program by the Austrian Ministry for Transport, Innovation and Technology
under contract no. FFG 848120 (Project HD-PV).
The US contribution is supported by the US Department of Energy’s National Renewable Energy Laboratory (NREL), Golden, CO, with funding provided by the DOE Solar Program.
vi
Abstract
This report presents an overview of research results and field experiences on the subject of local voltage support by distributed generators (DGs). The focus of this report is the German power supply system, which has experienced a significant photovoltaic (PV) expansion of approximately 36 GW within the last decade. Case study results from different countries like Belgium, Austria and the United States complement the findings on local voltage support by PV systems. A major PV integration challenge is the voltage regulation in distribution grids with a high PV penetration. Advanced PV inverter functions, like reactive power control or active power curtailment, can help to reduce the impact of PV feed-in on the local voltage magnitude. Nowadays, several countries demand reactive power and partly active power control capabilities from DGs in their grid codes and DG interconnection guidelines. Central control (coordinated control) approaches by DGs are not in the scope of this report. The addressed local control (autonomous control) strategies4 are for example:
• Fixed cosϕ control (Fixed power factor function) • Cosϕ(P) control (Watt-Power factor function) • Q(U) control (Volt-Var function) • P(U) control (Volt-Watt function) • 70% active power limitation (maximum generation limit function)
The term PV hosting capacity defines the maximum PV generation capacity that can be connected to a respective grid section while complying with the technical requirements of grid codes and guidelines. For example, in a German case study the maximum PV hosting capacity is analyzed for 17 real low-voltage grids. In these grids reactive power control can increase the PV hosting capacity in median by 70 % to 90 % compared to the case without PV reactive power control. The cost-benefit analysis identified significant cost saving potential for PV reactive power control compared to traditional grid reinforcement. Nevertheless, widespread use of local reactive power control by PV systems can have a significant impact on the reactive power demand of distributions grids, which might lead to additional grid losses or an additional need for reactive power compensators. Furthermore, the impact of PV reactive power control on existing voltage regulation schemes by the Distribution System Operator (DSO) or on the voltage stability in the distribution grid is analyzed and discussed in this report. Especially in this matter, the impact of reactive power control is highly sensitive to the applied reactive power control strategy. Combined reactive power control and active power curtailment can further increase the PV hosting capacity and can be a cost effective measure to integrate a high share of PV generation. However, the related additional PV feed-in losses are also sensitive to the applied active power control strategy. Finally, the report presents an overview on advantages and disadvantages for the different reactive power and active power control strategies, which can assist decision-making for the application of local voltage support by DG.
4 A detailed description of the addressed control strategies is given in: Common Functions for Smart Inverters, Version 3. EPRI, Palo Alto, CA: 2013. 3002002233
1
1. Introduction Background: The share of the distributed generators (DG) in electrical grids is increasing rapidly in various countries. However, distribution grids were originally not designed to host a high share of distributed generation in the low and medium voltage network. Consequently, this leads and has led to several technical challenges in the field of planning and operation of distribution grids. Some of the main problems, especially in rural areas, are voltage rise issues due to the feed-in power from DGs. However, DG in general and inverter-coupled photovoltaic generators (PV) in particular, offer different technical features, such as reactive and active power control. Applying these features properly can positively influence the grid voltage as well as the line loading and hence defer or even avoid the need for grid reinforcements. The technical and economic benefits and challenges associated with such control techniques have been addressed by many publications. The promising financial benefits by supporting the local voltage quality encouraged several countries to demand such services from grid-connected generators. In 2014, the cumulative renewable power capacity installed worldwide reached (657 GW - not including hydro power), 27% of this capacity is from PV [1]. In Germany, the installed PV capacity has grown significantly over the last 10 years with an installed PV capacity of 2 GWp in 2005 and 38 GWp in 2015 [2] compared to a peak load of about 80 GW. The fast increase of PV capacity has led to different PV grid integration challenges, which is discussed in the management summary at hand. Technical phenomena, such as overvoltages and increasing reactive power flows already affect the planning and operation of distribution grids. To deal with these challenges, many distribution network operators will have to increase the hosting capacity of their local networks prior to connecting any new DG units [3]. Objective: The objective of this management summary is to give an overview on the state-of-the-art of voltage support functionalities by means of local active and reactive power control by DGs. Sharing the network operators’ experience from different countries can positively contribute to the local control strategies developments and reduce concerns regarding the use of locally controlled DG. The focus of this management summary is on voltage support for normal grid operation to avoid grid reinforcements. This management summary provides key findings from case studies in different countries, such as Belgium, Austria, the United States of America and Germany. However, the German power supply system is the focus of the management summary. Structure: The management summary is structured in the following manner: Chapter 2 gives a short introduction on local, reactive power-based voltage control strategies in general. Chapter 3 gives an overview on the current regulatory framework for reactive power-based voltage support by DGs within European distribution grids and other countries. Chapter 4 presents case studies on the impact of local voltage support by DGs on grid operation and planning. Chapter 5 explains how the combined active and reactive power control works. Chapter 6 deals with the need for further research and development in the presented areas. The conclusion based on the findings and recommendations of the studies presented in this management summary is given in Chapter 7.

2
2. Technical Background Increased DG penetration in a distribution grid can lead to several technical challenges for the respective Distribution System Operator (DSO) in maintaining the voltage quality according to the relevant grid codes and guidelines. Some of the potential impacts on voltage quality include overvoltages, voltage unbalances, harmonics and flicker. Apart of this, a continuously increasing DG penetration may cause grid assets, such as transformers or conductors to become overloaded. The focus of this management summary is on voltage support by active and reactive power control of DGs for normal grid operation. A short explanation of the technical background is presented in Section 2.1. Section 2.2 gives an overview on control structures for voltage support in the distribution grid.
2.1. DG Voltage Support
Figure 1 illustrates the impact of consumption and generation on the voltage profile of a simple distribution line. The graph simplifies the effects of the elements connected to the point of common coupling (PCC) on the grid voltage. The load consumes active power from the grid (Pload), which causes a voltage drop over the line and may lead to low grid voltages at the PCC. Depending on the type of the load (inductive or capacitive) it can either absorb or inject reactive power (Qload). The DG injects active power (PG) into the grid, which can cause a voltage rise over the line and may lead to high voltages at the PCC (compare Figure 1, green arrow). In case the voltage at PCC exceeds the permissible voltage level (Umax), additional measures (e.g. grid reinforcement, voltage support by DG) have to be provided. Modern DGs are capable of controlling their reactive power output (QG), a functionality that can be used to influence the voltage at their PCC (compare Figure 1, blue arrow).
Figure 1: Impact of active and reactive power - based on [5].
3
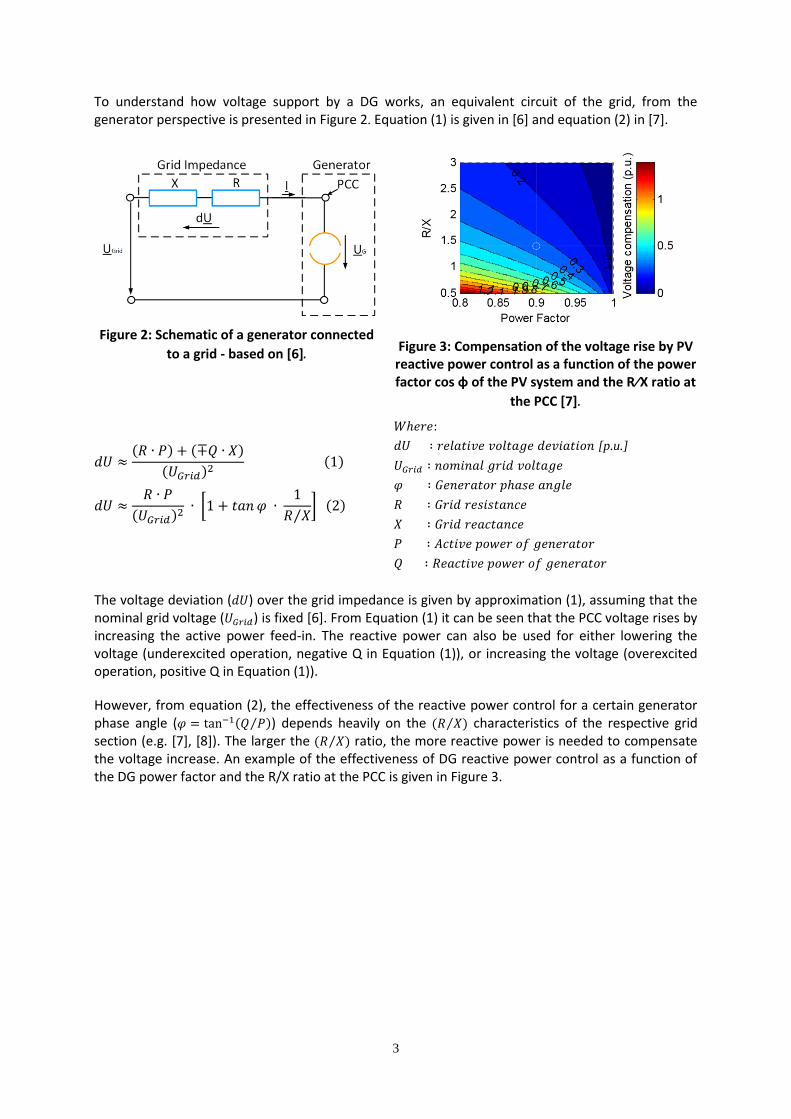
To understand how voltage support by a DG works, an equivalent circuit of the grid, from the generator perspective is presented in Figure 2. Equation (1) is given in [6] and equation (2) in [7].
Figure 2: Schematic of a generator connected
to a grid - based on [6].
Figure 3: Compensation of the voltage rise by PV reactive power control as a function of the power factor cos φ of the PV system and the R⁄X ratio at
the PCC [7].
𝑑𝑈 ≈(𝑅 ∙ 𝑃) + (∓𝑄 ∙ 𝑋)
(𝑈𝐺𝑟𝑖𝑑)2 (1)
𝑑𝑈 ≈𝑅 ∙ 𝑃
(𝑈𝐺𝑟𝑖𝑑)2 ∙ [1 + 𝑡𝑎𝑛 𝜑 ∙
1
𝑅 𝑋⁄] (2)
𝑊ℎ𝑒𝑟𝑒:
𝑑𝑈 ∶ 𝑟𝑒𝑙𝑎𝑡𝑖𝑣𝑒 𝑣𝑜𝑙𝑡𝑎𝑔𝑒 𝑑𝑒𝑣𝑖𝑎𝑡𝑖𝑜𝑛 [p.u.]
𝑈𝐺𝑟𝑖𝑑 ∶ 𝑛𝑜𝑚𝑖𝑛𝑎𝑙 𝑔𝑟𝑖𝑑 𝑣𝑜𝑙𝑡𝑎𝑔𝑒
𝜑 ∶ 𝐺𝑒𝑛𝑒𝑟𝑎𝑡𝑜𝑟 𝑝ℎ𝑎𝑠𝑒 𝑎𝑛𝑔𝑙𝑒
𝑅 ∶ 𝐺𝑟𝑖𝑑 𝑟𝑒𝑠𝑖𝑠𝑡𝑎𝑛𝑐𝑒
𝑋 ∶ 𝐺𝑟𝑖𝑑 𝑟𝑒𝑎𝑐𝑡𝑎𝑛𝑐𝑒
𝑃 ∶ 𝐴𝑐𝑡𝑖𝑣𝑒 𝑝𝑜𝑤𝑒𝑟 𝑜𝑓 𝑔𝑒𝑛𝑒𝑟𝑎𝑡𝑜𝑟
𝑄 ∶ 𝑅𝑒𝑎𝑐𝑡𝑖𝑣𝑒 𝑝𝑜𝑤𝑒𝑟 𝑜𝑓 𝑔𝑒𝑛𝑒𝑟𝑎𝑡𝑜𝑟
The voltage deviation (𝑑𝑈) over the grid impedance is given by approximation (1), assuming that the nominal grid voltage (𝑈𝐺𝑟𝑖𝑑) is fixed [6]. From Equation (1) it can be seen that the PCC voltage rises by increasing the active power feed-in. The reactive power can also be used for either lowering the voltage (underexcited operation, negative Q in Equation (1)), or increasing the voltage (overexcited operation, positive Q in Equation (1)).
However, from equation (2), the effectiveness of the reactive power control for a certain generator phase angle (𝜑 = tan−1(𝑄 𝑃⁄ )) depends heavily on the (𝑅 𝑋⁄ ) characteristics of the respective grid section (e.g. [7], [8]). The larger the (𝑅 𝑋⁄ ) ratio, the more reactive power is needed to compensate the voltage increase. An example of the effectiveness of DG reactive power control as a function of the DG power factor and the R/X ratio at the PCC is given in Figure 3.

4
2.2. Control Structures
In general, the grid control structure can be categorized into three different hierarchy levels; the centralized, decentralized and local control structures. Within each level, the controller considers different input variables to form its output variables. In centralized control structures, each controller depends on output measurement values from the subsystems in order to derive its output variables. Therefore the centralized control structures enable regional grid optimization, since in this level communication between different entities (e.g. loads, DGs, transformers) is possible. However, the controllers may experience delays in the communication between different levels and availability issues of the communication infrastructure. On the other hand, in decentralized control structures, each controller in the subsystem (e.g. LV grid area) depends only on the output from the subsystem attached to it. Therefore, a decentralized controlled subsystem can be by itself a part of superior centralized control structure.
Figure 4: Differentiation between central, decentralized and local structured intelligence of voltage control strategies [9].
Finally, local controllers do not depend on any communication between single subsystems. Instead, they process measured values from the respective controlling entity itself (e.g. voltage magnitude at the PCC) and use this value to define their outputs (e.g. change reactive power operation point). The local control structure may not result in an optimized operation for the overall grid section; however local control is very fast and only requires a small initial investment [4], [10], [11]. The focus of this management summary is set on local control structures.
5
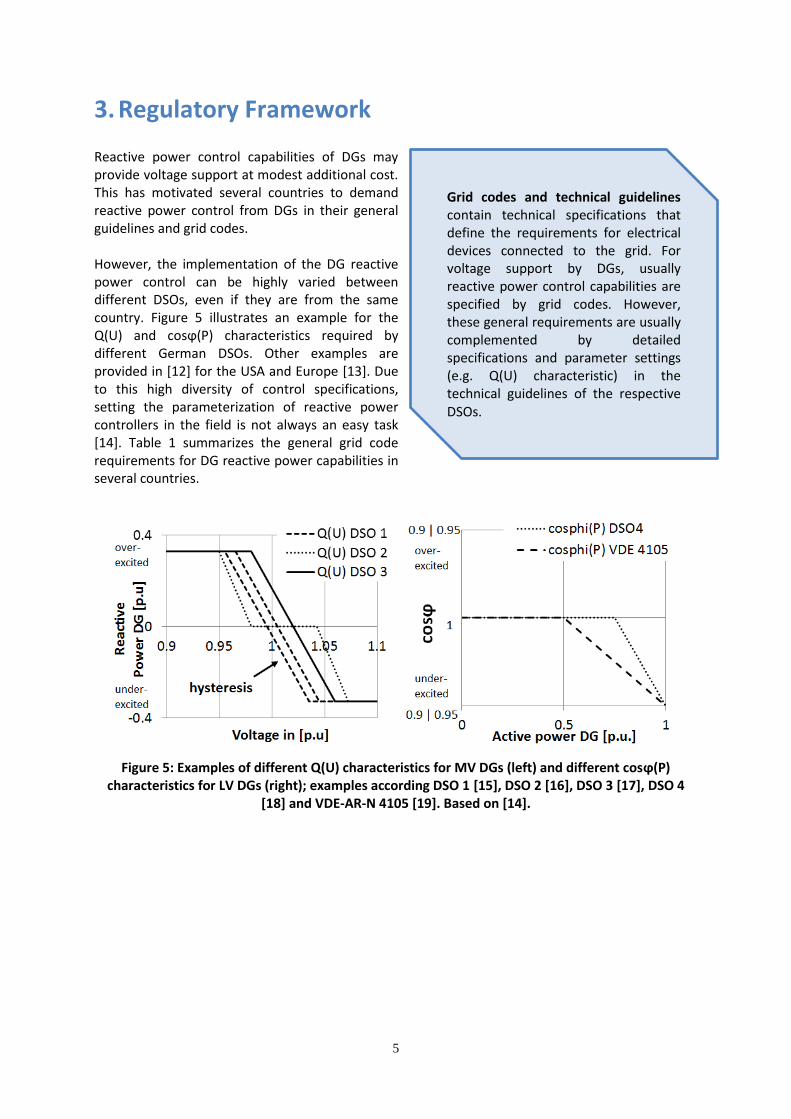
3. Regulatory Framework Reactive power control capabilities of DGs may provide voltage support at modest additional cost. This has motivated several countries to demand reactive power control from DGs in their general guidelines and grid codes. However, the implementation of the DG reactive power control can be highly varied between different DSOs, even if they are from the same country. Figure 5 illustrates an example for the Q(U) and cosϕ(P) characteristics required by different German DSOs. Other examples are provided in [12] for the USA and Europe [13]. Due to this high diversity of control specifications, setting the parameterization of reactive power controllers in the field is not always an easy task [14]. Table 1 summarizes the general grid code requirements for DG reactive power capabilities in several countries.
Figure 5: Examples of different Q(U) characteristics for MV DGs (left) and different cosϕ(P) characteristics for LV DGs (right); examples according DSO 1 [15], DSO 2 [16], DSO 3 [17], DSO 4
[18] and VDE-AR-N 4105 [19]. Based on [14].
Grid codes and technical guidelines contain technical specifications that define the requirements for electrical devices connected to the grid. For voltage support by DGs, usually reactive power control capabilities are specified by grid codes. However, these general requirements are usually complemented by detailed specifications and parameter settings (e.g. Q(U) characteristic) in the technical guidelines of the respective DSOs.
6
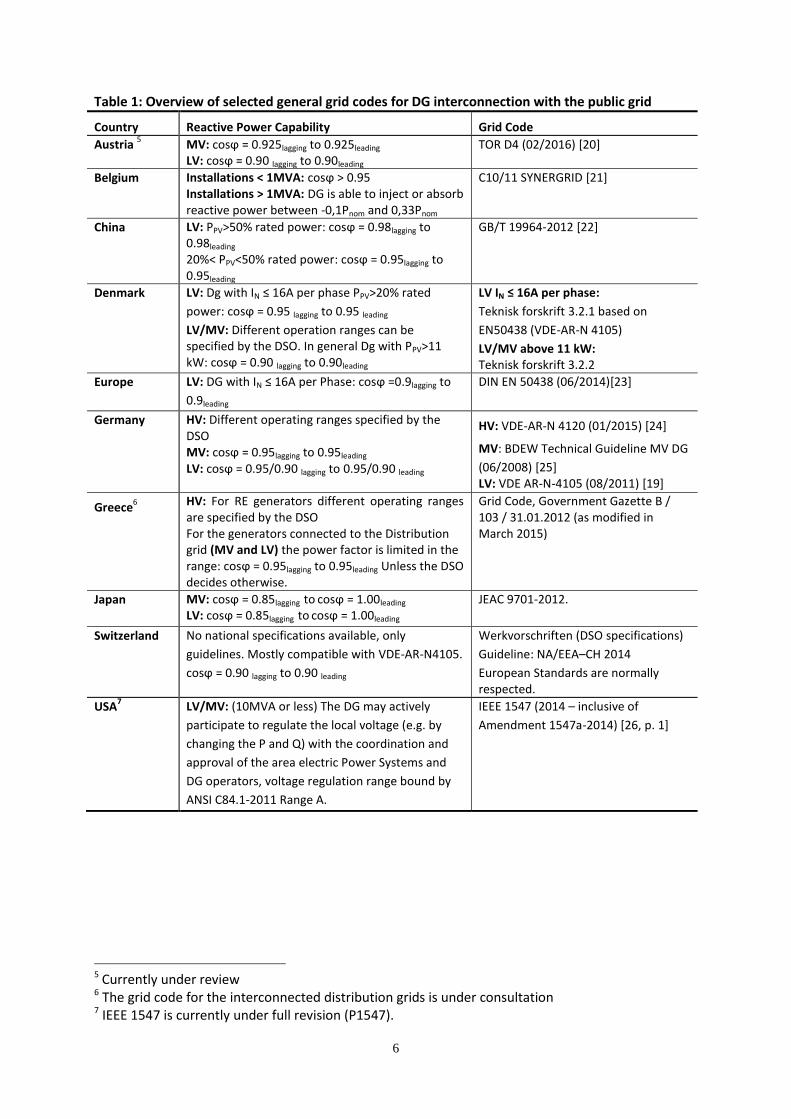
Table 1: Overview of selected general grid codes for DG interconnection with the public grid
Country Reactive Power Capability Grid Code
Austria 5 MV: cosϕ = 0.925lagging to 0.925leading
LV: cosϕ = 0.90 lagging to 0.90leading TOR D4 (02/2016) [20]
Belgium Installations < 1MVA: cosϕ > 0.95 Installations > 1MVA: DG is able to inject or absorb reactive power between -0,1Pnom and 0,33Pnom
C10/11 SYNERGRID [21]
China LV: PPV>50% rated power: cosϕ = 0.98lagging to 0.98leading 20%< PPV<50% rated power: cosϕ = 0.95lagging to 0.95leading
GB/T 19964-2012 [22]
Denmark LV: Dg with IN ≤ 16A per phase PPV>20% rated
power: cosϕ = 0.95 lagging to 0.95 leading
LV/MV: Different operation ranges can be specified by the DSO. In general Dg with PPV>11 kW: cosϕ = 0.90 lagging to 0.90leading
LV IN ≤ 16A per phase:
Teknisk forskrift 3.2.1 based on
EN50438 (VDE-AR-N 4105)
LV/MV above 11 kW: Teknisk forskrift 3.2.2
Europe LV: DG with IN ≤ 16A per Phase: cosϕ =0.9lagging to
0.9leading
DIN EN 50438 (06/2014)[23]
Germany HV: Different operating ranges specified by the DSO MV: cosϕ = 0.95lagging to 0.95leading LV: cosϕ = 0.95/0.90 lagging to 0.95/0.90 leading
HV: VDE-AR-N 4120 (01/2015) [24]
MV: BDEW Technical Guideline MV DG
(06/2008) [25] LV: VDE AR-N-4105 (08/2011) [19]
Greece6 HV: For RE generators different operating ranges
are specified by the DSO For the generators connected to the Distribution grid (MV and LV) the power factor is limited in the range: cosϕ = 0.95lagging to 0.95leading Unless the DSO decides otherwise.
Grid Code, Government Gazette B / 103 / 31.01.2012 (as modified in March 2015)
Japan MV: cosϕ = 0.85lagging to cosϕ = 1.00leading
LV: cosϕ = 0.85lagging to cosϕ = 1.00leading JEAC 9701-2012.
Switzerland No national specifications available, only
guidelines. Mostly compatible with VDE-AR-N4105.
cosϕ = 0.90 lagging to 0.90 leading
Werkvorschriften (DSO specifications)
Guideline: NA/EEA–CH 2014
European Standards are normally respected.
USA7 LV/MV: (10MVA or less) The DG may actively
participate to regulate the local voltage (e.g. by
changing the P and Q) with the coordination and
approval of the area electric Power Systems and
DG operators, voltage regulation range bound by
ANSI C84.1-2011 Range A.
IEEE 1547 (2014 – inclusive of
Amendment 1547a-2014) [26, p. 1]
5 Currently under review
6 The grid code for the interconnected distribution grids is under consultation 7 IEEE 1547 is currently under full revision (P1547).
7
4. Impact on Grid Operation and Planning
This chapter presents case studies investigating technical and economic aspects of local voltage control strategies. Section 4.1 explains how local voltage support can positively contribute to increase a grid’s hosting capacity for additional DG capacity. Here, technical aspects and economic findings, derived by analysing real highly PV-penetrated low voltage grids in Germany, are presented. Section 4.2 presents the impact of local control strategies on the reactive power exchange at the HV/MV connection point. In Section 4.3, the impact of DG reactive power control on other voltage regulation schemes applied by the utility are analysed. Finally, Section 4.4 highlights the challenges and impacts of local voltage control on the voltage stability.
4.1. Impact on the Grid Hosting Capacity
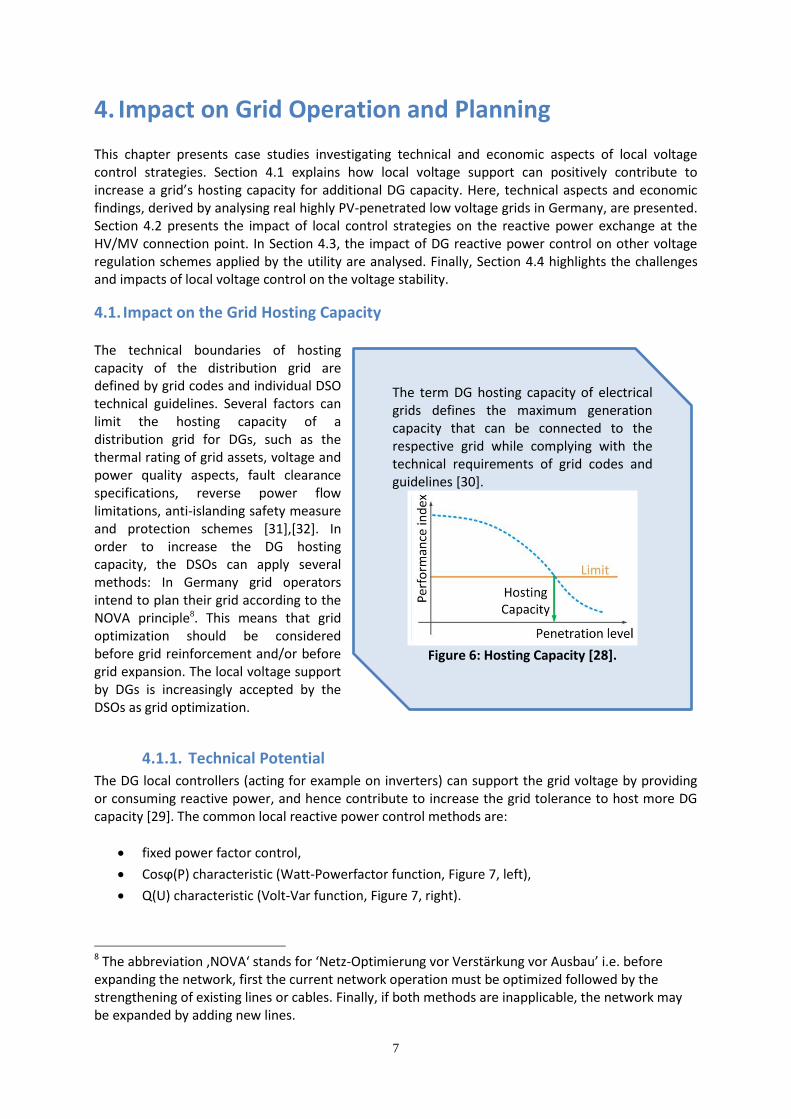
The technical boundaries of hosting capacity of the distribution grid are defined by grid codes and individual DSO technical guidelines. Several factors can limit the hosting capacity of a distribution grid for DGs, such as the thermal rating of grid assets, voltage and power quality aspects, fault clearance specifications, reverse power flow limitations, anti-islanding safety measure and protection schemes [31],[32]. In order to increase the DG hosting capacity, the DSOs can apply several methods: In Germany grid operators intend to plan their grid according to the NOVA principle8. This means that grid optimization should be considered before grid reinforcement and/or before grid expansion. The local voltage support by DGs is increasingly accepted by the DSOs as grid optimization.
4.1.1. Technical Potential
The DG local controllers (acting for example on inverters) can support the grid voltage by providing or consuming reactive power, and hence contribute to increase the grid tolerance to host more DG capacity [29]. The common local reactive power control methods are:
fixed power factor control,
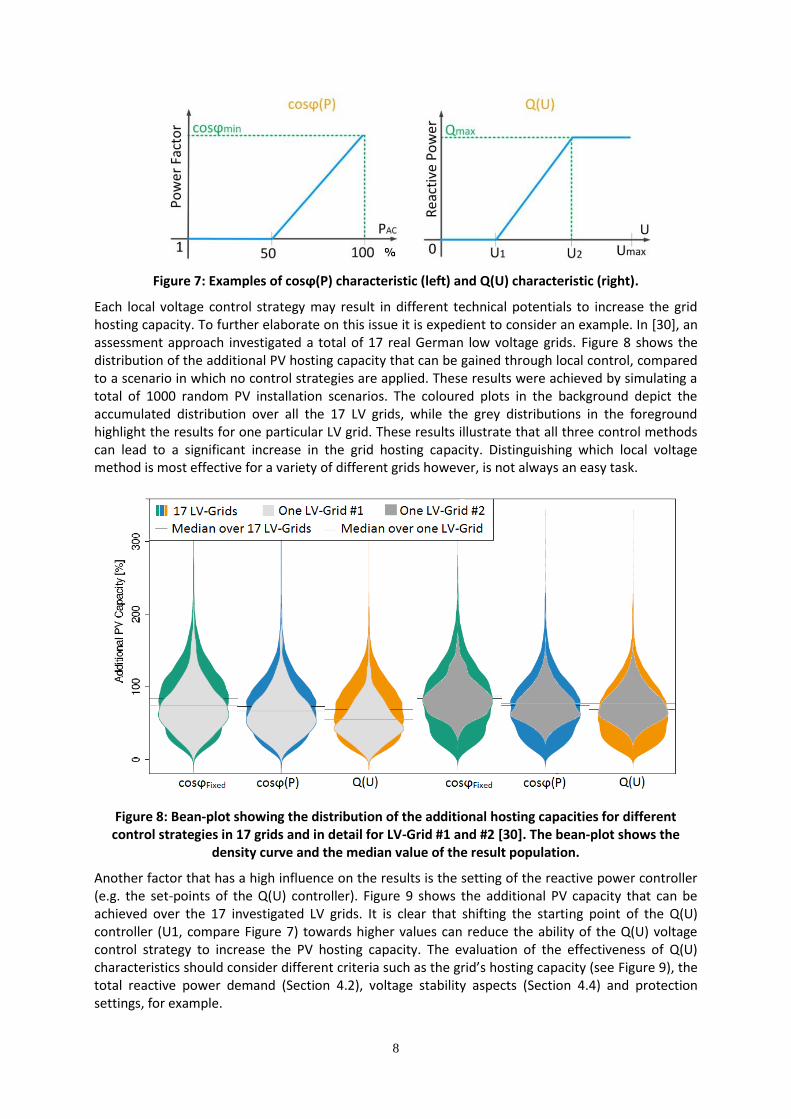
Cosϕ(P) characteristic (Watt-Powerfactor function, Figure 7, left),
Q(U) characteristic (Volt-Var function, Figure 7, right).
8 The abbreviation ‚NOVA‘ stands for ‘Netz-Optimierung vor Verstärkung vor Ausbau’ i.e. before expanding the network, first the current network operation must be optimized followed by the strengthening of existing lines or cables. Finally, if both methods are inapplicable, the network may be expanded by adding new lines.
The term DG hosting capacity of electrical grids defines the maximum generation capacity that can be connected to the respective grid while complying with the technical requirements of grid codes and guidelines [30].
Figure 6: Hosting Capacity [28].
8
Figure 7: Examples of cosϕ(P) characteristic (left) and Q(U) characteristic (right).
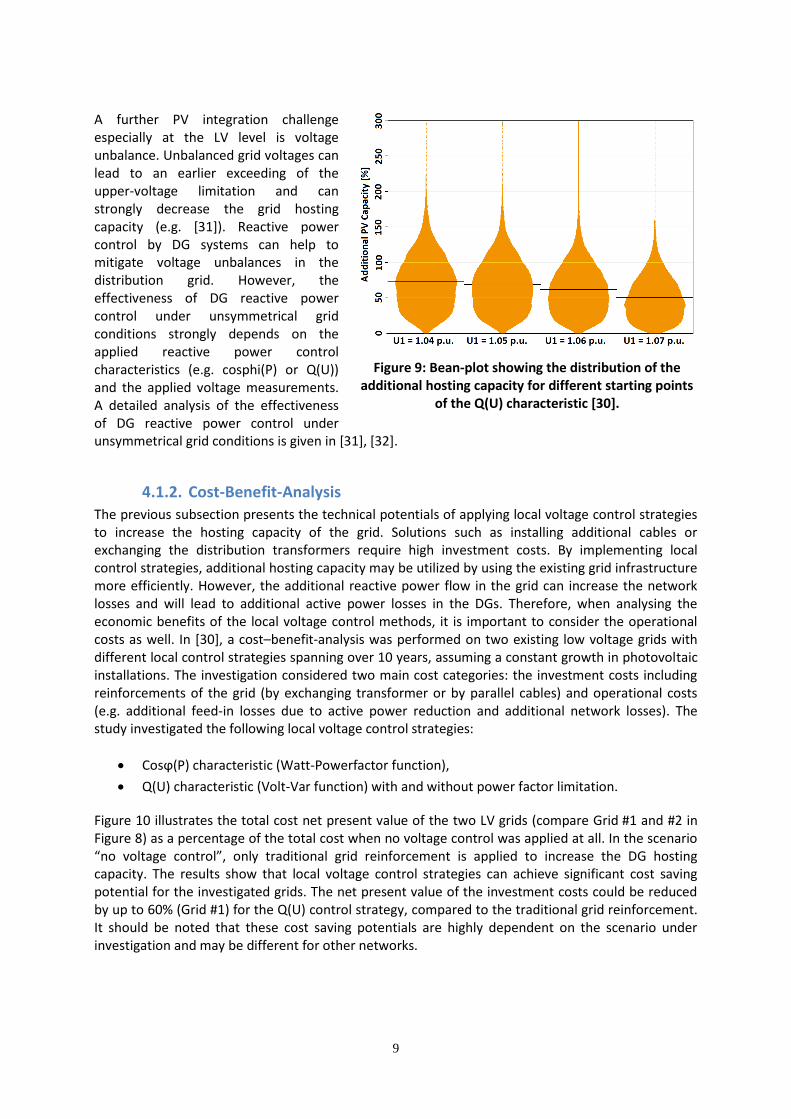
Each local voltage control strategy may result in different technical potentials to increase the grid hosting capacity. To further elaborate on this issue it is expedient to consider an example. In [30], an assessment approach investigated a total of 17 real German low voltage grids. Figure 8 shows the distribution of the additional PV hosting capacity that can be gained through local control, compared to a scenario in which no control strategies are applied. These results were achieved by simulating a total of 1000 random PV installation scenarios. The coloured plots in the background depict the accumulated distribution over all the 17 LV grids, while the grey distributions in the foreground highlight the results for one particular LV grid. These results illustrate that all three control methods can lead to a significant increase in the grid hosting capacity. Distinguishing which local voltage method is most effective for a variety of different grids however, is not always an easy task.
Figure 8: Bean-plot showing the distribution of the additional hosting capacities for different control strategies in 17 grids and in detail for LV-Grid #1 and #2 [30]. The bean-plot shows the
density curve and the median value of the result population.
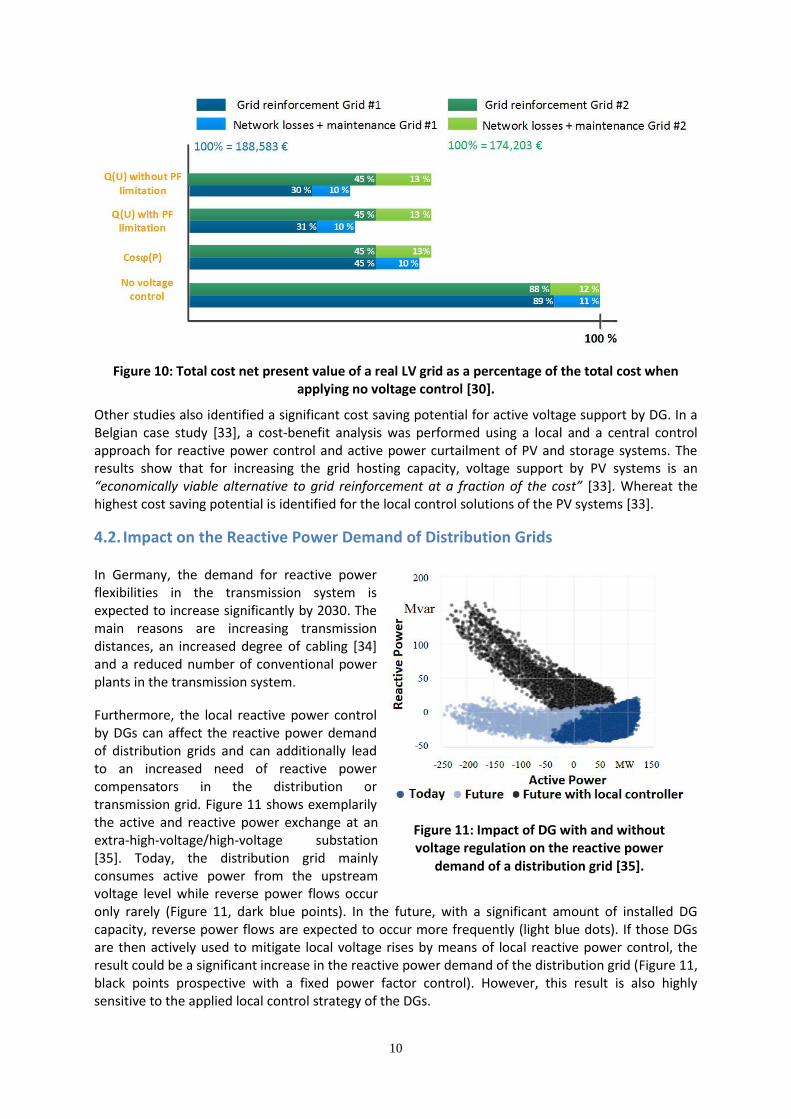
Another factor that has a high influence on the results is the setting of the reactive power controller (e.g. the set-points of the Q(U) controller). Figure 9 shows the additional PV capacity that can be achieved over the 17 investigated LV grids. It is clear that shifting the starting point of the Q(U) controller (U1, compare Figure 7) towards higher values can reduce the ability of the Q(U) voltage control strategy to increase the PV hosting capacity. The evaluation of the effectiveness of Q(U) characteristics should consider different criteria such as the grid’s hosting capacity (see Figure 9), the total reactive power demand (Section 4.2), voltage stability aspects (Section 4.4) and protection settings, for example.
9
A further PV integration challenge especially at the LV level is voltage unbalance. Unbalanced grid voltages can lead to an earlier exceeding of the upper-voltage limitation and can strongly decrease the grid hosting capacity (e.g. [31]). Reactive power control by DG systems can help to mitigate voltage unbalances in the distribution grid. However, the effectiveness of DG reactive power control under unsymmetrical grid conditions strongly depends on the applied reactive power control characteristics (e.g. cosphi(P) or Q(U)) and the applied voltage measurements. A detailed analysis of the effectiveness of DG reactive power control under unsymmetrical grid conditions is given in [31], [32].
4.1.2. Cost-Benefit-Analysis
The previous subsection presents the technical potentials of applying local voltage control strategies to increase the hosting capacity of the grid. Solutions such as installing additional cables or exchanging the distribution transformers require high investment costs. By implementing local control strategies, additional hosting capacity may be utilized by using the existing grid infrastructure more efficiently. However, the additional reactive power flow in the grid can increase the network losses and will lead to additional active power losses in the DGs. Therefore, when analysing the economic benefits of the local voltage control methods, it is important to consider the operational costs as well. In [30], a cost–benefit-analysis was performed on two existing low voltage grids with different local control strategies spanning over 10 years, assuming a constant growth in photovoltaic installations. The investigation considered two main cost categories: the investment costs including reinforcements of the grid (by exchanging transformer or by parallel cables) and operational costs (e.g. additional feed-in losses due to active power reduction and additional network losses). The study investigated the following local voltage control strategies:
Cosϕ(P) characteristic (Watt-Powerfactor function),
Q(U) characteristic (Volt-Var function) with and without power factor limitation.
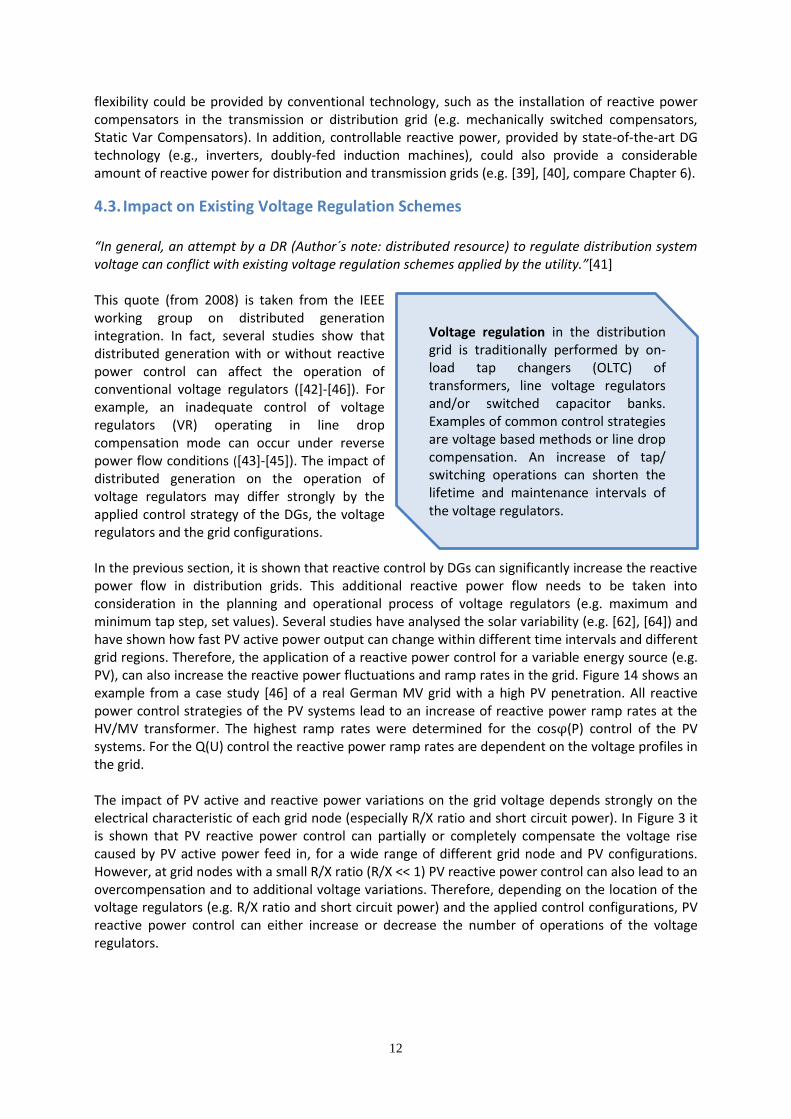
Figure 10 illustrates the total cost net present value of the two LV grids (compare Grid #1 and #2 in Figure 8) as a percentage of the total cost when no voltage control was applied at all. In the scenario “no voltage control”, only traditional grid reinforcement is applied to increase the DG hosting capacity. The results show that local voltage control strategies can achieve significant cost saving potential for the investigated grids. The net present value of the investment costs could be reduced by up to 60% (Grid #1) for the Q(U) control strategy, compared to the traditional grid reinforcement. It should be noted that these cost saving potentials are highly dependent on the scenario under investigation and may be different for other networks.
Figure 9: Bean-plot showing the distribution of the additional hosting capacity for different starting points
of the Q(U) characteristic [30].
10
Figure 10: Total cost net present value of a real LV grid as a percentage of the total cost when applying no voltage control [30].
Other studies also identified a significant cost saving potential for active voltage support by DG. In a Belgian case study [33], a cost-benefit analysis was performed using a local and a central control approach for reactive power control and active power curtailment of PV and storage systems. The results show that for increasing the grid hosting capacity, voltage support by PV systems is an “economically viable alternative to grid reinforcement at a fraction of the cost” [33]. Whereat the highest cost saving potential is identified for the local control solutions of the PV systems [33].
4.2. Impact on the Reactive Power Demand of Distribution Grids
In Germany, the demand for reactive power flexibilities in the transmission system is expected to increase significantly by 2030. The main reasons are increasing transmission distances, an increased degree of cabling [34] and a reduced number of conventional power plants in the transmission system.
Furthermore, the local reactive power control by DGs can affect the reactive power demand of distribution grids and can additionally lead to an increased need of reactive power compensators in the distribution or transmission grid. Figure 11 shows exemplarily the active and reactive power exchange at an extra-high-voltage/high-voltage substation [35]. Today, the distribution grid mainly consumes active power from the upstream voltage level while reverse power flows occur only rarely (Figure 11, dark blue points). In the future, with a significant amount of installed DG capacity, reverse power flows are expected to occur more frequently (light blue dots). If those DGs are then actively used to mitigate local voltage rises by means of local reactive power control, the result could be a significant increase in the reactive power demand of the distribution grid (Figure 11, black points prospective with a fixed power factor control). However, this result is also highly sensitive to the applied local control strategy of the DGs.
Figure 11: Impact of DG with and without voltage regulation on the reactive power
demand of a distribution grid [35].

11
In Reference [36], the impact of different local control strategies of low-voltage PV-systems on the reactive power exchange at the HV/MV transformer was analysed for a real German distribution grid. The simulations were performed using a detailed composite 20 kV and 0.4 kV grid model, which consists of one 110 kV/20 kV substation and 156 distribution substations (20 kV/0.4 kV). More than 1440 PV systems are installed in the LV grid, adding up to total PV capacity of approximately 30 MWp. In order to assess the impact of local reactive power provision on the reactive power exchange with the upstream 110 kV grid, different reactive power provision strategies were assumed for certain percentages of the PV systems, respectively. Figure 12 shows an exemplary result of the power exchange at the HV/MV transformer for a clear sky day, where for all low voltage PV systems (100% scenario) the voltage support functionality was applied. The results in [36] show that a system wide rollout of the fixed cosϕ control or the cosϕ(P)-control can have a significant impact on the reactive power demand of the distribution grid. On the other hand, the investigated Q(U) control shows only a minor impact on the reactive power demand of the distribution grid. The results depend on the respective grid topology and loading situation and the parameter settings of the applied reactive power controller. In the analysed distribution grid, high voltages (UPCC > 1.05 p.u.) only occur rarely at the PCC of the PV systems, due to a power flow dependent control of the on-load tap changer in the HV/MV transformer. Nevertheless, the results illustrate that an appropriately set Q(U) characteristic can minimize the additional reactive power flows within the distribution grid, whilst supporting the local voltage.
Figure 12: Impact of different local DG control strategies on the reactive power exchange at the
HV/MV transformer [36]. (German case study)
Figure 13 :PQ-Diagram and Belgian TSO’s tariff areas for reactive power exchange and
the range limits of ENTSO-E [37]. (Belgium case study)
In a case study carried out in Belgium [37], the costs for reactive power surplus at the DSO/ TSO connection point is examined for various MV grids and the influence of distributed generation on the reactive power surplus is analysed. A focus is set on the reactive power requirements by the ENTSO-E Network Code on Demand Connection [38], in this example no export of “Reactive Power (at nominal Voltage) at an Active Power flow of less than 25% of the Maximum Import Capability”[38] should be applied at TSO/DSO connection points (red square in Figure 13); except in cases when other measures are agreed between TSO and DSO. The distributed generation can shift the operation points of the distribution grid to lower consumption or even to reverse power flows (from A (permitted) to B (not permitted) and from B to C (not permitted) in Figure 13), which might lead to additional costs for the DSO. Furthermore, local reactive power characteristics for DGs are discussed in [37], which might reduce the reactive power surplus of distribution grids. In general, distributed generation and reactive power control of DGs can have a relevant impact on the reactive power demand of distribution grids. The reactive power demand of distribution grids and the reactive power requirements at the connection point with the upstream Network operator can differ strongly per country, voltage level or grid region. The additional required reactive power
12
flexibility could be provided by conventional technology, such as the installation of reactive power compensators in the transmission or distribution grid (e.g. mechanically switched compensators, Static Var Compensators). In addition, controllable reactive power, provided by state-of-the-art DG technology (e.g., inverters, doubly-fed induction machines), could also provide a considerable amount of reactive power for distribution and transmission grids (e.g. [39], [40], compare Chapter 6).
4.3. Impact on Existing Voltage Regulation Schemes
“In general, an attempt by a DR (Author´s note: distributed resource) to regulate distribution system voltage can conflict with existing voltage regulation schemes applied by the utility.”[41] This quote (from 2008) is taken from the IEEE working group on distributed generation integration. In fact, several studies show that distributed generation with or without reactive power control can affect the operation of conventional voltage regulators ([42]-[46]). For example, an inadequate control of voltage regulators (VR) operating in line drop compensation mode can occur under reverse power flow conditions ([43]-[45]). The impact of distributed generation on the operation of voltage regulators may differ strongly by the applied control strategy of the DGs, the voltage regulators and the grid configurations. In the previous section, it is shown that reactive control by DGs can significantly increase the reactive power flow in distribution grids. This additional reactive power flow needs to be taken into consideration in the planning and operational process of voltage regulators (e.g. maximum and minimum tap step, set values). Several studies have analysed the solar variability (e.g. [62], [64]) and have shown how fast PV active power output can change within different time intervals and different grid regions. Therefore, the application of a reactive power control for a variable energy source (e.g. PV), can also increase the reactive power fluctuations and ramp rates in the grid. Figure 14 shows an example from a case study [46] of a real German MV grid with a high PV penetration. All reactive power control strategies of the PV systems lead to an increase of reactive power ramp rates at the HV/MV transformer. The highest ramp rates were determined for the cosφ(P) control of the PV systems. For the Q(U) control the reactive power ramp rates are dependent on the voltage profiles in the grid. The impact of PV active and reactive power variations on the grid voltage depends strongly on the electrical characteristic of each grid node (especially R/X ratio and short circuit power). In Figure 3 it is shown that PV reactive power control can partially or completely compensate the voltage rise caused by PV active power feed in, for a wide range of different grid node and PV configurations. However, at grid nodes with a small R/X ratio (R/X << 1) PV reactive power control can also lead to an overcompensation and to additional voltage variations. Therefore, depending on the location of the voltage regulators (e.g. R/X ratio and short circuit power) and the applied control configurations, PV reactive power control can either increase or decrease the number of operations of the voltage regulators.
Voltage regulation in the distribution grid is traditionally performed by on-load tap changers (OLTC) of transformers, line voltage regulators and/or switched capacitor banks. Examples of common control strategies are voltage based methods or line drop compensation. An increase of tap/ switching operations can shorten the lifetime and maintenance intervals of the voltage regulators.

13
-2
-1
0
1
2
cosϕ
=1co
sϕ=0
,95
cosϕ
(P)
Q(U
)Q
(U)*
cosϕ
=1co
sϕ=0
,95
cosϕ
(P)
Q(U
)Q
(U)*
cosϕ
=1co
sϕ=0
,95
cosϕ
(P)
Q(U
)Q
(U)*
cosϕ
=1co
sϕ=0
,95
cosϕ
(P)
Q(U
)Q
(U)*
Ch
ange
in
Re
acti
ve
Po
we
r at
HV
/MV
Tra
nsf
orm
er
[MV
ar]
99th percentile
95th percentile
80th percentile
3 s 30 s 60 s 10 min
PV RPC control
Ramp Rate Interval
Po
wer
flo
w a
t H
V/M
V t
ran
sfo
rmer
[M
W, M
var]
Time of the day PV RPC strategy
Ch
ange
in r
eact
ive
po
wer
at
HV
/MV
tra
nsf
orm
er [
Mva
r]P
Q (PV with cosphi=1) Q (PV with cosphi(P))
Figure 14: Active and reactive power flow (left) and ramp rates of reactive power (right) at the HV/MV transformer for a partially cloudy day (German Case Study) [46] (*Q(U) control is simulated with two different voltage profiles a the HV-connection point of the grid)
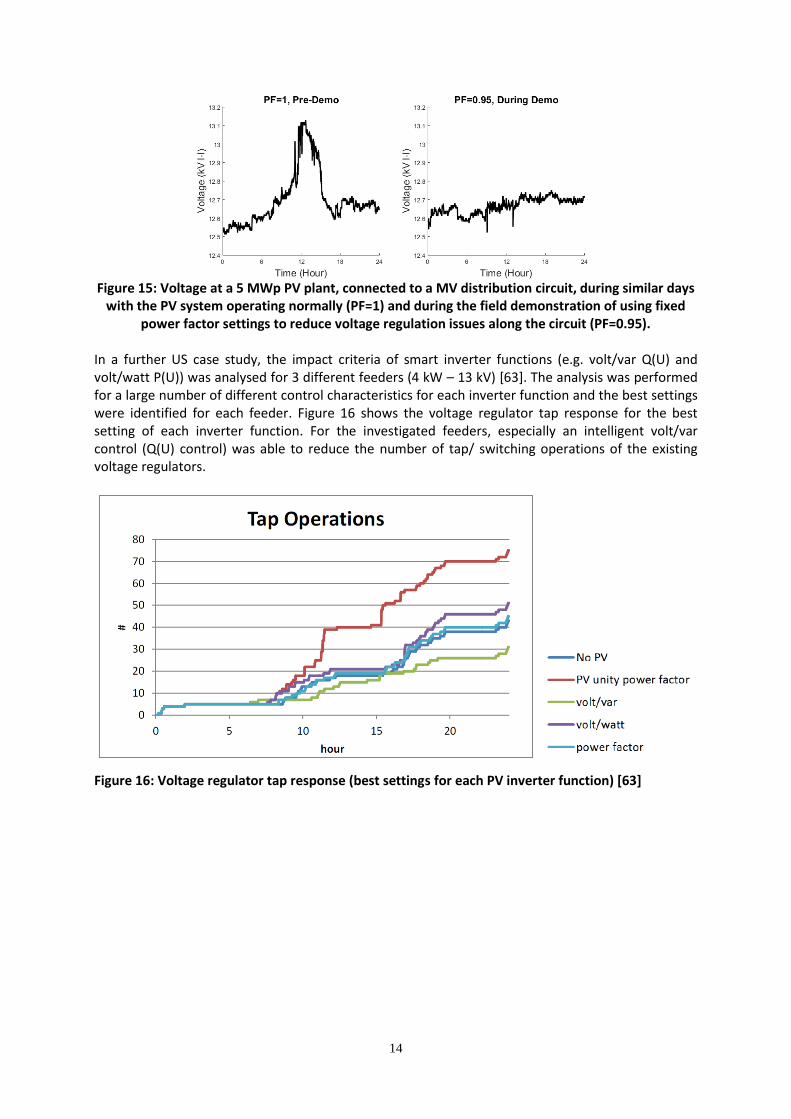
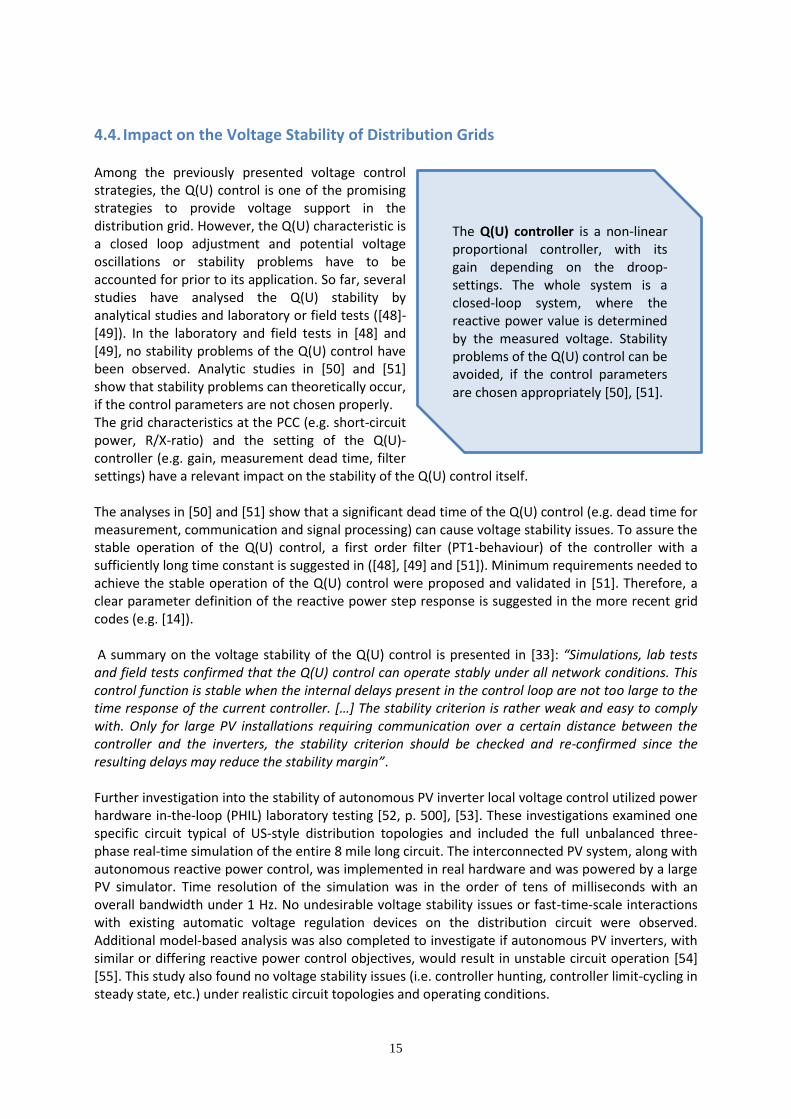
In the German case study [46] the impact of PV reactive power control on the on-load tap changer control of a HV/MV transformer was analysed. The OLTC transformer controlled the voltage at the MV substation busbar (R/X ratio < 0.1), which is especially sensitive to the reactive power flow over the HV/MV transformer. All reactive power control strategies could effectively reduce the maximum voltage magnitude in the grid, compared with the baseline scenario (PV at unity power factor). However, the number of OLTC operations increased when using a cosϕ (P) or a fixed cosϕ control of the PV systems. In contrast, the applied Q(U) control showed just a minor increase of OLTC operations. The voltage dependency of the Q(U) control had also a smoothing effect on voltage variations at the MV substation busbar [46]. A US case study, including the demonstration of using fixed power factor control to mitigate voltage regulation issues due to high-penetration PV integration, on a 47 mile long MV (12kV) circuit with relatively sparse LV customer-level transformers (as is typical in the US) showed significant reductions in voltage rise along the circuit during periods of PV plant operation [47]. Figure 15 shows the PV plant’s point of common coupling voltage (MV) for the day prior to the beginning of the field demonstration and a day during the field demonstration. Voltage regulation, which is accomplished entirely with switched capacitor banks (i.e. no OLTC or voltage regulators present on the circuit), operation returned to pre-integration operation as the switched capacitor banks are voltage controlled.
14
Figure 15: Voltage at a 5 MWp PV plant, connected to a MV distribution circuit, during similar days
with the PV system operating normally (PF=1) and during the field demonstration of using fixed power factor settings to reduce voltage regulation issues along the circuit (PF=0.95).
In a further US case study, the impact criteria of smart inverter functions (e.g. volt/var Q(U) and volt/watt P(U)) was analysed for 3 different feeders (4 kW – 13 kV) [63]. The analysis was performed for a large number of different control characteristics for each inverter function and the best settings were identified for each feeder. Figure 16 shows the voltage regulator tap response for the best setting of each inverter function. For the investigated feeders, especially an intelligent volt/var control (Q(U) control) was able to reduce the number of tap/ switching operations of the existing voltage regulators.
Figure 16: Voltage regulator tap response (best settings for each PV inverter function) [63]
15
4.4. Impact on the Voltage Stability of Distribution Grids
Among the previously presented voltage control strategies, the Q(U) control is one of the promising strategies to provide voltage support in the distribution grid. However, the Q(U) characteristic is a closed loop adjustment and potential voltage oscillations or stability problems have to be accounted for prior to its application. So far, several studies have analysed the Q(U) stability by analytical studies and laboratory or field tests ([48]-[49]). In the laboratory and field tests in [48] and [49], no stability problems of the Q(U) control have been observed. Analytic studies in [50] and [51] show that stability problems can theoretically occur, if the control parameters are not chosen properly. The grid characteristics at the PCC (e.g. short-circuit power, R/X-ratio) and the setting of the Q(U)-controller (e.g. gain, measurement dead time, filter settings) have a relevant impact on the stability of the Q(U) control itself. The analyses in [50] and [51] show that a significant dead time of the Q(U) control (e.g. dead time for measurement, communication and signal processing) can cause voltage stability issues. To assure the stable operation of the Q(U) control, a first order filter (PT1-behaviour) of the controller with a sufficiently long time constant is suggested in ([48], [49] and [51]). Minimum requirements needed to achieve the stable operation of the Q(U) control were proposed and validated in [51]. Therefore, a clear parameter definition of the reactive power step response is suggested in the more recent grid codes (e.g. [14]). A summary on the voltage stability of the Q(U) control is presented in [33]: “Simulations, lab tests and field tests confirmed that the Q(U) control can operate stably under all network conditions. This control function is stable when the internal delays present in the control loop are not too large to the time response of the current controller. […] The stability criterion is rather weak and easy to comply with. Only for large PV installations requiring communication over a certain distance between the controller and the inverters, the stability criterion should be checked and re-confirmed since the resulting delays may reduce the stability margin”. Further investigation into the stability of autonomous PV inverter local voltage control utilized power hardware in-the-loop (PHIL) laboratory testing [52, p. 500], [53]. These investigations examined one specific circuit typical of US-style distribution topologies and included the full unbalanced three-phase real-time simulation of the entire 8 mile long circuit. The interconnected PV system, along with autonomous reactive power control, was implemented in real hardware and was powered by a large PV simulator. Time resolution of the simulation was in the order of tens of milliseconds with an overall bandwidth under 1 Hz. No undesirable voltage stability issues or fast-time-scale interactions with existing automatic voltage regulation devices on the distribution circuit were observed. Additional model-based analysis was also completed to investigate if autonomous PV inverters, with similar or differing reactive power control objectives, would result in unstable circuit operation [54] [55]. This study also found no voltage stability issues (i.e. controller hunting, controller limit-cycling in steady state, etc.) under realistic circuit topologies and operating conditions.
The Q(U) controller is a non-linear proportional controller, with its gain depending on the droop-settings. The whole system is a closed-loop system, where the reactive power value is determined by the measured voltage. Stability problems of the Q(U) control can be avoided, if the control parameters are chosen appropriately [50], [51].
16
5. Combined Active and Reactive Power Control
Besides local reactive power control, the PV systems can provide local active power curtailment for means of voltage support. For example, in Austria and Germany especially two approaches for local active power curtailment have been discussed:
Q(U)/P(U) control: combined Volt-Var and Volt-Watt function (e.g. Figure 18)
Fixed 70 % power limitation: Active power feed-in of PV systems is limited to 70 % of the
installed PV capacity (e.g. German Renewable Energy Source Act (EEG 2014 §9))
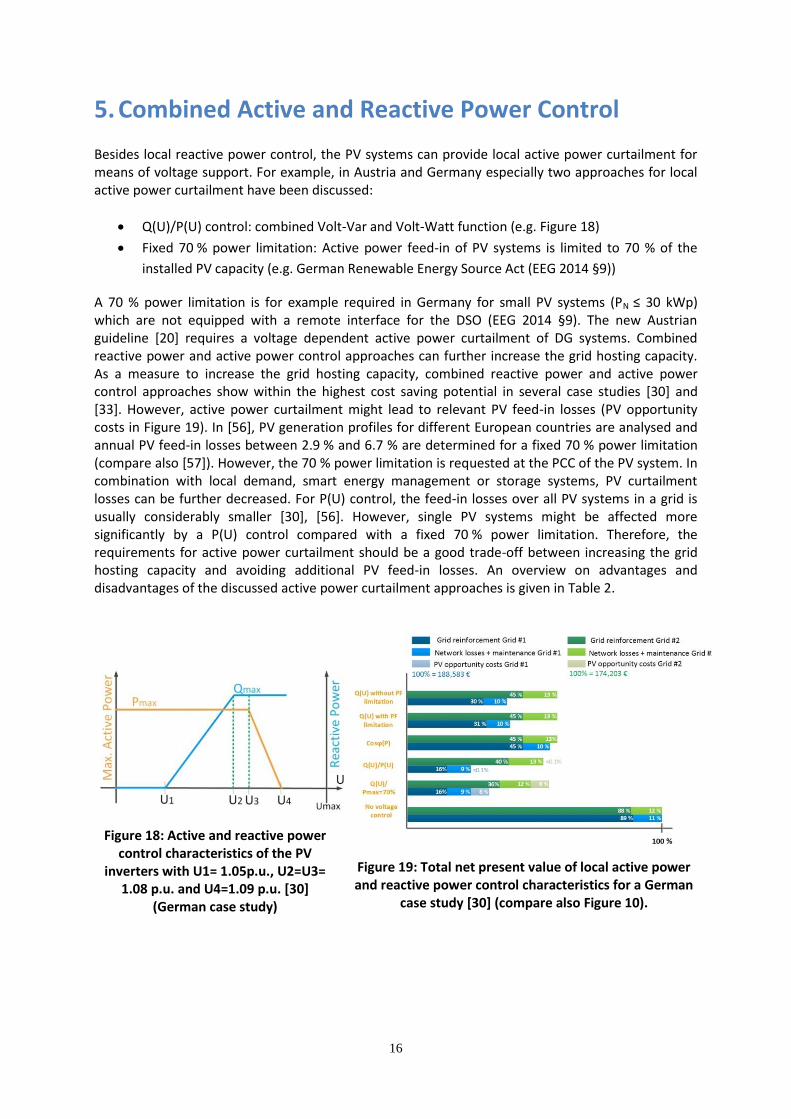
A 70 % power limitation is for example required in Germany for small PV systems (PN ≤ 30 kWp) which are not equipped with a remote interface for the DSO (EEG 2014 §9). The new Austrian guideline [20] requires a voltage dependent active power curtailment of DG systems. Combined reactive power and active power control approaches can further increase the grid hosting capacity. As a measure to increase the grid hosting capacity, combined reactive power and active power control approaches show within the highest cost saving potential in several case studies [30] and [33]. However, active power curtailment might lead to relevant PV feed-in losses (PV opportunity costs in Figure 19). In [56], PV generation profiles for different European countries are analysed and annual PV feed-in losses between 2.9 % and 6.7 % are determined for a fixed 70 % power limitation (compare also [57]). However, the 70 % power limitation is requested at the PCC of the PV system. In combination with local demand, smart energy management or storage systems, PV curtailment losses can be further decreased. For P(U) control, the feed-in losses over all PV systems in a grid is usually considerably smaller [30], [56]. However, single PV systems might be affected more significantly by a P(U) control compared with a fixed 70 % power limitation. Therefore, the requirements for active power curtailment should be a good trade-off between increasing the grid hosting capacity and avoiding additional PV feed-in losses. An overview on advantages and disadvantages of the discussed active power curtailment approaches is given in Table 2.
Figure 18: Active and reactive power control characteristics of the PV
inverters with U1= 1.05p.u., U2=U3= 1.08 p.u. and U4=1.09 p.u. [30]
(German case study)
Figure 19: Total net present value of local active power and reactive power control characteristics for a German
case study [30] (compare also Figure 10).

17
Table 2: Advantages and disadvantages of local active power control approaches (based on the findings in [56])
Advantages Disadvantages
Fixed 70% Power Limitation
Fair: all PV systems equally affected
Simple grid planning
Simple forecast of feed-in losses
Function available in modern inverters
Power curtailment also at nodes and at
times when no voltage support is
required
Usually higher PV feed-in losses
compared to P(U) control
P(U) control
Power curtailment only at nodes and at
times when voltage support is required
Function available in modern inverters
Not fair: especially PV systems at weak
connection points affected
More complex grid planning
Difficult forecast of feed-in losses
Feed-in losses difficult to determine
6. New Trends
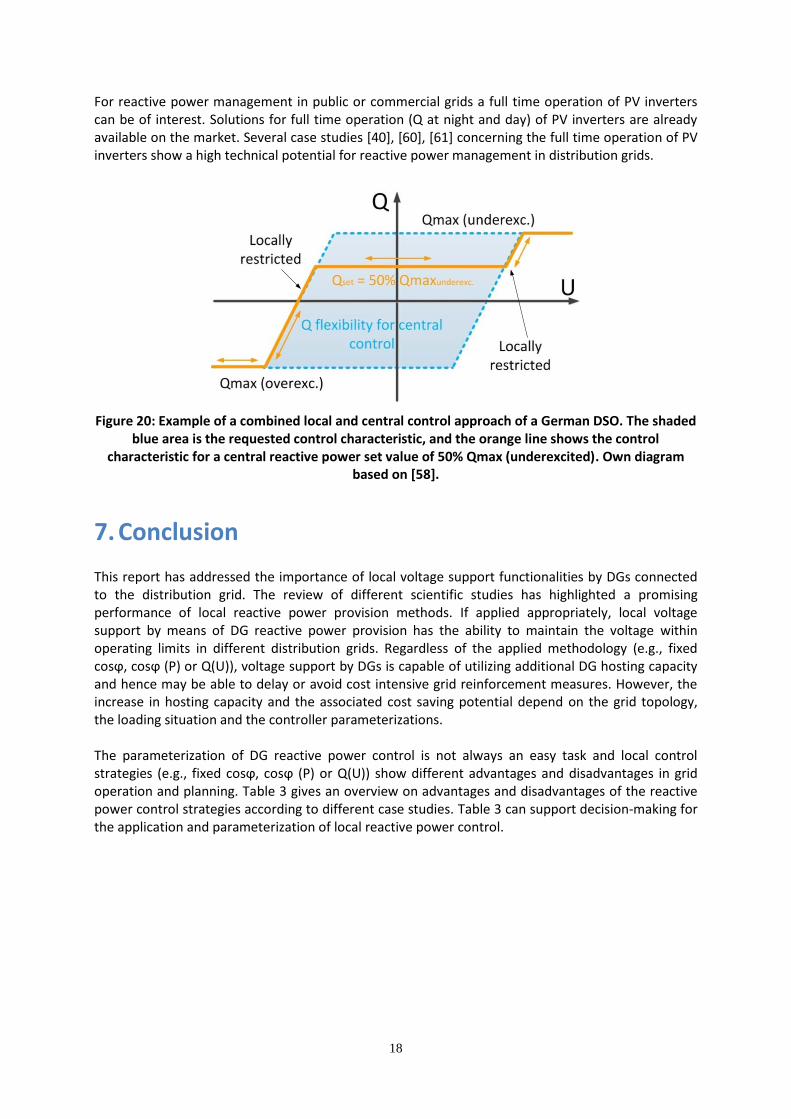
In several studies voltage support by DG has been identified as an effective measure for maintaining the voltage of distribution grids within its limitations. Today, active voltage support by DGs is required in grid codes and guidelines in several countries and by various DSOs. Voltage support by DG is on its way to becoming a state of the art technology. A need for research and development is identified to further standardize DG parameterization and operation. First hand experiences from German DSOs and an Austrian DSO on DG reactive power control are presented in [14]. The study reveals that a noticeable number of DGs are not operating in full compliance with the relevant grid codes and guidelines. Especially, the parameterization of the reactive power controller is an error-sensitive task, due to the lack of clear parameter definitions and the diversity of manufacturer-specific GUIs. Therefore, standardized interfaces and parameter settings can help to avoid parameterization errors in the field. In future, the DG systems will provide additional ancillary services to the network operator (TSO and DSO) like for example frequency control, congestion management, reserve capacity, volt/var coordination or black start capability. The IT-infrastructure will be widely developed in the future distribution grid and decentralized as well as central control structures will become more and more relevant. However, due to the fast reaction time and the possible independence of the communication infrastructure, local control strategies will also play a decisive role in any future grid. For example new control concepts by German DSOs combine local and central control structures for voltage support and reactive power management [58], [59]. In these concepts, the DG systems are operated through local voltage control; however their local control characteristics can be configured by a central controller, which allows a globally optimized operation of the DG systems. The combination of local control and central control characteristics enables fast responses and an overall optimized operation of the DG systems. Figure 19 shows the requested reactive power characteristic by a German DSO [58]. Within the light blue area the remote reactive power set points by the DSO are adjusted by the DG system. However, in case of very low or very high voltages at the PCC the reactive power provision by the DG system is limited by a local Q(U) characteristic (dashed blue line in Figure 19).
18
For reactive power management in public or commercial grids a full time operation of PV inverters can be of interest. Solutions for full time operation (Q at night and day) of PV inverters are already available on the market. Several case studies [40], [60], [61] concerning the full time operation of PV inverters show a high technical potential for reactive power management in distribution grids.
Figure 20: Example of a combined local and central control approach of a German DSO. The shaded blue area is the requested control characteristic, and the orange line shows the control
characteristic for a central reactive power set value of 50% Qmax (underexcited). Own diagram based on [58].
7. Conclusion
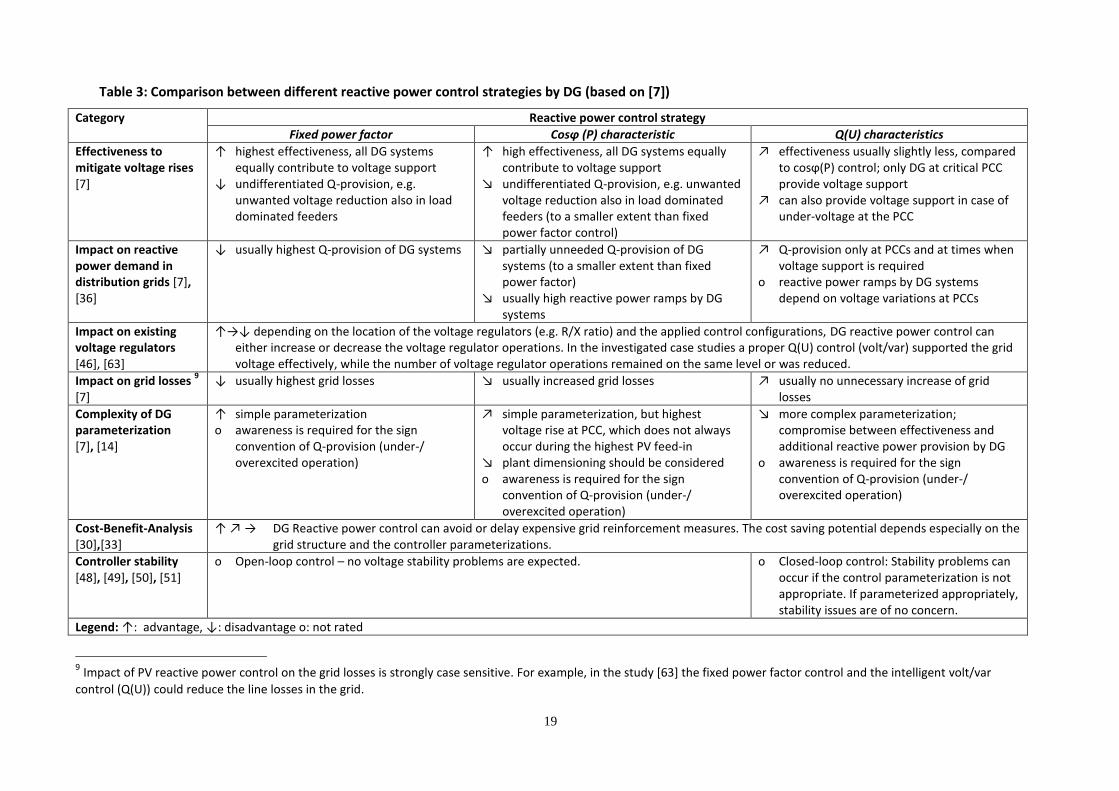
This report has addressed the importance of local voltage support functionalities by DGs connected to the distribution grid. The review of different scientific studies has highlighted a promising performance of local reactive power provision methods. If applied appropriately, local voltage support by means of DG reactive power provision has the ability to maintain the voltage within operating limits in different distribution grids. Regardless of the applied methodology (e.g., fixed cosϕ, cosϕ (P) or Q(U)), voltage support by DGs is capable of utilizing additional DG hosting capacity and hence may be able to delay or avoid cost intensive grid reinforcement measures. However, the increase in hosting capacity and the associated cost saving potential depend on the grid topology, the loading situation and the controller parameterizations. The parameterization of DG reactive power control is not always an easy task and local control strategies (e.g., fixed cosϕ, cosϕ (P) or Q(U)) show different advantages and disadvantages in grid operation and planning. Table 3 gives an overview on advantages and disadvantages of the reactive power control strategies according to different case studies. Table 3 can support decision-making for the application and parameterization of local reactive power control.
19
Table 3: Comparison between different reactive power control strategies by DG (based on [7])
Category Reactive power control strategy
Fixed power factor Cosϕ (P) characteristic Q(U) characteristics
Effectiveness to mitigate voltage rises [7]
↑ highest effectiveness, all DG systems equally contribute to voltage support
↓ undifferentiated Q-provision, e.g. unwanted voltage reduction also in load dominated feeders
↑ high effectiveness, all DG systems equally contribute to voltage support
↘ undifferentiated Q-provision, e.g. unwanted voltage reduction also in load dominated feeders (to a smaller extent than fixed power factor control)
↗ effectiveness usually slightly less, compared to cosϕ(P) control; only DG at critical PCC provide voltage support
↗ can also provide voltage support in case of under-voltage at the PCC
Impact on reactive power demand in distribution grids [7], [36]
↓ usually highest Q-provision of DG systems
↘ partially unneeded Q-provision of DG systems (to a smaller extent than fixed power factor)
↘ usually high reactive power ramps by DG systems
↗ Q-provision only at PCCs and at times when voltage support is required
o reactive power ramps by DG systems depend on voltage variations at PCCs
Impact on existing voltage regulators [46], [63]
↑→↓ depending on the location of the voltage regulators (e.g. R/X ratio) and the applied control configurations, DG reactive power control can either increase or decrease the voltage regulator operations. In the investigated case studies a proper Q(U) control (volt/var) supported the grid voltage effectively, while the number of voltage regulator operations remained on the same level or was reduced.
Impact on grid losses 9
[7] ↓ usually highest grid losses
↘ usually increased grid losses
↗ usually no unnecessary increase of grid losses
Complexity of DG parameterization [7], [14]
↑ simple parameterization o awareness is required for the sign
convention of Q-provision (under-/ overexcited operation)
↗ simple parameterization, but highest voltage rise at PCC, which does not always occur during the highest PV feed-in
↘ plant dimensioning should be considered o awareness is required for the sign
convention of Q-provision (under-/ overexcited operation)
↘ more complex parameterization; compromise between effectiveness and additional reactive power provision by DG
o awareness is required for the sign convention of Q-provision (under-/ overexcited operation)
Cost-Benefit-Analysis [30],[33]
↑ ↗ → DG Reactive power control can avoid or delay expensive grid reinforcement measures. The cost saving potential depends especially on the grid structure and the controller parameterizations.
Controller stability [48], [49], [50], [51]
o Open-loop control – no voltage stability problems are expected. o Closed-loop control: Stability problems can occur if the control parameterization is not appropriate. If parameterized appropriately, stability issues are of no concern.
Legend: ↑: advantage, ↓: disadvantage o: not rated
9 Impact of PV reactive power control on the grid losses is strongly case sensitive. For example, in the study [63] the fixed power factor control and the intelligent volt/var
control (Q(U)) could reduce the line losses in the grid.

20
References
[1] E. M. Galán et al., “Renewables 2015: Global status report - Key findings,” REN21, Paris, France, Rep., 2015.
[2] H. Wirth, “Recent Facts about Photovoltaics in Germany,” Fraunhofer Inst. for Solar Energy Systems ISE, Freiburg, Rep., Dec. 2015 [Online]. Available: http://www.ise.fraunhofer.de/en/publications/veroeffentlichungen-pdf-dateien-en/studien-und-konzeptpapiere/recent-facts-about-photovoltaics-in-germany.pdf [Accessed: 5 Dec. 2016]
[3] E. Martinot (19 Feb 2015), “How is Germany integrating and balancing renewable energy today?,” German Energy Transition [Online]. Available : http://energytransition.de/2015/02/how-germany-integrates-renewable-energy [Accessed: 15 May. 2016]
[4] M. Braun, E. Kaempf, M. Kraiczy, "Elektrische Verteilungsnetze im Wandel," in Energietechnologien der Zukunft, M. Wietschel, S. Ullrich, P. Markewitz, F. Schulte, F. Genoese (Eds.), Wiesbaden: Springer Fachmedien Wiesbaden, 2015. http://link.springer.com/chapter/10.1007%2F978-3-658-07129-5_15
[5] G. Kerber, “Aufnahmefähigkeit von Niederspannungsverteilnetzen für die Einspeisung aus Photovoltaikkleinanlagen,” Ph.D. dissertation, Dept. Elect. Eng. and Inform. Technol., Technical Univ. of Munich, Munich, 2011.
[6] T. Stetz, F. Marten, and M. Braun, “Improved Low Voltage Grid-Integration of Photovoltaic Systems in Germany,” IEEE Trans. Sustain. Energy, vol. 4, no. 2, pp. 534–542, Apr. 2013.
[7] M. Heidl et al., “morePV2grid - More functionalities for increased integration of PV into grid,” Rep., Dec. 2013.
[8] M. Braun, “Provision of Ancillary Services by Distributed Generators,” Ph.D. dissertation, Elect. Eng. and Comput. Sci., Univ. of Kassel, 2008.
[9] J. Von Appen, M. Braun, T. Stetz, K. Diwold, and D. Geibel, “Time in the Sun: The Challenge of High PV Penetration in the German Electric Grid,” IEEE Power & Energy Mag., vol. 11, no. 2, pp. 55–64, Mar. 2013.
[10] A. Einfalt, F. Zeilinger, R. Schwalbe, B. Bletterie, and S. Kadam, “Controlling active low voltage distribution grids with minimum efforts on costs and engineering,” in Industrial Electronics Society, IECON 2013 - 39th Annual Conference of the IEEE, Vienna, 2013, pp. 7456-7461.
[11] R. Schwalbe, M. Stifter, B. Bletterie, A. Abart, R. Pointer, and F. Herb, “DG DemoNet: impact of volt/VAR control on increasing the voltage band reserve-results from field trial validations.” in Electricity Distribution (CIRED 2013), 22nd International Conference and Exhibition, Stockholm, 2013.
[12] A. Ellis, R. Nelson, E. Von Engeln, R. Walling, J. McDowell, L. Casey, E. Seymour, W. Peter, C. Barker, and B. Kirby, “Reactive power interconnection requirements for PV and wind plants–recommendations to NERC,” Sandia Natl. Lab. Albuquerque, NM, Tech. Rep., vol. 87185, 2012.
21
[13] W. Christiansen and D. T. Johnsen, “Analysis of requirements in selected Grid Codes,” Prep. Orsted-DTU Sect. Electr. Power Eng. Tech. Univ. Den. DTU, 2006. Available : http://0-bibing.us.es.fama.us.es/proyectos/abreproy/70370/fichero/24.+Analysis+of+the+requirements+in+selected+Grid+Codes.pdf [Accessed: 15 May. 2016]
[14] M. Kraiczy, G. Lammert, T. Stetz, S. Gehler, G. Arnold, M. Braun, S. Schmidt, H. Homeyer, U. Zickler, F. Sommerwerk, and C. Elbs, “Parameterization of Reactive Power Characteristics for Distributed Generators: Field Experience and Recommendations.” in International ETG Congress 2015 - Die Energiewende, Bonn, Germany, 2015. pp.406-413.
[15] LEW-Verteilnetz GmbH: Anschlussbedingungen Mittelspannung, Augsburg, [Online] Available: http://www.lew-verteilnetz.de [Accessed: 08-Oct-2015].
[16] Bayernwerk AG: Technische Richtlinie Erzeugungsanlagen am Mittelspannungsnetz der Bayernwerk AG, [Online] Available: https://www.bayern-werk.de [Accessed: 08-Oct-2015].
[17] Netze BW GmbH: Technische Richtlinie Erzeugungsanlagen am Mittelspannungsnetz der Netze BW GmbH, 2013, [Online] Available: https://www.netze-bw.de [Accessed: 08-Oct-2015].
[18] SWU Netze GmbH: Technische Anschlussbedingungen der SWU-Netze GmbH für Erzeugungsanlagen im Netzparallelbetrieb, 2012, [Online] Available: http://www.ulm-netze.de [Accessed: 08-Oct-2015].
[19] German association for electrical, electronic & information technologies (VDE), Guideline for the Connection and Parallel Operation of Generation Units at Low Voltage Level, VDE-AR-N 4105, 2011.
[20] Technische und organisatorische Regeln für Betreiber und Benutzer von Netzen, Teil D: Besondere technische Regeln – Hauptabschnitt D4: Parallelbetrieb von Erzeugungsanlagen mit Verteilernetzen, TOR-D4, Version 2.0, Energie-Control Austria, Wien, 2016.
[21] Specifieke technische aansluitingsvoorschriften voor gedecentraliseerde productie-installaties die in parallel werken met het distributienet, C10/11 SYNERGRID, Jun-2012.
[22] L. Ji, W. Yi, W. FuBao, W. XiaoFang, A. Chao, L. Zhen, K. XiaoGang, Z. Jian, C. ZhiLei, N. ChenHui, and Z. WeiRan, “Comparative Study of Standards for Grid-connected PV system in China, the U.S. and European countries,” China Electricity Council, China Electric Power Research Institute, 2012.
[23] European Committee for Electrotechnical Standardization (CENELEC): Requirements for micro-generating plants to be connected in parallel with public low-voltage distribution networks EN 50438, 2014.
[24] Technical requirements for the connection and operation of customer installations to the high voltage network (TAB high voltage), VDE-AR-N 4120, Jan-2015.
[25] Technical guideline generating plants connected to the medium-voltage network, BDEW Technical Guideline MV DG, Jun-2008.
[26] IEEE Standard for Interconnecting Distributed Resources with Electric Power Systems, IEEE Std 1547-2003, 2014.
[27] S. Papathanassiou, N. Hatziargyriou, P. Anagnostopoulos, L. Aleixo, B. Buchholz, C. Carter-Brown, N. Drossos, B. Enayati, M. Fan, V. Gabrion, Bok-Nam Ha, L. Karstenti, J. Malý,

22
W.Namgung, J. Pecas-Lopes, J. R. Pillai, T. Solvang, S. Verma, and S. Papathanassiou, “Capacity of distribution feeders for hosting DER. ”, CIGRE publication, Technical brochure, 2014.
[28] C. Schwaegerl, M. H. Bollen, K. Karoui, and A. Yagmur, “Voltage control in distribution systems as a limitation of the hosting capacity for distributed energy resources,” in Electricity Distribution, 2005. CIRED 2005. 18th International Conference and Exhibition, Turin, Italy, 2005, pp. 1–5.
[29] C. Bucher, Göran Andersson, and Lukas Küng, “Increasing the PV hosting capacity of distribution power grids – a comparison of seven methods,” in 28th European Photovoltaic Solar Energy Conference and Exhibition, Villepinte, France, 2013, pp. 4231 - 4235.
[30] T. Stetz, “Autonomous Voltage Control Strategies in Distribution Grids with Photovoltaic Systems,” Ph.D. dissertation, Elect. Eng. and Comput. Sci., Univ. of Kassel, Germany, 2013.
[31] B. Bletterie, S. Kadam, A. Zegers, and Z. Miletic, “Optimisation of LV networks with high photovoltaic penetration—Balancing the grid with smart meters,” in PowerTech 2013 IEEE Grenoble, Grenoble, 2013, pp. 1 – 6.
[32] B. Bletterie, S. Kadam, A. Zegers, and Z. Miletic, “On the effectiveness of voltage control with PV inverters in unbalanced low voltage networks,” in 23rd International Conference on Electricity Distribution, Lyon, Jun, 2015, CIRED, paper 1082.
[33] C. Dierckxsens, A. Woyte, B. Bletterie, A. Zegers, W. Deprez, A. Dexters, K. V. Roey, J. Lemmens, R. Poosen, J. Lowette, Koen Nulens, Yehia tarek Fawzy, Boštjan Blažic, Blaž Uljanic, and Marko Kolenc, “Cost-effective integration of photovoltaics in existing distribution grids: results and recommendations,” MetaPV, Limburg, Belgium, Final Rep., 2015.
[34] A.-C. Agricola, H. Seidl, S. Mischinger, P. C. Rehtanz, M. Greve, D. U. Häger, D. Hilbrich, S. Kippelt, A. Kubis, V. Liebenau, T. Noll, S. Rüberg, T. Schlüter, J. Schwippe, C. Spieker, and J. Teuwsen, “dena Ancillary Services Study 2030. Security and reliability of a power supply with a high percentage of renewable energy,” Deutsche Energie-Agentur GmbH (dena) – German Energy Agency, Berlin, Germany, Final Rep., Nov. 2014.
[35] S. Dierkes, A. Wagner, J. Eickmann, and A. Moser, “Wirk- und Blindleistungsverhalten von Verteilungsnetzen mit hoher Durchdringung dezentraler Erzeugung,” in Internationaler ETG-Kongress 2013 – Energieversorgung auf dem Weg nach 2050, Berlin, 2013.
[36] M. Kraiczy, T. Stetz, H. Wang, S. Schmidt, M. Braun, and M. Braun, “Entwicklung des Blindleistungsbedarfs eines Verteilnetzes bei lokaler Blindleistungsregelung der PV-Anlagen im Niederspannungsnetz,” in Von Smart Grids zu Smart Markets 2015, Kassel, Germany, Mar-2015.
[37] P. Vermeyen and P. Lauwers, “Managing Reactive Power in MV Distribution Grids containing Distributed Generation,” in 23rd International Conference on Electricity Distribution - CIRED Conference, Lyon, 2015.
[38] ENTSO-E, “Network code on demand connection, article 16: Reactive power requirements,” 2012.
[39] H. Wang, T. Stetz, M. Kraiczy, K. Diwold, S. Schmidt, and M. Braun, “Zentrales Blindleistungsmanagement für die Netzverknüpfungspunkte Hochspannung/Mittelspannung der Bayernwerk AG.” in Von Smart Grids zu Smart Markets 2015, Kassel, Germany, Mar. 2015.
23
[40] H. Barth, D. Hidalgo, A. Pohlemann, M. Braun, L. H. Hansen, and H. Knudsen, “Technical and Economical Assessment of reactive Power provision from distributed generators: case study area of East Denmark,” in PowerTech (POWERTECH), 2013 IEEE Grenoble, 2013, pp. 1–6.
[41] R. A. Walling, R. Saint, R. C. Dugan, J. Burke, and L. A. Kojovic, “Summary of Distributed Resources Impact on Power Delivery Systems,” IEEE Trans. Power Deliv., vol. 23, no. 3, pp. 1636–1644, Jul. 2008.
[42] T.-H. Chen, M. S. Wang, and N. C. Yang, “Impact of Distributed Generation on Voltage Regulation by ULTC Transformer using Various Existing Methods,” in Proceedings of the 7th WSEAS International Conference on Power Systems, Beijing, China, 2007, pp. 158–163.
[43] L. A. Kojovic, “Modern techniques to study voltage regulator - DG interactions in distribution systems,” in 2008 IEEE/PES Transmission and Distribution Conference and Exposition, Chicago, IL, 2008, pp. 1 – 6.
[44] L. Kojovic, “Impact of DG and voltage regulator interaction on distribution system voltage regulation,” in 17th International Conference on Electricity Distribution, Barcelona, Spain, May 2003, CIRED, paper 4.31.
[45] Y. P. Agalgaonkar, B. C. Pal, and R. A. Jabr, “Distribution Voltage Control Considering the Impact of PV Generation on Tap Changers and Autonomous Regulators,” IEEE Trans. Power Syst., vol. 29, no. 1, pp. 182–192, Jan. 2014.
[46] M. Kraiczy, M. Braun, G. Wirth, S. Schmidt, and J. Brantl, “Interferences between Local Voltage Control Strategies of a HV/MV-Transformer and Distributed Generators,” in 29th European Photovoltaic Solar Energy Conference and Exhibition, Paris, 2013.
[47] B. Mather and A. Gebeyehu, “Field Demonstration of Using Advanced PV Inverter Functionality to Mitigate the Impacts of High-Penetration PV Grid Integration on the Distribution System,” in proc. of IEEE Photovolt. Spec. Conf., New Orleans, LA, 2015.
[48] R. Pardatscher, R. Witzmann, E. Christian, and R. Nenning, “Einsatz der Q(U)-Regelung bei der Vorarlberger Energienetze GmbH,” Technical Univ. of Munich, Vorarlberger Energienetze GmbH, Final Rep., Jun. 2014.
[49] P. Esslinger and R. Witzmann, “Evaluation of reactive power control concepts for PV inverters in low-voltage grids,” in Integration of Renewables into the Distribution Grid, CIRED 2012 Workshop, 2012, pp. 1–4.
[50] M. Hau, M. Wecker, and M. Shan, “Reactive Power Control for Parallel Wind Parks Comprising Q(U) Characteristics.,” in European Wind Energy Conference and Exhibition (EWEC), Copenhagen, Denmark, 2012, pp.1012-1020.
[51] F. Andren, B. Bletterie, S. Kadam, P. Kotsampopoulos, and C. Bucher, “On the Stability of Local Voltage Control in Distribution Networks With a High Penetration of Inverter-Based Generation,” IEEE Trans. Ind. Electron., vol. 62, no. 4, pp. 2519–2529, Apr. 2015.
[52] J. Langston, K. Schoder, M. Steurer, O. Faruque, J. Hauer, F. Bogdan, R. Bravo, B. Mather, and F. Katiraei, “Power hardware-in-loop testing of a 500 kW photovoltaic array inverter,” in proc. of IEEE Ind. Electron. Conf., Montreal, QC, 2012.

24
[53] B. Mather, M. Kromer, and L. Casey, “Advanced photovoltaic inverter functionality verification using 500kW Power Hardware-in-Loop (PHIL_ complete system laboratory testing),” in proc. of IEEE Innov. Smart Grid Tech. Conf., Washington, DC, 2013.
[54] F. Katiraei, D. Paradis, and B. Mather, “Comparative analysis of time-series studies and transient simulations for impact assessment of PV integration on reduced IEEE 8500 node feeder,” in proc. of IEEE Power and Energy Soc. Gener. Meet., Vancouver, BC, 2013.
[55] B. Mather, S. Shah, B. L. Norris, J. H. Dise, L. Yu, D. Paradis, F. Katiraei, R. Seguin, D. Costyk, J. Woyak, J. Jung, K. Russell, and R. Broadwater, “NREL/SCE High Penetration PV Integration Project: FY13 Annual Report,” NREL Tech., annu. Rep., TP-5D00-61263, Jun. 2014.
[56] B. Bletterie, S. Kadam, W. Friedl, and R. Bründlinger, “Potential der Wirkleistungsbegrenzung zur Erhöhung der Erzeugungsaufnahmefähigkeit in Verteilernetzen,” in Symposium Energieinnovation, Graz, Austria, 2016.
[57] J. v. Appen, M. Braun, B. Zinßer, and D. Stellbogen, “Leistungsbegrenzung bei PV-Anlagen - Anpassung der Modellierungsmethoden und Vergleich verschiedener Standorte,” in 27th European Photovoltaic Solar Energy Conference and Exhibition, 2012.
[58] Technische Richtlinie Erzeugungsanlagen am Mittelspannungsnetz der Bayernwerk AG, Bayernwerk AG, Regensburg, Germany, Jul-2015.
[59] W. Becker, R. Halbauer, and K. Pfeiffer, “Ancillary services provided from DSO networks - how to handle volatilie dispersed generation combined with highly loaded network equipment,” in International ETG Congress 2015, Bonn, 2015.
[60] G. Monfredini, D. Martini, S. Grotti, S. Soldani, and M. Trova, “PV Inverter Extended Grid Services – From ‘Day-Time’ to ‘Full-Time’ Operation,” in 27th European Photovoltaic Solar Energy Conference and Exhibition, Frankfurt, 2012, pp. 3811 – 3821.
[61] D. Premm, S. Schmidt, F.X. Denk, M. Pfalzgraf, D. Mende, C. Tschendel, and S. Aust, “Commercial PV Systems - Self-Consumption, Reactive Power Management and Grid Integration,” in VDE- Congr. 2014 - Smart Cities – Intelligente Lösungen für das Leben in der Zukunft, Frankfurt, 2014.
[62] J. Remund, C. Calhau, L. Perret, D. Marcel, "Characterization of the spatio-temporal variations and ramp rates of solar radiation and PV," Report IEA-PVPS T14-05:2015, August 2015, [Online] Available: http://www.iea-pvps.org/index.php?id=336 [Accessed: 08-Jun-2015]
[63] Smart Grid Ready PV Inverters with Utility Communication: Results from Field Demonstrations. EPRI, Palo Alto, CA: 2016. 3002008557
[64] C. Trueblood, S. Coley, T. Key, L. Rogers, A. Ellis, C. Hansen, E. Philpot, "PV Measures Up for Fleet Duty," IEEE Power and Energy Magazine (Volume 11, Issue: 2), February 2013, DOI: 10.1109/MPE.2012.2234405

25
For further information about the IEA – Photovoltaic Power Systems Programme and Task 14 publications,
please visit www.iea-pvps.org.