DNB W - GRETA · 2018-01-12 · DNB W ORKING P APER DNB Working Paper No. 369 / January 2013...
43
DNB W ORKING P APER DNB Working Paper No. 369 / January 2013 Arciero, Heijmans, Heuver, Massarenti, Picillo,Vacirca How to measure the unsecured money market? The Eurosystem’s implementation and validation using TARGET2 data
Transcript of DNB W - GRETA · 2018-01-12 · DNB W ORKING P APER DNB Working Paper No. 369 / January 2013...

DN
B W
OR
KIN
G P
AP
ER
DNB Working PaperNo. 369 / January 2013
Arciero, Heijmans, Heuver, Massarenti, Picillo,Vacirca
How to measure the unsecuredmoney market? The Eurosystem’simplementation and validation
using TARGET2 data

De Nederlandsche Bank NV
P.O. Box 98
1000 AB AMSTERDAM
The Netherlands
Working Paper No. 369
January 2013
How to measure the unsecured money market? The Eurosystem’s implementation and validation using TARGET2 data
Luca Arciero, Ronald Heijmans, Richard Heuver, Marco Massarenti, Cristina Picillo and Francesco Vacirca *
* Views expressed are those of the authors and do not necessarily reflect official
positions of De Nederlandsche Bank.
How to measure the unsecured money market? The
Eurosystem’s implementation and validation using TARGET2
data
Luca Arciero Ronald Heijmans Richard Heuver Marco MassarentiCristina Picillo Francesco Vacirca ∗
Thursday 31st January, 2013
Abstract
This paper develops a methodology, based on Furfine (1999), to identify unsecured interbankmoney market loans from transaction data of the most important euro processing payment system,TARGET2, for maturity ranging from one day (overnight) up to three months. The implementa-tion has been verified with (i) interbank money market transactions executed on the Italian tradingplatform e-MID and (ii) individual reporting by the EONIA panel banks. The Type 2 (false neg-ative) error for the best performing algorithm setup is equal to 0.92%. The different stages of theglobal financial crisis and of the sovereign debt crises are clearly visible in the interbank moneymarket, characterised by significant drops in the turnover. We find aggregated interest rates veryclose to the EONIA but we observe high heterogeneity across countries and market participants.
Keywords: euro interbank money market, Furfine, TARGET2, financial stability, EONIA
JEL Codes: E42, E44, E58, G01
∗Luca Arciero: Banca d’Italia, Market and Payment System Oversight Department, e-mail:[email protected]; Ronald Heijmans: De Nederlandsche Bank, Cash and Payment Systems Division,e-mail: [email protected]; Richard Heuver: De Nederlandsche Bank, Cash and Payment Systems Di-vision, e-mail: [email protected]; Marco Massarenti: European Central Bank, Oversight Division email:[email protected]; Cristina Picillo: Banca d’Italia, Market and Payment System Oversight Depart-ment, e-mail: [email protected]; Francesco Vacirca: Banca d’Italia, Payment System Department,e-mail: [email protected]. We thank Ron Berndsen, Hans Brits and Matti Hellqvist for reviews of earlyversions of the paper and the colleagues at the ECB who worked together in the early stage of the money market project:Carlos Garcia de Andoain Hidalgo, Florian Heider, Joanna McLafferty, Patrick Papsdorf and Sara Testi. We would alsolike to thank for their comments participants at the 2nd CPSS workshop on payment monitoring indicators (BIS) andparticipants at the first joint Financial Stability Committee-Payment and Settlement Systems Committee workshop (ECB).The views expressed in this paper are those of the authors and do not necessarily represent those of the Banca d’Italia, DeNederlandsche Bank or ECB. All errors and/or omissions are ours.

1 Introduction
An efficient interbank money market is essential for the stability of the financial system and plays a
critical role in the transmission of monetary policy. After the failure of Lehman Brothers in the fall
of 2008, banks became increasingly reluctant to lend liquidity to each other, due to higher perceived
counterparty risk (Heider et al., 2009). To compensate for this increased uncertainty, lenders de-
manded higher credit risk premia or high quality collateral (ECB, 2010). At the same time, liquidity-
short banks were reluctant to ask for interbank deposits to avoid being perceived as illiquid, due to
the so-called stigma effect (Cappelletti et al., 2011). In many cases banks stopped lending to their
counterparties and preferred turning to the European Central Bank’s (ECB) overnight deposit to store
their liquidity surplus. This resulted in a significant decrease of the turnover in the unsecured inter-
bank money market and a significant increase of the ECB’s overnight deposit facility. Furthermore,
interbank money market trading has shifted from the unsecured to the secured market (ECB, 2012;
Cappelletti et al., 2011), which allows the interposition of the central counterparty to mitigate risks.
Since the contagion of the sovereign debt crisis among European periphery countries, the segmen-
tation in the interbank money market has increased significantly. Banks located in the so-called
peryphery countries (Greece, Ireland, Italy, Portugal and Spain) faced an increased sovereign risk
premiums while cross-border liquidity flows to these countries declined (BIS, 2012).
In response to the crisis, the Eurosystem has introduced unconventional monetary policy measures to
ease the strain in several markets, such as the interbank money market, which hampered the smooth
transmission of the monetary policy impulses. (ECB, 2010; van Riet, 2010).1 The effect of these
actions and especially of switching to fixed-rate full-allotment monetary policy tenders has been that
banks no longer need to rely on each other to fund their liquidity needs. Liquidity-short banks can
always obtain the desired amount of liquidity from regular ECB monetary policy operations, against
collateral from a wide range of eligible assets. Liquidity-rich banks can always deposit their excess
at the ECB’s overnight deposit facility instead of lending it to a market counterparty, as long as they
accept the implicit opportunity cost.
To evaluate the efficiency of the transmission of the (unconventional) monetary policy impulses, it
is essential to have reliable and complete information on the interbank money market. Normally,
however, central banks, including the ECB, have to rely on partial information. In the Eurosystem
this information contains the following sources: (i) reporting by the major banks in the euro area
on their overnight lending rates and volumes (which make up the Euro OverNight Index Average,
EONIA); (ii) data on individual exchanges on the Italian electronic trading platform e-MID; (iii)
data on individual trades on the Spanish domestic market MID; and (iv) data on domestic and cross-
border lending and borrowing for Greek banks.2 EONIA panel data only refer to the aggregated
1Unconventional monetary policy measures included: fixed-rate full-allotment since October 2008; swap agreementswith other Central Banks (e.g. FED, SNB); extension of the collateral framework; extension of the duration of the refinanc-ing operations (e.g. year tenders starting July 2009 and 3-year tenders starting December 2011); the introduction of theCovered Bond Purchase Program (May 2009), the Securities Market Program (May 2010) and of the Outright MonetaryTransactions (September 2012).
2Besides the fact that each of the four sources only gives partial information on the money market, there are alsorestrictions on the availability of the data for confidentiality reasons: EONIA data are available only to the EuropeanBanking Federation (EBF) and to the ECB for monetary policy purposes, e-MID data to Banca d’Italia in its financial
2

daily overnight transactions of the major money market actors in the euro area. e-MID data accounts
for less than 20% of overall interbank transactions in the euro area and is, especially since mid-2011,
mainly representative of Italian banks. Similarly, MID and Greek data mainly reflect the Spanish and
Greek interbank markets. The residual over-the-counter (OTC) money market transactions are not
directly available to the Eurosystem. However, the majority of these transactions will be settled in the
most important euro large value payment system (LVPS), TARGET2.
The main research question of this paper is, therefore, how to identify euro area unsecured interbank
loans, with maturities ranging from one day up to one year, using payment data from TARGET2.
To find the loan refund combination from LVPS data, we employ and expand the method of Furfine
(1999). He developed an algorithm to identify interbank loans for the US money market, using
Fedwire data. This algorithm assumes a round value transferred from bank A to bank B at time t
and the same value plus a plausible interest rate amount from bank B to bank A at time t + 1. The
minimum value of a payment has been set to 1 million US dollars with increments of 100,000 US
dollars. The interest rate is considered plausible if it lies within 50 basis points above or below the
federal funds rate. Demiralp et al. (2004) extended the algorithm to capture smaller size loans and
excluded any transaction whose interest rate does not correspond to a market quote for interest rates
in units of 1/32 percentage points or in whole basis points.
Subsequently, several authors have applied Furfine’s method to payment data from several payment
systems. Millard and Polenghi (2004) applied the Furfine’s algorithm to the British LVPS (CHAPS)
data, using a threshold of 1 million pounds sterling. Hendry and Kamhi (2007), studying the Cana-
dian Large Value Transfer System (LVTS), follow the approach of Demiralp et al. (2004) by only
including interest rates in units of half a basis point as eligible. Akram and Christophersen (2010)
have implemented an algorithm for the Norwegian market. They determined that some money market
trades can occur at rates below the overnight deposit rate, which is usually the lower bound of the in-
terest rates traded in the market, as at that rate banks can turn to their central bank for depositing their
excess liquidity as long as they have access to the standing facility of the central bank. The authors
argued that foreign banks which do not have access to the overnight deposit facilities of the Norges
Bank may in fact lend their excess liquidity in Norwegian krones at rates even below the deposit rate.
The aforementioned papers have in common that they focus solely on the overnight money market.
Heijmans et al. (2010) and Guggenheim et al. (2010) implemented an algorithm for maturities up to
one year for the Dutch and Swiss markets respectively. The main difference between the two papers
is the way longer term loans are matched. Guggenheim et al. (2010) start by identifying the one-
day loans. When a loan refund match has been found, the two payments that have been matched
are excluded from the search for the following maturity. Conversely, Heijmans et al. (2010) do not
exclude any loan-refund candidates when looking at longer maturities. Thus, the same payment
may be matched to different refunds and vice versa. Multiple matches may arise both within the
same maturity and between different ones. The alternative candidates stemming from these multiple
matches are then selected according to the most plausible match. This approach avoids the a priori
matching imposed by the order in which the algorithm processes the payments.
markets’ supervisory function and correspondingly MID and Greek data to Banco de Espana and to Bank of Greecerespectively.
3
Following a similar approach, we enhance the algorithm to reduce the uncertainty of the results.
Moreover, with respect to other works, the results have been validated against two external data
sources: (i) individual EONIA panel contributions and (ii) e-MID transaction-level data. To the
authors’ best knowledge, this is the most comprehensive validation exercise yet carried out with ref-
erence to a Furfine implementation. The validation enables us to quantify the Type 2 (false negative)
and Type 3 errors (mismatch). Further, it shows that our algorithm’s performance is considerably
reassuring, particularly in the overnight segment. This result is in sharp contrast with the recent paper
by Armantier and Copeland (2012) assessing the quality of the Furfine’s algorithm implemented at
the Federal Reserve Bank of New York against a dataset of bilateral transactions between two large
US dealers. They find very discouraging results, namely average Type 1 and Type 2 errors equal to
81% and 23% respectively, between 2007 and 2011. In addition, they also argue that these errors may
not subside if the algorithm’s output is aggregated. This confirms the validity of our implementation
and underscores that a “plain-vanilla” version of the Furfine algorithm without a deep knowledge of
the underlying data and technical details of the system may lead to misleading and potentially spu-
rious results. This study also aims at providing the Eurosystem with a database of euro area money
market transactions to serve monetary policy, financial stability and research purposes.
The outline of this paper is straightforward. Section 2 presents the data used in our analysis. Section 3
describes the algorithm, whereas its validation against e-MID and EONIA panel data is provided in
Section 4. That section also describes the level of uncertainty of the algorithm and presents the most
suitable corridor for the euro money market. Section 5 provides some descriptive analysis of the euro
area interbank money market. Finally, Section 6 concludes and makes some policy recommendations.
4

2 Data
The data sources we use for this paper comprise (i) payments settled in TARGET2, the main euro area
LVPS; (ii) individual interbank loans settled in the Italian electronic money market trading platform
e-MID; (iii) individual reporting by the banks participating in the EONIA panel.
2.1 TARGET2
TARGET2, Trans European Real-time Gross settlement Express Transfer, is the Eurosystem real
time gross settlement system (RTGS) for large value payments in euro in central bank money. Cur-
rently, all euro area countries and six non-euro area countries are connected to TARGET2.3 The
system processes the transactions of roughly 4,500 credit and other financial institutions which meet
the access criteria, directly or indirectly. As TARGET2 is an RTGS, each transaction is settled im-
mediately (real time), individually (gross) and irrevocably. Besides transactions between (in)direct
participants and transactions related to monetary policy implementation, it is also used for settlement
of many other ancillary systems (Kokkola, 2010). For the purpose of this paper, two important sys-
tems which settle in TARGET2 are the Italian e-MID and the Spanish MID, i.e. the only trading
platforms for unsecured money market transactions operating in the euro area (see Section 2.2).
Every transaction in TARGET2 involves two participants (mainly banks) and/or one (domestic) or
two (cross-border) national central banks (NCBS). The participants’ list comprises mainly euro area
credit institutions and several large non-euro area banks (notably UK and US). Each account of every
participant is assigned to one of the NCBS. Although banks are free to choose a reference central
bank in the Eurosystem, most banks choose the central bank of the country where their headquarters
are located and opt for two or more reference central banks only as specific business needs arise. For
non-euro area participants, the location of branches and/or subsidiaries has determined the choice
of reference central bank. This is relevant and should be kept in mind when studying domestic and
cross-border developments in the euro interbank money market.
Money market transactions may be settled also through EURO1, the second LVPS system in euro,
which is a privately owned payment system for domestic and cross-border payments in commercial
bank money. The system numbers 65 participating (mainly large) euro area banks. Although banks
participating in this system have the option to settle interbank money market loans in EURO1, the
majority of money market transactions are assumed to be settled in TARGET2: in the latter, the daily
turnover is close to 3,000 billion euros whereas in EURO1 it is below 250 billion euros.4
2.2 e-MID
e-MID, electronic Mercato Interbancario dei Depositi, is a privately owned electronic money market
system for interbank loans, created in 1990 from a joint initiative of the Italian banking commu-
nity and the Banca d’Italia. Money market trades that are executed on this platform do not differ
3The six non euro area countries are Bulgaria, Denmark, Latvia, Lithuania, Poland and Romania (status at the end ofOctober 2012).
4https://www.ebaclearing.eu/Statistics-on-EURO1%2fSTEP1-N=E1 Statistics-L=EN.aspx.
5

significantly from OTC transactions, as e-MID offers three different trading opportunities: (i) the
Multilateral Trading facility, where orders entered by participants are visible to the entire market and
are binding vis-a-vis other participants; (ii) the Request for Quote facility, where banks have the op-
portunity to trade with a restricted group of counterparties; (iii) the Direct Order dealing option, where
banks agree bilaterally on money market trades. These last two trading options closely resemble the
features of OTC transactions.
Since the launch of the euro and until the start of the financial crisis, e-MID experienced continuous
growth in trading and increasing participation by non-Italian banks. At the beginning of 2007, more
than 60% of participants were non-Italian institutions from 19 countries. In that year, e-MID rep-
resented 20% of the overall interbank transactions in Europe (ECB, 2012). As of August 2007, and
especially in the aftermath of Lehmann’s collapse, the daily average traded volumes declined, most
likely as a result of higher perceived counterparty risk and a potential stigma effect for banks having
to disclose their liquidity needs on a transparent electronic platform like e-MID (Cappelletti et al.,
2011). Cross-border flows decreased significantly too, as of 2008. Nevertheless, according to Mon-
ticini and Ravazzolo (2011), e-MID was still representative for the whole euro area money market in
2008, as loans involving at least one non-Italian counterparty accounted for 42% of the total turnover
and foreign participants represented 42% of the total number of active traders (179). Although the
share of non-Italian trading fell to 20% in 2009 and to 10% in 2010, e-MID prevailing market con-
ditions remained anchored to the euro area money market as witnessed by the low spread between
the overnight interest rate traded in the e-MID and the EONIA. Thus, e-MID can be regarded as a
benchmark of the euro area money market and a suitable support in validating Furfine’s algorithm,
especially at the beginning of the analysed period and for the overnight maturity.5
Unlike one-day transactions, longer term maturities traded on e-MID have been quite rare since the
outbreak of the crisis. Therefore, the extension to the entire data set of validation results for these
maturities is less straightforward. The e-MID market shifted towards shorter term maturities in the
aftermath of the sub-prime crisis. From June 2008, one-day transactions (overnight, tomorrow-next,
spot-next) accounted for more than 90% of total transactions. Until mid-2009 loans with maturity
up to 3 months (excluding one-day transactions) represented 5% of the overall turnover. Although
infrequent, e-MID longer trades are the only readily available source of individual money market
transactions which can be used to assess the goodness of fit of the Furfine-like algorithm in the euro
area at longer maturities.
2.3 EONIA panel
The EONIA is an effective overnight interest rate computed as the weighted average of all overnight
unsecured loans reported by the contributing euro area panel banks.6 Soon after the closing of the
5Only since the contagion of the sovereign debt crisis in Italy (August 2011) the market has become mainly Italian andthe spread between the EONIA and e-MID widened, reflecting an increased national segmentation of the euro area moneymarket. Thus, the information content of e-MID loans as a benchmark for the overnight euro area money market has, sincethen, deteriorated (Cappelletti et al., 2011).
6In October 2012 the panel of banks contributing to EONIA consists of 43 banks. The list of current panel banks canbe found at http://www.euribor-ebf.eu/euribor-eonia-org/panel-banks.html.
6

day trade phase in TARGET2, each panel bank sends to the ECB the sum of all lending transactions
carried out during the business day and the corresponding weighted average rate. There is a number
of lending transactions that panel banks have to exclude from their report: loans to counterparties
belonging to the same banking group (intra-group), money market transactions settled on behalf of
customers as well as tomorrow-next and spot-next transactions, the last ones not being agreed on the
reporting business day.
The data set comprises the daily individual volume and the corresponding weighted average rate
for all the reporting banks during the period in analysis. The EONIA panel includes banks in EU
countries participating in the euro from the beginning, banks in EU countries not participating in the
euro from the beginning and large international banks in non-EU countries but with important euro
area operations. The banks contributing to EONIA are the same as those in the EURIBOR panel
and all hold an RTGS account in TARGET2.
7
3 The algorithm setup
Our implementation of the unsecured interbank loans identification algorithm in the euro area using
TARGET2 payments data is characterised by the following elements: (i) the input data, (ii) the loan
value and increment, (iii) the areas of interest rate plausibility, (iv) a further criterion for plausible
interest rates, (v) the procedure to deal with multiple matches and finally (vi) the identification of the
maximum reliable duration. This section concludes by summarising the algorithm implementation.
See the Annex for a more formal description of the algorithm setup.
3.1 TARGET2 data
As we are interested in identifying unsecured loans settled in TARGET2 between commercial banks
in the euro area, our input dataset is composed solely of bank-to-bank (interbank) transactions.7 Start-
ing from the total TARGET2 database, interbank transactions are identified excluding payments from
or to accounts belonging to central banks and national treasury accounts. In addition, we exclude
transactions from and to accounts belonging to the same legal entity. Some banks (or a group of
banks) have more than one account in TARGET2 (within one central bank for administrative reasons
and/or across several central banks within the euro area): we deem it admissible to consider them
together because usually these accounts are controlled by the credit institution’s head office. As we
want to assess the overall money market transactions in the euro area, executed both over-the-counter
and electronically, we also include ancillary system transactions stemming from the electronic money
market platforms e-MID (Italy) and MID (Spain). Transactions from all other ancillary systems in
the euro area are discarded. Finally, we need to point out that, due to data unavailability, the matches
are based on the TARGET2 settlement banks and not on the originator and final beneficiary of the
transactions. This may introduce substantial noise into analyses at bank level. The TARGET2 data
we use in this paper ranges from June 1st 2008 until October 31th 2012.
3.2 Loan and increment values
In the seminal version of the algorithm, Furfine (1999) adopts 1 million US dollars as the minimum
loan value and a fixed increment of 100,000 US dollars for the US federal funds market. Demiralp
et al. (2004) also describe the US market using 50,000 US dollars as the lower bound and as increment.
Heijmans et al. (2010), investigating the Dutch part of the euro area market, used 100,000 euros as
minimum loan and increment value. Guggenheim et al. (2010) for the Swiss market use a minimum
loan value of 500,000 Swiss francs and increment value of 100,000 Swiss francs. All the papers
available in the literature adopted minimum loan values ranging between 50,000 and 1 million of the
local currency unit, with increment values of between 50,000 and 100,000 units. Nevertheless, none
of the existing papers provide hard evidence to support their choices.
To choose the optimal setup for the euro area a two-phased approach was adopted. First, a survey was
conducted among the euro area central banks to assess national practices in the euro-denominated
7The algorithm can be used to analyse customer payments as well: these are excluded from our input dataset as thefocus of the present work is on the interbank money market, not the lending and borrowing activity involving customers.
8

Figure 1: Observed smallest increments to the next higher loan amount.
money market.8 The survey revealed (i) that the minimum loan value is 1 million euros with in-
crements ranging from 10,000 euros to several million euros, depending on the loan size, (ii) that
payment splitting (which would make it almost impossible to identify individual money market trans-
actions) almost never occurs and (iii) that roll-overs (automatic renewal of loans) are frequent in
certain euro area countries.9 In addition, the e-MID database confirms that 1 million euros is a good
choice as minimum loan value, although the platform does allow smaller trades under specific condi-
tions.10
The analysis of the number of unique matches obtained by imposing a minimum increment threshold
of 10,000 euros shows that setting the increments depending on the loan amounts is the optimal
strategy: too low increments could lead to an increase of false positives, whereas too high thresholds
would not capture effective money market transactions (false negatives, see Section 4.1). Figure
1 depicts the scatter plot of the increment with respect to the loan amount for all unique matches
captured by the algorithm that uses the 10,000 euros increment rule. The size of the circles is weighted
with the number of identified transactions for a given loan amount and a given increment. The black
8The survey was jointly conducted by the Working Group Oversight (WGO) and the Working Group TARGET2(WGT2) of the Eurosystem.
9This applies in France, Portugal and Spain.10In e-MID, banks are required to quote proposals at least equal to 1.5 million euros. Nevertheless, if after being hit by
an order that partially covers the proposed quantity, the residual quantity is lower than the minimum amount, the proponentcan still negotiate such a residual amount. In fact, e-MID trades below 1 million euros represent only 0.1% of all e-MIDtransactions, by volume.
9

line, representing the increment threshold below which no unique matches were found, led us to adopt
a step function for the minimum increment amount, as follows:
• 10,000 euros for transactions below 1 billion euros.
• 1 million euros for transactions between 1 billion and 2 billion euros.
• 10 million euros for transactions between 2 billion and 10 billion euros.
• 100 million euros for transactions between 10 billion and 15 billion euros.
• 1,000 million euros for transactions greater than 15 billion euros.
3.3 Areas of plausibility
Matching two transactions as being an interbank loan and its refund requires assumptions regard-
ing plausible interest rates. Furfine (1999) uses a corridor of 50 basis points below the 11:00 a.m.
brokered federal funds rate and 50 basis points above the closing rate. Demiralp et al. (2004) use
a corridor of 100 basis points in order to capture loans that potentially differ more noticeably from
brokered fed funds trades. They use a minimum interest rate of 1/32. Heijmans et al. (2010) use a
corridor of 50 basis points centered on the EONIA or EURIBOR rate (depending on the maturity)
for most of the investigated period. After the failure of Lehman Brothers, they increase the lower
bound to 100 basis points, because some banks were able to attract liquidity at unusually low interest
rates. Guggenheim et al. (2010) set the corridor to 15 basis points around the respective LIBOR rate
for most of the days. On days of high volatility, they use a band width that is a function of the intraday
volatility.
To find the optimal area of plausibility for the euro area, we investigate five different corridors. The
first plausibility area (ECB0) is equal to the ECB corridor of marginal lending and overnight deposit
rates. However, evidence from the literature and from the e-MID data show that rates both below
the deposit rate and above the marginal lending rate do occur. 11 Therefore, a second plausibility
area widens the ECB corridor by 25 basis points below and above (ECB25). However, the ECB
corridor represents a benchmark for overnight money market transactions but not for longer term ones.
Better reference rates for longer term money market transactions might therefore be derived from
the EURIBOR yield curve. Therefore, we also investigate corridors around EONIA for overnight
transactions and around EURIBOR for maturities starting from 1 week. Unlike the ECB key policy
rate, which is the centre of the first type of plausibility areas, the EURIBOR is not an actual rate but
only a quoted one, which means that effective longer-term maturities may depart significantly from
the relative fixing. Like Furfine (1999), we choose to set a corridor around this reference rate of 25
(EONIA25), 50 (EONIA50) and 100 basis points (EONIA100).
11Banks may borrow at rates higher than the ECB marginal lending rate if, e.g., they lack collateral to guarantee theiroverdraft; banks may also borrow and lend at rates outside the ECB corridor if they do not have access to the Eurosystemstanding facilities.
10
3.4 Plausible interest rates
The corridor approach excludes implausibly high or low interest rates but may still match payments
that yield implausibly complicated interest rates. Anecdotal evidence collected from market operators
as well as the e-MID minimum rate tick rule suggests that banks do not agree on interest rates that
are not rounded to a particular number of decimals.
Demiralp et al. (2004) were the first to employ such an additional criterion on the interest rate: they
filtered out any repayments that did not imply an interest rate in units of 1/32 percentage points or
in whole basis points. Similarly, we only include matched transactions with implied interest rates
of multiples of half a basis point, i.e. the third decimal must be either 0 or 5. In other words, a
returning payment that leads to a 4.345% rate is included in the output dataset, whereas one resulting
in a 4.343% rate is not considered a plausible match and therefore discarded. Treasurers at several
commercial banks have confirmed this hypothesis.12
3.5 Multiple matches
The algorithm described so far matches all transactions that represent possible loan advances with all
payments that qualify as potential repayments. As a consequence, a single transaction can be matched
with several other payments (multiple matches or collisions). Two different types of multiple matches
can occur: (i) intra-day and (ii) inter-day multiple matches. The first case occurs when one or more
potential reimbursements match with one or more transactions on the same day. In this case the wrong
choice of match may lead to an error in the estimated rate if the amounts of the reimbursements differ.
The second case occurs when one or more reimbursements on different days match with one or more
setup transactions; in this case the error affects both the maturity and the rate. Obviously, the two can
also occur simultaneously.
In case of an intra-day maturity collision, the choice of match is made randomly since the first implied
interest rate is assessed to be as plausible as the second one. In case of inter-day maturity collision, we
choose the most plausible duration according to the observed frequency of the maturities of uniquely
matched TARGET2 loans (see Figure 2). The chart shows that where an identified loan advance
matches with two opposite transactions, one six and the other seven days later, our rule will consider
it as a seven day maturity loan. In most cases, maturities counted in whole weeks and months occur
with higher frequency than all other adjacent maturities.
3.6 Maximum reliable duration
The longer the loan maturity, the larger the area of plausibility is in an absolute sense. Where the
corridor is wider, it is more likely that a matched loan-refund combination is in fact a pair of two
unrelated transactions. In other words, the amount of noise (falsely identified loans) will increase with
maturity. Figure 3 shows schematically the increase of the stochastic error with increasing maturity
whereas Figure 4 shows for 16 different maturities the distribution of all unique loans found by our
12In this paper we have only implemented the 360-day year convention for rate calculation. However, we have foundevidence that some trades (in some parts of the Eurosystem), follow the 365-day year convention. This is probably due tothe British banks holding TARGET2 accounts: the United Kingdom follows the 365-day convention.
11

Figure 2: Observed frequency of maturity of all unique matches.
algorithm. As the stochastic error becomes larger, the algorithm become less reliable. The validation
exercise of Section 4.2 confirms this. Therefore, we assume that our algorithm is most reliable for
identified TARGET2 loans up to three months.
3.7 Summary of the algorithm
The elements of the algorithm are the following:
A. Input:
a. Interbank payments (MT202) and selected ancillary systems transactions (e-MID and
MID)
b. Only transactions between different BICs (no liquidity transfers).
B. Loan and increment:
a. The minimum loan value is 1 million euros.
b. The loan increment follows the following criteria:
i. 10,000 euros for transactions below 1 billion euros;
ii. 1 million euros for transactions between 1 billion and 2 billion euros;
iii. 10 million euros for transactions between 2 billion and 10 billion euros;
12

Figure 3: Type 1 error: schematic overview of the increasing stochastic error for longer maturities.
iv. 100 million euros for transactions between 10 billion and 15 billion euros;
v. 1,000 million euros for transactions greater than 15 billion euros.
C. Plausible corridors are centered either on EONIA/EURIBOR rates or on ECB standing facili-
ties corridor rates. In the first case, EONIA is used for loans up to 4 days and the corresponding
closest EURIBOR is used for loans of 5 days or longer.
D. Interest rates must be multiples of half a basis point, i.e. the third decimal digit is either 0 or 5.
E. Multiple matches: the most plausible duration is chosen on the basis of the maturity frequencies
for unique matches.
F. Post-processing of transactions to distinguish between intra-group and extra-group loans based
on the SWIFT BIC directory information. For this purpose the field Parent BIC code is consid-
ered to consolidate the group of accounts.
13

Figure 4: Type 1 error: Frequency of spreads versus the reference rate at increasing maturity. The redline represents the fitted normal distribution using the mean and standard deviation of the sample.
14

4 Validation
To evaluate the robustness of the algorithm and to choose the best performing corridor, the identified
TARGET2 loans were validated against external sources of money market transactions which rep-
resent a subset of the total market. For this purpose, e-MID transaction-level data and aggregated
EONIA data were used. This section describes the validation of the algorithm outcome. Section
4.1 explains the three different types of uncertainties inherent in the algorithm. Sections 4.2 and 4.3
present the validation of the algorithm with e-MID and EONIA data, respectively.
4.1 Uncertainties in the algorithm
The algorithm as described above is not free of errors as it identifies money market transactions
simply by matching two payments given certain boundary conditions. The algorithm does not “know”
whether the coupled payments really represent a money market loan, nor if the two payments refer
to the same money market exchange or stem from two different money market transactions. In the
estimated database three different types of errors may occur:
A. Type 1 error, or false positive, occurs when the algorithm identifies a money market transaction
which in fact is not composed of a loan and a repayment, but of two unrelated to money market
transactions. This error can typically occur if the corridor is too wide, because the larger the
corridor, the higher the probability that two random transactions match as a loan-refund combi-
nation. This happens especially when matching longer maturities because there the plausibility
area is wider in absolute terms.
B. Type 2 error, or false negative, occurs when the algorithm fails to identify a money market
transaction. This can happen for the following reasons: (i) the transaction is not present in the
TARGET2 initial dataset, for example because the money market exchange is not settled in
TARGET2, but in EURO1 or on commercial bank accounts; (ii) the algorithm is not able to
find the transaction, because the loan does not satisfy the conditions embedded in the parame-
ters of the algorithm. This is particularly likely to happen, (a) if the interest rate of the exchange
lies outside the corridor (if the algorithm looks for loans with an interest rate between 1% and
2%, it will fail to pick up money market exchanges executed at 2.1% or 0.95%), (b) if the
amount of the loan transaction does not respect the increment rule or (c) if the implied rate is
not a multiple of half a basis point.
C. Type 3 error relates to the so called “wrong match”. A wrong match can occur when the real
loan is not considered plausible (e.g. because it falls outside the corridor) or in the case of
multiple matches. In the latter case, two types of multiple matches can be distinguished. First,
a loan can be matched with several repayments executed on the same day, i.e. a loan transaction
at t = D may match with more than one plausible refund payments on t = D+ x. Since only
one of these has to be randomly selected, the algorithm may choose a wrong one thus impairing
the statistics on the executed rates. The second kind of multiple match occurs if the algorithm
couples a loan with several repayments executed on different days: this happens when a loan at
15

t = D has a plausible refund at t = D+x but also at t = D+y. As the algorithm will select one,
according to the unique matches duration probabilities described in Section 3.5, it may select
the wrong match, discarding the correct one. The wrong matches are directly connected to false
positive errors and can be considered as a subset of false positive errors, i.e., each wrong match
is connected to a false negative transaction but not vice versa.
The increase of wrong matches may stem from the fact that in a wider corridor the algorithm is more
likely to find multiple matches, including the correct one. If the corridor is too narrow, the algorithm
finds a smaller number of multiple matches, possibly missing the correct one: here the false negative
error rate may be higher. On the other hand the wider the corridor, the more likely the dataset will
be to include false positives, which however will be difficult to estimate or even to approximate. The
choice of corridor width is therefore a compromise between the false negative and estimated false
positive error rates.13 The trade-off between false negatives and positives is amplified for longer
maturities for which the overlap between corridors of subsequent maturities increases as the maturity
increases and, accordingly, the probability of ”collision” (see Section 3.5).14
4.2 Comparison with e-MID
The validation of the identified TARGET2 loans with e-MID data employed two different strategies,
given the two different settlement procedures in e-MID, (i) automatic settlement and (ii) manual set-
tlement. The first strategy is applied to automatically settled trades. This typically occurs when both
counterparties have joined the automated facility that allows the electronic platform e-MID to send
the deal directly to TARGET2. The transactions submitted automatically by e-MID to TARGET2
are identified in the TARGET2 database with a code which allows matching uniquely the originat-
ing transaction and the reimbursement of a single e-MID deal. However, not all e-MID participants
have joined the automated facility and when at least one counterparty of a money market contract
has not, the deal must be sent to TARGET2 directly by the participants (manual settlement). Those
e-MID transactions do not allow straightforward matching of the loan and the connected repayment.
In this case the validation process has therefore to revert to e-MID nominative individual transactions
collected by Banca d’Italia for supervisory purposes.
4.2.1 Validation of e-MID trades settled exclusively with automatic settlement facility
The automatic settlement facility is adopted by all Italian banks, whereas most non-Italian banks do
not use this feature, therefore the validation with automatically settled e-MID transactions concen-
trates on loans between Italian banks. We compare the e-MID labelled loans in the TARGET2 data
(settlement date, settlement banks, maturity, amount and rate) to money market transactions identified
by our Furfine procedure. The validation shows three different matching possibilities:
13Needless to say that increasing the maturity spectrum over which the algorithm is run will increase, ceteris paribus,the false positive error rate. This is because each bilateral transaction is matched with a greater number of potentialreimbursements, thus increasing the likelihood of spurious matches.
14A more detailed discussion on the issue of overlapping maturities is presented in the Annex.
16
A. Perfect match: a loan with identical settlement date, settlement banks, maturity, amount and
rate in TARGET2 and e-MID data.
B. False negative: a loan in the e-MID data set not found in the Furfine data set, which can either
be:
a. A false negative because the interest rate of the transaction lies outside of the assumed
corridor
b. A false negative for other reasons.
C. Wrong match: e-MID transactions identified by the algorithm but with different rate and/or
duration.
Table 1 presents the results for the different corridors on maturities between 1 and 370 calendar
days carried out on all automatically-settled e-MID transactions from June 2008 up to and including
June 2012 with a size exceeding one million euros.15 For each corridor, false negative and wrong
match rates (type 2 and 3 errors) with respect to the total number of e-MID automatic transactions
are shown. The outcome shows that the algorithms searching over the corridors ECB25 (overall
error rate 0.92%) and EONIA100 (overall error rate 1.96%) yield better results compared with the
implementations based on other corridors. In terms of traded amounts (not reported in Table 1), the
false negative rate is always below 0.015% for all five corridors. Nevertheless, as the corridor width
for ECB25 and EONIA 100 is quite large in both cases, the majority of unidentified transactions is
due to the fact that the rate is outside the plausible corridor. Increasing the corridor width improves
the type 3 error rate (wrong match) which is a special kind of false negative error.
Figure 5 shows the time series of the false negative rates for different maturities. The evolution of the
false negative error over time shows that both the ECB25 and EONIA100 corridors work remarkably
well between 2008 and 2010 and in 2012 (error rate below 0.6%). However, during 2011 the error
rate increases significantly (7.8% for EONIA100 and 2.75% for ECB25). This could be due to the
high rates agreed by the Italian banks in the second half of the year, during the Italian sovereign debt
crisis until the ECB’s first three-year long-term refinancing operation.
4.2.2 Validation of automatically and manually settled e-MID trades based on e-MID archivedata
Apart from e-MID loans, which are settled automatically, there are two other options: (i) loans be-
tween two counterparties that are not settled in TARGET2 because they are settled through the same
settlement bank (on-us transactions) and (ii) loans which are settled in TARGET2 but involve at
least one e-MID participant that has not joined the automated settlement. Comparing the Furfine-
identified transactions with the e-MID archive data conveys important insights on both these two cat-
egories which cannot be inferred from e-MID automatically settled loans in the TARGET2 database.
15The extension of the maturity to 370 calendar days aims at capturing one-year money market exchanges whose effectiveduration is longer than 365 days because of intervening weekend days and holidays that shift the repayment date.
17

Table 1: First validation method (e-MID transactions with amount > 1 million euro). Error rates arein terms of number of transactions.
False False A componentTotal negatives negatives Total of
automatically rate (inter- rate false total falsesettled Matched Validation est rate (other negative negatives:
e-MID trades transactions rate out of range) reasons) rate Wrong matched(A) (B) (C=B/A) (D) (E) (F=D+E) (G=γ F)
ECB0 222,568 211,613 95.1% 2.76% 2.16% 4.92% 0.47%ECB25 222,568 220,513 99.1% 0.68% 0.25% 0.92% 0.26%EONIA25 222,568 194,464 87.4% 12.53% 0.10% 12.63% 1.08%EONIA50 222,568 212,436 95.4% 4.46% 0.10% 4.55% 1.08%EONIA100 222,568 218,201 98% 1.81% 0.15% 1.96% 0.73%
Figure 5: Results of the e-MID validation for automatically settled loans.
The second validation method is carried out separately for loans between Italian banks and for loans
involving at least one foreign counterparty.
On the one hand, on the automatic settlement platform, used directly or through a settlement agent by
virtually all Italian banks, the error rates of the validation exercise should be interpreted as a mix of:
A. the algorithm’s inability to identify the real trades from the settlement data;
18

B. difficulties in matching the identified TARGET2 loan with the correct e-MID trade because
it has been indirectly settled (through correspondent banking relationship) as in the e-MID
archives the settlement banks are not recorded (Type 2);
C. missing identification due to the fact that two banks trading in e-MID settle their obligations
through the same TARGET2 direct participant (on-us transactions) (Type 3).
In comparison to the previous validation method, the last two sources of uncertainty yield a slightly
lower validation rate for Italian participants. This is not due to the algorithm, which is invariant under
both methods. The uncertainties could be removed if we had detailed information about the original
sender and beneficiary across the TARGET2 data.
On the other hand, when it comes to deals involving non-Italian participants, there is an additional er-
ror factor related to the different market practices the trading banks may choose to adopt. In fact, while
market players cannot affect the settlement of their automatically settled e-MID trades, TARGET2
loans involving at least one non-Italian bank do not necessarily match exactly the traded quantity.
Banks may, for example, not settle their money market transactions on a gross basis exchanging a
unique loan amount and a unique repayment (“1-to-1 basis”), as inferred from anecdotal evidence,
but may split their obligations into several chunks, e.g. by repaying the principal and the interest
separately. Furthermore, market operators may offset some intermediate payments against each other
in case of a roll-over, a market practice that from the outcome of the money market survey seems to
be infrequently used.
As the first validation method already outlined the superiority of the ECB25 and EONIA100 corridors,
the second validation methodology focuses directly on them: the results are shown in Table 2. A first
by-product of the second validation approach is a measure of the incidence of “on-us” transactions
on total unsecured money market trading, which yields reassuring results. According to the e-MID
data, only a small percentage, around 3%, of trades carried out between domestic counterparties are
not settled in central bank money and thus escape detection because they are not included in the
payment data. More specifically, the incidence of internalised transactions on total money market
trades executed between Italian counterparties seems relatively low, across all maturities, with higher
maturities exhibiting higher ratios.16 The incidence of the “on-us” transactions appears 10 times
smaller in the case of cross-border money market deals, around 0.3%, again with higher maturities
exhibiting higher ratios. Always bearing in mind the caveats due to lower representativeness of the
sample of the e-MID cross-border transactions compared to the OTC transactions executed in the
euro area, this result is not surprising as we expect that small and medium banks are less likely to
establish correspondent relationships across national borders.
The comparison between our estimated Furfine dataset and the e-MID native archives enables us
to quantify the ratio of unmatched transactions to the total e-MID loans (type 2 error rate) that, as
expected, is lower for loans carried out between Italian counterparties than for loans involving at least
16It is worth mentioning that the “on-us” rates could be improved if future analysis aimed at detecting who settles forwhom in TARGET2, especially for foreign participants. This analysis could also shed light on the settlement practicesfollowed by the market and help improving the accuracy of the algorithm.
19

one non-Italian bank, thanks to the availability of a richer data set.17
At the domestic level, the ratio of non-matched transactions is relatively small (2.7% for the ECB25
corridor and 3.7% for the EONIA100 corridor), increasing quite substantially with rising maturities.
The two corridors perform differently across the maturity range: for the short maturities (up to one
month) the ECB25 corridor exhibits slightly better validation rates; the opposite holds for longer
ones, at which for domestic deals the error rate of the ECB25 corridor peaks at 29% above 3 months,
whereas the error rate of the EONIA100 corridor never exceeds the 20% threshold. For money market
deals executed on a cross-border basis, the validation rates exhibit a similar pattern but they are lower
across the entire range of maturities for both corridors. While for domestic transactions the error
rates are negligible throughout the whole reference period, except for the dramatic fall recorded in
late 2011 due to the Italian sovereign debt crisis, the evolution of the error rates for cross-border
transactions appears more erratic, with validation rates dropping below 80% on several occasions.18
17In the ECB25 corridor the overall type 2 error rate for trades between Italian banks is 2.7% while the one for tradesinvolving at least one non-Italian participant is 8.6%. In the EONIA 100 corridor the percentages are very similar (3.7%and 8.2%, respectively).
18The time series analysis is carried out only on the most liquid maturities.
20

Tabl
e2:
Seco
ndva
lidat
ion
met
hodo
logy
.Err
orra
tes
are
inte
rms
ofnu
mbe
roft
rans
actio
ns.
Tota
lTo
tal
Fals
ee-
MID
e-M
IDne
gativ
esFa
lse
trad
estr
ades
beca
use
nega
tives
Fals
ew
ithw
ithou
tin
tere
stfo
rne
gativ
esam
ount
on-u
sra
teis
out
othe
rV
alid
atio
ner
ror
>1m
ilion
on-u
str
ansa
ctio
nsM
atch
edof
rang
ere
ason
sra
tera
teM
atur
ityTo
tal
euro
s(A
)(B
)(C
=A-B
=D+E
+F)
(D)
(E)
(F)
(D/C
)(E
+F)/
C
EC
B25
allm
atur
ities
226,
439
226,
162
7,15
821
9,00
421
3,01
11,
522
4,47
197
.3%
2.7%
1da
y16
6,55
216
6,32
54,
736
161,
589
158,
193
602
2,79
497
.9%
2.1%
dom
estic
2-10
days
52,7
3552,6
922,
014
50,6
7849
,216
287
1,17
597
.1%
2.9%
11-3
3da
ys5,
185
5,17
930
54,
874
4,23
926
736
887
%13
%34
-94
days
1,62
11,
620
791,
541
1,13
429
211
573
.6%
26.4
%94
-370
days
346
346
2432
222
974
1971
.1%
28.9
%
allm
atur
ities
11,5
1611,5
1538
11,4
7710
,490
498
791
.4%
8.6%
1da
y8,
898
8,89
716
8,88
18,
169
171
292
%8%
fore
ign
2-10
days
2,42
72,
427
112,
416
2,17
70
239
90.1
%9.
9%11
-33
days
163
163
216
113
12
3081
.4%
19.9
%34
-94
days
2121
912
80
466
.7%
33.3
%94
-370
days
77
07
51
271
.4%
42.9
%
EO
NIA
100
allm
atur
ities
226,
439
226,
162
7,15
821
9,00
421
0,92
84,
057
4,01
996
.3%
3.7%
1da
y16
6,55
216
6,32
54,
736
161,
589
156,
253
2,70
82,
628
96.7
%3.
3%do
mes
tic2-
10da
ys52
,735
52,6
922,
014
50,6
7848
,756
894
1,02
896
.2%
3.8%
11-3
3da
ys5,
185
5,17
930
54,
874
4,32
329
026
188
.7%
11.3
%34
-94
days
1,62
11,
620
791,
541
1,30
614
689
84.8
%15
.2%
94-3
70da
ys34
634
624
322
290
1913
90.1
%9.
9%
allm
atur
ities
11,5
1611,5
1538
11,4
7710
,547
1693
091
.9%
8.2%
1da
y8,
898
8,89
716
8,88
18,
191
1569
092
.2%
7.9%
fore
ign
2-10
days
2,42
72,
427
112,
416
2,20
90
207
91.4
%8.
6%11
-33
days
163
163
216
113
31
2882
.6%
18%
34-9
4da
ys21
219
128
04
66.7
%33
.3%
94-3
70da
ys7
70
76
01
85.7
%14
.3%
21

Figure 6: Results of the e-MID validation for manually settled loans.
4.3 Comparison with EONIA
Despite its granularity and the availability of longer term money market transactions in the e-MID
data, which allows transaction by transaction cross-checking, the analysis is somehow lacking a euro-
wide context since from the start of the crisis, e-MID data has concentrated on money market trades
between Italian participants. The need for validation against more euro-wide representative data calls
for a cross-check also with the EONIA data. As already noted, every bank in the EONIA panel
reports daily (i) the aggregate volume and (ii) the corresponding weighted average rate of lending
transactions made on its own behalf. The use of the EONIA data set provides valuable reference
material for the euro area market going beyond and complementing the e-MID validation. The results
reported in the following are based on the comparison between the overnight interbank loans identified
using the Furfine algorithm for the EONIA panel banks and the actual daily aggregate reported values
and rates of EONIA. The validation considers a dynamic panel reflecting the changing composition
of the reporting banks in the sample under analysis.
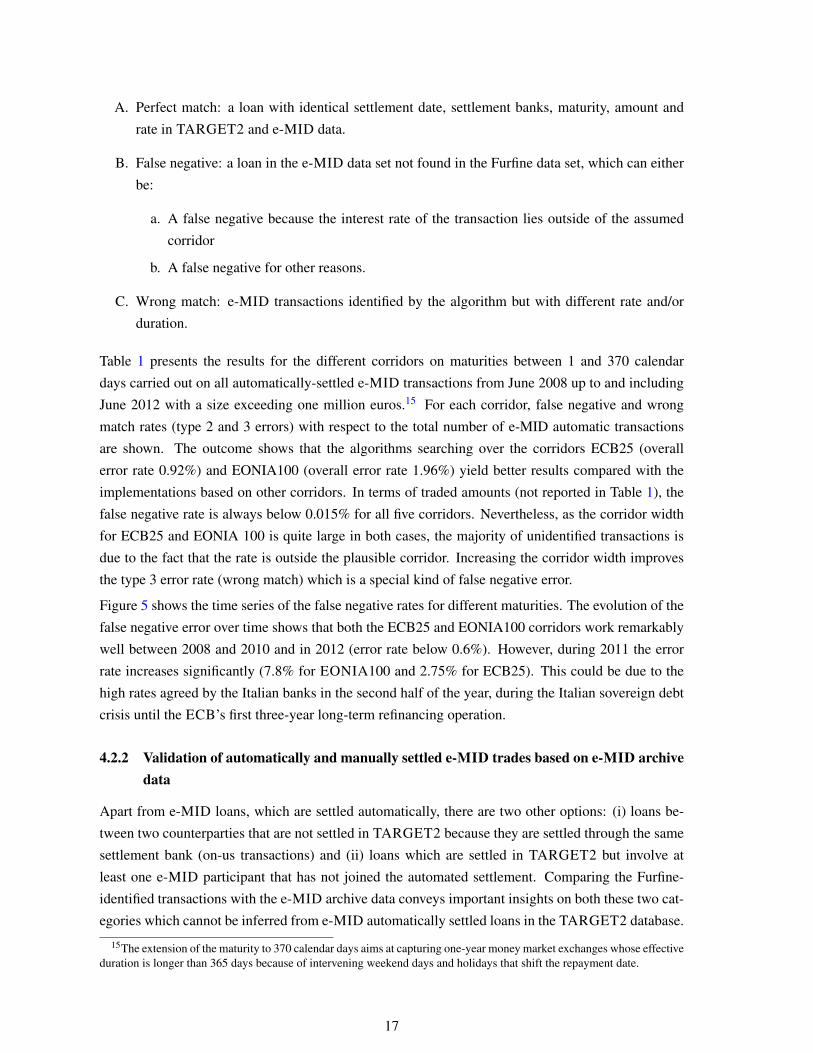
The results of the comparison are reassuring. We start by looking at the difference between the total
value reported and the total value identified with the Furfine algorithm. Figure 7 depicts the reported
and identified turnovers for the EONIA panel banks using the EONIA100 corridor. The two series
show similar trends, with the identified turnover ranging from 98% to 250% (1st and 3rd quartile are
120% and 160%, respectively) of the reported one. This does not imply that the EONIA is not valid.
In fact, the differences in the two series can be due to several reasons:
22

A. Identified volumes can be larger than reported by the EONIA due to:
a. Possible overidentification
b. Tomorrow-next and spot-next transactions, not reported in the EONIA
c. Rollovers, not reported in the EONIA unless both parties are actively involved in the
issue of a new contract
d. Intra-group transactions, excluded in the EONIA reporting but not always possible to
distinguish and discard in the TARGET2 dataset
e. Transactions concluded on behalf of clients
B. Identified volumes can be lower than the reported EONIA due to:
a. Transactions settled outside TARGET2, e.g. on accounts of a commercial bank (corre-
spondent banking)
b. Loans settled via another payment system such as EURO1
For example, for some banks we identified that they were very active in the tomorrow next and spot-
next markets. In other cases, we identified regular lending to other banks, that a deeper analysis
showed that the sending and/or receiving bank are not always the beneficiary but act on behalf of
another bank. Such transactions of course introduce a bias in the implied rate and an upward bias
in the volume estimation. Finally, one bank reporting in the EONIA panel opened an account in
TARGET2 only after few months from the beginning of our sample. The lending transactions of
this bank were obviously settled outside TARGET2, either via a different payment system or on its
books.
With regard to the rates (see Figure 7, bottom panel), the reported and the implied rates lie close
together. It is reassuring the matching of interest rate spikes occurring at the end of a maintenance
period, due to the increase in the cost of interbank borrowing. The mean and median spread are
equal to 9 and 8 basis points respectively. Finally, the implied rate is almost always lower than
the reported rate and the difference is larger around interest rate decisions. This may be due to
unidentified intragroup loans, which usually take place at rates well below the EONIA.
23
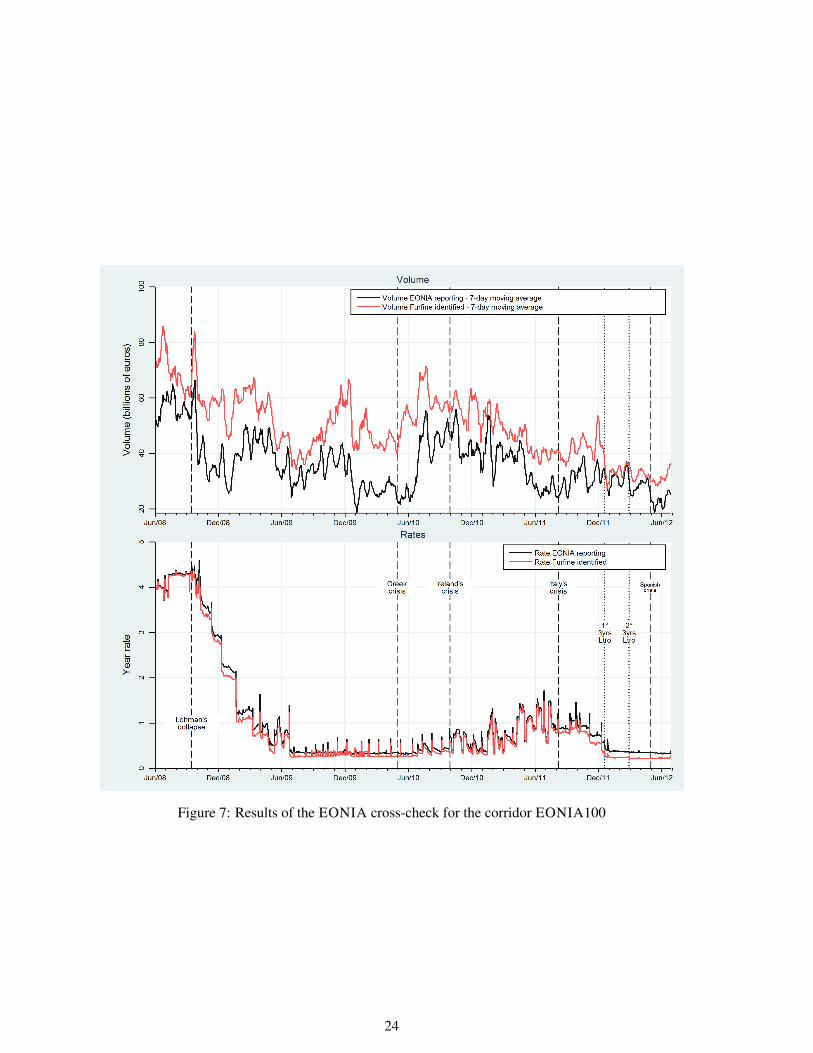
Figure 7: Results of the EONIA cross-check for the corridor EONIA100
24

5 The euro area unsecured money market
This section describes developments of the euro area interbank money market, since June 2008, based
on our algorithm. We focus on three levels: (i) Eurosystem level, including all banks participating in
TARGET2 (ii) core versus periphery level and (iii) country level (Italy and the Netherlands).
5.1 Eurosystem level
Figure 8 shows the turnover of the overnight interbank money market.19 The overnight turnover
dropped dramatically after the default of Lehman Brothers to almost 50%, from 130 billion euros
in June 2008 to 79 billion euros in June 2009. It stabilised at around 75 billion euros until April
2010. We observe a partial recovery between May 2010 and April 2011 to some 93 billion euros, to
plunge again after Portugal’s request for financial assistance to on average 75 billion euros between
May and November 2011. The turnover faced another decrease after the two ECB’s 3-year Longer
Term Refinancing Operations (LTRO) in December 2011 and February 2012 to 47 billion euros, on
average, between January and June 2012. After the decrease of the main refinancing rate to 0.75% in
July 2012, and the corresponding overnight deposit rate to 0%, the turnover plummeted to about 20
billion euros. It seems that this rate cut affected predominantly the overnight cross-border turnover
market. Overall,the cross-border trades exhibit a more pronounced decreasing trend than the domestic
ones, except for being less affected by the ECB’s second 3-year tender.
The incidence of volumes of exchanges with maturity longer than one day fluctuates between 10%
and 17% of the overall volumes, but their outstanding amounts range from 87% to 93% of the entire
unsecured money market. In other words, the incident turnover of overnight loans is the majority,
but in terms of outstanding value the loans with longer maturity are dominant. From a central bank
policy point of view both aspects are relevant, as central banks are interested in the smooth flow of
interbank money circulation, but also in the amount of liquidity individual banks need to fund them-
selves. Figure 9 shows the outstanding value of the loans with maturity up to three months (top panel)
and to one year (bottom panel).20 The outstanding amounts on deposits with maturities up to three
months exhibit a significant drop after the Lehman collapse, falling from an average of 324 billion eu-
ros recorded in the four months preceding the Lehman default to 273 billion euros in the four months
after (- 24%). This pattern is clearly visible despite the underestimation of the first three months in the
19In the remaining, the expression “overnight” will be used as for the one-day exchanges. In fact, the Furfine algorithmcannot distinguish between overnight, tomorrow-next and spot-next transactions, since they are characterized by a time lagof one day between the loan and the refund, even if the trade has been agreed on different days (the overnight exchangeshave been negotiated on the very same day of the loan’s settlement, the tomorrow-next and spot-next on t − 1 and t − 2respectively).
20It should be noted that it is possible to estimate the volumes and the outstanding amounts, reliably, only for the centralinterval of the analysed time horizon, since for some maturities the loans or the refunds are not included in the initialTARGET2 dataset. The shorter the maturity is, the longer is the reliability of the estimated dataset. For example, theestimations of the one-day exchanges will be reliable over the whole time span except for the first and the last day ofthe sample: in fact, during the first day it will be impossible to identify the refunds of loans initiated the previous daywhereas in the last day the loans will not be matched with their refunds since these one are not yet available. Similarly,when considering the one year maturity, the algorithm neglects all the refunds that are available in the first twelve monthsand all the loans in the last period of the sample. As a result, the outstanding amounts of money market deposits withmaturity between one day and twelve months can be quantified exactly only between June 2009 and October 2011, whilethe exchanged volumes will be underestimated only in the final period of the sample.
25

Figure 8: Overnight volumes in the euro area - breakdown in domestic and cross-border component(daily averages per maintenance period and outstanding amounts).
sample. While the loans up to three months have remained constant until Portugal’s financial assis-
tance request, with the exception of a physiological cyclicality, the longer-term outstanding amounts
decline with a constant trend in the domestic component partially compensated by a slight increase in
the cross-border one (bottom panel of Figure 9).
Figure 10 (bottom panel) depicts the difference between the estimated weighted average overnight
interest rate and the EONIA for the domestic and the cross-border money market exchanges. Im-
mediately after the Lehman collapse, the estimated weighted average overnight rate departed signif-
icantly from the European fixing until summer 2009, being on average 15 basis points below. As of
mid-2009 the series recoups with the EONIA rate and remains closely aligned with it until summer
2011. The only exception is the period between October 2009 and January 2010 when the domestic
rate exceeds EONIA. With the deepening of the sovereign debt crisis linked to the Italian political
events in the second half of 2011, both the domestic and the cross-border rate deviate consistently
from EONIA: they approach the rate on the ECB overnight deposit facility and, after the ECB’s sec-
26

Figure 9: Outstanding amounts in the deposits in the euro area with maturities up to 3 months and upto twelve months, breakdown into domestic and cross-border component (daily averages per mainte-nance period). Columns presented in transparency refer to the data which are underestimated.
ond 3-year LTRO in late February 2012, they fall below the lower bound of the monetary policy rate
corridor, corroborating the results of Akram and Christophersen (2010).21 Since the main refinancing
operation rate was cut in July 2012, the domestic rate has passed the EONIA, reverting and turning
to a negative spread between the fixing and the estimated rate. The reason why cross-border rates
are consistently lower than the domestic rates from the second half of 2011 may be that only the best
fund-raisers are able to attract liquidity from the European market at lower rates than those paid by
the less reliable banks which are forced to refinance themselves at the domestic level. However, the
phenomenon cannot be confirmed beyond doubt, since information is only available on the settlement
banks, not on the originator and final beneficiary of the monetary transaction.
21Precisely the cross-border rate deviates from the EONIA starting from the month of August, the domestic rate fromNovember 2011.
27

Figure 10: Estimated overnight rates, breakdown in domestic and cross-border.
5.2 Core-versus-periphery level
At a more granular level, we compare money market developments between countries at the core of
the euro area (Germany, France,The Netherlands, Belgium and Finland) and countries at the (geo-
graphic) periphery of the euro area also facing a sovereign debt crisis. These include the program
countries (Greece, Ireland, and Portugal), but also and Italy and Spain. The cross-border exchanges
of peripheral countries have experienced the biggest and most constant decline since the Lehman’s
collapse to the summer of 2012, while the one-day deposits exchanged domestically by the peripheral
countries have gradually increased starting from March 2012 (Figure 11, top panel).
During the first period this could be due to a greater difficulty in evaluating the creditworthiness of
foreign borrowers, itself attributable to non-harmonised insolvency frameworks across Europe; since
the outbreak of the sovereign debt crisis, the reason for such behaviour may lie in distrust of banks
located in the periphery countries. The spread paid by periphery countries towards EONIA (Figure
11, bottom panel) is higher for their domestic deposits than for cross-border ones, presumably due,
again, to an adverse selection effect: the few bank of the periphery countries that are able to raise
28

Figure 11: Estimated overnight volumes and spreads, breakdown into periphery and core countries.
funds from abroad are the most creditworthy counterparties in their country, and they are able to
negotiate lower interest rates in comparison to the other domestic banks which are forced to tap the
domestic money market.
5.3 Country level
We are now focusing on two countries, one belonging to the periphery group (Italy) and the other to
the core euro area countries (the Netherlands). Focusing on Italy, it can be seen that the net cross-
border position of Italian banks was negative in all maintenance periods until the one starting in
December 2011, just before the first 3-year LTRO, when, presumably, interbank money market fund
raising was further replaced by central bank liquidity (Figure 12). However, the net exposure in the
very short term maturity range has been positive since January 2011, while it has been negative for
longer term maturities. The Italian banking system seems therefore to borrow long term funds from
29
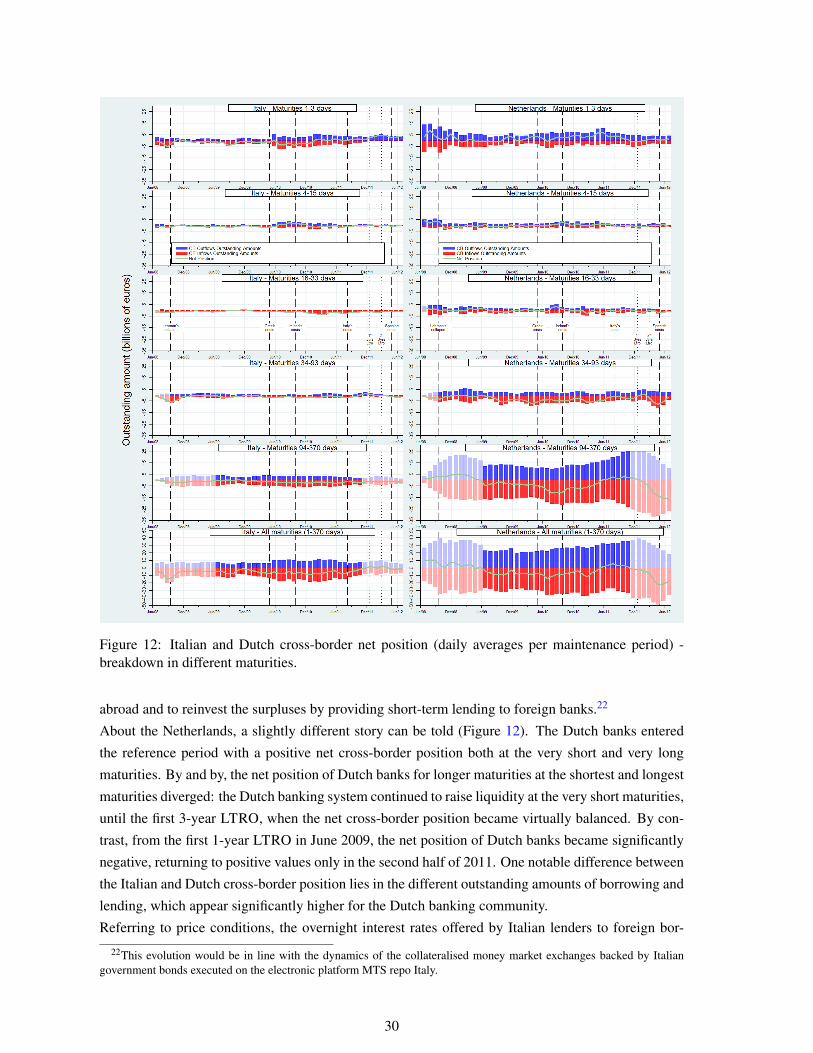
Figure 12: Italian and Dutch cross-border net position (daily averages per maintenance period) -breakdown in different maturities.
abroad and to reinvest the surpluses by providing short-term lending to foreign banks.22
About the Netherlands, a slightly different story can be told (Figure 12). The Dutch banks entered
the reference period with a positive net cross-border position both at the very short and very long
maturities. By and by, the net position of Dutch banks for longer maturities at the shortest and longest
maturities diverged: the Dutch banking system continued to raise liquidity at the very short maturities,
until the first 3-year LTRO, when the net cross-border position became virtually balanced. By con-
trast, from the first 1-year LTRO in June 2009, the net position of Dutch banks became significantly
negative, returning to positive values only in the second half of 2011. One notable difference between
the Italian and Dutch cross-border position lies in the different outstanding amounts of borrowing and
lending, which appear significantly higher for the Dutch banking community.
Referring to price conditions, the overnight interest rates offered by Italian lenders to foreign bor-
22This evolution would be in line with the dynamics of the collateralised money market exchanges backed by Italiangovernment bonds executed on the electronic platform MTS repo Italy.
30

Figure 13: Italian overnight rates, breakdown into domestic and cross-border borrowing and lending.
rowers (cross-border lending) have on average been lower than the ones paid by Italian borrowers to
raise liquidity for one day from abroad (cross-border borrowing - Figure 13). All in all, the rates paid
by the Italian banks have been fairly well aligned with the EONIA rates, with the exception of the
summer of 2011, when the Italian sovereign debt crisis led to a sharp increase of the overnight rates
paid by Italian banks domestically. This increase quickly reversed after the first 3-year LTRO. Again,
the impact of the sovereign debt crisis on the borrowing rates paid by the Italian banking system vis-
a-vis non-domestic counterparties was less severe due to probable selection effects, so that only high
standing Italian players continued to borrow from abroad. By contrast, the Dutch banking community
turned out to be able to borrow at rates well below the EONIA throughout the period, benefiting from
a higher spread during the most severe phase of the sovereign crisis.
31

Figure 14: Dutch overnight rates, breakdown into domestic and cross-border borrowing and lending.
32

6 Conclusions
This paper developed an algorithm to identify unsecured interbank money market loans from TAR-
GET2 data, which is suitable for the whole euro area. This algorithm improves on the version de-
veloped by Furfine (1999), who was the first to develop such an algorithm for overnight loans only,
and the one by Heijmans et al. (2010), who first developed an algorithm for a subset of the euro area
money market. With respect to the original algorithm, several enhancements have been implemented.
The algorithm has been extended mainly in three ways: (i) It identifies money market loans with ma-
turity up to one year; (ii) it incorporates criteria for the implied interest rates: inclusion of the rate in
a plausibility corridor and rounding to half a basis point. Specifically, we investigated two plausible
corridors: one centered on the EONIA for loans up to 4 days and on the respective EURIBOR for
other maturities and the other using the ECB standing facility corridor bounded by the overnight de-
posit facility rate and the marginal lending rate. Each corridor was been tested at several sizes. (iii) It
includes a procedure to efficiently select the correct loan in case of multiple plausible matches. Where
such multiple plausible matches have the same maturity, the ‘correct’ loan is determined randomly;
where the maturities differ, the choice is made on the basis of the most plausible duration within
maturity distribution inferred from the uniquely matched TARGET2 loans.
In contrast to the literature, our dataset of identified interbank loans has been compared with real data
sources, namely EONIA panel data and e-MID transaction-level data. The validation against EO-
NIA panel data has been carried out for overnight identified TARGET2 transactions. Results show
that the average interest rate found by the algorithm matches very well with the reported EONIA.
The average deviation with the EONIA rates are 9 basis points with highest deviation in the period
September 2008 to June 2009. The turnover, however, is roughly 50% higher than that quoted by
the EONIA. Differences between estimated and reported turnover appear due to transactions that are
not reported by EONIA panel banks: (i) intra-group transactions, (ii) transactions settled on behalf
of other banks, (iii) rolled-over transactions and (iv) spot-next and tomorrow-next loans.23 On the
other hand, a source of misidentification are loans reported by EONIA panel banks not settled in
TARGET2 but in commercial bank money or in other payment systems (e.g. EURO1).
The second and more sophisticated validation method, was used against the e-MID dataset. This
method was applied to all maturities, transaction by transaction, and allows to compute the number of
unidentified loans (false negative, Type 2 error) and the wrongly matched loans (real loans but with
incorrect rates and/or maturities, error Type 3). Limits of this validation technique are the impossibil-
ity to estimate the false positive error (Type 1) and the fact that e-MID data are not representative for
the entire euro money market during the whole analysed period. The best performing corridor setup is
the one centered on the EONIA and EURIBOR rates and 200 basis points wide: Type 2 error rate is
1.96% while Type 3 error rate is 0.73%. Analysis of the error rates per maturity shows that the algo-
rithm is more reliable for transactions up to three months. It can be used for loans up to one year using
extra caution with respect to the uncertainties of the loans found. Our findings are in sharp contrast
with Armantier and Copeland (2012), who validate the algorithm developed for Fedwire transaction.
They find an estimate of 81% Type 1 and 23 % Type 2 errors, which are significantly larger.
23This is because our algorithm works on the settlement dates and cannot distinguish between different trading dates.
33

Our algorithm was applied to the whole TARGET2 dataset (June 2008 to end October 2012) to
describe and monitor the activity in the euro area unsecured money market. The monitoring can be
done at market level (all loans found) and at sample level core (Germany, France, The Netherlands,
Belgium and Finland) versus (geographic) periphery of the euro area also facing a sovereign debt
crisis (Greece, Ireland, Italy, Portugal and Spain), at individual country level and at the level of
individual banks.
The results show that the overnight unsecured money market dropped significantly after the collapse
of Lehman Brothers (from 130 billion euros in June 2008 to 79 billion euros in June 2009). The
outstanding amount of all deposits with maturities up to three months exhibits a significant drop
after the Lehman collapse. While the loans up to three months remained constant until Portugal’s
request for financial assistance, the longer-term outstanding amount declines with a constant trend
in the domestic component partially compensated by a slight increase in the cross-border one. The
sovereign debt crisis of the peripheral European countries had a clear negative impact on the turnover
in the money market. One-day exchanges dropped again after the two 3-year LTROs in December
2011 and March 2012 (from on average 75 billion euros in the period before the first 3-year LTRO
to an average of 47 billion euros between January and June 2012). After the rate cut of the ECB
in July 2012 the turnover decreased even further. The interest paid by periphery countries towards
EONIA is higher for the domestic deposits than for the cross-border ones, presumably due to an
adverse selection effect: the banks of the periphery countries that are able to raise funds from abroad
are the most creditworthy counterparties in their home country.
The current setup of our algorithm can be further improved by (i) a more theoretically correct as-
signment of a multiple match and (ii) also looking at loans which follow the 365 day convention
for calculating the rate, as there are also e.g. British banks which follow this convention. Finally,
although our algorithm performs well, and with the inclusion of these improvements may even per-
form better, it would be beneficial for both research and policy purposes to have money market loans
flagged in TARGET2.
34

Annex
Overlapping maturities
Analysing the overlapping of searching corridors varying the loan duration provides a further insight
into the mechanism of the Furfine algorithm. Given rOD, rML and rMRO the Overnight Deposit (OD),
the Marginal Lending (ML) and the Main Refinancing Operation (MRO) rates respectively, the ECB
corridor used by the Furfine algorithm can be expressed as [rOD−δ ;rML+δ ] or as [rMRO−δ1;rMRO+
δ1] supposing that rMRO = (rOD + rML)/2, where δ1 = δ +(rOD − rML)/2.
Let us consider a loan characterised by x the amount of the loan, r the traded rate, d the set-up date
and i the duration of the loan. As the Furfine algorithm assumes that x belongs to a discrete set, not all
possible loan values are allowed and the correct working of the algorithm implies that the repayment
(capital plus interests) is lower than the next plausible amount in the discrete set. In other words, the
sum of the loan (e.g. 1 million euros) plus the interest (1,000,000 · (1+ r) · i/360) should be lower
than next plausible loan amount, i.e. 1,100,000 euros if we assume a minimum tick of EUR 100,000.
The Furfine algorithm looks for reverse transactions at days d + i, in the range [x + gMIN(i);x +
gMAX(i)] where gMIN(i) and gMAX(i) are given by:
gMAX(i) =x · (rMRO +δ1)
360· i (1)
gMIN(i) =x · (rMRO −δ1)
360· i (2)
and represent the maximum and minimum interest accruable with i days loan duration. In the Furfine
matching process (Figure 15), there is intra-maturity ambiguity between i days loan duration and i+k
and/or i− k when
gMIN(i+ k)< gMAX(i) and gMAX(i− k)> gMIN(i) for k < i (3)
and
gMIN(i+ k)< gMAX(i) for k > i (4)
Substituting gMIN(i) and gMAX(i) in the previous formula we obtain that for k < i the corridors collides
twice, both if rMRO+δ1rMRO−δ1
> i+ki and if rMRO+δ1
rMRO−δ1> i
i−k , whereas for k > i they collide once if rMRO+δ1rMRO−δ1
> i+ki .
Defining ϕ = rMRO+δ1rMRO−δ1
, introducing the step function u(x− t) that is equal to 1 if x ≥ t and 0 if x < t
and given the maturity i, we can define the number of maturities that collide in terms of ϕ as
N(i) =M−i
∑k=1
u(ϕ − i+ k
i
)+
i−1
∑k=1
u(ϕ − i
i− k
)(5)
where M is the maximum possible maturity, for example 365 days. The ratio between the overlap
size and the corridor size of maturity is given by
βUP(i,k) = max(0;
gMAX(i)−gMIN(i+ k)gMAX(i)−gMIN(i)
)(6)
35

Figure 15: Overlapping corridors.
for maturities greater than i and by
βDOWN(i,k) = max(0;
gMAX(i− k)−gMIN(i)gMAX(i)−gMIN(i)
)(7)
for maturities smaller than i.
Weighting collisions with the ratio between the overlap size and the corridor size, we obtain the
number of normalised collisions which provides an indication of the probability a certain maturity
collides with others. That is
N(i) =M−i
∑k=1
βUP(i,k) ·u(ϕ − i+ k
i
)+
i−1
∑k=1
βDOWN(i,k) ·u(ϕ − i
i− k
)(8)
Figure 16 depicts the weighted number of overlapping corridors for three different values of the MRO
rate (1, 2 and 4%) and for different corridor configurations (δ1 equals to 25, 75 and 100 bps).
It can be observed that N(i) increases rapidly when the maturity increases: it reaches its maximum
value depending both on the MRO rate and on the corridor parameters and then decreases slowly be-
cause the number of overlapping corridors decreases, whereas the overlapping corridor size increases.
The solid blue line depicts the case MRO=1% and δ1 = 100 bps; in this case the figure degenerates
since the size of the corridors includes 0% interest rate implying that all maturities collide with each
other.
The analysis confirms that for longer maturities, the collision probability, which depends on the
weighted number of overlapping corridors, increases steadily making the estimation of high matu-
rity transactions less reliable than for short maturities. This evidence shows how the rate cuts that
have occurred during the analysed time horizon have made it more difficult for the Furfine algorithm
to disentangle higher maturities.
36

Figure 16: Weighted number of overlapping corridors for different corridor configurations.
The algorithm
All the amount transactions from bank A to bank B and from B to A (where a bank is identified by
the BIC code of the settlement account) are stored in two vectors of N and M length respectively, xAB
and xBA and the correspondent dates into the vectors dAB and dBA. From the two vectors a matrix MAB
of all possible matches is created, where the element (i, j) is set to 1 if a plausible match is identified
from A to B, to -1 if a plausible match is identified from B to A and 0 in event that no match is found.
For instance for a loan from A to B, given xAB(i) the amount of transaction between A and B, xBA( j)
the amount from B to A, dAB(i) and dBA j the dates of the two transactions, a plausible match occurred
if the following conditions are verified simultaneously:
• xAB(i)< xBA( j).
• dAB(i)< dBA( j) and dBA( j)−dAB(i) is lower or equal than the greatest searched maturity, e.g.
370 days.
• xAB(i) respect the increment rule.
• r = xBA( j)−xAB(i)xAB(i)
· D360 is a one half basis point multiple.
• r is in the plausible corridor.
37

In case the match occurs, MAB(i, j) is set to 1 and the rate is stored in RAB(i, j). Moreover, the number
of matches per transactions is stored in two vectors, cAB and cBA, and incremented when a match if
found.
In the second phase, the MAB is looked up to search all unique matches, i.e. if MAB(i, j) is not equal
to 0 and cAB(i) and cBA( j) are 1. The value of MAB(i, j) is zeroed.
In the third phase, the MAB is looked up to search all the multiple matches loans, i.e. if MAB(i, j) is
not equal to 0 and cAB(i) or cBA( j) are greater than 1. In this phase the plausible durations are chosen
on the basis of the frequency of the duration computed from the unique matches set.
38

References
Akram, F. A. and Christophersen, C. (2010). Interbank overnight rates - gains from systemic impor-
tance. Norges Bank Working Paper, 11.
Armantier, O. and Copeland, A. M. (2012). Assessing the quality of Furfine-Based algorithms. Staff
Report 575, Federal Reserve Bank of New York.
BIS (2012). Quarterly review. Technical report, Bank for International Settlements.
Cappelletti, G., Socio, A. D., Guazzarotti, G., and Mallucci, E. (2011). The impact of the financial
crisis on inter-bank funding: evidence from italian balance sheet data. Questioni di Economia e
Finanza (Occasional Papers) 95, Bank of Italy.
Demiralp, S., Preslopsky, B., and Whitesell, W. (2004). Overnight interbank loans. Manuscript Board
of Governors of the Federal Reserve.
ECB (2010). The ECB’s response to the financial crisis. Monthly Bulletin, pages 59–74.
ECB (2012). Euro money market survey. Frankfurt am Main: ECB.
Furfine, C. (1999). The microstructure of the federal funds market. Financial Markets, Institutions
and Instruments, 8:24–44.
Guggenheim, B., Kraenzlin, S., and Schumacher, S. (2010). Solving the puzzle: Evidence of the
unsecured Swiss franc money market. Swiss National Bank Working Paper, 5.
Heider, F., Hoerova, M., and Holthausen, C. (2009). Liquidity hoarding and interbank market spreads:
The role of counterparty risk. Working Paper Series 1126, European Central Bank.
Heijmans, R., Heuver, R., and Walraven, D. (2010). Monitoring the unsecured interbank money
market using TARGET2 data. DNB Working Paper, 276.
Hendry, S. and Kamhi, N. (2007). Uncollateralized overnight loans settled in LVTS. Bank of Canada
Working Paper, 07-11.
Kokkola, T., editor (2010). The Payment System. Payments, Securities and Derivatives, and the role
of the Eurosystem. Frankfurt am Main: ECB.
Millard, S. and Polenghi, M. (2004). The relationship between the overnight interbank unsecured
loan market and the CHAPS sterling system. Bank of England Quarterly bulletin, Spring.
Monticini, A. and Ravazzolo, F. (2011). Forecasting the intraday market price of money. Working
Paper 2011/06, Norges Bank.
van Riet, A. E. (2010). Euro fiscal policy and the crisis. ECB occasional paper series, 109.
39

DN
B W
OR
KIN
GP
AP
ER
DNB Working PaperNo. 35/April 2005
Jan Kakes and Cees Ullersma
Financial acceleration of booms
and busts
De Nederlandsche BankDe Nederlandsche Bank

Previous DNB Working Papers in 2013 No. 367 Andrea Colciago and Lorenza Rossi, Firm Entry, Endogenous Markups and the Dynamics
of the Labor Share of Income No. 368 Dirk Broeders, Paul Hilbers and David Rijsbergen, What drives pension indexation in
turbulent times? An empirical examination of Dutch pension funds