DNA: an overview
23
-
Upload
cisco-devnet -
Category
Technology
-
view
294 -
download
0
Transcript of DNA: an overview


Distributed Network Analytics
Presenter: Alexander Clemm, Principal Engineer, Cisco
on behalf of the Distributed Network Analytics Team

Network Analytics – current state of the art
• Analytics of network telemetry data helps solve operational problems
• Predict bottlenecks, spot brownouts, attacks, degradations
• Detect trends and changes, identify hotspot, outliers, anomalies
• Enable proactive mitigation, preventive actions
• Traditional Big Data analytics processing occurs at the backend
• Conceptually centralized scale-out processing infrastructure for vast amounts of data
• Hadoop/HDFS, Map/Reduce, Hive, Pig, Storm, Spark, etc
• Unstated assumptions
• Vast data streams are readily available (and mostly “free”)
• System management is a problem that someone else will solve
• Users/Customers are always okay with their data being sucked up into the cloud

In network analytics,Big Data assumptions no longer hold
• Networking data can be expensive to generate, not just to process
• Measurements (IPSLA)
• MIB sampling (stats polling frequencies)
• Flow sampling (microbursts)
• Constrained links may limit the amount of available data
Processing of data no longer necessarily the bottleneck
• Which data should be generated when you cannot generate it all
• How to dynamically adapt depending on current conditions
• How to orchestrate data generation, stream management, analytics
• Do it at scale, across the network
• Need for dynamic adaptation compounds system management problem

Analyze
Generate
Act
Export
Collect
Generate
Analyze
Distributed Network Analytics - Concept• A distributed framework to orchestrate and control the
generation, collection, and analysis of network telemetry data inside the network
• Perform analytics inside the network
• Stream analytics results, not raw data – datainformation
• Better signal-to-noise ratio – “Less haystack, more needles”
• Less waste, faster control loops
• Tradeoff resources, cycles for analytics processing vs. savings in generating, exporting data
• Address the entire analytics lifecyle
• Integrated control and dynamic adaptation of data sources
• Zoom into & generate data that is needed, when it is needed
• Minimize secondary management tasks, avoid waste
• Modular, open, data-driven
• Any data source
• Any export format, control interface
• Embeddable, pluggable analytics engine
Act
Export
Collect
Big Data DNA
NOC/OSS
Put Big Data smarts into the network
Address the entire analytics lifecycle
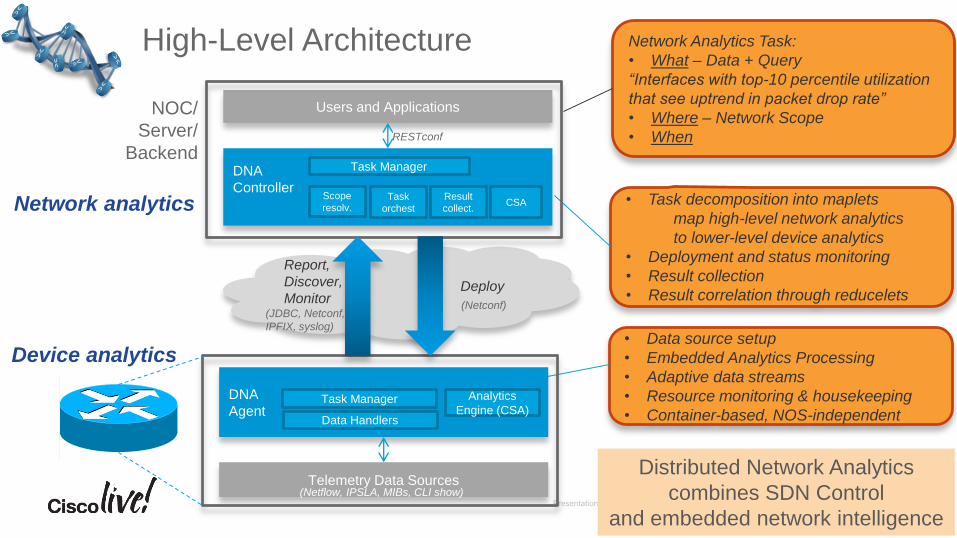
Network Analytics Task:
• What – Data + Query
“Interfaces with top-10 percentile utilization
that see uptrend in packet drop rate”
• Where – Network Scope
• When
• Task decomposition into maplets
map high-level network analytics
to lower-level device analytics
• Deployment and status monitoring
• Result collection
• Result correlation through reducelets
• Data source setup
• Embedded Analytics Processing
• Adaptive data streams
• Resource monitoring & housekeeping
• Container-based, NOS-independent
Distributed Network Analytics
combines SDN Control
and embedded network intelligence
Users and Applications
DNA
Controller
DNA
Agent
Telemetry Data Sources
NOC/
Server/
Backend
Deploy
Report,
Discover,
Monitor
Analytics
Engine (CSA)Data Handlers
Task Manager
Task Manager
Scope
resolv.Task
orchest
Result
collect.CSANetwork analytics
Device analytics
RESTconf
(Netflow, IPSLA, MIBs, CLI show)
(JDBC, Netconf,
IPFIX, syslog)
(Netconf)
High-Level Architecture

Architectural guiding principles
• Bring processing to data, not data to processing Delegate smarts as close to the source as possible
Agents, not controllers, perform device-specific renderings of capabilities
• Promise theoryAgents enter promises that they keep or let the controller know when they are broken
(as opposed to RPC semantics: invoke-and-forget)
Increases robustness, scalability of distributed solutions
• Model-driven analytics Network Analytics Templates combine ease-of-use with low-level programmability
Templates allow for easy customization of network analytics tasks
Template bindings define mapping, rendering of templates to analytics logic and agent capabilities
YANG-model driven architecture – generate Netconf, Restconf, programming APIs
Note: any data can be subjected to analytics, does not have to be YANG
• Pluggable everything – data sources, export renderings, stream processing (analytics, machine learning)

Maplets and reducelets
• Network Analytics Task: Requested by a user from controller
• Maplet: Device analytics task delegated by controller to agent
• Data source setup, analytics query
• Decomposition specified by controller, or (future) derived by DNA agent
• Multi-stage analyticsTrigger supporting analytics (e.g. addl. data)
“Analytics zooming”
• Reducelet: an analytics task performed by DNA controller on maplet results
(Cross-device aggregation)
User
DNA Controller
DNA Agent
NE/data sources
(1) Request task
(2) Resolve network scope,
map template tasks into queries
(3) Deploy maplets
(4) DNA CAC
(5) Data producer setup
(6) Query engine setup
(7) ack
(8) Task status maint.
(9) Data stream start
(10) Aggregation
(11) Report results
(ongoing/one-time)
(12) Result aggregation
(optional: reducelet processing)
(13) Report results
(14) Auto-cleanup
if not refreshed
Does not depict multistage

Programming Distributed Network Analytics:Network Analytics Template definition
<template>
<name>NetworkPerformanceUsingIpslaProbes</name>
<summary><p>Use this template to monitor trends...</p></summary>
<parameters>
<parameter>
<tmp-var>mval</tmp-var>
<x:input-type xmlns:x="urn:…yang:dna:network-dna">x:text</x:input-type>
<label>M Value</label>
<help-string> Specify the M value for trending....</help-string>
</parameter>
...
</parameters>
<required-caps>
<exports>
<x:export xmlns:x="urn:…yang:dna:network-dna">x:jdbc</x:export>
</exports>
<telemetry>
<x:source xmlns:x="urn:…yang:dna:network-dna">x:ipsla</x:source>
</telemetry>
<analytics>
<x:engine xmlns:x="urn:…yang:dna:network-dna">x:cqe</x:engine>
</analytics>
</required-caps>
…
Network Analytics Templates
• Preestablished semantics
• Customizable parameters
• Include mapping to maplets
(and reducelet) • Generates analytics queries
interpretable by analytics
engine
• Build out library over time
• YANG-model driven
Template parameters
Required capabilities
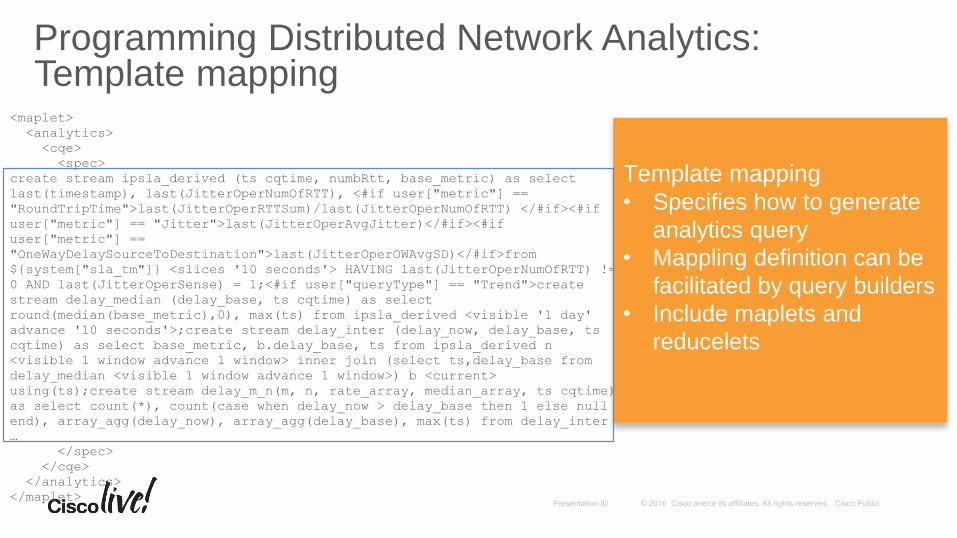
Programming Distributed Network Analytics: Template mapping
<maplet>
<analytics>
<cqe>
<spec>
create stream ipsla_derived (ts cqtime, numbRtt, base_metric) as select
last(timestamp), last(JitterOperNumOfRTT), <#if user["metric"] ==
"RoundTripTime">last(JitterOperRTTSum)/last(JitterOperNumOfRTT) </#if><#if
user["metric"] == "Jitter">last(JitterOperAvgJitter)</#if><#if
user["metric"] ==
"OneWayDelaySourceToDestination">last(JitterOperOWAvgSD)</#if>from
${system["sla_tm"]} <slices '10 seconds'> HAVING last(JitterOperNumOfRTT) !=
0 AND last(JitterOperSense) = 1;<#if user["queryType"] == "Trend">create
stream delay_median (delay_base, ts cqtime) as select
round(median(base_metric),0), max(ts) from ipsla_derived <visible '1 day'
advance '10 seconds'>;create stream delay_inter (delay_now, delay_base, ts
cqtime) as select base_metric, b.delay_base, ts from ipsla_derived n
<visible 1 window advance 1 window> inner join (select ts,delay_base from
delay_median <visible 1 window advance 1 window>) b <current>
using(ts);create stream delay_m_n(m, n, rate_array, median_array, ts cqtime)
as select count(*), count(case when delay_now > delay_base then 1 else null
end), array_agg(delay_now), array_agg(delay_base), max(ts) from delay_inter
…
</spec>
</cqe>
</analytics>
</maplet>
Template mapping
• Specifies how to generate
analytics query
• Mappling definition can be
facilitated by query builders
• Include maplets and
reducelets

Example analytics tasks
• Distributed reporting
• Give me histograms of link utilizations from each node… across links… for the next hour… next day
• Don’t export raw data, but conclusions
• Proactive monitoring
• When you detect onset of business-critical application traffic, initiate IPSLA measurements, increase link stats sampling, alert me if service levels drop below normal
• Mash up multiple data sources, adapt data generation
• Predictive service assurance
• For links with top-10 percentile utilization, build a trend profile of packet drop rates and send me link stats analysis in case of sustained down trend for an hour
Sweet spot:
• Lots of data, simple processing
• Low signal/noise ratio,
high aggregation/compression
• Changing data needs,
adaptive data generation
Typical use cases: real time ops
• Direct attention to changes
• Detect outliers
• Identify hotspots
Does not address:
• Historical analysis
• Mining (other than baselining)
• Business analytics

Sample Use Cases
Use case Description
Proactive health
monitoring
Monitor and trend utilization data, KPIs, interface stats
Dynamic thresholding against learned baselines and normalcy ranges
Avoid polling, aggregate and reduce data (WAN links)
Application visibility and
path analytics
Detect onset of critical application traffic to trigger additional measurements;
intersect with network hotspots
Network performance
monitoring
Mark and monitor critical traffic across network, collect and analyze micro-flow
data for improved measurements and visibility
Smart Data Collection Direct detailed data collection for centralized analytics based on certain
conditions in the network
Trending analytics Monitor, analyze trends of interface statistics, IPSLA measurements. Direct
attention to change, hot spots; avoid need for threshold configuration
Future: IoT analytics, Security, Network Forensics

Implementation aspects
• Distributed Network Analytics Agent
• Linux Container app
• IOX as app hosting and deployment framework
• Growing set of platforms - CSR 1000v, ISR 4K, ASR 9K, ASR 903, 920
• Orchestration of device analytics: stream generation, collection, single- or multistage analytics
• YANG models represent device analytics tasks, deploy tasks using Netconf/Restconf
• Pluggable telemetry data sources:MIBs, CLI/show, Netflow, IPSLA, DMO (sensor data, traffic data), YANG-push
• Choice of exports (JDBC, IPFIX, syslog) for separate collector option
• Embedded Analytics Engine: CSA (Connected Streaming Analytics)
• Continuous stream queries - telemetry data streams mapped to tables
• SQL queries persist, results updated as rows are added or aged out
• Primitives to control window slicing, chunking (assessment of results)

Implementation aspects (contd.)
• Distributed Network Analytics Controller
• Portable SDN Controller app on top of Open Daylight• Leverage network inventory, discovery, topology
• MD-SAL, Netconf client plugin for device communications
• CSA for cross-device analytics (analysis of DNA agent result streams)
• Leverage network inventory, discovery, topology
• MDA: YANG models to define analytics tasks, generate RESTconf + APIs
• Optional front-end GUI to control network analytics deployment
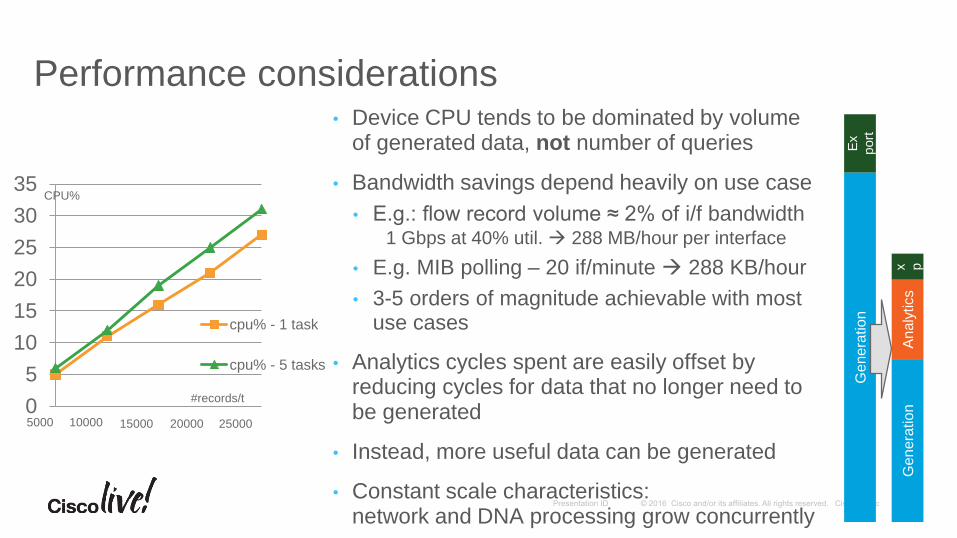
Performance considerations• Device CPU tends to be dominated by volume
of generated data, not number of queries
• Bandwidth savings depend heavily on use case
• E.g.: flow record volume ≈ 2% of i/f bandwidth1 Gbps at 40% util. 288 MB/hour per interface
• E.g. MIB polling – 20 if/minute 288 KB/hour
• 3-5 orders of magnitude achievable with most use cases
• Analytics cycles spent are easily offset by reducing cycles for data that no longer need to be generated
• Instead, more useful data can be generated
• Constant scale characteristics: network and DNA processing grow concurrently
0
5
10
15
20
25
30
35
cpu% - 1 task
cpu% - 5 tasks
5000 10000 15000 20000 25000
#records/t
CPU%
Genera
tion
Analy
tics
x p
Ge
ne
ratio
nE
x
port

Conclusions
DNA
Analytics at the edge Scale, performance, privacy
Orchestration of
analytics tasksNetwork analytics, not
device analytics
Integrated control,
setup of data sources“Just In Time” dynamic
configuration, adaptation
• Distributed Network Analytics is a framework for analytics processing in the network, across the network
• Data isn’t free –Tradeoff processing vs. generating of data
• Analytics lifecycle as important as analytics processing itself (Big Data does not address this)
• Dynamic configuration, adaptation of data sources integral part of analytics setup
• SDN controllers and smart programmable network intelligence complement each other
• Please visit our demo

Demo Screenshots

Configuration of a DNA
Network Analytics Task
• Templates are “precanned”
analytics tasks supplied by the
controller
Customizable yet very easy-to-use
• Parameters, help texts rendered
by data-driven GUI
• Network Scope defined by policy:
draw, device type, tags, scopes of
previous tasks, …

Configuration of a DNA
Network Analytics Task (contd.)
• Select from drag-down lists,
populated by capabilities
discovered by the controller
• Templates may be associated with
specific capabilities, nodes that
cannot support a given analytics
task are automatically “greyed out”
• DNA infra maps templates
internally into queries and data
source config
• Capabilities can be “rendered” by
DNA Agents where heterogeneity
would otherwise be an issue

Visualization of Analytics
Results
• “Watch” any given task
• GUI displays scope and status
of the query
• Timeline visualizes when
network identifies analytics
matches on “event timeline”
• Zoom into analytics records
• Provide analytics task status
“on demand”

Visualization of Analytics Results
• “Watch” any given task
• GUI displays scope and status
of the query
• Timeline visualizes when
network identifies analytics
matches on “event timeline”
• Zoom into analytics records,
analytics task status “on
demand”