DMTM 2015 - 07 Hierarchical Clustering
48
Prof. Pier Luca Lanzi Clustering: Hierarchical Data Mining and Text Mining (UIC 583 @ Politecnico di Milano)
-
Upload
pier-luca-lanzi -
Category
Education
-
view
53 -
download
3
Transcript of DMTM 2015 - 07 Hierarchical Clustering

Prof. Pier Luca Lanzi
Clustering: Hierarchical���Data Mining and Text Mining (UIC 583 @ Politecnico di Milano)

Prof. Pier Luca Lanzi
Prof. Pier Luca Lanzi
3
Prof. Pier Luca Lanzi
4

Prof. Pier Luca Lanzi
5

Prof. Pier Luca Lanzi
6

Prof. Pier Luca Lanzi
7

Prof. Pier Luca Lanzi
8
Prof. Pier Luca Lanzi
9

Prof. Pier Luca Lanzi
10
Prof. Pier Luca Lanzi
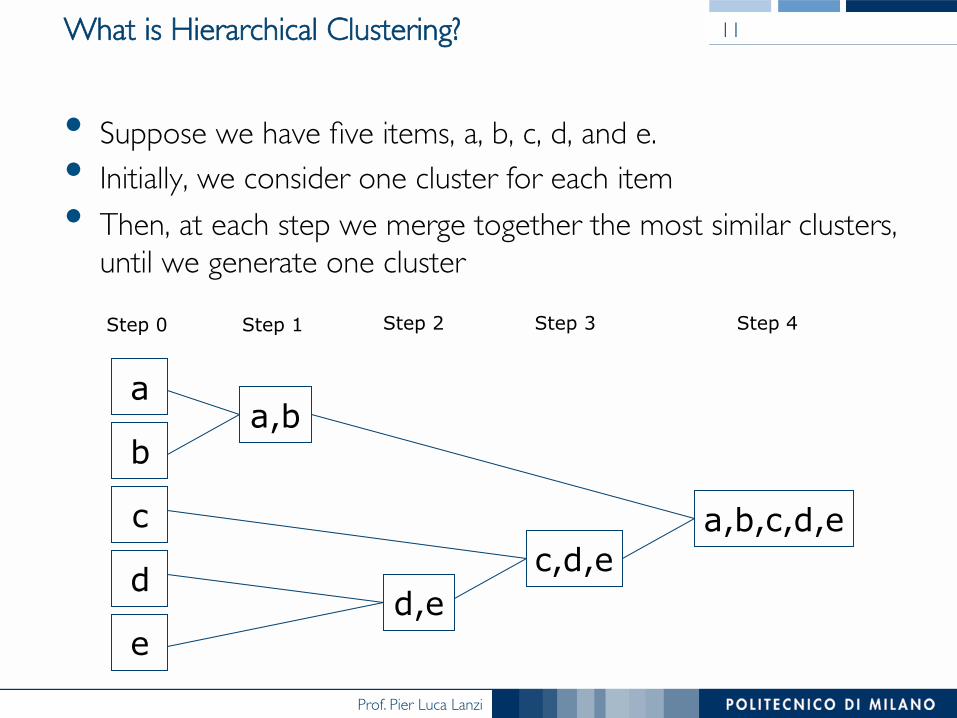
What is Hierarchical Clustering?
• Suppose we have five items, a, b, c, d, and e.• Initially, we consider one cluster for each item• Then, at each step we merge together the most similar clusters,���
until we generate one cluster
a
b
c
d
e
a,b
d,e c,d,e
a,b,c,d,e
Step 0 Step 1 Step 2 Step 3 Step 4
11

Prof. Pier Luca Lanzi
What is Hierarchical Clustering?
• Alternatively, we start from one cluster containing the five elements
• Then, at each step we split one cluster to improve intracluster similarity, until all the elements are contained in one cluster
c
a
b
d
e d,e
a,b,c,d,e
a,b
c,d,e
Step 4 Step 3 Step 2 Step 1 Step 0

Prof. Pier Luca Lanzi
What is Hierarchical Clustering?
• By far, it is the most common clustering technique• Produces a hierarchy of nested clusters • The hiearchy be visualized as a dendrogram: a tree like diagram
that records the sequences of merges or splits
a
b
c
d
e
a,b
d,e c,d,e
a,b,c,d,e
13
Prof. Pier Luca Lanzi
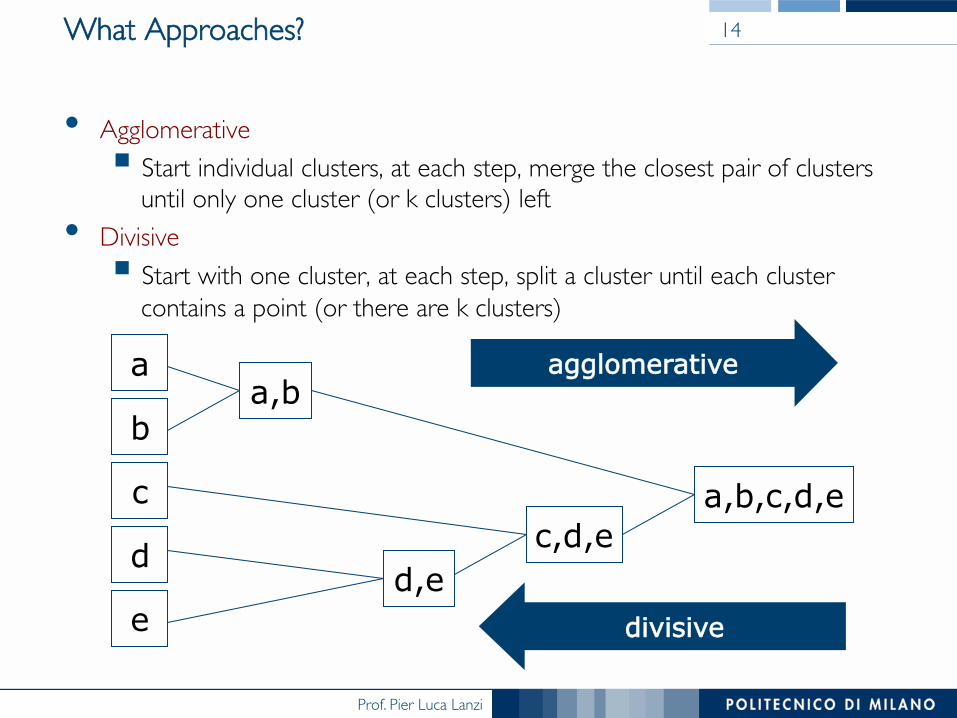
What Approaches?
• Agglomerative § Start individual clusters, at each step, merge the closest pair of clusters ���
until only one cluster (or k clusters) left• Divisive
§ Start with one cluster, at each step, split a cluster until each cluster ���contains a point (or there are k clusters)
14
a
b
c
d
e
a,b
d,e c,d,e
a,b,c,d,e
agglomerative
divisive

Prof. Pier Luca Lanzi
Strengths of Hierarchical Clustering
• No need to assume any particular number of clusters
• Any desired number of clusters can be obtained by ‘cutting’ the dendogram at the proper level
• They may correspond to meaningful taxonomies
• Example in biological sciences (e.g., animal kingdom, phylogeny reconstruction, …)
• Traditional hierarchical algorithms use a similarity ���or distance matrix to merge or split one cluster at a time
15

Prof. Pier Luca Lanzi
Agglomerative Clustering Algorithm
• More popular hierarchical clustering technique
• Compute the proximity matrix• Let each data point be a cluster• Repeat§ Merge the two closest clusters§ Update the proximity matrix
• Until only a single cluster remains
• Key operation is the computation of the proximity of two clusters• Different approaches to defining the distance between clusters
distinguish the different algorithms
16

Prof. Pier Luca Lanzi
Hierarchical Clustering: ���Time and Space Requirements
• O(N2) space since it uses the proximity matrix. § N is the number of points.
• O(N3) time in many cases§ There are N steps and at each step the size, N2, proximity
matrix must be updated and searched§ Complexity can be reduced to O(N2 log(N) ) ���
time for some approaches
17

Prof. Pier Luca Lanzi
Efficient Implementation
• Compute the distance between all pairs of points [O(N2)]
• Insert the pairs and their distances into a priority queue to fine the min in one step [O(N2)]
• When two clusters are merged, we remove all entries in the priority queue involving one of these two clusters [O(Nlog N)]
• Compute all the distances between the new cluster and the re- maining clusters [O(NlogN)]
• Since the last two steps are executed at most N time, the complexity of the whole algorithms is O(N2logN)
18

Prof. Pier Luca Lanzi
Hierarchical Clustering in R
# init the seed to be able to repeat the experiment set.seed(1234)
par(mar=c(0,0,0,0))
# randomly generates the data
x<-rnorm(12, mean=rep(1:3,each=4), sd=0.2)
y<-rnorm(12, mean=rep(c(1,2,1),each=4), sd=0.2)
plot(x,y,pch=19,cex=2,col="blue")
# distance matrix
d <- data.frame(x,y)
dm <- dist(d)
# generate the
cl <- hclust(dm)
plot(cl)
# other ways to plot dendrograms
# http://rstudio-pubs-static.s3.amazonaws.com/1876_df0bf890dd54461f98719b461d987c3d.html
19

Prof. Pier Luca Lanzi
hierarchical clustering generatesa set of N possible partitions
which one should I choose?
Prof. Pier Luca Lanzi
From the previous lecture we know ideallya good cluster should partition points so that …
Data points in the same cluster should havea small distance from one another
Data points in different clusters should be at a large distance from one another.

Prof. Pier Luca Lanzi
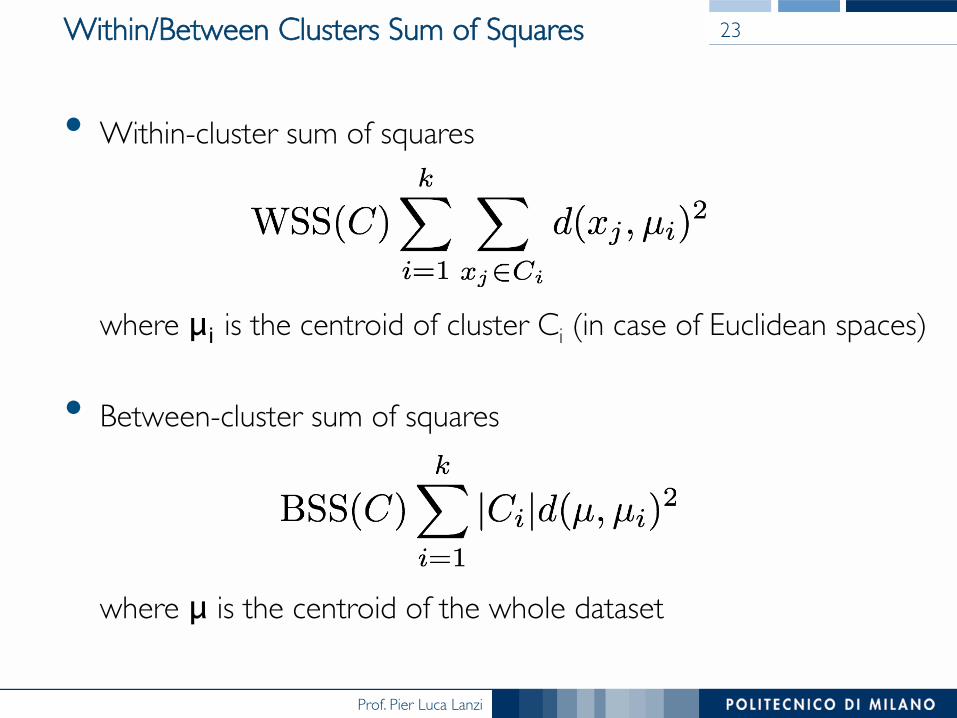
Within/Between Clusters Sum of Squares
• Within-cluster sum of squares���������������where μi is the centroid of cluster Ci (in case of Euclidean spaces)
• Between-cluster sum of squares���������������where μ is the centroid of the whole dataset
22
Prof. Pier Luca Lanzi
Within/Between Clusters Sum of Squares
• Within-cluster sum of squares���������������where μi is the centroid of cluster Ci (in case of Euclidean spaces)
• Between-cluster sum of squares���������������where μ is the centroid of the whole dataset
23

Prof. Pier Luca Lanzi
Evaluation of Hierarchical Clustering using Knee Analysis
plot the WSS and BSS for every clustering and lookfor a knee in the plot that show a significant
modification in the evaluation metrics

Prof. Pier Luca Lanzi
Evaluation of Clustering in R
library(GMD)
###
### checking the quality of the previous cluster
###
# init two vectors that will contain the evaluation
# in terms of within and between sum of squares
plot_wss = rep(0,12)
plot_bss = rep(0,12)
# evaluate every clustering
for(i in 1:12)
{
clusters <- cutree(cl,i)
eval <- css(dm,clusters);
plot_wss[i] <- eval$totwss
plot_bss[i] <- eval$totbss
}
25
Prof. Pier Luca Lanzi
Evaluation of Clustering in R
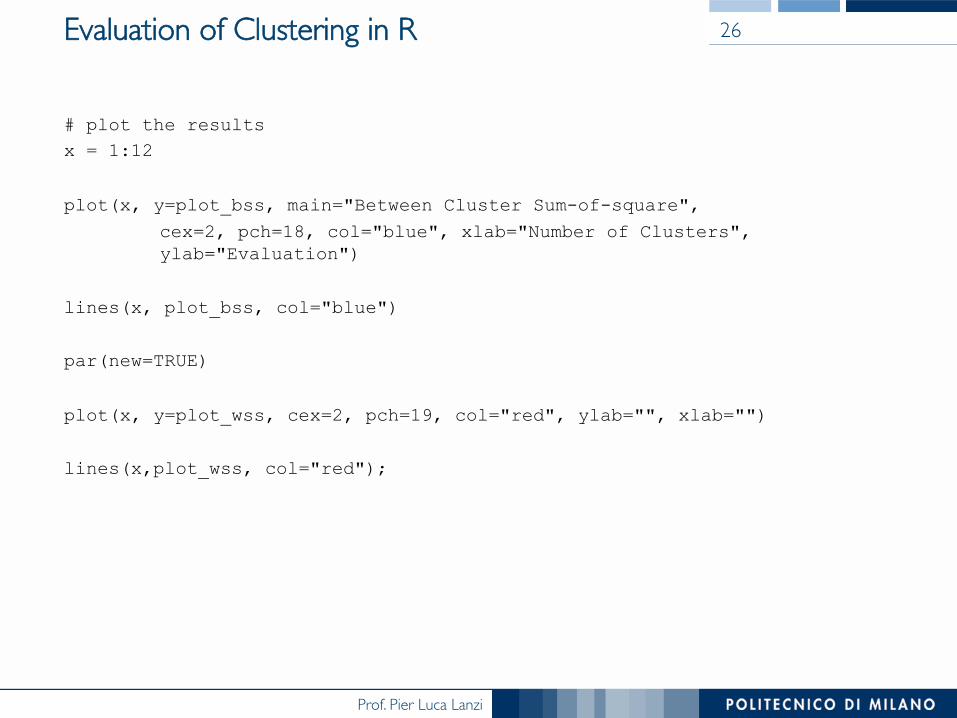
# plot the results x = 1:12
plot(x, y=plot_bss, main="Between Cluster Sum-of-square",
cex=2, pch=18, col="blue", xlab="Number of Clusters", ylab="Evaluation")
lines(x, plot_bss, col="blue")
par(new=TRUE)
plot(x, y=plot_wss, cex=2, pch=19, col="red", ylab="", xlab="")
lines(x,plot_wss, col="red");
26

Prof. Pier Luca Lanzi
Knee/Elbow Analysis of Clustering 27

Prof. Pier Luca Lanzi
Hierarchical Clustering in R – Iris2D
library(foreign)
iris = read.arff("iris.2D.arff")
with(iris, plot(petallength,petalwidth, col="blue", pch=19, cex=2))
dm <- dist(iris[,1:2])
cl <- hclust(iris_dist, method="single")
#clustering <- hclust(dist(iris[,1:2],method="manhattan"), method="single")
plot(cl)
cl_average <- hclust(iris_dist, method="average")
plot(clustering)
cutree(clustering,2)
28

Prof. Pier Luca Lanzi
Knee/Elbow Analysis of Clustering for iris2D 29

Prof. Pier Luca Lanzi
Knee/Elbow Analysis of Clustering for iris 30

Prof. Pier Luca Lanzi
http://en.wikipedia.org/wiki/Determining_the_number_of_clusters_in_a_data_set

Prof. Pier Luca Lanzi
distance between clusters
Prof. Pier Luca Lanzi
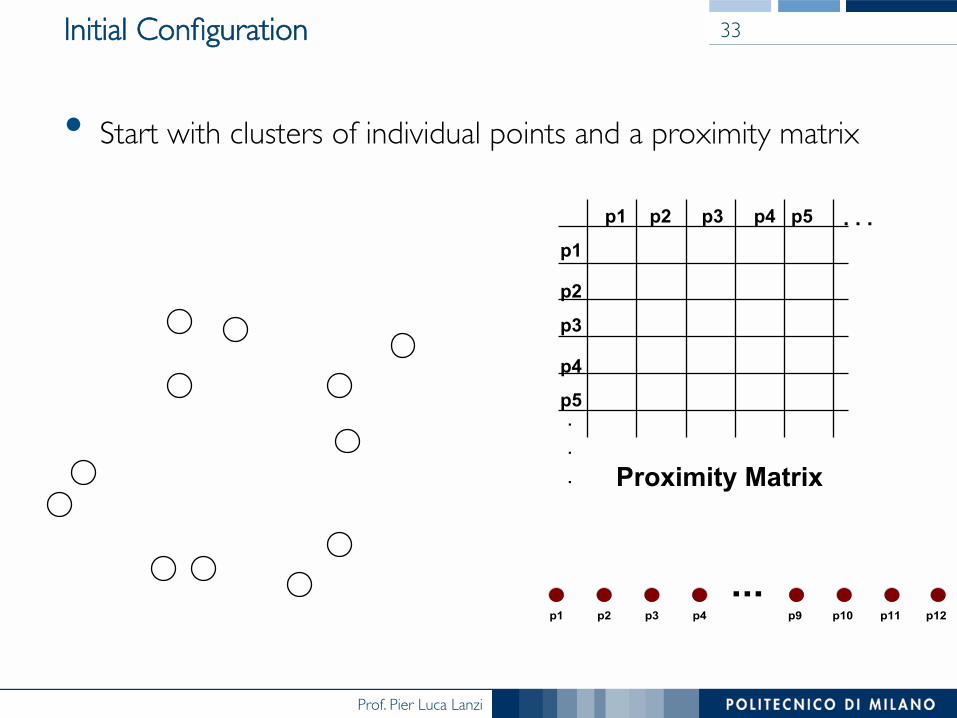
Initial Configuration
• Start with clusters of individual points and a proximity matrix
...p1 p2 p3 p4 p9 p10 p11 p12
p1
p3
p5
p4
p2
p1 p2 p3 p4 p5 . . .
.
.
. Proximity Matrix
33

Prof. Pier Luca Lanzi
Intermediate Situation
• After some merging steps, we have some clusters
...p1 p2 p3 p4 p9 p10 p11 p12
C1
C4
C2 C5
C3
C2 C1
C1
C3
C5
C4
C2
C3 C4 C5
Proximity Matrix
34

Prof. Pier Luca Lanzi
Intermediate Situation
• We want to merge the two closest clusters (C2 and C5) and update the proximity matrix.
...p1 p2 p3 p4 p9 p10 p11 p12
C1
C4
C2 C5
C3
C2 C1
C1
C3
C5
C4
C2
C3 C4 C5
Proximity Matrix
35
Prof. Pier Luca Lanzi
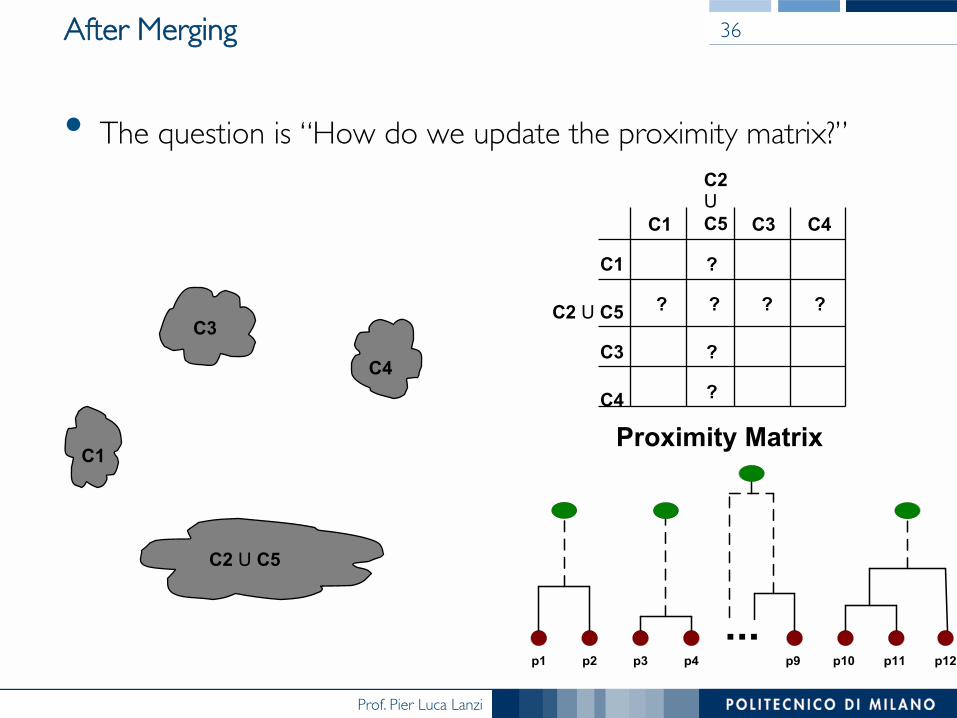
After Merging
• The question is “How do we update the proximity matrix?”
...p1 p2 p3 p4 p9 p10 p11 p12
C1
C4
C2 U C5
C3 ? ? ? ?
?
?
?
C2 U C5 C1
C1
C3
C4
C2 U C5
C3 C4
Proximity Matrix
36
Prof. Pier Luca Lanzi
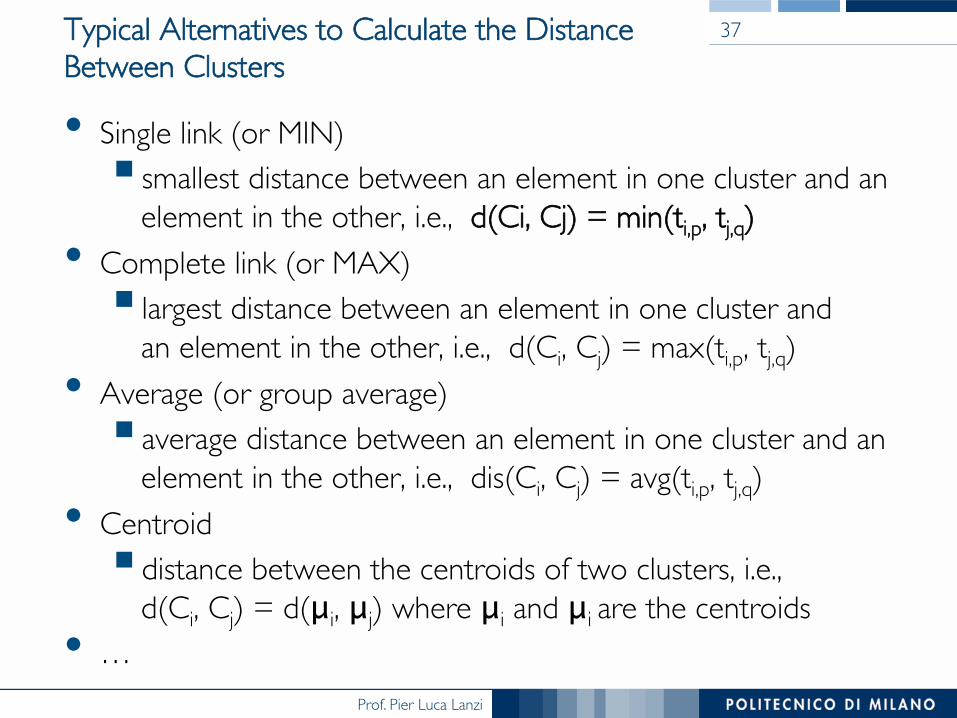
Typical Alternatives to Calculate the Distance Between Clusters
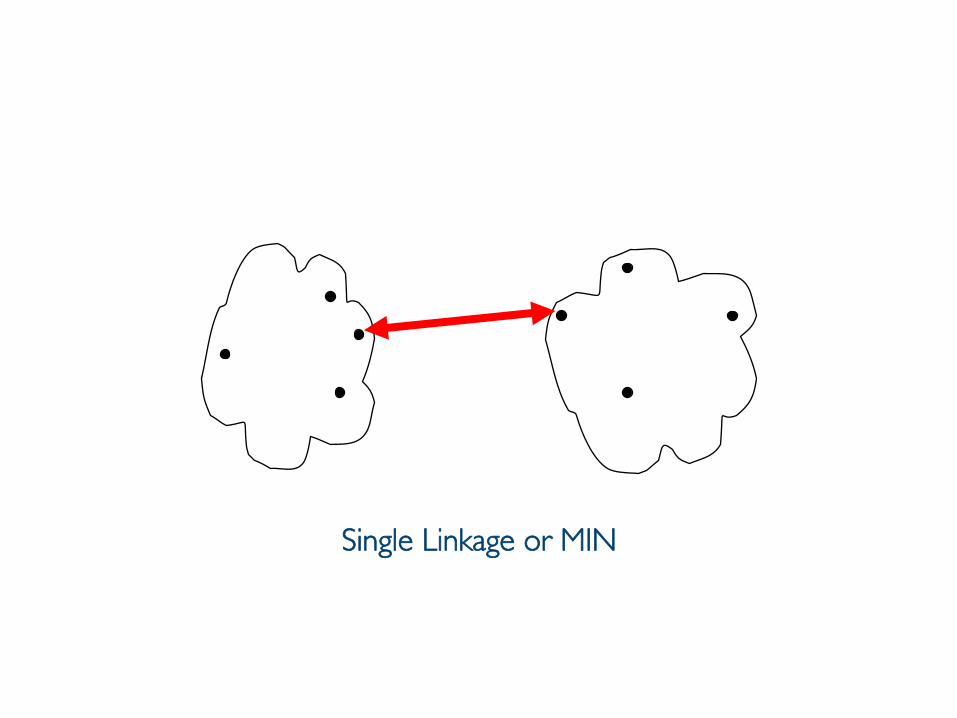
• Single link (or MIN)§ smallest distance between an element in one cluster and an
element in the other, i.e., d(Ci, Cj) = min(ti,p, tj,q)• Complete link (or MAX)§ largest distance between an element in one cluster and ���
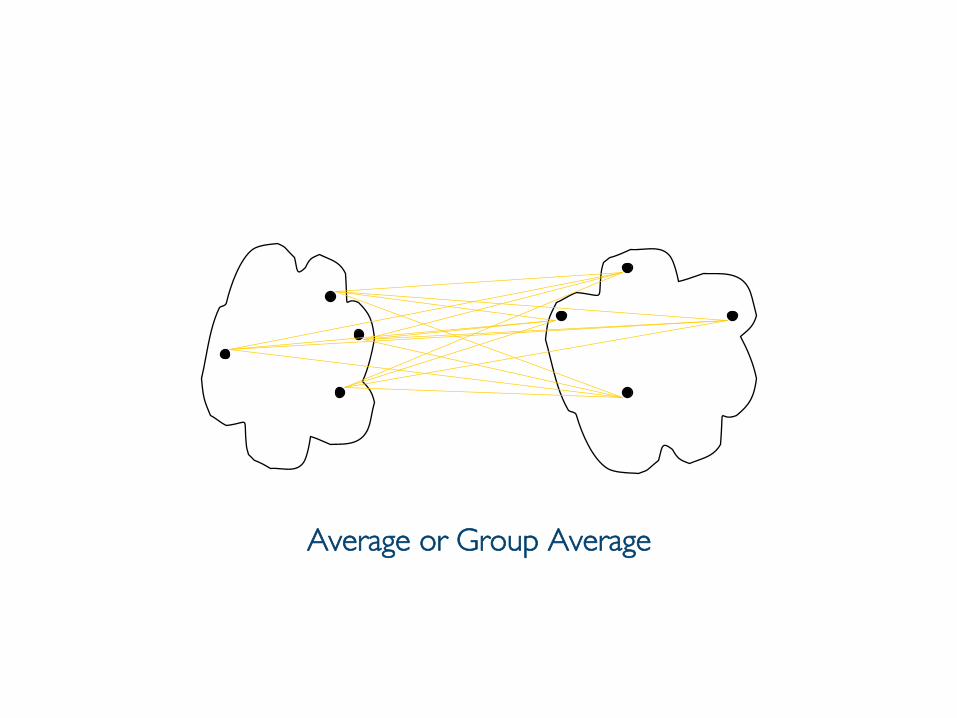
an element in the other, i.e., d(Ci, Cj) = max(ti,p, tj,q)• Average (or group average)§ average distance between an element in one cluster and an
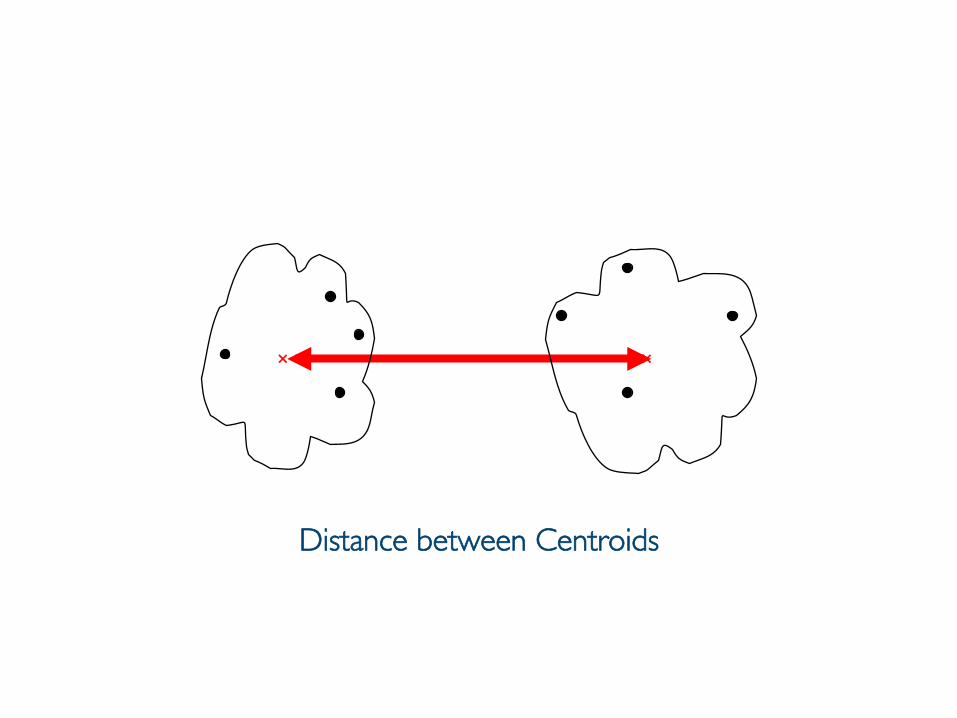
element in the other, i.e., dis(Ci, Cj) = avg(ti,p, tj,q)• Centroid§ distance between the centroids of two clusters, i.e., ���
d(Ci, Cj) = d(μi, μj) where μi and μi are the centroids • …
37
Prof. Pier Luca Lanzi
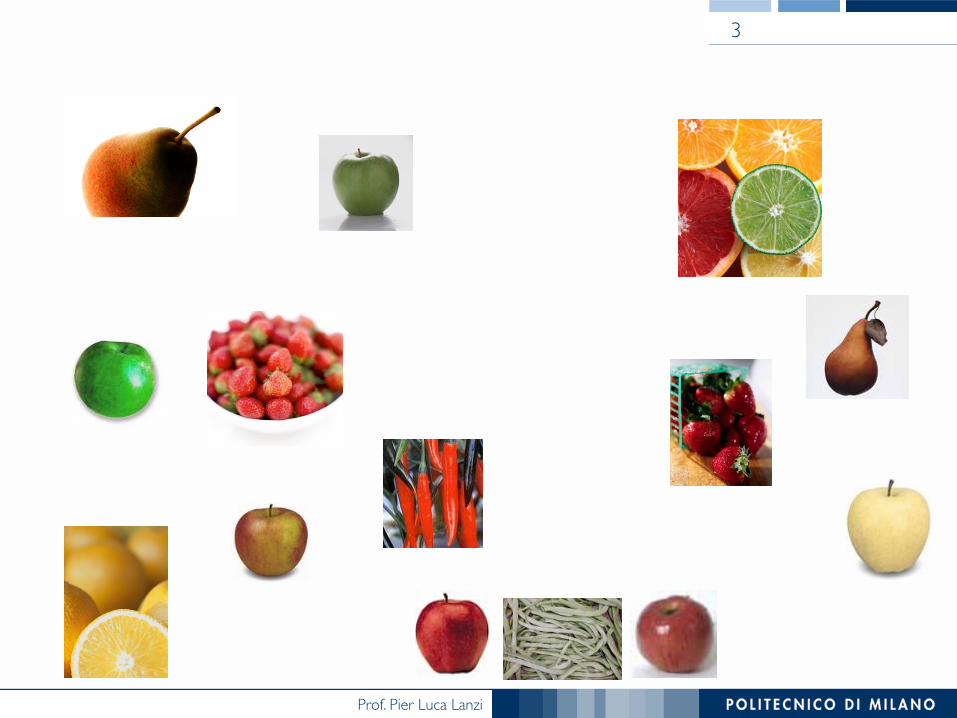
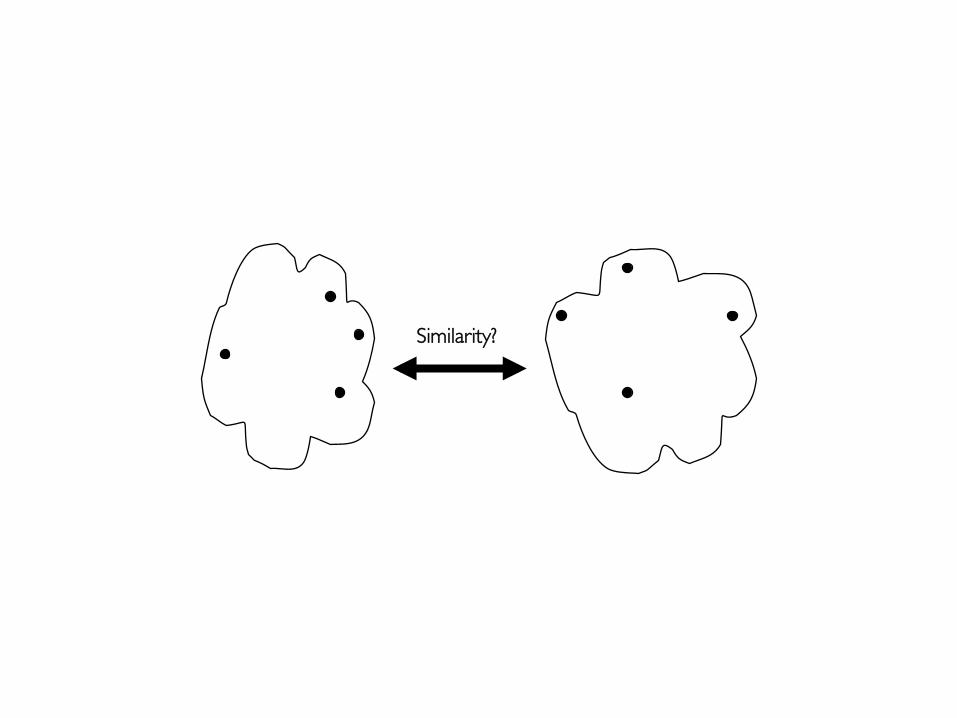
Similarity?
Prof. Pier Luca Lanzi
Single Linkage or MIN

Prof. Pier Luca Lanzi
Complete Linkage or MAX
Prof. Pier Luca Lanzi
Average or Group Average
Prof. Pier Luca Lanzi
Distance between Centroids
× ×

Prof. Pier Luca Lanzi
Example
• Suppose we have five items, a, b, c, d, and e.• We wanto to perform hierarchical clustering on ���
five instances following an agglomerative approach• First: we compute the distance or similarity matrix• Dij is the distance between instancce “i” and “j”
⎟⎟⎟⎟⎟⎟
⎠
⎞
⎜⎜⎜⎜⎜⎜
⎝
⎛
=
0003050809000409010
0005060002
00
.........
...
...
D
43

Prof. Pier Luca Lanzi
Example
• Group the two instances that are closer• In this case, a and b are the closest items (D2,1=2)• Compute again the distance matrix, and start again.• Suppose we apply single-linkage (MIN), we need to compute the
distance between the new cluster {1,2} and the others§ d(12)3 = min[d13,d23] = d23 = 5.0§ d(12)4 = min[d14,d24] = d24 = 9.0§ d(12)5 = min[d15,d25] = d25 = 8.0
44

Prof. Pier Luca Lanzi
Example
• The new distance matrix is,
⎟⎟⎟⎟⎟
⎠
⎞
⎜⎜⎜⎜⎜
⎝
⎛
=
0.00.30.50.80.00.40.9
0.00.50.0
D
45
• At the end, we obtain the following dendrogram
Prof. Pier Luca Lanzi
Hierarchical Clustering: ���Problems and Limitations
• Once a decision is made to combine two clusters,��� it cannot be undone
• No objective function is directly minimized• Different schemes have problems with one ���
or more of the following:§ Sensitivity to noise and outliers§ Difficulty handling different sized clusters ���
and convex shapes§ Breaking large clusters
• Major weakness of agglomerative clustering methods§ do not scale well: time complexity of at least O(n2), where n
is the number of total objects§ can never undo what was done previously
46

Prof. Pier Luca Lanzi
how can we represent clusters?

Prof. Pier Luca Lanzi
Euclidean vs Non-Euclidean Spaces
• Euclidean Spaces§ We can identify a cluster using for instance its centroid ���
(e.g. computed as the average among all its data points)§ Alternatively, we can use its convex hull
• Non-Euclidean Spaces§ We can define a distance (jaccard, cosine, edit)§ We cannot compute a centroid and we can introduce the concept of
clustroid• Clustroid
§ An existing data point that we take as a cluster representative§ It can be the point that minimizes the sum of the distances to the other
points in the cluster § Or, the one minimizing the maximum distance to another point§ Or, the sum of the squares of the distances to the other points in the
cluster
48