Malawi - Mwanza Rural Development Project - Completion Report
Upload
food-and-agriculture-organization-of-the-united-nationsCategory
view
278download
0
Andrea Cattaneo
Solomon Asfaw, Romina Cavatassi, Nancy McCarthy, Josh Graff-Zivin, Adriana Paolantonio, Leslie Lipper
Technical Workshop
February 6, Lilongwe, Malawi
Diversification & Climate Risk Management Strategies: Evidence from Rural Malawi

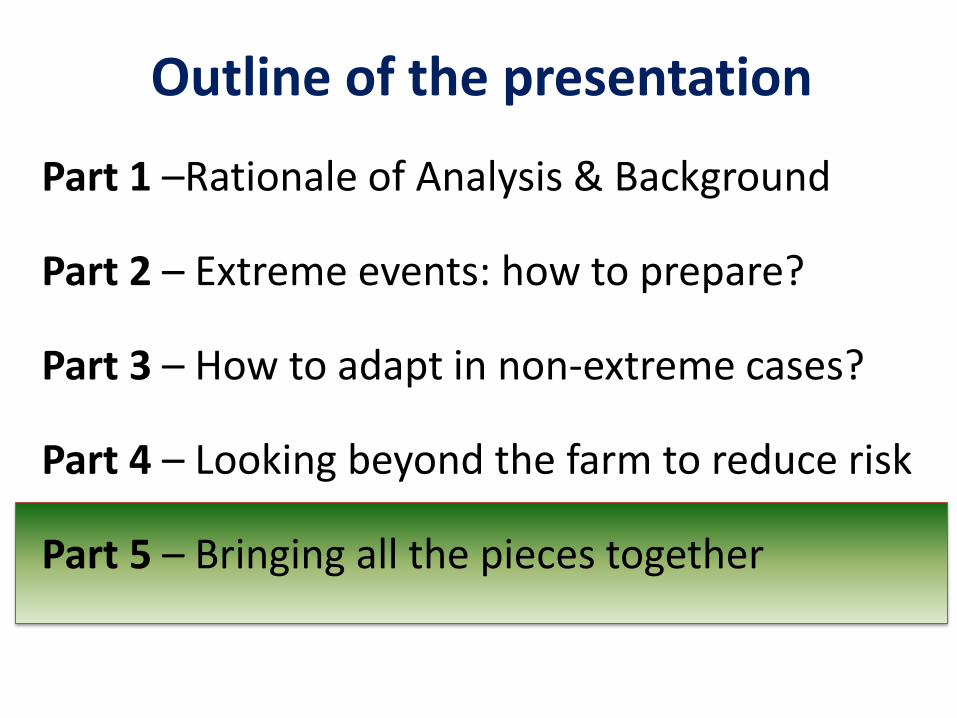
Outline of the presentation
Part 1 –Rationale of Analysis & Background
Part 2 – Extreme events: how to prepare?
Part 3 – How to adapt in non-extreme cases?
Part 4 – Looking beyond the farm to reduce risk
Part 5 – Bringing all the pieces together

Building Blocks of CSA Logical Chain
Evaluating CSA practices
Identify barriers and enabling factors
Managing Climate Risk
Defining coherent policies
Guiding Investments
Assessing climate impacts Options: Livelihood diversification, safety nets, insurance, farm management practices
Responding to extreme events
Managing increased climate uncertainty

1. Maize self-sufficiency through increased maize
productivity and reduced post harvest losses
2. Diversification of food production and dietary
diversification for improved nutrition at household
level with focus on Crops, Livestock, and Fisheries
3. Risk management for food stability at national level
ASWAp: Components of Food Security and Risk Management Focus Area

►Diversification is a central element of risk management
►Farmers diversify to respond to adverse shocks (“push”) or because of better opportunities available off-farm (“pull”)
►We distinguish between farm households that do not have the option to diversify their income off-farm, and those that do
What strategy to provide new insights (1)

►For those that cannot diversify off-farm we examine how to address on-farm:
the impact of changes in climatic variability and options to address it on-farm
Effects of extreme events leading potentially to total yield loss
►For those households that can diversify off-farm we examine options using an econometric analysis that looks at the role of income diversification in addressing climatic variability
What strategy to provide new insights (2)

Database We use four data-sets:
1. World Bank Living Standard Measurement Survey (LSMS-IHS) in 2010/2011 – 12,288 households
o Household level questionnaire and community level survey linked to GIS databases
2. Historical rainfall and temperature estimates (NOAA-CPC) for 1983-2012
3. SLM cost data collected by the Climate Smart Agriculture (EPIC) project
4. Institutional surveys at district level
o Credit, extension and other information sources, agricultural input and output markets, public safety nets programs, and donor/NGO programs and projects

Climate in Malawi
Figure 1a. Mean rainfall 1983-2012 (mm/year) Figure 1b. Coefficient of variation of rainfall 1983-2012
Climate is a determinant of household vulnerability in Malawi
• Consumption per capita is lower in environments with greater
long term climate variability
• Higher long term mean rainfall is associated with lower
vulnerability to poverty.
• Deviation below the long term mean rainfall pattern in the last
season, increases vulnerability to poverty.
• Other significant variables for reducing vulnerability are
higher household wealth, and access to institutions such as
extension, credit, fertilizer subsidies and social safety nets.
Outline of the presentation
Part 1 –Rationale of Analysis & Background
Part 2 – Extreme events: how to prepare?
Part 3 – How to adapt in non-extreme cases?
Part 4 – Looking beyond the farm to reduce risk
Part 5 – Bringing all the pieces together
►how does the projected increase of extreme climate events (e.g. drought, floods, extreme high temperatures) affect smallholder adoption of SLM techniques to improve resilience?
►Examples of SLM techniques considered in this model are box/tied ridges, infiltration trenches, grass embankments, etc
►We distinguish between a case where farmers cooperate in adopting SLM practices, creating spillover effects, and a case where they do not
►Examine four potential policy interventions to favor SLM adoption including interventions that lead to cooperative outcomes, access to social safety nets (DRR), payments for carbon sequestration, and access to input subsidies.
Extreme events & SLM adoption for resilience

Safety nets may increase adoption of SLM
► Countervailing effects of safety net coverage:
i. reduces loss exposure (decreasing marginal benefit of SLM in reducing losses)
ii. increases marginal benefit to expanding production (leading to increase in all inputs, also SLM)
► If farmers cooperate safety nets are more likely to have positive effects on SLM adotpion (result less dependent on parameter values)
Conventional
inputs
SLM
inputs

Outline of the presentation
Part 1 –Rationale of Analysis & Background
Part 2 – Extreme events: how to prepare?
Part 3 – How to adapt in non-extreme cases?
Part 4 – Looking beyond the farm to reduce risk
Part 5 – Bringing all the pieces together

►Extreme events, are usually rare. What decisions and policies are appropriate under “marginal” changes in climate?
►Although climate change is already happening, farmers and policymakers have incomplete information on how it affects local conditions and what is best course of action.
►Diversification is an important autonomous form of adaptation to risk. How do policies affect incentives to diversify?
►How are budgetary costs of policies affected by lack of information?
Climate Uncertainty, Information, and Adaptation

Basic Structure of the “marginal” model
• Farmer Objective: choose staple crop and technique (conservation or traditional) plus up to one diversification crop to maximize utility within a given Malawian AEZ subject to a minimum area being dedicated to staples
• Staple Crops: Maize Local & Maize Hybrid
• Diversification Crops: Groundnut Chalimbana, Groundnut CG7, Beans, & Pigeon Peas
• Based on variance of yield as function of temperature and rainfall, and covariance of yields between staple and diversification crops
• Conservation techniques: SWC, Intercropping, SWC+Intercropping (staple crops only)
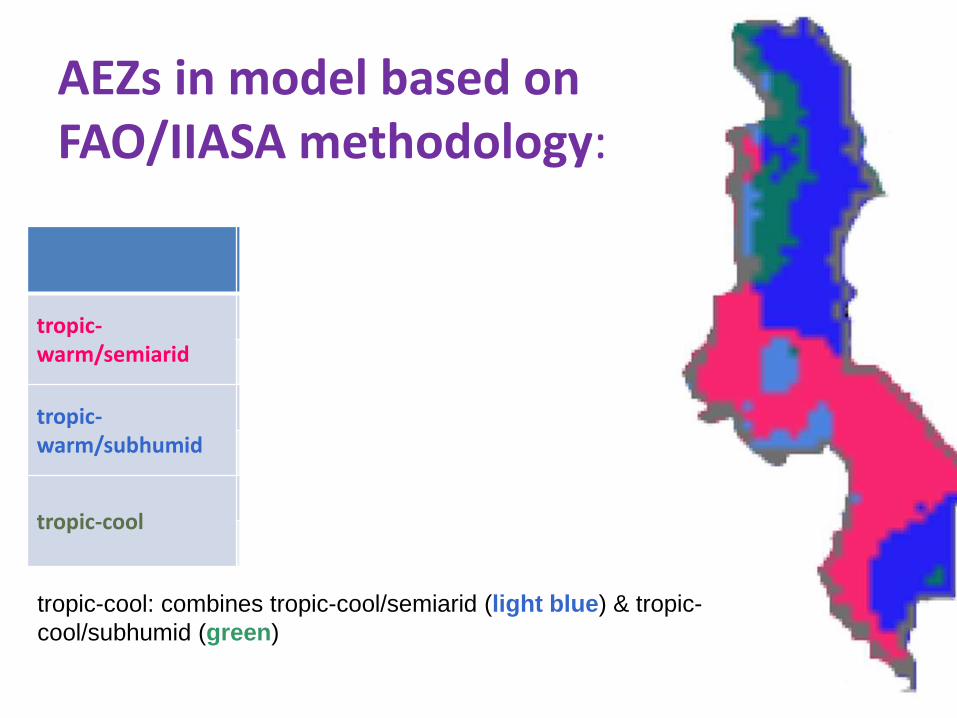
AEZs in model based on FAO/IIASA methodology:
Mean Standard Deviation
tropic-warm/semiarid
Temperature 22.51 1.41
Rainfall 34.47 34.78
tropic-warm/subhumid
Temperature 22.98 1.50
Rainfall 37.77 40.17
tropic-cool Temperature 20.89 1.25
Rainfall 39.85 34.70
tropic-cool: combines tropic-cool/semiarid (light blue) & tropic-
cool/subhumid (green)

Important differences across AEZs in Malawi
► It appears that the optimal resource allocation is not that different under existing climatic conditions
Profit
(MKW/ha)Crop Choice
Conservation
technique
Baseline 5,578 60% Local Maize & 40% Beans Intercropping
Rain SD +30% 2,430 80% Local Maize & 20% Beans Intercropping
Temp SD + 30% 6,056 90% Hybrid Maize & 10% Groundnut CG7 Intercroping + SWC
Baseline 5,859 60% Local Maize & 40% Beans SWC
Rain SD +30% 7,950 60% Local Maize & 40% Groundnut CG7 Intercropping
Temp SD + 30% 3,627 60% Local Maize & 40% Beans SWC
Baseline 10,719 60% Local Maize & 40% Beans Intercropping
Rain SD +30% 4,980 70% Local Maize & 30% Beans Intercropping
Temp SD + 30% 7,944 90% Hybrid Maize & 10% Groundnut Chalim. Intercropping
Tropic warm/
semi-arid
Tropic warm/
sub-humid
Tropic cool
/semiarid &
subhumid
► With increased climate variability there is a tendency to reduce land diversification – is maize the safe option?
► Increased climate variability can have large impact on mean profit, and on optimal cropping decisions

Policies affect diversification
► Results are for Tropical Warm/ semi-arid AEZ
Profit
(MKW/ha)Crop Choice
Conservation
technique
Baseline 5,578 60% Local Maize & 40% Beans Intercropping
Rain SD +30% 2,430 80% Local Maize & 20% Beans Intercropping
Temp SD + 30% 6,056 90% Hybrid Maize & 10% Groundnut CG7 Intercroping + SWC
Baseline 5,880 60% Local Maize & 40% Beans Intercropping
Rain SD +30% 2,645 70% Local Maize & 30% Beans Intercropping
Temp SD + 30% 6,056 90% Hybrid Maize & 10% Groundnut CG7 Intercroping + SWC
Baseline 6,378 80% Local Maize & 20% Pigeon Pea SWC
Rain SD +30% 3,202 80% Local Maize & 20% Pigeon Pea Intercropping
Temp SD + 30% 5,495 90% Hybrid Maize & 10% Pigeon Pea Intercroping + SWC
No policy
Revenue floor
safety net
Rainfall index
insurance
► Both revenue floor and rainfall index insurance can work to smooth income; however, the budgetary costs depend on farmer information
► `The different policies may reduce incentives to diversify, but not in a dramatic way.

Anticipated vs. unanticipated climate change
► Mean profits can be greatly affected by lack of information under increased variability of rainfall in sub-humid areas
► An increased variability of temperature in semi-arid areas can have a negative effect if not anticipated
0
2,000
4,000
6,000
8,000
10,000
12,000
Bas
elin
e
Rai
n S
D +
30
%
Tem
p S
D +
30
%
Bas
elin
e
Rai
n S
D +
30
%
Tem
p S
D +
30
%
Bas
elin
e
Rai
n S
D +
30
%
Tem
p S
D +
30
%
Tropic warm/ semi-arid
Tropic warm/ sub-humid
Tropic cool /semiarid& subhumid
Anticipated climatechange
Unanticipatedclimate change

►Policies to address climate risk need to be tailored to different AEZs
►Information on climate variability available to farmers is an important element of policy performance
►Proposed policies do not seem to overly affect the incentive to diversify
Policy implications: risk management under “marginal” climate change

Outline of the presentation
Part 1 –Rationale of Analysis & Background
Part 2 – Extreme events: how to prepare?
Part 3 – How to adapt in non-extreme cases?
Part 4 – Looking beyond the farm to reduce risk
Part 5 – Bringing all the pieces together

► Up to here we have looked at policies relating to on-farm strategies to address climate change because many smallholder households’ options are “confined” to the farm
► However, historically, off-farm income diversification has played an important role in improving rural household welfare
► We examine determinants of diversification accounting for the fact that farmers diversify to respond to adverse shocks (“push”) or because of better opportunities available off-farm (“pull”)
► Constructed diversification indices for cropland, labour, and income and estimate the role of institutions, household characteristics, and climate variables in driving diversification
Determinants of Diversification
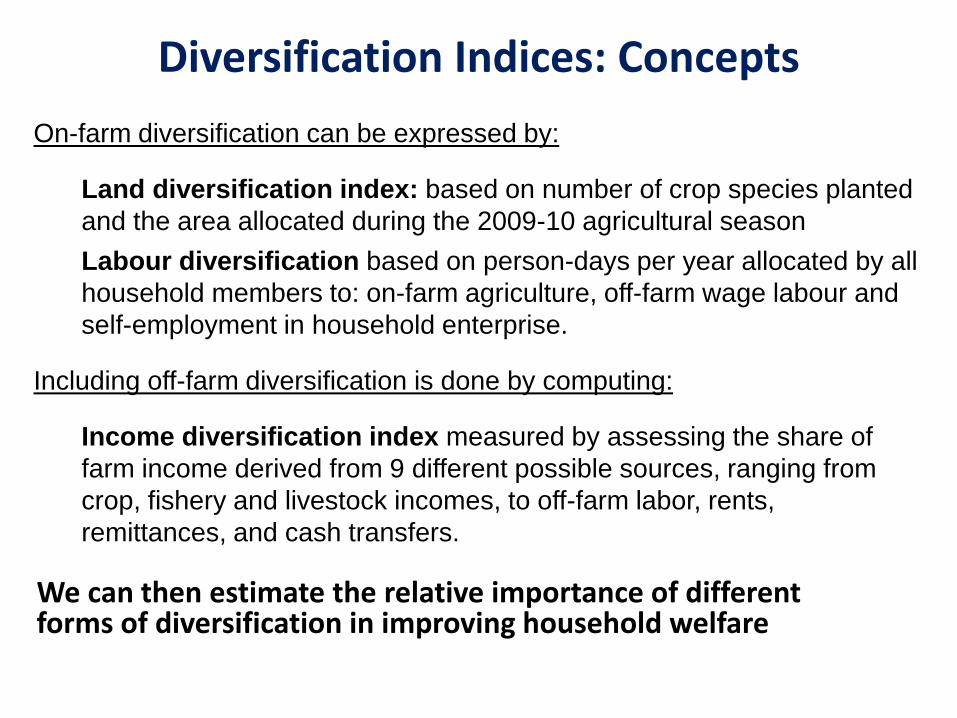
Diversification Indices: Concepts
On-farm diversification can be expressed by:
Land diversification index: based on number of crop species planted
and the area allocated during the 2009-10 agricultural season
Labour diversification based on person-days per year allocated by all
household members to: on-farm agriculture, off-farm wage labour and
self-employment in household enterprise.
Including off-farm diversification is done by computing:
Income diversification index measured by assessing the share of
farm income derived from 9 different possible sources, ranging from
crop, fishery and livestock incomes, to off-farm labor, rents,
remittances, and cash transfers.
We can then estimate the relative importance of different forms of diversification in improving household welfare

Margalef Index
Figure 2a. Cropland diversification Figure 2b. Labour diversification Figure 2c. Income diversification
Geographical distribution of land, labour and income diversification
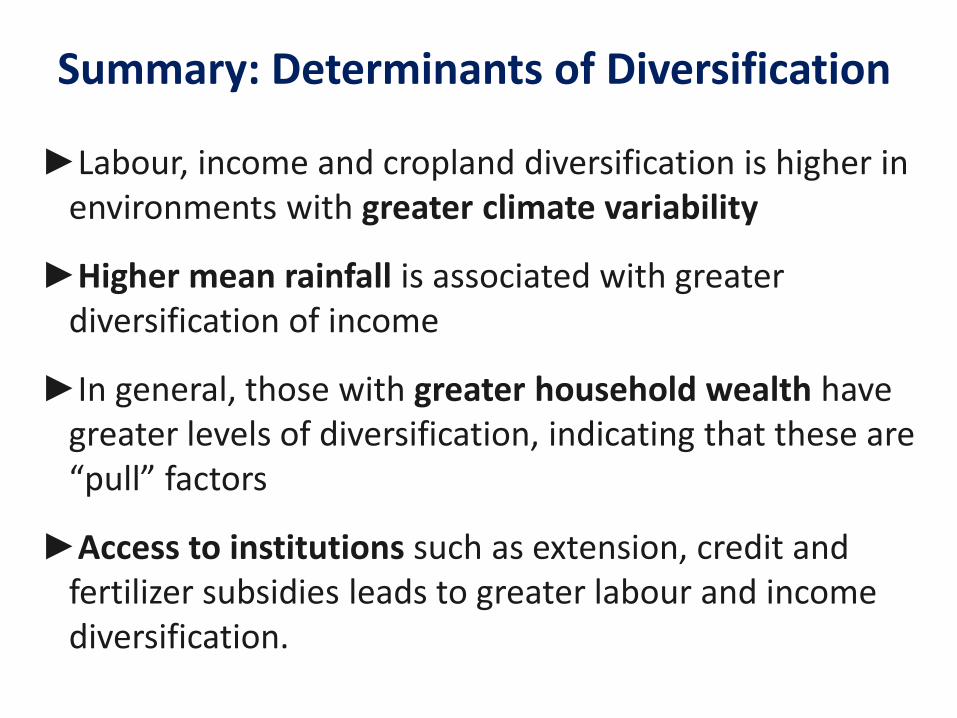
Summary: Determinants of Diversification
►Labour, income and cropland diversification is higher in environments with greater climate variability
►Higher mean rainfall is associated with greater diversification of income
►In general, those with greater household wealth have greater levels of diversification, indicating that these are “pull” factors
►Access to institutions such as extension, credit and fertilizer subsidies leads to greater labour and income diversification.

Variance
Expected consumption
Labour diversification index 0.114* 0.610*** Income diversification index -0.154*** 0.429*** Cropland diversification index 0.013 0.186*** Coefficient of variation of rainfall, 1983-2010 -0.375** -1.212*** Long term mean rainfall, 1983-2010 (mm) -0.000 0.000*** Rainfall anomaly, 2009-10 rainy season 0.165*** -0.271*** Agricultural extension and development officers per household in the district 0.002 0.009*** Number of microfinance institution 0.008*** 0.024*** Fertilizers distributed per household (MT) -0.003 0.004 ln(MASAF wages paid in 2008-09 season (million MKW/HH)) -0.590 12.542*** Microfinance*CV rainfall Safety-net*CV rainfall Extension service*CV rainfall Fertilizer distributed*CV rainfall Observations 7,020 7,020 R-squared 0.017 0.442
Note: Robust standard errors in parentheses based on EA level clusters. *** p<0.01, ** p<0.05, * p<0.1.
How do different forms of diversification perform?
Effect of diversification on vulnerability components: variance of consumption (𝑽 𝑪𝒊 ) and expected consumption per capita (𝑬(𝑪𝒊))

►On-farm Labour diversification leads to higher, but also less stable consumption; overall the impact is still to reduce vulnerability to poverty
►Income diversification opportunities should be prioritized, since it leads to higher and more stable consumption
►Access to extension and fertilizer subsidies have the strongest positive impacts on income diversification of the institutions considered
►A shock such as a rainfall anomaly leads to lower future expected consumption and to higher variability
Summary: Effects of Diversification on Welfare
Outline of the presentation
Part 1 –Rationale of Analysis & Background
Part 2 – Extreme events: how to prepare?
Part 3 – How to adapt in non-extreme cases?
Part 4 – Looking beyond the farm to reduce risk
Part 5 – Bringing all the pieces together

► For extreme events: important to have policies & institutions to support effective coordination and cooperation for adoption of SLM to increase resilience
►For “Marginal” changes in climate: policy options need to be tailored to agro-ecological conditions, and better information on changes in climate variability is crucial in reducing losses through changes in cropping decisions and SLM practices
►Policies and institutions play an important role in determining levels diversification, and their outcome & costs depends on information available to framers
► Income diversification opportunities should be prioritized, since it has the strongest impacts on reducing vulnerability to poverty
• Among institutions, access to extension and fertilizer subsidies have the strongest positive impacts on income diversification
Overall Conclusions and Policy Implications

Knowledge Sharing
• Results for extreme events & for “marginal” are very preliminary: would be very interested in establishing a dialogue to improve the results and tailor to policy needs
• Availability of data: Data is available for interested researchers
• Availability of simulation model: The “marginal” climate change model is implemented in Excel for ease of use

Thank you!
If interested in the CSA evidence-base :
www.fao.org/climatechange/epic