
modeling diversification and financial performance in agricultural cooperatives
My Documents: Rural Transformation Paper
Agricultural Diversification and Rural Industrialization: Some Policy Issues from Indian Experience
G.K. Chadha, Professor Emeritus, JNU, New Delhi.
- - - -
I Agriculture-Industry Linkages: Theory and Practice
For a typical developing economy, the nature and growth of forward and backward
linkages between agriculture and industry hold the key to the broader issue of rural development.
Agriculture-industry linkages, with important rural-to-rural, rural-to-urban and urban-to-rural
locale implications, can be visualized in a number of ways, both direct and indirect ( Hazell-
Haggblade,1991: 515). Direct linkages could possibly be of three types. First, a growing
agriculture and its associate sectors, such as animal husbandry, poultry, fishing, and forestry-
logging, demand production inputs that are produced, at least partially, by local industrial
enterprises. Second, the expanding volume of marketable surpluses, coming from a growing
agriculture on a continuing basis, have the potential of nurturing a variety of local or nearby
agro-processing industrial activities, with their own employment and income benefits for the
local population. Third, increase in farm incomes stimulates demand for a wide variety of
consumer goods, some of which might be produced by the local rural industry itself.
At least two types of indirect linkages can be clearly visualized. First, rising agricultural
productivity and wages raise the opportunity cost of labour in non-farm activities including rural
industry, inducing a shift in the composition of non-farm activities out of very labour-intensive,
low-return activities into more skilled, higher investment, high-return activities ( ibid, 1991:
519). The wage linkage effects are bound to become more pronounced as the local economy gets
more diversified. Second, agriculture-industry linkages need not always be traced locally; these
may well spill over to the nearby villages, semi-urban towns and urban centres, depending on
rural-rural and rural-urban means of connectivity and information flow. We may dwell a bit into
the processes through which these linkages operate, and get intensified over time.
2
1.1 Direct Linkages
The demand for agricultural inputs depends on the stage of agricultural development itself
(Vaidyanathan, 1986:139-41). Starting from one extreme of the development spectrum, if
agriculture is still traditional, typified by low productivity levels, a near-absence of technological
change and investment in modern inputs, purchased inputs would make up a very small
proportion of total input-use. In such a situation, the few rural industries that come up in the
villages are largely of a ‘distress’ type, generally operating with primitive technology, often as
subsidiaries to agricultural activities, and geared to address limited, and often seasonally
fluctuating, local demands. On the other extreme, if local agriculture is well on its way to
technological modernization, or in a high tract commercial regime, or catering to external
market, its dependence on purchased inputs is very high and growing. Although, in this scenario,
a big part of inputs comes from outside and to that extent, the benefits to local industry are rather
limited, yet, the total employment and income multiplier effects of a growing modern agriculture
are quite substantial.
The pace and pattern of agro-industrialization owe themselves to the rising pace of
agricultural commercialization and the expanding volume of surpluses that build the supply
chain between agriculture and industry. Many of the agro-industrial enterprises come up right in
the villages themselves some of which, depending on the size, location and connectivity of the
village, may well be small scale modern factories or processing mills. The development
experience of Punjab, Haryana and Western Uttar Pradesh, the three initial seat-beds of India’s
green revolution, clearly shows how rising commercial surpluses from agriculture give rise to a
whole chain of industrial activities in the rural areas themselves. Most conspicuous examples are
wheat flour and rice milling, oil extraction, cotton pressing and ginning, sugarcane processing,
leather tanning and leather products, dairy and poultry products, wooden furniture and fixtures,
and so on (Chadha, 2003: 50). If one could take account of agricultural surpluses spilling over to
urban industrial and commercial centers and the employment benefits implied in their
transportation, processing and marketing, etc., the agriculture:non-agriculture linkages in these
areas would get considerably magnified. Undoubtedly, the rural households do chip off a part of
industrial and commercial employment in urban areas as well (Chadha, 1992: 7).
3
The rising rural incomes push up the demand for the whole lot of non-farm goods (and
services) including a variety of industrial goods. The standard examples of the demand-driven
local industrial activities are making of shoes and other leather products, pottery, rope-making,
handlooms, blacksmithy, carpentry, making of jewellery and other wearing apparels, sweetmeat-
making, dairy and poultry products, wheat flour and rice milling, raw sugar, beverages and
tobacco products, and so on (Chadha, 2003: 51). Later in the paper, Tables 1 and 2 pretty clearly
portray the process of demand restructuring in rural as well as urban India since 1972-73. The
steadily expanding level of real per capita total monthly consumer expenditure as well as per
capita monthly expenditure on non-food items, together with a near-constant level of per capita
monthly expenditure on food items in rural areas, and a steadily declining level in urban areas,
reflects the clear tendency of a typical Indian consumer to steadily shift his demand from
agricultural products to the wide, and ever expanding, basket of non-agricultural products. But
then, the changing composition of demand for agricultural products, e.g., between cereals and
non-cereals, equally unequivocally, shows the directions in which the demand for agricultural
products is likely to proceed as income grows steadily.
1.2 Indirect Linkages
If a growing rural economy is looked at as a farm:non-farm continuum, most of the
production and marketing parameters in agriculture influence those in the rural non-farm sectors,
and vice versa. Most significantly, the rising wage rates, under the spell of a fast growing
agriculture, raise the opportunity cost, and hence wage rate, of labour in non-farm activities
including rural industry. Conversely, if rural industry, and other non-farm activities, come up in
rural areas, say, under the auspices of a conscious industrial dispersal policy, agricultural wage
rates are no more determined exclusively by agriculture’s demand for labour; the supply of
labour to agriculture does get influenced by demand pressures, and wage rates, in the non-
agricultural sectors. In some cases, such wage rate interdependencies may induce a shift in the
composition of non-farm activities out of very labour-intensive, low-return activities into more
skilled, higher investment, high-return activities (Hazell-Haggblade,1991:519). The wage
linkage effect may well be a marginal phenomenon when the local economy is at the bottom of
development ladder, but becomes a weighty criterion for labour-use, both in agriculture and non-
farm segments, when the rural economy starts ascending on the development ladder.

4
The backward and forward linkages between agriculture in a village, a cluster of villages,
a tehsil or a district and industry beyond such territories could be visualized in more ways than
one. Under the backward linkages, certain types of industrial goods and services, coming in as
agricultural inputs, are produced on a somewhat larger scale, say, in a district town or a distant
industrial locale, presumably because the industry’s own economies of scale are best realized in
its present location. Such location-linkage outfits can never conform to a standard pattern, across
different geographical regions of a country. Formidable variations, and combination of
possibilities, are likely to be confronted in any empirical attempt to unfold agriculture-industry
relationship in a vast country of India’s size and diversity. To put it more concretely, how intense
is the impact of a growing agriculture, say, in a tehsil/district on industrial development inside
the tehsil/district, and how much in areas beyond the given tehsil/district, cannot be worked out
with full empirical authenticity. Likewise, how long is the chain of backward linkages, for the
large variety of agricultural inputs, or final consumer goods, originating at different places, is
equally difficult to say, with great empirical confidence. All empirical studies that aim to see the
impact that a growing agriculture makes on rural industrialization, on the basis of published
reports/data, have to fondle with different location-linkage possibilities and yet, the conclusions
remain suggestive, at best, indicative of the broad trends, that may vary substantially from region
to region. The present study too is full of such limitations.
II How Far Can We Go Empirically?
Empirical investigation of the relationship between agricultural diversification and rural
industrialization is a highly complex matter. First, there is no unique definition of a rural
industry. If locale of production is the sole criterion, all industrial enterprises located in
individual villages, or cluster of villages, qualify to be designated as rural industries. Rural
industrial clusters stand out as the most robust example. But then, how are industrial enterprises
located in semi-urban locations to be treated? There is pretty much that agriculture in the
surrounding areas contribute to the growth of semi-urban industry, through forward linkages, just
as these industries do contribute, through backward linkages, to agricultural production and
consumption requirements of rural population. If the policy focus of rural industry is
employment, earnings and poverty eradication of rural households, village or semi-urban locale
loses its relevance; industrial employment, irrespective of the locale of production or the distance
commuted by industrial workers living in villages, takes precedence over locale or other criteria.

5
Second, it would be naïve to believe that rural industry, whatever its production locale,
product composition, or market outreach, owes all its existence to agriculture; far from it. There
are some industries, most ostensibly the set of agro-processing enterprises, that are, spatially,
more closely linked with agriculture. There are others, such as, for example, pottery, rope-
making, handlooms, blacksmithy, carpentry, making of jewellery and other wearing apparels, oil
extraction, bidi- and sweetmeat-making, dairy products, that are largely inspired by consumption
needs of rural households, including those engaged in agriculture. But then, there are many, the
so-called ‘foot-loose’, rural industries, whose linkages with agriculture are marginal or none at
all. In any empirical investigation of agriculture-rural industry linkages, one is confronted with a
mingle of ‘something-due-to-agriculture’ and ‘something-due-to-other-factors’. Perfectly neat or
a one-to-one association is rather difficult to come by.
Third, and most important, is the dimension of regional contrasts not only in terms of the
level of agricultural development that, in its own right, influences the pace and pattern of
agriculture-rural industry linkages, but also the outcome of the rural industrialization policies
pursued by respective state governments, from time to time. Numerous overlapping parameters,
for example, the average size of village population, the caste and class composition of rural
households, the proportion of educated people, especially among the job-seeking segments, the
role of public institutions at the grass-roots level, the degree of political alertness and economic
articulation among the rural people in general and rural youth in particular, the state of
infrastructural development, including rural-urban physical connectivity through transport
linkages, etc., assume significance, in varying form and content.
Fourth, as pointed out earlier, agriculture-industry linkages have their own distance-decay
or distance-prop functions that operate variously in different states and regions. In some cases,
linkages may surface more succinctly even at the village level, in some others, the district-level
analysis may yield a more concrete picture while for some others, only the state-level picture
lends authentic proof of the linkages. In general, empirically speaking, more firm and reliable
linkages are likely to emerge if one operates with the national level data, and the refinement of
empirical results keeps on declining as we move down from national to state, state to district, and
district to village level analysis. Undoubtedly, the intermingling of local factors and extraneous
circumstances is of a very high order when forward and backward linkages are sought to be
6
delineated at the local level. Clearly, a multi-level approach is called for. However, how far
down from the national level one can go in this kind of empirical exercise depends, largely, on
the availability of data. Moreover, the format of analysis cannot be the same at each level. What
can possibly be probed at the national level cannot be the same as at the village or district level.
Accordingly, the present paper, intending as it does to share India’s experience with other
developing countries, may better confine itself to national-level policies and experiences.
III Recent Policy Strands for Agro-Industrialization
It would be rather naïve to believe that the development of India’s rural industrial sector
owes itself solely to expansion and changing composition of output in domestic agriculture. The
sector is a wide canvas that enfolds within itself, either directly or indirectly, many foot-loose
activities not related to agriculture. Undoubtedly, agriculture-related rural industrial activities are
important, in their own right, non-agriculture related industrial activities also hold crucial
significance for the rural households, most ostensibly for their potential to augment
employment/earnings and eradicate poverty. Accordingly, while it is important to look into the
processes of rural industrialization driven by agricultural growth, it is equally important to see,
briefly though, whether the rural industrial sector has been receiving, in its own right, adequate
policy attention. To say the least, policies for rural industrial development would sharpen our
understanding of how agro-industry linkages have been faring in rural India.
Historically, the pre-1992 reform measures were largely directed at domestic industrial
regime in general while the wide ranging post-1992 policy reforms accorded high priority to food
processing and agro-industry, through a set of important incentives and supports, in due
recognition of the export potential that lay unexplored, especially since the onset of the green
revolution era in large parts of Indian agriculture. Accordingly, both analytically and empirically,
it serves us better if we dwell more on the post-reform industrialization scenario that followed
more wide-ranging, and more intense, agricultural diversification policies.
Till the arrival of economic reforms in 1992, the ambit of institutional support, financial
accommodation and marketing concessions has been expanding ever since the inception of the
planning era, the budgetary support for all this has been rising steadily over time. It almost
appears to an outside observer that the government wanted to take upon itself each aspect of rural
7
industrial development, and if one were to follow in letter the declared intentions, the
government certainly seemed to have been `overdoing'. But then, since July 1991, the policy
scenario started changing. The most striking features of the changing policy under-currents were a
gradual elimination of input, price and marketing subsidies, a reduced dependence on the
budgetary support, and an increasing reliance on private initiative and risk-absorbing capabilities.
And then, in January 1995, came the WTO. The policy on product reservation for the small
scale and village industry sectors attracted a lot of public debate; it was increasingly felt that in
spite of the reservation umbrella extended to the sector for well over three decades, technological
obsolescence of both products and processes, managerial, financial and marketing weaknesses,
cumbersome rules, regulations and procedural hassles, etc., could not be tided over. It is against
this background that, in 1997, the Abid Hussain Committee recommended de-reservation,
accompanied by appropriate and compensatory assistance to small scale sector in terms of
information base, availability of technology, technology transfer, enhanced credit availability,
infra-structural and marketing support, etc. (Hussain, 1998). Many of the recommendations,
especially those on product reservation, have already been implemented.
Another landmark in the regime of rural industrial development that came up in 1999 was
about the setting up of 100 rural industrial clusters every year under the umbrella of National
Programme for Rural Industrialization. Besides augmenting employment avenues for rural
households, the strengthening of the to-and-fro operational linkages between agriculture and
a wide variety of rural industries, was the major objective behind propping rural industrial
clusters. That is how, under the National Programme for Rural Industrialization, the major
beneficiaries of the cluster development programme would be the tiny sector which is
overwhelmingly rural-located and more deeply routed in agriculture and rural households, both
from demand and supply sides.
The amendment of Agricultural Produce Marketing Committee (APMC) Acts in 2002, in a
number of states, was another policy landmark in the history of agro-industrial development. This
opened the way for contract farming, on a wider institutional basis which, under a set of
circumstances and agreed principles, could bring in numerous benefits not only to the agro-
processing firms and farm growers but also to the rural society in general, most ostensibly by
8
removing some of the technological, scale and marketing constraints of marginal and small
farmers, besides building an uninterrupted supply chain to agro-manufacturing enterprises.
Another 2005 policy landmark was to introduce the Food Safety and Standards Bill in
Parliament which aimed at making food laws industry-friendly besides marking a shift from the
present ‘regulatory regime’ to a ‘self-compliance’ dispensation. Yet one more initiative was to put
agro and rural industry on a better operational footing through revamping of Khadi and Village
Industries Commission in February-March 2006. Under the revamped dispensation, in a typical
village industry, the fixed capital investment limit per artisan was to go up from Rs. fifteen
thousand to Rs. one lakh (Rs. 1.5 lakh for hilly areas); small towns with a population of twenty
thousand would now be treated as ‘rural areas’ (Govt. of India, 2006a: 34).
Rural industrialization got a shot in the arm when a full-fledged Ministry of Food
Processing Industry was created a few years back. It is an irony that India being the world’s second
largest food producer yet the contribution of food output to gross domestic product is only around
17.0 per cent. This is owing to low value-addition of the produced food. Endowed with no fewer
than 20 agro-climatic zones and various soil types, India produces a wide spectrum of food types,
yet, a large part of fruits and vegetables never goes in for processing, entailing substantial wastage
to the nation and low earnings to farmers (India Today, 2010: 45). The immediate priorities of the
Ministry are, first, to push up the processing level to reduce the wastage. The producer of fruit-
vegetables and the processor of fruit-vegetables must work in tandem, to the betterment of both.
Second, the food processing industry must get its raw material seamlessly. The flow of raw
material should not be disturbed. Third, our presence in the international market for processed food
products must also grow steadily, and many institutional and incentive measures are visualized by
the Ministry to improve the quality of products.
Under the new Export-Import Policy Regime of the early 2000s, exemption from industrial
licensing for nearly the whole lot of food and agro-processing industries, automatic investment
approval upto 51.0 per cent for foreign equity or 100.0 per cent for NRI equity for most of the food
processing sector, free use of foreign brand names, freer recourse to imports, including import of
capital goods, for these industries, are bold examples of more recent regulation and control
reforms. Substantial reduction of excise and import duty rates, including total exemption of many
processed food items from excise duty, substantial slashing of custom duty rates on plant and
9
equipments, raw materials and intermediaries, especially for export production, reduction of
corporate taxes and tax incentives for new manufacturing units for certain years, full convertibility
of Indian currency on current account, and freer repatriation of profits are similar examples of
fiscal policy and tax reforms. Most significantly, setting up of free trade zones and export
processing zones, with adequate infrastructural backup, freer and subsidized access to imports, tax
exemptions, etc., signify the new orientations for the export-linked agro and food-processing
industries.
These reform measures have already started showing their impact, in varying form and
content. For example, the food processing sector is becoming a major attraction for Indian
corporate houses to invest. Reliance, Godrej, Bharti, ITC, Hero, Ballarpur Industries, DSCL, Tata,
Mahindra & Mahindra, etc., are now prominent corporate houses, with end-to-end integrated
operations in the food chain (ibid: 44). The government’s invitation to foreign direct investment
and private enterprise is showing up its effect, most ostensibly, through the expanding network of
contract farming. One fact is, however, becoming quite evident. The new policy regime is
concentrating more on export-linked enterprises, selective agro- and food-processing sectors, and
emphasizing more on economies of scale and competitiveness, and so on. The contemporary
Indian reality is that the traditional run of rural industry in general, and its agro-processing
segment in particular, are going along side by side with their modern, including export-oriented,
counterparts.
In sum, basing oneself on a variety of policy documents, one readily discovers that the
ambit of institutional support, financial accommodation and marketing concessions has been
expanding for many decades, most certainly before the arrival of economic reforms in early
1990s. It almost appears to an outside observer that the government took upon itself each task
connected with agro-industrialization. It did make some impact in fostering linkages between
agriculture and rural industry. Nevertheless, all segments of rural industry could not prosper; in
the same vein, all segments would not face trouble. The long chain of rural industrial
development policies having been essentially a mingle of state intervention and support, and the
free play of market forces, the outcome should also be a mingle of growing and slackening
linkages. Our objective is thus to unfold the changing nature of linkages, more pointedly, to see
10
their nature, content and geographical spread, over time. First, a quick overview of how
agricultural sector has been diversifying itself over the previous decades.
V Pace and Pattern of Agricultural Diversification
We can interpret agricultural diversification in many different ways. Production
restructuring within the crop sector, e.g. shifting out of cereals production to pulses, oilseeds,
fibres, etc., is the most elemental form of diversification within agriculture. In a broad sense, the
changeover connotes a transition from subsistence to commercial farming. Introducing a new
crop or a set of crops in place of the existing ones, either because new technological possibilities
are opening up or newer demand patterns are emerging, also connotes agricultural diversification
of another kind. An advanced stage of this type of transformation is reached when cultivation of
fruits, vegetables and flowers becomes important, both in terms of acreage under plough and the
share in value of crop output. A relative shift from crop enterprises to livestock, forestry-
logging, fishing, etc., is another form of diversification. When such shifts grow apace, forward
linkages between agriculture and manufacturing expand and agro-industrialization becomes a
natural adjunct of the growth process. How much of the agro-manufacturing activity gets located
in rural areas themselves, or gradually shifts from urban to semi-urban and to rural areas, depends
on how much of the rural-urban continuum is already developed, and how much policy weight
tilts in favour of rural industrial development. Rural economic diversification, in general, and
agricultural diversification, in particular, are nevertheless occurring on a continuing basis.
4.1 Demand-side Factors
One has, first, to think of factors/developments, on the demand-side, that have been
responsible for causing structural shifts in agricultural output. In a market-driven economy, it is
the changing choices of consumers that send signals for commodities or commodity-groups
whose demand would expand and those for which it would contract, as the economy goes into the
future. It would then be meaningful to see the extent to which the domestic production and
supply mechanisms have been adjusting themselves to the changing demand patterns.
11
4.1.1 Demand for Food and Non-Food Items
In the ultimate analysis, the continuing process of agricultural diversification owes itself
to changing composition of demand for agricultural products. The best way of caricaturing the
changing composition of demand is to look at the consumption baskets of people over time. We
can look into the changing consumption basket in numerous ways, yet, more germane to our
analysis is to look, firstly, at the varying weights that food items, contrasted with non-food items,
have been occupying, from time to time, and secondly, within the food basket, what have been
the intensity of switch-over from cereals to non-cereal items. The temporal profile of the
consumption basket along the above lines would clearly signal the changing consumers’ tastes,
choices and preferences, over time, as we move up on the per capita income ladder.
Tables 1 and 2 portray the changing picture on the consumption of food items, separately
for rural and urban India, for the period 1972-73/2004-05. It is at once clear, from Table 1, that
by and large, in rural India, the quantum of real expenditure on food items has witnessed no
noticeable change during the past three decades and a half. The story is nearly the same for urban
India as well except that during the decade 1993-94/2004-05, per person monthly expenditure on
food items fell noticeably from Rs. 40.8 in 1972-73 to Rs. 36.4 in 2004-05. It is nevertheless
important to note that the level of per capita expenditure on food items has been consistently
higher in urban, compared with rural areas, although the gap between the two has been narrowing
over time, primarily because of a decline, albeit a weak one, in urban India.
The more striking feature is that, for all the years since 1972-73, per capita real
expenditure on cereals has been consistently declining while the one on non-cereals has been
rising, both in rural and urban India. Significantly, the level of real per capita expenditure has
been consistently higher in rural, compared with urban areas, in respect of cereals while it has
been the reverse in the case of non-cereals, although there too the rural-urban gaps have clearly
been dwindling, especially in recent years. In overall terms, during the past three decades and a
half, there has been a clear trend of substituting non-cereals in place of cereals, irrespective of the
rural or urban locale of the households. It appears that the food basket of rural consumers is
getting more and more akin to the one for their urban counterparts. The steadily increasing
preference for non-cereals over cereals clearly indicates the directions in which the Indian
consumer has been ‘directing’ and ‘propelling’ its agriculture to grow.
12
Table 2 captures the changing preferences and choices more profoundly. The percent
share of monthly per capita real expenditure on cereals as well as that on total of food items has
been declining, all the while between 1972-73 and 2004-05, in rural as well as urban areas. It is an
unequivocally clear expression of declining weight put on food items as a whole, as also for
cereals within the food basket, and the converse being true for non-cereals. In rural India, the
proportion of total monthly per capita expenditure on non-cereals rose steadily between 1972-73
and 1993-94 whereafter it witnessed a small decline, nevertheless staying pretty higher than the
1972-73 level, while in urban India, it remained nearly the same up to 1993-94 and declined
sizably thereafter.
Germane to our analysis, it is absolutely clear that the total of food items has been
receiving a dwindling priority and the total of non-food items has been receiving a consistently
rising priority at the hands of an Indian consumer, whether residing in rural or urban areas. In
other words, out of every rupee spent by an Indian consumer, a shrinking share has been going to
the ‘demand for food’, authenticating the law of declining income elasticity of demand for food.
The steadily expanding level of real per capita income (proxied, in Tables 1 and 2, by monthly per
capita total consumer expenditure) together with a steadily declining share of monthly
expenditure on food items, reflects the clear tendency of a typical Indian consumer to steadily
shift his demand from agricultural products to the wide, and ever expanding, basket of non-
agricultural products.
But then, the changing composition of demand for agricultural products, e.g., between
cereals and non-cereals shows, equally unequivocally, the directions in which the demand for
agricultural products is likely to proceed in the years to come. To say the least, the direct
demand for human consumption of cereals (wheat, rice, jowar, bajra, maize, barley, etc.) is
destined to decline further into the future, just as it has been declining in the past, while the
demand for non-cereals (pulses and pulse products; edible oil; milk and milk products; egg, fish
and meat; vegetables; fruits; sugar; salt and spices; beverages, etc.) is likely to expand in response
to the rising levels of per capita income. It may, however, be underlined that the rising demand
for some of the non-cereals (say, milk and milk products; egg, fish and meat; some among the
beverages, etc.) is very likely to generate expanding indirect demand for animal consumption
of cereals, and that needs to be reckoned with for smoothening out the future demand-supply
13
balances for agricultural commodities in general, and cereals in particular (Kumar,1998; Bhalla,
2001; Mittal, 2006). Again, to say the least, the marketing of egg, fish and meat or vegetables or
fruit needs newer outfits, infrastructural support and institutional visions which, in all fairness,
has not been as much a strong point of state policy as for cereal crops.
4.1.2 Composition of Demand for Food Items
Table 3 shows the changes in the internal composition of the demand for food items,
broadly divided between the total of cereals and individual non-cereal items. It is absolutely clear
that cereals have been occupying a consistently declining share in per capita expenditure on food
items; it is not a trivial piece of statistical information that expenditure on cereals as a proportion
of expenditure on the total of food items has been systematically declining, say, from 55.8 per
cent in 1972-73 to 41.1 per cent in 1987-88, and further down to 32.7 per cent in 2004-05, in the
rural areas, and from 36.1 per cent to 26.6 per cent and further down to 25.8 per cent,
respectively, in the urban areas. The consistently declining weight of cereals for direct human
consumption, in the food basket of both rural and urban households, clearly shows the drift that
the market for agricultural products has been witnessing, rather unfailingly, in the past. It is
rather interesting to see that the drift away from cereals for direct human consumption has been
far more profound for rural, compared with the urban consumers. It is, therefore, hardly
surprising that the share of expenditure on food items going to milk and milk products, edible
oils, egg-fish-meat, vegetables, fruits, and beverages, has been rising steadily in the rural areas,
while in the urban areas, the meekly-rising share of expenditure on these non-cereal items reflects
a much less noticeable break from the past.
In overall terms, three significant developments need to be underlined in particular. First,
the demand restructuring within the basket of food items has been far more active in the rural,
compared with the urban areas. Second, cereals directly focused towards human consumption
have always occupied a higher weight in the food basket of rural consumers, compared with their
urban counterparts. In other words, the market for cereal crops has been, and is likely to remain,
significantly weightier in rural areas, keeping aside the reality of self-consumption by a fairly
sizeable segment of farming households. Third, the composition of the food basket for rural
consumers has been steadily coming closer to that for urban consumers. The relative weights of
non-cereal items among rural consumers have been tending to come closer to those among their
14
urban counterparts; the rank correlation coefficient for the ten non-cereal items listed in Table 3,
for rural and urban areas, improved significantly from 0.64 in 1972-73 to 0.83 in 2004-05.
In plain terms, the rural-urban differences in terms of the relative weights accorded to
individual non-cereal items, are now tending to become similarities. In a broad sense, what needs
to be taken note of, and provided for on the supply-side, for the urban market, is summarily the
same as for the rural market. The rural-urban dichotomy in relative preferences and choices for
non-cereal items is declining and strikingly similar patterns are emerging for rural and urban
consumers. The data for recent years clearly suggest that if milk and milk products are accorded
the top priority among the non-cereal items by rural households, their urban counterparts are
doing the same; if vegetables are the next priority for rural consumers, their urban counterparts
are closely placed at No. 3, and so on. It is only for fruits-nuts and beverages that the relative
priorities differ, although not so strikingly, between the rural and the urban consumers. Although
it is a little pre-mature to interpret it as the emergence of identical rural-urban purchase behaviour
for non-cereal products, yet it would not be too far into the future that similar marketing strategies
and price regimes would work equally effectively for rural and urban India.
4.1.3 Increasing Demand for Modern Inputs
In terms of production technology, the Indian agriculture has been undergoing a steady
transformation, most ostensibly, in terms of the switch-over from traditional to modern inputs,
since the arrival of the Green Revolution towards the close of the sixties in some states, and
gradually spreading over to other states during the seventies and the eighties. This triggered the
process of strengthening backward linkages between agriculture and the rest of the economy, on
the input side, and forward linkages between agriculture and industry, on the output side. First, as
Table 4 clearly shows, during the fifties and the sixties, the composition of production inputs
tilted heavily in favour of farm-raised inputs, and to that extent, the linkages with industry were
still of an extremely low order. But then, from 1970-71 onwards, a continuously increasing
proportion of expenditure on fertilizers in place of farm yard manure, purchased seeds steadily
replacing farm-raised seeds, extensive use of farm machinery most ostensibly through custom
hiring, substitution of tube-well irrigation for canal/tank irrigation and consequently expanding
demand for diesel oil and electricity, increasing use of insecticides and pesticides, etc.,
unmistakably unfolds the story of the changing input composition and of expanding backward

15
linkages between agriculture and the rest of the economy, including a variety of industrial
products and tertiary services (Govt. of India, 2001: 258-61, Govt. of India, 2008: 145). The
steadily rising share of marketing charges at once testifies to the increasing pace of agricultural
commercialization, on the one hand, and expanding linkages between agriculture and tertiary
sector activities, on the other. Again, the consistently declining share of expenditure on livestock
feed points indirectly, albeit partially, towards the dwindling stock of draught animals, on the one
hand, and increasing incidence of mechanization, on the other. In sum, the consistently
increasing presence of purchased inputs that has been sustaining the process of output growth in
Indian agriculture has been adding, in varying form and content, its share to the rural non-farm
growth in general, and some of the rural industrial activities, in particular.
4.2 Supply-side Responses
Thanks to the steadily increasing pace of its commercialization, the composition of
agricultural output has been duly responding, in varying form and content, to the changing
structure of demand for agricultural commodities. As on the demand-side, the supply-side
responses can also be assessed in more ways than one. Changes in the relative share of
production in the four major sub-sectors of Indian agriculture (crop sector, livestock, forestry-
logging and fishing) is a straightforward way of looking at sub-aggregate changes. The changing
share of each commodity or commodity-groups within each major sub-sector of agriculture
throws bare a more detailed re-structuring of agricultural output and growth. As the following
analysis shows, the composition of agricultural output has been changing, in varying degree, in
each sector or sub-sector of Indian agriculture, and this, in turn, has been influencing the pace and
pattern of agro-industrial growth.
4.2.1 Inter-Sector Output Shifts in Agriculture
Undoubtedly, field crop production continues to be the most over-bearing component of
Indian agriculture. This is not to deny that livestock has, by now, become a major sector of
Indian agriculture, yet, its share is still of a limited magnitude compared with crop production.
The other two sectors, viz. fishing and forestry-logging look pygmies in relation to crop sector.
Nevertheless, Table 5 shows some interesting inter-sector changes since 1982-83. First, there is
a clear trend to show some diminution, by no means a strong one, in the share of crop output, and
16
accordingly, the crop production sector continues to heavily dominate the Indian agriculture
from the point of view of output; the dominance is far more over-bearing from the point of view
of employment. That, as late as 2005-06, field and plantation crops together account for two-
third of agricultural output , and around 89.0 per cent of agricultural workers, clearly indicates
that Indian agriculture continues to be heavily geared by the changing fortunes of crop
production. Most of the developments related to the pace and pattern of agricultural growth,
including the growth of agro-based industrialization, would thus depend on how the crop sector
fares, on year to year basis, and maintains the supply-chains, on a sustained basis. Looking
together at the share of output and that of agricultural workers, one should not be surprised to
discover a stagnating, if not declining, levels of per worker productivity in the crop sector.
Second, livestock, and to a slightly lesser extent fishing, can be taken, if at all, to be the
only harbingers of diversification within agriculture. In livestock, the share of output increased
over time, first from 19.9 per cent in 1982-83/1984-85 to 22.6 per cent in 1992-93/1993-94, and
then to 25.3 per cent in 2002-03/2005-06. A similar pattern of increasing share of agricultural
output is discernible for fishing, although of a much lower order. In both these sub-sectors, the
changing trends are suggestive of increased level of per worker productivity.
Finally, forestry-logging has been a declining sub-sector, from the point of view of its
share in agricultural output, and has hardly held high employment stakes for rural households in
general. As a matter of fact, both forestry-logging and fishing have been negligible players in the
employment market, against their noticeable presence on the output front. It is clear, therefore,
that whatever be the number, and the proportion, of agricultural workers, engaged in livestock,
forestry-logging and fishing, their per worker productivity levels have been improving vis-à-vis
those engaged in crop production, and to that extent, any attempt towards diversifying the
production base of Indian agriculture away from crop production should be taken as a concrete
step towards rural poverty alleviation.
4.2.2 Changes within Crop and Livestock Sectors
Table 6 takes us farther down to the changing structure of crop and livestock production
base of the Indian agriculture. A few observations are in order.

17
First, within the crop sector, cereal crops are losing their ground to non-cereal crops. The
relative shift, however, does not connote a major restructuring in favour of non-cereals.
Second, within the cereals sector, the three technology-driven crops (namely, paddy,
wheat and maize) have witnessed a varying degree of increase, and all other crops for which no
technology breakthrough has been forthcoming so far (viz. jowar, bajra, barley, and others such
as ragi and small millets) have witnessed a varying degree of decline, during the post-1982
years. Here is an interesting mingle of demand shifts, and technology improvements, in favour of
the very same set of superior cereals such as wheat, rice and maize. The opposite mingle of
demand shifts away from, and lack of improved technologies for, the very same set of other
(inferior) cereals such as jowar, bajra, barley, ragi, small millets, etc., is responsible for causing a
relative decline in the share of output of the latter group of cereal crops. In total terms, it is fairly
evident that paddy, wheat and, to a much lesser extent, maize are the only noticeable cereal crops
which could foster, and gradually strengthen, forward linkages with the industrial sector. In other
words, the core of agro-processing industrial activities, catering to core human consumption and
based on the supply of raw material from the crop sector of the Indian agriculture, are primarily
confined to paddy, wheat and maize. That barley and maize, along with other cereal and non-
cereal crops, promote and sustain other agro-industrial activities, is a different matter.
Third, within the non-cereal crop sector, four newer sub-sectors, namely, fruits-
vegetables, condiments-spices, drugs-narcotics and floriculture, registered a clear upward break
since the early eighties, most discernible since 1992, while the traditional sub-sectors, namely,
pulses, oilseeds, sugarcane and fibres, witnessed a varying mingle of decline or constancy. At the
top of all other crop sub-sectors, the output share of fruits-vegetables increased from 28.33 per
cent in 1982-85 to 29.31 per cent in 1992-95, and then, far more impressively to 32.84 in 2003-
06. For floriculture, the real increase came forth from 0.63 per cent in 1992-95 to 1.76 per cent in
2003-06. Similar increases are discernible for condiments-spices as well as drugs-narcotics.
These increases signify newer developments in the crop production sector of Indian agriculture.
Whether the tiny and marginal farmers, who, by any objective reckoning would account for a
preponderant majority of the poor among the cultivating households, have been able to effect a
switch-over to these new market-savvy, and more productive, crop enterprises, needs to be
examined with greater empirical rigour. On the opposite side, the steep decline in the case of
18
pulses, oilseeds and sugarcane since 1992-95, reflects a potential distress for agro-industries
based on supply-links with these non-cereal crop sub-sectors. As we see later, the post-1992
story of many of these industries has not been all that happy.
Finally, in contrast to the output vicissitudes of the crop sectors and sub-sectors, the
diversification within the livestock sub-sector clearly points towards the steadily rising
importance of milk; the output share of meat has been hovering around 17.0-18.0 per cent while
that of eggs around 3.0-4.0 per cent, during the 1980s, 1990s and 2000s. The traditional sub-
sectors such as wool and hair, silk worm cocoons and honey, dung, etc., have clearly been
declining consistently since the early eighties. Given the pattern of output expansion within the
livestock sector, amongst the livestock-based agro-processing activities, manufacture of a wide
variety of dairy products, processing, canning and preserving of fish, slaughtering, preparation
and preservation of meat, etc., promised a fast expansion, during the post-reform years. As the
later analysis unfolds, this was indeed the case.
4.2.3 Output Growth in Livestock Sub-sectors
Earlier, Table 6 had unambiguously testified that milk production is the most
domineering segment of India’s livestock economy. Table 7 now shows that, in comparison to
the other weighty segment, viz. meat production, of the livestock economy, it has registered
much faster growth as well, during the post-reform years. For example, during 1993-94/2002-03,
output grew more than 4.0 per cent per annum, both in milk and meat sub-sectors, in nine of the
seventeen Indian states. But then, for milk, it grew negatively only in one state (Bihar) while for
meat, it grew negatively in no fewer than five states (Bihar, Gujarat, Himachal Pradesh, Madhya
Pradesh and West Bengal).
In plain terms, livestock sub-sectors have put up a fairly impressive post-reform profile of
output growth, with milk production leading the others, most significantly, in terms of wider
spatial coverage. Such an output growth profile needs to be interpreted partly in terms of
changing demand patterns at home (Tables 1 and 2), and partly in terms of intensive export-
promotion strategies adopted in the post-reform era. The share of meat and meat preparations in
total export of agricultural and allied products rose steadily from 0.6 per cent in 1970-71 to 2.2
19
per cent in 1990-91, to 5.2 per cent in 2000-01 and 6.7 per cent in 2008-09 (Govt. of India,
2010:A86-A88).
4.2.4 Ailing Yield Levels for Major Crops
A point of great concern, relating to the dominant (crop production) segment of Indian
agriculture, is the slumbering yield levels that many cereal and non-cereal crops have been
witnessing for recent years. That this affects the supply-chain to, and the growth prospects of, a
wide section of agro-processing manufacturing, needs hardly to be emphasized. Table 8 conveys
this concern rather tellingly.
In recent years, the growth of yield levels for the most important and technology-intensive
crops, namely paddy and wheat, which have been the backbone of Green Revolution in India, has
slackened substantially. For example, for wheat, the yield rate grew impressively by 3.15 per cent
during 1981-82/1991-92 - the hey-day of the Green Revolution- and started slackening to 1.19 per
cent during 1991-92/2001-02, and, most distressingly, to -0.32 per cent since then. It is nearly the
same story for rice, maize and the total of food-grains.
The pulses show the most disturbing slow-down. For example, the growth rate of pulses
yield rate fell steeply from 1.32 per cent during 1981-82/1991-92 to as low as 0.49 per cent
during 1991-92/2001-02, and stayed as low as 0.58 per cent during the post 2001-02 years. While
oilseeds seem to have recovered some of their lost ground, sugarcane and tobacco are not yet out
of distress.
Although the phenomenon of Indian agriculture being still a ‘gamble in the monsoon’
holds true for many regions, and crop regimes, yet the yield setbacks discernible in Table 8
cannot all be attributed to erratic and undependable rainfalls. For many crops, or crop-groups, the
proportion of irrigated cropped area is remarkably high. Wheat, rice, sugarcane and tobacco are
unmistakable examples. For wheat and rice, it is undoubtedly the technology fatigue that has
been jeopardizing yield growth, in recent years. For maize and coarse cereals under cereal crops,
pulses, oilseeds and cotton, under the non-cereal crops, the rain-god still rules the roost. One of
the festers that Indian agriculture has lived with, for rather too long, is the lack of a reliable dry-
farm technology. Inasmuch as a substantial proportion of cropped area in India is to continue
under dry-farming conditions, a technology breakthrough on the lines of what became available

20
earlier during the 1970s for wheat and rice under irrigation conditions, is the answer for the yield
stalemate.
V. Agriculture-Industry Linkages
We have no standard method of looking at the way that agriculture fosters rural industry,
and gets fostered by it in return. As said earlier, the linkages can commence right at the village
level, and can well extend to district, state and national, and in some cases, especially for rural
+consumption, to international level. Data limitations are indeed severe, and the best that one can
do is to explore two or three independent data sets, frame questions that can be empirically
answered by these sets, albeit less firmly, and develop broad ideas about the changing nature of
agriculture-rural industry relationships, especially after the onset of economic reforms since the
early nineties. Our analysis begins with the VSI (village and small industries) sector which, in our
view, should be reflective of changes in agriculture-industry linkages within the village economy.
To bypass the usual distance-decay or distance-prop implications, we look at the national level
picture. A few preliminaries must, however, be straightened out right-way.
5.1 V.S.I. Sector
The VSI sector consists of eight sub-sectors, six ‘traditional’ and two ‘modern’. The six
traditional sub-sectors are khadi, village industries, handloom, sericulture, handicrafts and coir
while the two modern sub-sectors consist of small scale industries and powerloom. Location-wise,
five of the six traditional sub-sectors (i.e. khadi, village industries, handloom, sericulture and coir)
are preponderantly rural-located, while handicrafts do have a sizeable presence in the semi-urban
locales. On the other hand, small-scale industries and powerloom are spread over rural, semi-urban
and urban locations. In other words, looking across the six industrial groups under the traditional
sector, one is essentially gauging through agriculture-industry linkages within India’s rural
economy while the analysis of linkages of modern sector, located partly in rural and partly in urban
areas, with agriculture in rural India, brings into focus the mix of rural-to-rural and rural-to-urban
or urban-to-rural dimensions of agriculture-industry linkages.
The intra-group variations in terms of the size of operation, persons employed,
technology-in-use, market coverage, etc., are bound to be far greater among the group of
small-scale industries which are indeed a heterogeneous mix of enterprises ranging from tiny,
21
cottage, household-based activities, on one end, and modern factory-based enterprises, on the
other; most of the remaining seven categories are of cottage or household-based types of
enterprises. Again, while the consumption linkages of rural agricultural households are captured,
fairly robustly, by village industries, handloom, and powerloom and, partially, by small scale
industries, production linkages are operative, in varying form and degree, through village
industries, sericulture and small scale industries.
The time-series data on the VSI sector is difficult to deal with. First, the series begins only
from 1973-74 onwards. But then, there are many information gaps most noticeably for production
figures for 1974-75 to 1978-79, and, 1980-81 to 1983-84. Such gaps do undermine the quality of
data. Second, production figures at current prices are oddly mixed up with those at constant prices,
sometimes even for the same year; a uniform series either at current or constant prices is not
available. The best that we could do with the available data was to construct three production and
employment series, at 1979-80, 1984-85 and 1993-94 prices, respectively. Towards this end,
certain adjustments/assumptions have to be made which may not be the best to go by. To quote a
few examples, for some years, production data for a specific sector available only in physical terms
were converted into monetary terms, using the ‘implicit unit price’ prevailing in the base year.
Obviously, no regard is paid to the changing composition of output within that sector. Again, the
available data for the post 1990-91 years are largely available at current prices only. We converted
the same into constant prices using the all-India all-commodities wholesale price index with base
1993-94 (RBI, 2004:67). Although the resultant production figures (at 1993-94 prices) is not
completely free of deflation bias, yet it cannot fail to capture the broad changes in real output of the
eight VSI sub-sectors. We thought, it was better to be vaguely right than to be precisely wrong.
The (compound) growth rates are computed on point- to-point basis for the sub-periods
1973-74 to 1984-85 (Series I) and 1984-85 to 1989-90 (Series II) and through estimation of the
standard semi-log functions for the period 1990-91 to 2003-04 (Series III); in the case of Series I
and II, the number of available observations is too small to justify a semi-log function. We know
that our growth rates under Series I and II are highly sensitive to base- or end-year variations and
are not, therefore, completely reliable yet they do capture the uneven pace of output and
employment expansion, across the sectors and across the three sub-periods devised by us. Most
surely, the declining or slumbering ‘spots' stand out as contrasts to their expanding counterparts.
22
Finally, in the interest of comparability of growth between the VSI sub-sectors and agriculture,
growth rates for the latter must necessarily be computed for the same sub-periods as for VSI sub-
sectors. Many choices, each with its own limitations and infirmities, were open to us. The least
questionable procedure adopted for computing real agricultural growth rates was to go by a
uniform base (1993-94). We have thus a single base year (1993-94) for agricultural growth rates
against no fewer than three for the VSI output series. This limitation may be kept in mind when
period-wise growth rates for VSI sub-sectors are juxtaposed on those for agriculture.
It may help if tentative ideas about the linkages, and their changing content during the
recent past, between agriculture and the eight VSI sub-sectors are framed at this stage. Thanks to
the changing composition of farm inputs, a la the steady switch-over from farm-raised to
purchased inputs and introduction of new inputs, especially after the green revolution technology
started penetrating, in varying form and degree, into various regions of India, one may surmise that
the local-level linkages on the production side may have weakened over time. Again, thanks to the
increasing rural-urban commercial and other interactions, information inflows through television
and other media sources, and the rising levels of rural incomes, the capabilities of some of the local
industries, say, khadi, village industries, handloom, etc. to meet the changing consumption
requirements of the rural people might have declined. It is possible that product varieties and
design outfits have been improving in some of the VSI sub-sectors, especially in the small scale
industries sub-sector, yet, it is doubtful that this, by self, could make consumption linkages
stronger than before. The net outcome on the consumption side is difficult to predict a priori.
5.1.2 Growth Profile of VSI Sector
Before we look into the linkages that agriculture has had with the VSI sub-sectors, it is
essential to see how the VSI sector itself has fared over time, especially in terms of growth of
output and employment. Tables 9 and 10, riddled though with some computational disabilities,
give the output and employment profiles of the sector since 1973-74. It throws up a few disturbing
features for the traditional sub-sector in general and khadi and handloom in particular. First, all
along, output in real terms has shown impressive expansion in the modern sector compared with
the traditional sector, both during the best and the worst of times. A growth rate of 10.9 per cent
per annum among the small scale industries, during 1973-74/1984-85, compared with 4.2 per cent
among the traditional industries, testifies to the relative dynamism of the former, partly facilitated
23
by comparative size and location advantages and partly by more buoyant demand conditions; the
khadi Sector also grew rather impressively (7.8 per cent per annum) during this period, presumably
because adequate state support was available to it, under one or the other pretext. During the
subsequent period 1984-85/1989-90, output growth rate improved among many traditional groups
but the modern sector grew much faster, at the top of a very high growth rate already achieved
during 1973-74/1984-85. For example, the growth rate in the small-scale sector climbed up to a
high of 12.8 per cent compared with the steep decline from 7.8 per cent to 3.6 per cent only for the
khadi. In fact, khadi/handloom output growth rate was the lowest among the traditional set of
industries, let alone in relation to small-scale modern industries and the power-loom. In plain
terms, a big decline in output growth was faced by khadi/handloom, and a moderate decline in
village industries during 1984-85/1989-90 years while for the other sub-groups, it improved by
varying margins.
The real test of nerves came only during the post-1990 years. Output growth rates for
most of the traditional sub-sectors, most dramatically for khadi, handloom, sericulture and
handicrafts, declined steeply. The powerloom and small scale industries under the modern sector
too faced a decline, but it was far less frightening than the one in the traditional sub-sectors. In
spite of its growth setback, the smallscale industries continued to grow at a heft rate of 7.8 per
cent per annum during 1990-91/2003-04.
Second, throughout the post-1973 years, employment expanded, by varying magnitude, in
many of the VSI sub-sectors (Table 10). Of course, the level and pattern of employment growth did
vary markedly among individual segments, from one sub-period to the other. In general,
employment expansion was relatively sluggish in khadi and coir sub-sectors. On the other hand,
powerloom and small-scale industries under the modern segment and handicrafts and village
industries under the traditional segment threw up, almost dutifully, fairly high employment growth
rates, in each sub-period. The handloom sector too performed well except during 1984-85/1989-90.
On the whole, the picture on employment expansion has not been too bad, except for khadi and coir
ever since we stepped into the mid-eighties.
Third, contrary to the usual perception, employment growth in the modern sub-sectors has
usually been higher than that in their traditional counterparts. For example, during 1973-74/84-85, it
was 8.5 per cent per annum in the modern segment against 4.5 per cent in the traditional segment;
24
6.1 per cent against 5.6 per cent during 1984-85/89-90; and 3.1 per cent against 2.2 per cent during
1990-91/2003-04. Khadi in particular stands out as an example of employment reverses in recent
years given the fact that an overwhelming proportion of khadi workers are engaged only on a part-
time basis; in net terms, the employment profile of khadi and its associate sericulture really pales
into insignificance, especially in relation to the modern small scale industrial activities, for the post-
1990 years. In other words, the most avowed objective of creating industrial employment for the
rural masses, through khadi and its associated sub-sectors, seems to have been fulfilled only
partially; in an accounting sense, the number of people employed in the khadi sector has certainly
been increasing, albeit very moderately at times, yet the economic content of this employment has
not been much since a preponderant majority of khadi workers have been part-time workers only.
For most of such part-time workers, especially the female workers engaged in spinning, the usual
work-time does not go beyond 3 hours or so per day and accordingly, their earnings stay at
ridiculously low levels (Chadha, 2000:13).
Fourth, the uneven output and employment growth performance of individual industry
groups readily convinces us that the absolute level of productivity in traditional rural industries
should be many times lower than that in the modern sectors. Still more important is the fact that
over time, the ratio between the high-productivity sector (small-scale industries) and
low-productivity sector (say, khadi) has been expanding, almost on a continuing basis. From this
point of view, modern small-scale industry must be looked upon as a hope for the future. If mere
expansion of numbers is to be taken as an index of employment, most of the VSI segments have
acquitted themselves well. However, if productivity level and its growth are the basic criteria for
viability, sustainability and growth of rural industrial units, including their long-run capability to
take on more and more of working hands, only small-scale industrial units seem to fill the bill. In
most other segments, employment expansion without much regard for productivity and earning
levels seem to have guided the course of events. Khadi undoubtedly failed on both fronts;
undoubtedly, it is the declining or sagging levels of productivity that must have been responsible
for cutting into its employment capabilities since 1984-85. In recent years, employment in the khadi
has indeed been the most distressing spot in the VSI sector.
Tables 9 and 10 also show the changing relative importance of individual segments of the
VSI sector. As is expected, the modern segment accounts for a lion's share of output while the bulk
25
of employment is offered by its traditional counterpart. In the modern segment, both output and
employment shares have expanded while the opposite has happened in the traditional segment. It
seems the latter segment is being pushed to a corner as far as its share in output is concerned; in
2003-04, it had to contend with a mere 6.14 per cent share in output against as high as a 55.83 per
cent share in employment; way back in 1993-74, the two figures were 19.21 per cent and 67.28 per
cent, respectively. The implications towards productivity levels should thus be clear. Over time,
the traditional rural industries have steadily lost their ground to modern small-scale industries.
Interestingly, the power-loom sub-sector seems to have been an absorber of many additional
working hands even while losing tremendously in its share in output. Thus, as said earlier, in de
facto terms, productivity/worker profile in the power-loom sub-sector has put it more in the league
of traditional sub-sectors rather than modern small-scale industries.
An especially distressing picture emerges for the handloom sub-sector where in 2003-04 a
mere 0.76 per cent share in output was accompanied by as high as a 21.16 per cent share in VSI
employment; in 1973-74, the two shares were 7.39 per cent and 34.30 per cent, respectively. This
sub-sector seems to serve as a dumping ground for a lot of additional labour force, presumably
because alternative employment opportunities are not available to those already engaged in it,
especially to those weavers who have been in the craft for a long time and could not shift to other
jobs, presumably due to lack of education and alternative skills.What else can explain the
weakening of this sub-sector during the past decade and a half?
Khadi has been losing its ground even more precipitously, and that too, both from output
and employment angles. For example, in 1973-74, it had as small a share in VSI output as 0.29 per
cent, against a 5.79 per cent share in employment; in 1990-91, the output share declined to a
negligible level of 0.14 per cent, against 3.33 per cent share in employment; and finally, in 2003-04,
the output share was a ridiculously small figure of 0.04 per cent, against a 2.77 per cent share of
employment. The decline in khadi’s share of employment may not look terrifying from these
figures, yet given the fact that nearly 70.0 per cent of the khadi workers are part-time workers only,
the real decline would indeed be steeper still if full-time equivalent of part-time workers could
somehow be ascertained.
In total terms, looking back to the past three decades, it is fairly obvious that, by and large,
the traditional rural industries have acquitted themselves well in fulfilling their avowed objective of
26
providing employment to the expanding army of rural labour-force. In the context of wide-spread
rural poverty, especially that occasioned by the rising incidence of rural landlessness and
marginalization of land holdings, on the one hand, and under- (if not un-) employment of a big mass
of rural workforce, on the other, it has not been a trivial development. Yet, for making a decisive
dent into rural poverty, a more lucrative employment status, most essentially in terms of high
productivity and earning levels, is an inescapable pre-condition. Unluckily, productivity expansion
nowhere seems to have been in sight, either during 1973-74/1984-85 or during 1990-91/2003-04.
This was largely so because employment growth closely chased, and in some sub-sectors (most
notably, the khadi sub-sector) exceeded output growth, during 1990-91/2003-04. The periodic up-
and down-swings in production has been another noticeable feature of some among the traditional
industry groups. The modern sector offers a contrast. Relative to the remaining seven sub-sectors,
output and employment in the small scale industries sector grew at much higher rates, during each
of the three sub-periods. That there has been an all-round decline in growth rate since mid-eighties
is a different matter. Improving levels of productivity clearly followed in the small scale sector
which, unfortunately, was not the case for most of the traditional segments of the VSI sector.
5.1.3 Agriculture and VSI Sector
The nature and quality of data for the VSI sector do not permit us to make strong statements
about its linkages with agriculture. Nevertheless, some indicative evidence can be fished out of the
temporal profiles agriculture-GDP and the VSI sub-sectors. Table 11 looks at growth rates for
agriculture-GDP against output growth rates for individual VSI sub-sectors, for each of the three
sub-periods, 1973-74/1984-85, 1984-85/1989-90 and 1990-91/2003-04. Some hints, albeit loose
and indicative, about the weakening of VSI exchanges with agriculture, do come up anyway.
Table 11 shows that during the decade 1973-74/1984-85, when growth rate of agriculture-
GDP was around 3.0 per cent per annum, most of the VSI sub-sectors were also buoyant. During
these years, village industries, khadi and sericulture, under the traditional sector, grew impressively
at 9.7 per cent, 7.8 per cent and 7.6 per cent, respectively. Small scale industries under the modern
sector did a shade better, at 10.9 per cent per annum. The bunch of growth rates does give the
impression that, during 1973-74/1984-85, agriculture did make a varying degree of impact on the
27
growth of individual sub-sectors or VSI as a whole. During the later half of the eighties, when
growth of agriculture-GDP improved to around 4.0 per cent per annum, its impact on most of the
traditional sub-sectors, namely khadi, village industries and handloom, worked negatively, while it
pushed up output growth rate in the remaining sub-sectors. This was the time when the green
revolution technology, originally cradled by Punjab and Haryana, started permeating into many
other regions, its varying form and content notwithstanding. Perhaps, the demand for purchased
inputs, in those initial years of wider technological spread, could be partially met by local industries,
most ostensibly, small scale and village industries. Again, presumably, the rising demand for
consumption goods, arising out of higher growth rate of agriculture-GDP, was also partially met by
local industries such as small scale and village industries, powerloom, handicrafts, and so on.
Clearly, the consumption basket of agricultural households started drifting away from khadi,
handloom and village industries products, in favour of small scale industries and powerloom.
During the post-1990 years, which witnessed a big bunch of economic reforms of the early
nineties, India’s membership of WTO in January 1995, the product de-reservation policies
following Abid Hussain Committee’s report in 1997, freer out- and in-flow of industrial goods
under the Medium Term Export-Import (EXIM 2002-2007) Policy, all combined to bring about
formidable changes in the rural economy. Growth rate of Agriculture–GDP declined steeply to 2.6
per cent, and with that, the growth rate of each sub-sector also witnessed a varying degree of
decline. The most noticeable is the decline in the small scale industries which plummeted from as
high a rate as 12.8 per cent to as low as 7.8 per cent. The lower growth of agriculture-GDP means
lower demand for agricultural inputs, on the production side, and lower demand for consumer
goods, on the consumption side. Hence, the sufferance of growth among the small scale industries.
The substantial decline in growth rates in the traditional sub-sectors, most markedly in the khadi,
sericulture and handicrafts, possibly reflects the combined effect of lower demand and demand-
drift. Our surmise of demand-drift draws its sustenance from a comparison of the post-1990 years
with their pre-1984 counterparts. During both the periods, growth of agriculture-GDP was about the
same: 2.7 per cent against 2.6 percent. Earlier, this growth rate supported nearly 9.0 per cent output
growth in the VSI sector while it could not support more than 7.0 per cent, during the post-1990
years. That growth rate plummeted from 7.8 per cent to -2.4 per cent in khadi, from 9.7 per cent to
4.9 per cent in village industries, from 7.6 per cent to 2.2 per cent in sericulture, and from 3.5 per
cent to -1.3 per cent in handicrafts tells the rather devastating story for the traditional sector. The
28
only segment of the VSI sector that escaped the scathing after-effects of the decline in agricultural
growth is small scale industries although, here too, the deceleration of growth from 12.8 per cent
during 1984-85/1989-90 to 7.8 per cent during 1990-91/2003-04, could not be helped. Nonetheless,
it is not a trivial fact that, during the post 1990-91 years, growth rate in the small scale industrial
sector still ruled as high as 7.8 per cent in the midst of negative and very low growth rates in the
traditional sub-sectors. A closer movement of agriculture and small scale industries, against
diverging growth paths followed by agriculture and traditional industrial sub-sectors is a significant
indicator of structural transformation of India’s rural economy.
In sum, in spite of the severe data limitations, Table 11 does throw up some unpleasing
signals. In recent years, the pinch of lower agricultural growth has been felt, in varying degree, by
all types of rural industrial activities. The severest setback is faced by the group of traditional
industries, most noticeably khadi, handloom, sericulture and handicrafts. But then, even the modern
industrial activities have not escaped the damaging effects of slower agricultural growth, although
on a much lower scale that kept up the tempo of growth at fairly high levels. Inasmuch as the
growth setbacks are discernible for rural industrial activities that supply inputs to agriculture (e.g.
small scale and village industries) just as it is so for industries supplying consumer goods (e.g.
khadi, handloom, powerloom, small scale industries, etc.), we have some evidence to support the
hypothesis that the process of rural industrialization cannot sustain itself against the backdrop of a
drooping agriculture.
We must confess that all growth up- and down-swings witnessed among the VSI sub-sectors
cannot be attributed solely to agricultural up- and down-slides. Some of these growth swings owe
themselves to urban incomes and demands, especially in the case of khadi, sericulture, handicrafts,
under the traditional sector, and small scale industries and powerloom, under the modern sector.
Again, demand switch-over on the consumption side, say, from handloom to powerloom products,
or from village industries to small scale industries, within the rural areas themselves, are not ruled
out. Finally, the increasing inflow of urban as well as imported products, especially on the
consumption side, may also be making inroads into the growth performance of rural industries,
irrespective of whether the agriculture-rural industry linkages are growing or shrinking.
29
5.1.4 Agriculture and Small Scale Industry
It was evident from Table 11 that small scale industries stood out distinct among all
segments of the VSI sectors in maintaining its movements in tandem with those of agriculture. The
accompanying graphs corroborate this reality, in a more convincing manner. The graphs are
sketched out with a one-year lag between GDP in primary sector (GDPpry) and GDP originating in
the small scale industries (GDPssi), both at constant prices. Because of some definitional and price-
index complexities, two separate graphs have to be prepared for the sub-periods: 1972-73/1988-89
(sub-period I) and 1989-90/2007-08 (sub-period II). It is interesting to see that short-term, year-to-
year, up- and down-swings in GDPpry do not affect the smooth upward movement of GDPssi. That,
once again, lends credence to our contention that the group of small scale industries is heavily inter-
linked with rural areas in general and agriculture in particular, both for sustaining the production
base of the rural economy and meeting the variegated consumption needs of the rural households.
To set the relationship between GDPssi and GDPpry in a statistical relationship, we give
below two linear regression equations, with a one-year lag, for the two sub-periods:
GDPssi(t) = -19596.64* + 1.066* GDPpry(t-1) … R2= 0.960 … Sub-period I ( -8.89) (13.29)
GDPssi(t) = -436822.41 + 1.367* GDPpry(t-1) … R2 = 0.985 … Sub-period II (-7.46) (11.59) where t values are in the brackets; * means significant at 0.01 level.
It is interesting to see that GDPpry had been making slightly bigger impact on GDPssi
during 1972-73/1988-89 than it did during 1972-73/1988-89. Although an in-depth empirical
analysis is needed to explain this phenomenon yet, even on the basis of whatever fragmentary
evidence is available, it can be conjectured that during the recent years, diversification of the rural
economy has been occurring, in varying form and content, and in most regions of India, including
through rural re-location of small industries incentivized by diverse institutional supports. The
rising pace of rural agro-industrialization, albeit hugely hijacked by the unorganizd segment of the
Indian industry is what has been bringing agriculture closer to industry. In general terms, the non-
farm base of India’s rural economy has been expanding fast in recent years.
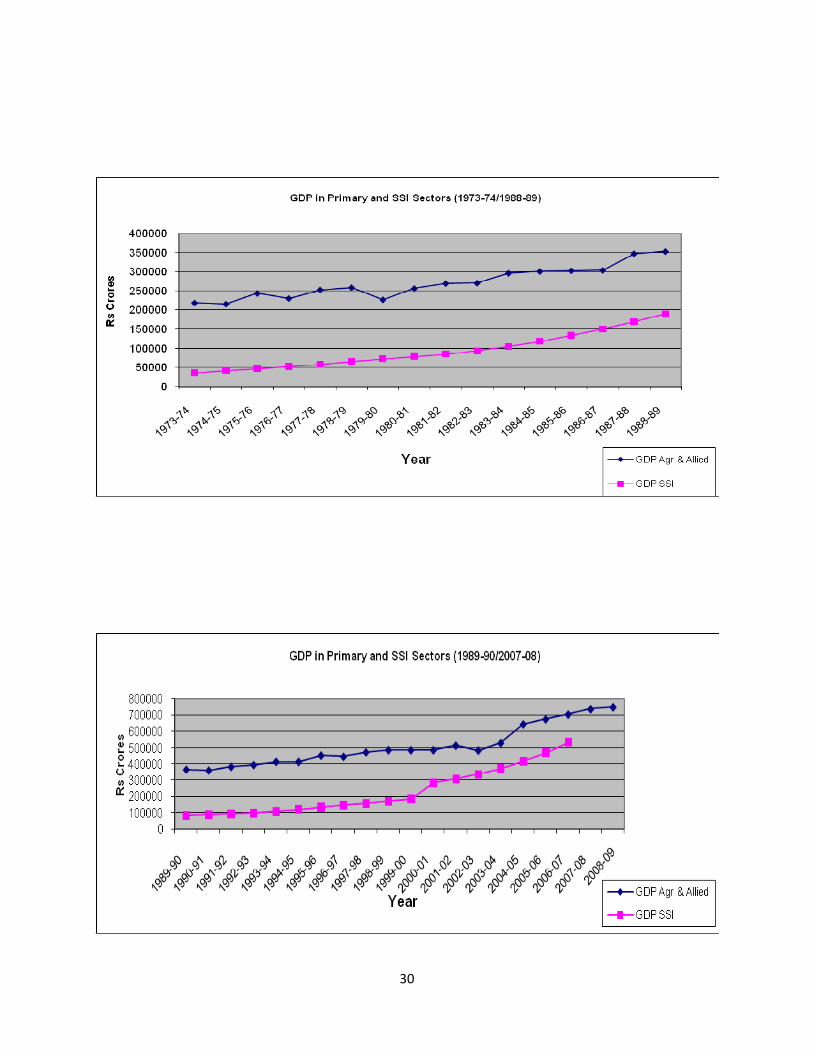
30
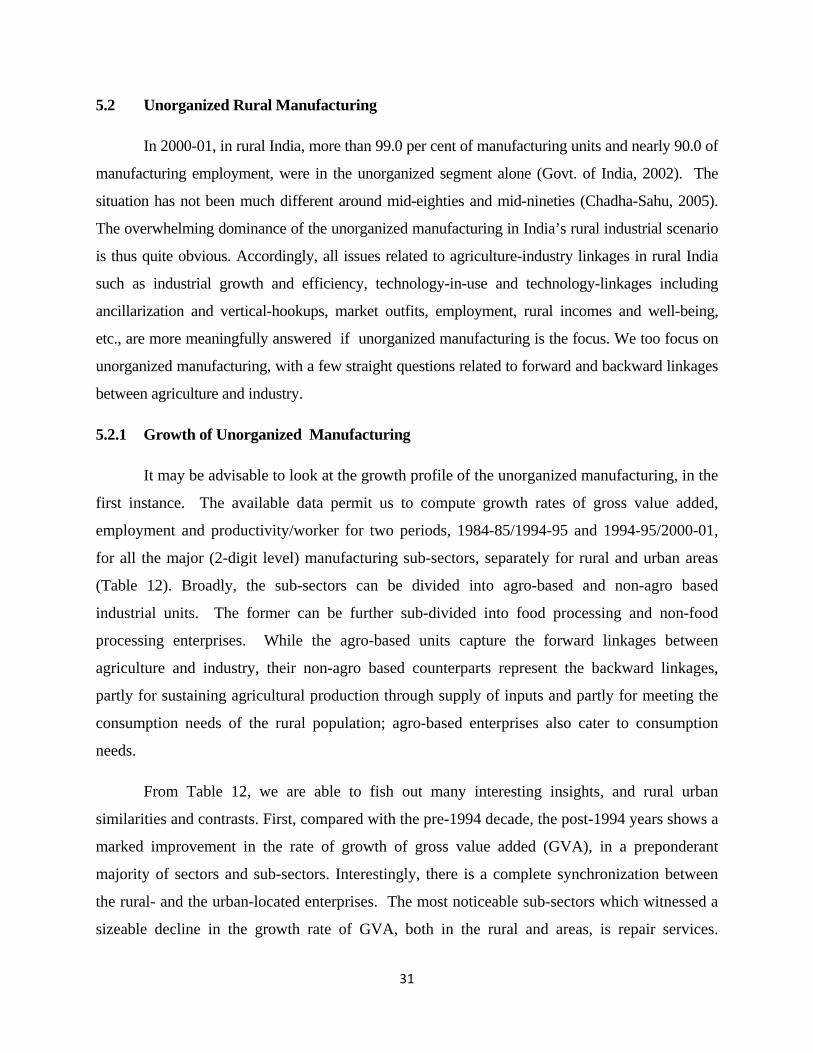
31
5.2 Unorganized Rural Manufacturing
In 2000-01, in rural India, more than 99.0 per cent of manufacturing units and nearly 90.0 of
manufacturing employment, were in the unorganized segment alone (Govt. of India, 2002). The
situation has not been much different around mid-eighties and mid-nineties (Chadha-Sahu, 2005).
The overwhelming dominance of the unorganized manufacturing in India’s rural industrial scenario
is thus quite obvious. Accordingly, all issues related to agriculture-industry linkages in rural India
such as industrial growth and efficiency, technology-in-use and technology-linkages including
ancillarization and vertical-hookups, market outfits, employment, rural incomes and well-being,
etc., are more meaningfully answered if unorganized manufacturing is the focus. We too focus on
unorganized manufacturing, with a few straight questions related to forward and backward linkages
between agriculture and industry.
5.2.1 Growth of Unorganized Manufacturing
It may be advisable to look at the growth profile of the unorganized manufacturing, in the
first instance. The available data permit us to compute growth rates of gross value added,
employment and productivity/worker for two periods, 1984-85/1994-95 and 1994-95/2000-01,
for all the major (2-digit level) manufacturing sub-sectors, separately for rural and urban areas
(Table 12). Broadly, the sub-sectors can be divided into agro-based and non-agro based
industrial units. The former can be further sub-divided into food processing and non-food
processing enterprises. While the agro-based units capture the forward linkages between
agriculture and industry, their non-agro based counterparts represent the backward linkages,
partly for sustaining agricultural production through supply of inputs and partly for meeting the
consumption needs of the rural population; agro-based enterprises also cater to consumption
needs.
From Table 12, we are able to fish out many interesting insights, and rural urban
similarities and contrasts. First, compared with the pre-1994 decade, the post-1994 years shows a
marked improvement in the rate of growth of gross value added (GVA), in a preponderant
majority of sectors and sub-sectors. Interestingly, there is a complete synchronization between
the rural- and the urban-located enterprises. The most noticeable sub-sectors which witnessed a
sizeable decline in the growth rate of GVA, both in the rural and areas, is repair services.
32
Second, the post-1994 improvement in the rate of growth of GVA in agro-based industries,
largely engaged in the processing of raw materials received from agriculture, was substantially
higher among the urban, compared with rural, enterprises; the improvement was from -2.1 per
cent to 9.3 per cent in rural and from -0.8 per cent to 11.4 per cent in urban areas. It clearly
shows that the forward linkages between agriculture and industry do not stop in rural areas
alone; the expanding rural-urban continuum in agro-processing is thus clearly at work. Third,
the expanding rural-urban continuum is more manifest in the case of food-processing in general,
and manufacture of food products in particular. For example, in the case of food products, the
increase in the rate of growth of GVA from -2.8 per cent during 1984-85/1994-95 to 7.8 per cent
during 1994-95/2000-01, among urban-located enterprises, against the one from 0.5 per cent to
7.8 per cent among the rural-located enterprises, clearly points, ceteris paribus, towards larger
flow of agricultural products to urban processing units.
In total terms, at the present stage of India’s agricultural and industrial development, the
growth and economic health of agriculture is hugely tied with agro-industrialization, both in the
rural and urban economies. The agriculture-to-industry flows within rural areas are only a part of
the linkages. In other words, agro-industry in India need not, and should not, be seen in rural
areas alone; it is the total of agro-industry (rural- plus urban-located) that must be looked into.
Four, it is highly pleasing to see a marked improvement in the rate of growth of
employment among the agro-based industrial enterprises, both in rural and urban areas, against a
highly deteriorating scenario among the non-agro based units, again both in rural and urban
areas. That the rate of growth of employment improved from -2.1 per cent during 1984-85/1994-
95 to 7.7 per cent during 1994-95/2000-01, among the urban-located agro-based industries,
against -2.8 per cent to 3.3 per cent only among their rural counterparts, signals substantial
employment-expansion effects of expanding agricultural output and its expanding supply chain
to agro-based industry, irrespective of the latter’s locale. The rural-urban continuum is thus
authenticated through employment axis as well.
Finally, the non-agro based industries also marked varying degree of the post-1994
improvement in the growth rate of GVA and employment, in a big majority of sub-sectors, both
in the rural and urban areas. But for the precipitous post-1994 decline in ‘repair services’, the
growth rates of GVA and employment would have looked more cheering, as was the case for
33
food processing or agro-based industry as a whole. One can surmise that during the later half of
the eighties, when the green revolution technology penetrated far and wide into Indian
agriculture, there was some kind of mushrooming of repair outlets; a 4.0-5.0 per cent growth of
GVA in this sub-sector during 1984-85/1994-95 gives a nodding support to this argument.
During the nineties, most of the wayside repair outlets disappeared, and with that GVA and
employment growth rates came down rather precipitously. For example, during the post-1994
years, in rural India, the number of unorganized units engaged in repair services declined by 64.8
per cent per annum, GVA declined by 62.1 per cent and employment by 60.5 per cent.
It is worthwhile pointing out that some of the non-agro based industrial units do sustain,
in varying form and content, the tempo of agricultural growth through supply of inputs;
likewise, some of them, again in varying form and content, do cater to the consumption demands
of rural agricultural households. From the available data, we have no means of working out the
exact magnitude of such flows from industry to agriculture, on the production side, and to
agricultural households, on consumption side. Admittedly, such reverse flows from industry to
agriculture need not be gone into when the industry-promoting effects of a growing agriculture is
the subject of study. In plain words, we may better concentrate on the forward linkages and see
which segments of agro-based industry show a thriving and which others a languishing
association with growth of agriculture and its allied sectors.
In addition to looking into agriculture-industry flows under each broad (2-digit level)
category of agro-based industry ( as in Section 4.2.1), it may be highly fruitful, from policy point
of view, to conduct a more detailed analysis of the domineering food-processing segment, only
because it is the core of agro-industry, but also because reliable information on the raw material
supplies (in physical or value terms) from agriculture to such non-food processing agro-
industries as wood and wood products, paper and paper products, and, leather and leather
products, are not available. This follows now.
5.2.2 Agriculture and Food-Processing Industry
Table 13, based on a 3-digit level of product classification, informs us of the growth
performance of agro-industrial sectors, for 1984-85/1994-95 and 1994-95/2000-01, in
conjunction with the growth profile of agricultural sub-sectors. A few clarifications may better
be recorded upfront. First, while information on gross value added is available for agro-industrial

34
sectors under each of the NSSO surveys of the unorganized manufacturing, it is the value of
gross output that is made available by the Central Statistical Organization, for different
agricultural sub-sectors. Second, gross value added for manufacturing and value of output for
agricultural products are both measured in real terms. However, while the latter are at 1993-94
prices, the former are at 1980-81 prices. Third, for each sub-sector of the food-processing
industry, we identify the corresponding raw-material supplying sub-sector(s) in agriculture.
Admittedly, the exercise is not fool proof. Many of the food-processing sub-sectors may be
drawing their supplies from more than one source in agriculture. Also, the exact quantum of
inflows is not known. If individual sub-sectors in agriculture are growing unevenly, say, some
growing positively and others negatively, as is usually the case, the net effect of that on the
corresponding agro-processing sub-sector is difficult to interpret. Four, it would be naïve to
believe, and much less to say, that all post-1994 up- and down-swings in growth of GVA in
food-processing sub-sectors owe themselves to output growth in the agricultural sub-sectors.
The proportion of agricultural output that goes over for agro-processing varies from commodity
to commodity. To say the least, there are many agricultural commodities, at least substantial
proportions of some, which are straightaway consumed by agricultural households in rural India
in an unprocessed form. The upshot of all these clarifications is that the agriculture-industry
linkages, set out in Table 13, may be taken only as illustrative of the underlying realities. What
does Table 13 convey, anyway?
First, compared with the pre-1994 decade, the post-1994 years reflect a marked
improvement in the growth of agro-based industry, and a substantial slow-down in its non-agro
based counterpart; the growth rate of GVA in the former group improved from -1.5 per cent
during 1984-85/1994-95 to as high as 10.4 per cent during the post-1994 years, while, in the
latter segment, it declined from 4.4 per cent to 0.3 per cent. Happily, the growth rate
improvement was nearly equally shared by both food processing and non-food processing
segments of the agro-based industry. Still more happily, within the group of food processing
industry, the post-1994 improvement in GVA growth rates was discernible in each of its three
segments; an improvement from -9.0 per cent during 1984-85/1994-95 to 8.6 per cent during
1994-95/2000-01 for the first group of food products, from -10.6 per cent to 0.9 per cent for the
second group of food products, and from -9.0 per cent to 4.6 per cent for the beverages-tobacco
group of industries, unambiguously reflects a spectacular revival of the food processing industry
35
that was sagging during the pre-1994 years. In plain terms, the post-1994 years clearly belonged
to agro-based industry in general, and to its dominant component, namely, food-processing, in
particular. Nevertheless, as Table 13 shows, the food processing segment is not completely free
of its worry spots.
Second, out of eighteen sub-sectors under manufacture of food products, the post-1994
rate of growth of GVA worsened only in hydrogenated oils - vanaspati ghee sub-group; the
decline was rather precipitous from 6.3 per cent during 1984-85/1994-95 to -27.3 per cent during
1994-95/2000-01. Although, its close associate (manufacture of vegetable oils and fats)
continued to grow negatively, yet, it showed a marked improvement from -14.9 per cent to -3.0
per cent. It is now a piece of history that, for many years during the nineties, oilseeds remained
the Achilles heel of Indian agriculture (growth rate of oilseeds output was -1.1 per cent during
1994-95/2000-01 against 5.7 per cent during 1984-85/1994-95; cols. 2 and 3), and it clamped
substantial reduction in the output of hydrogenated oils – vanaspati ghee. Besides, the changes
in the export-import policy, especially under the auspices of the WTO obligations, and more
especially because of the nearly one-sided trade agreement with Malaysia, worked to worsen the
situation in this industry.
Likewise, out of ten sub-sectors under beverages-tobacco, three sub-groups, namely,
distilling-rectifying-blending of spirits, manufacture of malt liquors and malt, and manufacture
of pan-masala, showed varying degree of decline in the growth rate of their GVA during the
post-1994 years. The reasons for the growth reversals in these industrial groups were a mixture
of slow-downs in the production of the concerned agricultural commodities, opening of trade
frontiers, and most importantly, the exceptionally weak position of the unorganized
manufacturing enterprises in these areas vis-à-vis their organized counterparts, most obviously in
terms of technology-in-use. In 2000-01, 87.4 per cent of GVA in distilling-rectifying-blending
of spirits and 96.2 per cent in malt liquors and malt, was contributed by the organized segment;
labour productivity in the organized segment was 23 and 29 times higher than in the unorganized
segment, in these two branches of manufacturing, and this was despite the fact that labour
productivity, among the unorganized enterprises, witnessed substantial post-1994 improvement,
in both these branches (Chadha-Gulati, 2005a:23,32). As a matter of fact, the combination of a
decline in the rate of growth of GVA as well employment, on the one hand, and a substantial
36
improvement of per worker productivity, on the other, in both these branches of the unorganized
manufacturing, tends to suggest that the unorganized segment is duly responding to ‘market
dictates’, in these highly competitive branches of manufacturing. That the growth rate of GVA
in the production of country liquor, where the unorganized segment suffers no technological or
marketing disadvantages, improved sizably from -13.4 per cent during 1984-85/1994-95 to 7.4
per cent during 1994-95/2000-01, lends some weight to our argument that, under the open trade
regime, industrial realignments are occurring in due response to market dictates. It also
reinforces our contention that, at the present stage of India’s economic development, the forward
linkages between agriculture and industry do not stop with tiny and small industries in the rural
areas, or tiny and small enterprises in the unorganized segment of manufacturing. Agricultural
raw materials now go all over the agro-processing industrial continuum.
Third, the post-1994 pattern for the rate of growth of employment is pretty much similar
to the one for GVA. The total of agro-based industry, and its food and non-food processing
components, show a substantial step-up in the rate of growth of employment, against a
substantial drop in respect of the non-agro based group of industries. Nevertheless, the cheering
employment scenario for groups and sub-groups of food-processing industry cannot hide the fact
that there are a few weak spots right in their midst. The weak spots, on the employment side, are
summarily the same as already identified via the post-1994 GVA growth behaviour. The only
additional branch of food processing, where growth rate of employment sharply worsened from
-4.9 per cent during 1984-85/1994-95 to -21.6 per cent during 1994-95/2000-01 is processing-
canning-preserving of fish, crustacean and similar foods. Here too, the organized segment has a
three-fourth share of GVA, and the unorganized enterprises engaged in these activities have to
contend with several operational infirmities (ibid: 32). Once again, the combination of a sharp
post-1994 decline in the rate of growth of employment against a formidable increase in the rate
of growth of per worker productivity, indicates that this branch of unorganized food processing
is also rationalizing its production structure, in due response to market compulsions, especially
those in the export sector.
Finally, a highly mingled picture emerges between the rate of output growth of
agricultural commodities or commodity-groups and the rate of growth of GVA in individual
food processing sub-sectors. Four scenarios have clearly been at work. First, improved post-1994
37
growth rate of GVA in canning and preservation of fruits and vegetables, curing-roasting-
grinding-blending of coffee, manufacture of prepared animal/bird feeds, and manufacture of
starch, under food products, and manufacture of soft drinks and syrups, under beverages-
tobacco, is clearly backed by a higher growth rate of agricultural output. A marked hike-up in the
rate of growth of GVA in the manufacture of dairy products, processing-canning-preserving of
fish, grain milling, and processing and blending of tea, against the rate of growth of output of the
backing agricultural commodities remaining more or the less the same during 1994-95/2000-01,
compared with the pre-1994 decade, throws up the second scenario.
The third scenario encompasses the slaughtering-preparation-preservation of meat,
manufacturing and refining of sugar, production of indigenous sugar, boora, khandsari and gur,
and manufacture of sugar confectionery, where the rate of growth of GVA has improved, in
varying degree, during the post-1994, against a varying degree of decline in the rate of growth of
output on the agricultural side. Clearly, many of the food-processing industries, under these three
scenarios, involve agricultural commodities, for example, fruits, vegetables, milk, food-grains,
fish, etc., where a steadily increasing proportion of output has started going over for primary or
secondary processing, irrespective of whether the output growth, on a year-to-year basis, is
slightly higher or lower. The growing income of people in general, and of the urban middle-class
in particular, and the steadily changing life style of people, partly because of increasing hygienic
standards and health consciousness and partly because of aggressive salesmanship on popular
media channels, are pushing up the demand for processed food. The increasing export of
processed food products, most ostensibly through a series of government supported
programmes, is adding its share to the higher pitch of GVA growth in the concerned food
processing industries.
The increase in the incidence of food processing is unevenly distributed among the states.
According to an FICCI estimate, at present, nearly 25.0 per cent of fruit, vegetables and milk is
processed in the North Region, dominated by the green revolution states of Punjab and Haryana,
against around 10.0 per cent at the national level. The North has shown a much higher growth in
terms of the consumption of processed food, fruit and milk products. The trend of consumption
of bread, biscuits, canned juices, packed milk and numerous milk products, besides processed
vegetables, even in small towns, is significantly higher in North India than in the Southern or
38
North-Eastern Regions (The Economic Times, Dec.22, 2005:2). We must hasten to add that in
spite of the recent welcome changes in food processing industry, India is still way behind the
western world and many other developing economies in terms of agricultural produce going in
for primary or secondary processing (Bijwe, 2004).
The substantial drop in the rate of growth of GVA in distilling, rectifying and blending of
spirits, and manufacture of malt liquors and malt, against a mixed growth performance on the
agricultural front, and a highly disparate growth pattern of diverse tobacco-based food-
processing activities, against a decline in the rate of growth of tobacco output, leads us to the
fourth, and confusing, scenario. Why, and for what reasons, the rate of growth of GVA went up
during the post-1994 years in manufacture of wines and production of country liquor, and went
down in distilling, rectifying and blending of spirits and manufacture of malt liquors and malt,
when some of the supporting agricultural commodity-groups registered higher growth of their
output while others did the reverse? Similarly, what were the reasons for revival of GVA growth
rate in manufacture of cigars, cigarettes, cheroots and cigarette tobacco, or a spectacular
improvement in the manufacture of snuff, zarda, chewing tobacco and other tobacco, in the face
of the declining domestic output of tobacco? Most likely, the tiny and small enterprises that
overwhelm the house of unorganized manufacturing are giving way to bigger units in the
organized segment of manufacturing. Perhaps, the forward agriculture-industry linkages in these
food-processing branches, as also in some others, are of a more complex nature than what we are
attempting to see in Table 13. Possibly, food habits are also changing. These are the questions
that deserve to be taken up separately for a more detailed analysis.
VI Concluding Observations
Looking back into the growth profile of Indian agriculture, and its linkages with the rural
industrial sector, it is clear that the nature, content and the geographical spread of these linkages
have undergone tremendous changes over time. To say the least, the rural industrial sector today is
remarkably different than what it was, say, thirty years back. Structurally, it is no more a bunch of
traditional cottage enterprises alone; nor is it dominated any more by rural crafts and house-hold
based tiny agro-processing enterprises. The rural industry today consists of two distinct segments:
traditional and modern. Village industries, khadi, handloom, sericulture, handicrafts and coir make
up the bunch of traditional segment and small scale industries and powerloom come under the

39
modern segment. By any objective yardstick, the traditional segment has generally acquitted itself
well in fulfilling its avowed objective of providing employment to the expanding army of rural
labour-force. In the context of wide-spread rural poverty, especially that occasioned by the rising
incidence of rural landlessness and marginalization of land holdings, on the one hand, and under- (if
not un-) employment of a big mass of rural workforce, on the other, it has not been a trivial
development. But then, productivity improvement, for making a decisive dent into rural poverty,
has generally been missing. This was largely so because employment growth closely chased, and in
some sub-sectors (most notably, the khadi and handloom sub-sectors), often exceeded output
growth. The periodic up- and down-swings in production has been another noticeable feature of
some among the traditional industry groups.
What ails the traditional rural industries? The general list of problems is well known, and
has been a matter of debate for a long time. Lack of adequate and timely availability of credit,
non-availability and/or scarcity of raw materials and other inputs such as power, road and
transport network and other infrastructure, unfriendly rules and regulations, wide-spread
corruption, restricted market outlets, etc., come under one set of problems. A weak technological
base and lack of concern for quality control and product development make the second set of
problems. Limited product market, largely confined to the weaker sections of the rural
community who themselves suffer from unpredictable fluctuations in their employment and
earnings, poses another formidable problem. A poor quality of the work-force is perhaps the
most stumbling constraint that the rural industry faces today; the most appalling story is unfolded
by the wage-paid workers who are, by and large, a bunch of un- or semi-educated, untrained and
unorganized persons.
Be that as it may, what kind of linkages have been operating between agriculture and
industry? One can look into these linkages at different levels. However, none of them can claim to
neatly caricaturize the total story of the linkages. Data limitations are severe indeed. Nevertheless,
we have explored three alternative ways of looking at these linkages, one in relation to the bunch of
village and small industries (VSI), second in relation to the group of small scale industries (which
reflect, in a large measure, ‘modern’ industrial activities in the VSI sector, and third in relation to
the domineering unorganized segment of agro-processing manufacturing. In our opinion, the three
alternative exercises do reflect the empirical realities fairly adequately, and throw up lots of insights.
40
Admittedly, much more needs to be done, especially for unfolding the spatial dimensions of
agriculture’s linkages with the rest of the economy. Going by what we have done, we recapitulate
here the broad trends emerging under each of the three empirical exercises. First, agriculture’s
linkages with the VSI Sector.
It must be said, first and foremost, that agricultural growth rate itself witnessed a decline in
recent years. The pinch of this decline has been felt, in varying degree, by all branches of VSI
sector. The severest setback is faced by the group of traditional industries, most noticeably khadi,
handloom, sericulture and handicrafts. Some impact, albeit marginal and qualitatively much
different than in relation to other VSI sub-sectors, was felt by the modern industrial activities too.
Inasmuch as the growth setbacks are discernible for rural industrial activities that supply inputs to
agriculture (e.g. small scale and village industries) just as it is so for industries supplying consumer
goods (e.g. khadi, handloom, power-loom, small scale industries, etc.), we have reasons to say that
the bunch of VSI industries, especially the traditional segment among them, could not sustain
themselves against the backdrop of a drooping agriculture. A down-swing in agriculture has hit
them hard.
Separately, a very smooth relationship is observed between GDP in the primary sector
(surrogating the growth profile of agriculture) and GDP originating in the group of small scale
industries ( surrogating the total of rural industrial base). To the extent that the assumed
approximations, both in respect of agriculture and rural industry, may raise their own conceptual
and empirical questions, the extremely high correlation coefficients observed between GDPssi and
GDPpry may be taken as a broad reflection, and confirmation, of the impact that agricultural growth
makes on the expansion of rural industrial activities. Many other intertwining factors, most
ostensibly how much of the small scale industries are really rural-located, or, how much of the
growth profile of the small scale industries owes itself to rural demand, can not be brought in at this
stage. It is for sure, however, that the future dynamics of agricultural production and the production
technology-in-use would generate demand for inputs that can be more readily supplied by the set of
‘modern small scale’ industries. It is equally sure that the changing consumption habits of the rural
population, most ostensibly, under the impact of expanding educational networks, the deepening of
globalization of the Indian economy and exposure to better and more secure consumption goods,
would bring the small scale industries closer to the consumption requirements of agricultural
41
households. In sum, among the whole set of village and small scale industries, the future of small
scale ‘modern’ industrial enterprises is more secure, if only agriculture grows on a sustained basis,
and rural household incomes witness a steady expansion.
We must confess that all growth up- and down-swings witnessed among the VSI sub-sectors
cannot be attributed solely to agricultural up- and down-slides. Some of these growth swings owe
themselves to urban incomes and demands, especially in the case of khadi, sericulture, handicrafts,
under the traditional sector, and small scale industries and powerloom, under the modern sector.
Again, demand switch-over on the consumption side, say, from handloom to powerloom products,
or from village industries to small scale industries, within the rural areas themselves, are not ruled
out. Finally, the increasing inflow of urban as well as imported products, especially on the
consumption side, may also be making inroads into the growth performance of rural industries,
irrespective of whether the agriculture-rural industry linkages are growing or shrinking.
Analyzing agriculture’s forward linkages with the most dominant segment of rural
industry, i.e., unorganized agro-based industry, we discover that such linkages do not stop with
tiny and small enterprises in rural areas alone. Agricultural raw materials go over, in a big way,
to urban agro-processing units also. To work out the agriculture-industry linkages, in a more
comprehensive, and realistic manner, we go by rural-urban industrial continuum, rather than
rural industry alone. Also, food processing, which is more closely, and more crucially, associated
with agricultural production, and livelihood stakes of a preponderant majority of cultivating
households, becomes the focus of our in-depth analysis that compares the situation during 1994-
95/2000-01 with that during 1984-85/1994-95, based on a 3-digit level of product classification.
About the relationship between the rate of growth of agricultural output and that of gross
value added (GVA) in individual food processing sub-sectors, four scenarios stand out clearly.
The first scenario is a combination of improved growth rate of GVA in canning and preservation
of fruits and vegetables, curing-roasting-grinding-blending of coffee, manufacture of prepared
animal/bird feeds, and manufacture of starch, under food products, and manufacture of soft
drinks and syrups, under beverages-tobacco, and a higher growth rate of agricultural output,
during 1994-95/2000-01, compared with 1984-85/1994-95. A marked hike-up in the rate of
growth of GVA in the manufacture of dairy products, processing-canning-preserving of fish,
grain milling, and processing and blending of tea, against a near constant rate of growth of output

42
of the backing agricultural commodities, throws up the second scenario. The third scenario
shows a varying degree of improvement in the rate of growth of GVA in slaughtering-
preparation-preservation of meat, manufacturing and refining of sugar, production of indigenous
sugar, boora, khandsari and gur, and manufacture of sugar confectionery, in the face of a varying
degree of decline in the rate of growth of output on the agricultural side.
Clearly, many of the food-processing industries, under these three scenarios, involve
agricultural commodities, for example, fruits, vegetables, milk, food-grains, fish, etc., where a
steadily increasing proportion of output has started going over for primary or secondary
processing, irrespective of whether their output growth, on a year-to-year basis, is slightly higher
or lower. The growing income of people in general, and of the urban middle-class in particular,
and the steadily changing life style of people, partly because of increasing hygienic standards
and health consciousness and partly because of aggressive salesmanship on popular media
channels, are pushing up the demand for processed food. The increasing export of processed
food products, most ostensibly through a series of government supported programmes, is adding
its share to the higher pitch of GVA growth in the concerned food processing industries.
The fourth, and a-not-so-easy-to-interpret, scenario is a mixture of a substantial drop in
the rate of growth of GVA in distilling, rectifying and blending of spirits, and manufacture of
malt liquors and malt, against a mixed growth performance of the concerned agricultural
commodities, on the one hand, and a highly disparate growth pattern of diverse tobacco-based
food-processing activities, against a decline in the rate of growth of tobacco output, on the other.
Why, and for what reasons, the rate of growth of GVA went up during the post-1994 years in
manufacture of wines and production of country liquor, and went down in distilling, rectifying
and blending of spirits and manufacture of malt liquors and malt, when some of the supporting
agricultural commodity-groups registered higher growth of their output while others did the
reverse? Similarly, what were the reasons for revival of GVA growth rate in manufacture of
cigars, cigarettes, cheroots and cigarette tobacco, or a spectacular improvement in the
manufacture of snuff, zarda, chewing tobacco and other tobacco, in the face of the declining
domestic output of tobacco? Most likely, the tiny and small enterprises that overwhelm the
house of unorganized manufacturing are giving way to bigger units in the organized segment in
some of these manufacturing branches. Perhaps, the forward agriculture-industry linkages in
43
these food-processing branches, as also in some others, are of a more complex nature than what
we are have attempted to see in terms of the rate of growth of a few specified agricultural
commodities. Possibly, we have not looked into the full dynamics of agro-processing! Could
there be such a mechanical transfer of agricultural commodities to agro-processing industry?
What about the market, institutional and technological constraints of agro-industry itself? After
all, agro-industry does also operate under a policy framework, and it is possible that, in spite of a
robust growth of the incoming agricultural commodities, the industry faces an unfriendly policy
regime that does not allow it to ‘pick up all that agriculture can deliver’. In fact, many more
questions can be raised. The moot point, however, is that many more dimensions need to be
brought in to unravel these opposing trends.
For paucity of space, we cannot go into the whole lot of problems confronting agro-
industry. Nevertheless, a few conjectures may better be raised. In our view, the most restricting
feature of India’s agro-industry in general, and food-processing in particular, is the low level of
labour productivity among the unorganized production units which overwhelmingly dominate
the rural manufacturing scenario. Productivity improvement should thus be an issue of utmost
urgency. Under institutional constraints, one may look into the legal framework that restricts
access to capital and product market. Does it come in the way of technological improvement by
small and tiny enterprises that overwhelmingly constitute the group of agro-industries? Is there a
tailor-made technology policy for the tiny sector? Does our educational and training system help
or constrain the growth of rural agro-industry? In what way, small and tiny agro-industrial
enterprises can become effective partners in recent export-promoting initiatives, such as the
establishment of agro-export zones? What needs to be done to bring agro-industrial products,
especially those produced by tiny/small units, at par with international safety and quality
standards? Will contract farming help small farmers or promote agro-industrialization?
There are no ready-made answers to these questions. Many things need to be done on
different fronts. Happily, as elaborated under Section III, some initiatives are already afoot to
lend dynamism to food processing industry as also to effect some improvements in the concerned
sub-sectors of agriculture. For example, the recently launched multi-crore National Horticultural
Mission may boost the growth of food processing through on-farm crop diversification. The
launching of venture capital scheme for the dairy and poultry sectors may also add their share to

44
a healthy growth of the concerned food processing activities. Again, efforts to augment the
growth of processable varieties of fruit and vegetables may lend some fillip to the industry. Yet
again, when the Food Safety and Standards Bill, recently tabled in the Parliament, is passed, it
will do away with the nine existing laws and modify seven others. The Bill aims at making food
laws industry-friendly and marks a shift from the present ‘regulatory regime’ to a ‘self-
compliance’ dispensation. Obviously, much more needs to be done on the side of agriculture.
In a separate study, we go, albeit sketchily, beyond the linkages between agriculture and
agro-manufacturing (Chadha, 2009: 443-47). We look at agriculture in relation to the rest of the
economy (which, in our context, is to be euphemistically interpreted as the total of rural non-
farm sector). It is essential to look into the linkages at this level of aggregation since, in recent
years, agriculture’s linkages have been growing with many non-manufacturing activities in the
secondary sector and with most parts of the tertiary sector. Our analysis, based on state-level
data on net domestic product, duly confirms that strong linkages have been operating between
farm and non-farm incomes, during the eighties and the nineties. The crucial role that Indian
agriculture has been playing in the expansion of the rural non-farm sector, in general, and rural
industry, in particular, is duly authenticated, for each of the seventeen major states. The steadily
changing composition of agricultural inputs and services to absorb the requirements of improved
technology, to newer regions and crop enterprises, on the production side, and the steadily
diversifying demand for consumption goods and services, on the consumption side, together
reflect stronger backward linkages. Likewise, the rising quantum of agricultural output,
especially the steadily expanding cultivation of commercial crops, has strengthened the forward
linkages between agriculture and industry, most noticeably a wide variety of food-processing
activities.
B I B L I O G R A P H Y
Bijwe, Sujata, “Food Processing: A Sunrise Industry in India”, Economic Digest, Maharashtra Economic Development Council, Mumbai, August 29, 2004. Chadha, G.K., Non-farm Sector in India’s Rural Economy: Policy, Performance and Growth Prospects, VRF Series, Institute of Developing Economies, Tokyo, October 1992. --------------, “Rural Non-farm Employment: An Assessment of Recent Trends”, Indian Journal of Labour Economics, Vol. 35(3), 1993.
45
G.K. Chadha, The Rural Industry in India and China, an on-going project jointly sponsored by JNU,New Delhi and National Institute of Working Life, Stockholm, 2000 ----------------, “Rural Non-Farm Sector in Indian Economy: Growth, Challenges and Future Direction”, Paper read at JNU-IFPRI Workshop on A Comparative Study of Economic and Agricultural Refors In China and India, March 25-28, 2003. --------------, “ Agriculture and Rural Industrialization in India: Recent Development and Future Choices”, in India: Perspectives on Equitable Development by S.Mahendra Dev & N. Chandrasekhara Rao, Academic Foundation, New Delhi, 2009. --------------, and Sahu, P.P., “ Small Scale Agro-Industry in India: Low Productivity is its Achilles’ Heel” (jointly with P.P. Sahu) in Indian Agriculture in the New Millennium: Changing Perceptions and Development Policy, N.A. Majumdar and Uma Kapila (eds), Academic Foundation, New Delhi, 2005. ------------- and Gulati Ashok,” Performance of India’s Agro-Industry in Recent Years: Emerging Issues and Prospects”, IFPRI Discussion Paper, December 2005a. Govt. of India, Tables with Notes on Survey of Unorganized Manufacture: Non-Directory Establishments and Own-Account Enterprises, July 1984- June 1985, Part-1, All-India, NSS Report No.363/1, June 1989. ---------------, SARVEKSHANA , Vol. XIV, Nos. 1 & 2, October-December 1990. --------------, State-wise and Crop-wise Estimates of Value of Output from Agriculture 1980-81/1990-91, Central Statistical Organization, New Delhi, August 1996. ---------------, Unorganised Manufacturing Sector in India: Its Size, Employment and Some Key Results, NSS Report No. 433, NSSO, August 1998. ------------, Household Consumption Expenditure in India: 1999-2000, Key Results, NSS 55th Round (July 1999 – June 2000) NSS Report No. 458, NSSO, December 2000. ------------, National Accounts Statistics Back Series 1950-51/1992-93, Central Statistical Organisation, New Delhi, April 2001. ------------, Indian Planning Experience: A Statistical Profile, Planning Commission, January 2001a. -----------, Unorganized Manufacturing Sector in India- 2000-01: Characteristics of Enterprises, NSS Report No. 478, NSSO, New Delhi, 2002. Govt. of India, Statewise Estimates of Value of Output from Agriculture and Livestock (1990-91 to 2001-02), Central Statistical Organization, New Delhi, 2004. ---------------, Level and Pattern of Consumer Expenditure in India, 2004-05, NSS 61st Round (July 2004 – June 2005), NSSO, August 2005. --------------, Economic Survey 2004-05, Ministry of Finance, 2005a. --------------, National Accounts Statistics 2005, Central Statistical Organization, 2005b.

46
Govt. of India, Employment and Unemployment in India, 2004-05 (Part II), NSS 61st Round (July 2004 – June 2005), NSSO, New Delhi, September 2006. -------------, Annual Report 2005-2006, Ministry of Agro and Rural Industries, New Delhi, 2006a. --------------, National Accounts Statistics 2008, Central Statistical Organization, May 2008a. -------------. State-wise Estimates of Value of Output from Agriculture and Allied Activities with New Base Year 1999-2000 (1999-2000 to 2005-06), CSO, May 2008b. -------------, Agricultural Statistics at a Glance 2008, Ministry of Agriculture, Nov. 2008c. -------------, Economic Survey 2009-10, Ministry of Finance., 2010 -------------, Statistical Abstract India (for various years), Central Statistical Organization, New Delhi. -------------, Five Year Plans ( for various years), Planning Commission, New Delhi. -------------, Annual Plans (for various years), Planning Commission, New Delhi. Hazell Peter B.R. and Haggblade Stven, “ Rural-Urban Growth Linkages in India”, Indian Journal of Agricultural Economics, 46/4, Oct.-Dec. 1991. Hussain Abid, “ Small Enterprises – Protection to Promotion” in Bibek Debroy and Parth Shah (eds.) Agenda for Change, RGICS, New Delhi, 1998. India Today, “Indian Food Processing Comes of Age”, India Today, April 5, 2010. National Centre for Agricultural Planning and Policy, Strategies and Options for Increasing and Sustaining Fisheries and Acqaculture Production to Benefit Poor Households of India, ICAR, New Delhi, 2004. Reserve Bank of India, Handbook of Statistics on the Indian Economy: 2003-04, RBI, Mumbai, Aug. 2004. ----------------, Handbook of Statistics on the Indian Economy 2008-09, RBI, Mumbai, September 2009. The Economics Times , November 3, 2000 and December 22, 2005. Vaidyanathan, A., “ Labour Use in Rural India: A Study of Spatial and Temporal Variations”, Economic and Political Weekly, No. 52, 1986.


