Distributional Impacts of Agricultural Growth in · PDF fileDistributional Impacts of...
27
The Pakistan Development Review 42 : 3 (Autumn 2003) pp. 249–275 Distributional Impacts of Agricultural Growth in Pakistan: A Multiplier Analysis PAUL DOROSH, MUHAMMAD KHAN NIAZI, and HINA NAZLI * In spite of substantial growth in agricultural GDP in the 1990s, rural poverty rates in Pakistan did not decline. This paper explores the reasons for this lack of correlation between increases in agricultural production and poverty reduction through an analysis of growth linkages using a 2001-02 Social Accounting Matrix (SAM)-based semi-input- output model. Model simulations indicate that expansion of traditional crop agriculture can significantly benefit rural poor farmers. However, because of skewed distribution of land and earnings from land, landless agricultural labourers and the rural non-farm poor (who, together, account for 61 percent of the rural poor) do not benefit directly from growth in the crop sector. In the absence of a change in the structure of rural incomes and employment, further measures will likely be needed for rapid poverty reduction in Pakistan, including greater efforts to boost the livestock sector, expansion of the rural non-farm economy (in addition to agricultural growth-induced linkage effects), and targeted interventions to the poorest rural households. I. INTRODUCTION Numerous studies have shown a link between agricultural productivity growth and poverty reduction through reductions in food prices and growth in employment in both the agricultural and the rural non-agricultural sectors [Ahluwalia (1978); Mellor (1976, 1978); Hazell and Ramasamy (1991)]. Moreover, econometric evidence suggests that agricultural growth is more effective in reducing rural poverty than is industrial growth, though this relationship may not hold when ownership of land is highly skewed [Datt and Ravallion (1998); Timmer (1997) and Thirtle (2001)]. The experience of Pakistan in the 1980s fits this general pattern, as steady growth in agricultural GDP coincided with significant declines in rural poverty. However, in spite of substantial growth in agricultural GDP in the 1990s, rural Paul Dorosh is Senior Economist, South Asia Rural Division, World Bank, Washington, D. C. Muhammad Khan Niazi and Hina Nazli are consultants with Innovative Development Strategies, Islamabad, Pakistan. Authors’ Note: Steven Haggblade, Sohail J. Malik, and John Mellor provided helpful comments on earlier drafts of this paper. Any errors or omissions are solely the responsibility of the authors. Likewise, the views expressed in the paper are those of the authors and do not necessarily reflect the views of the World Bank, its executive directors, or the countries they represent.
Transcript of Distributional Impacts of Agricultural Growth in · PDF fileDistributional Impacts of...
The Pakistan Development Review 42 : 3 (Autumn 2003) pp. 249–275
Distributional Impacts of Agricultural Growth in Pakistan: A Multiplier Analysis
PAUL DOROSH, MUHAMMAD KHAN NIAZI, and HINA NAZLI*
In spite of substantial growth in agricultural GDP in the 1990s, rural poverty rates
in Pakistan did not decline. This paper explores the reasons for this lack of correlation between increases in agricultural production and poverty reduction through an analysis of growth linkages using a 2001-02 Social Accounting Matrix (SAM)-based semi-input-output model. Model simulations indicate that expansion of traditional crop agriculture can significantly benefit rural poor farmers. However, because of skewed distribution of land and earnings from land, landless agricultural labourers and the rural non-farm poor (who, together, account for 61 percent of the rural poor) do not benefit directly from growth in the crop sector. In the absence of a change in the structure of rural incomes and employment, further measures will likely be needed for rapid poverty reduction in Pakistan, including greater efforts to boost the livestock sector, expansion of the rural non-farm economy (in addition to agricultural growth-induced linkage effects), and targeted interventions to the poorest rural households.
I. INTRODUCTION
Numerous studies have shown a link between agricultural productivity growth and poverty reduction through reductions in food prices and growth in employment in both the agricultural and the rural non-agricultural sectors [Ahluwalia (1978); Mellor (1976, 1978); Hazell and Ramasamy (1991)]. Moreover, econometric evidence suggests that agricultural growth is more effective in reducing rural poverty than is industrial growth, though this relationship may not hold when ownership of land is highly skewed [Datt and Ravallion (1998); Timmer (1997) and Thirtle (2001)].
The experience of Pakistan in the 1980s fits this general pattern, as steady growth in agricultural GDP coincided with significant declines in rural poverty. However, in spite of substantial growth in agricultural GDP in the 1990s, rural
Paul Dorosh is Senior Economist, South Asia Rural Division, World Bank, Washington, D. C. Muhammad Khan Niazi and Hina Nazli are consultants with Innovative Development Strategies, Islamabad, Pakistan.
Authors’ Note: Steven Haggblade, Sohail J. Malik, and John Mellor provided helpful comments on earlier drafts of this paper. Any errors or omissions are solely the responsibility of the authors. Likewise, the views expressed in the paper are those of the authors and do not necessarily reflect the views of the World Bank, its executive directors, or the countries they represent.
Dorosh, Niazi, and Nazli 250
poverty rates did not decline over the decade as a whole. This disconnect between agricultural growth and rural poverty reduction raises several questions: Why did rural poverty not decline in the 1990s? Are growth multiplier effects on rural non-agricultural employment and income no longer important? How much can changes in agricultural production as a result of changes in land tenure, access to credit, and access to water be expected to raise incomes of the rural poor? And finally, what are the implications for the rural development strategy?
This paper explores these issues, focusing on the structure of rural household incomes as captured in an analysis of the impacts of agricultural growth linkages. Section II discusses historical patterns of agricultural growth and the structure of household incomes. Section III describes the Social Accounting Matrix (SAM)- based semi-input-output model used in the analysis. Model simulations results of the impacts of increased agricultural production and selected reforms in land tenure and farmer credit are covered in Section IV. Section V presents conclusions and implications for rural poverty reduction strategies.
II. THE AGRICULTURAL GROWTH—RURAL POVERTY PARADOX OF THE 1990S
Pakistan’s agricultural sector has enjoyed steady growth for most of the last three decades, with agricultural GDP increasing by an average of 4.1 percent per year from 1975 to 2000. Green revolution technology of improved seeds, irrigation, and increased fertiliser use spurred rapid growth in crop agriculture (especially wheat and rice) beginning in the later 1960s. Livestock production outpaced the rapid growth in crop agriculture, with value-added increasing by 5.3 percent per year from 1975 to 2000.
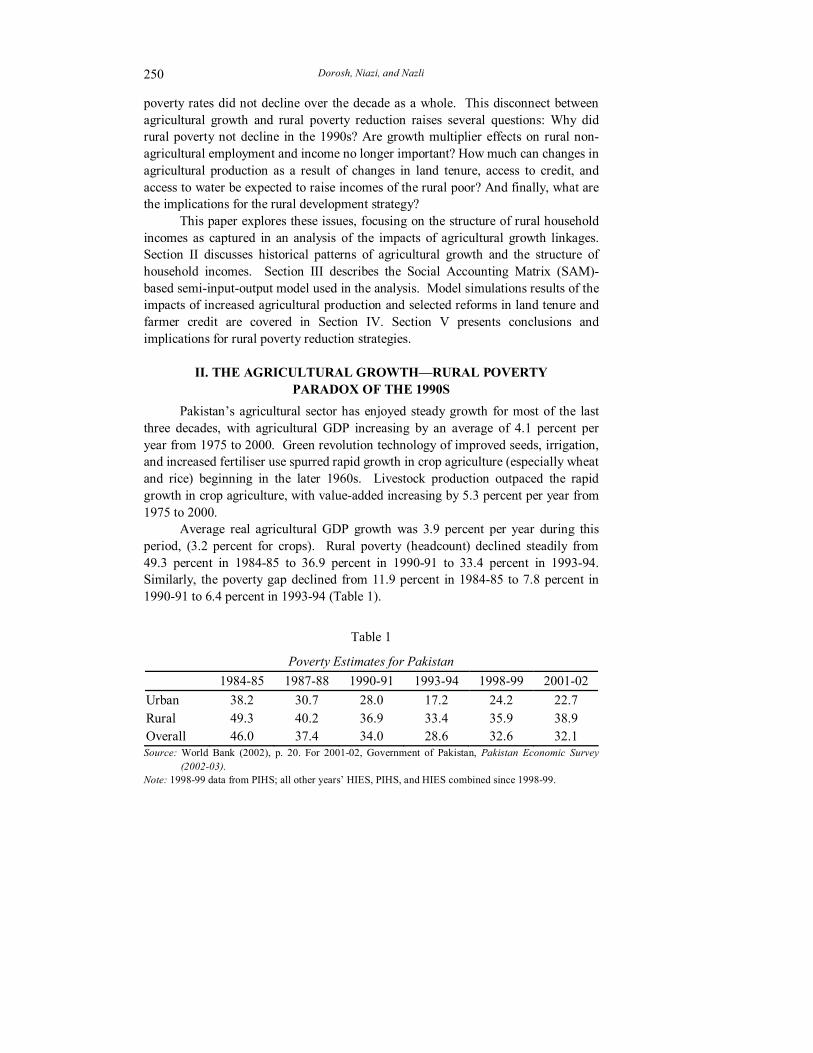
Average real agricultural GDP growth was 3.9 percent per year during this period, (3.2 percent for crops). Rural poverty (headcount) declined steadily from 49.3 percent in 1984-85 to 36.9 percent in 1990-91 to 33.4 percent in 1993-94. Similarly, the poverty gap declined from 11.9 percent in 1984-85 to 7.8 percent in 1990-91 to 6.4 percent in 1993-94 (Table 1).
Table 1
Poverty Estimates for Pakistan 1984-85 1987-88 1990-91 1993-94 1998-99 2001-02 Urban 38.2 30.7 28.0 17.2 24.2 22.7 Rural 49.3 40.2 36.9 33.4 35.9 38.9 Overall 46.0 37.4 34.0 28.6 32.6 32.1 Source: World Bank (2002), p. 20. For 2001-02, Government of Pakistan, Pakistan Economic Survey
(2002-03). Note: 1998-99 data from PIHS; all other years’ HIES, PIHS, and HIES combined since 1998-99.

Distributional Impacts of Agricultural Growth 251
For the decade of the 1990s overall, however, rural poverty rates stagnated in
spite of continued agricultural growth. Real agricultural GDP rose by 4.6 percent per annum, yet the percentage of rural poor living below the poverty line remained essentially unchanged between 1990-91 (36.9 percent) and 1998-99 (35.9 percent), and even rose to 38.9 percent in 2001-02, a drought year.1
With substantial growth in agricultural earnings, what explains the lack of progress in reducing rural poverty in the 1990s? Part of the explanation for the paradox is that agricultural growth rates appear to have been overstated because of an upward adjustment to livestock population numbers used in the 1995-96 national accounts estimates that was not used to revise livestock value-added in the previous years. Adjusting for this change in the base estimates of livestock reduces per capita real agricultural GDP growth in the 1990s from 4.5 percent to 3.1 percent per capita (from 2.0 to 0.6 percent, in per capita terms) [Malik (2003)].
A second factor is an increase in the real consumer prices of major staples since the mid-1990s. Real prices of wheat, wheat flour, and basmati rice fell steadily from the late 1970s to the early 1990s, raising real incomes of net food purchasers. For example, real whole grain wheat prices fell by 21 percent between 1975–79 and 1990–94; real wheat flour prices fell by 10 percent in the same period. After 1996, however, real prices of these commodities rose, so that real wheat and wheat flour prices in 2000–03 averaged 14 and 11 percent higher, respectively, than in 1990–04. (Figure 1)
Fig. 1. Real Prices of Major Food Grains in Pakistan, 1970-2003.
0.60
0.70
0.80
0.90
1.00
1.10
1.20
1.30
1970
1973
1976
1979
1982
1985
1988
1991
1994
1997
2000
2003
1970
= 1
00
Wheat Wheat flr 3 Commod
1Survey evidence suggests that incomes and the level of poverty (headcount) vary substantially
across regions of Pakistan, though problems of sample size and sample design prevent definitive conclusions. World Bank (2002) reports rural poverty headcounts for 1998-99 that vary little between Punjab (34.7 percent) and Sindh (37.1 percent), but are higher in the NWFP (46.5 percent).
Wheat Wheat flr. Commod.
Dorosh, Niazi, and Nazli 252
Structure of Household Incomes Slow actual overall agricultural growth and a rise in the prices of major
staples may be sufficient to explain the low correlation between agricultural growth and rural poverty reduction in Pakistan in the 1990s. In addition, the skewed structure of ownership and access to factors of production in rural Pakistan, which are in part due to distortions in factor markets, may also have contributed to the disconnect between agricultural growth and poverty reduction in the 1990s. Moreover, these structural factors have important implications for future efforts to reduce rural poverty.
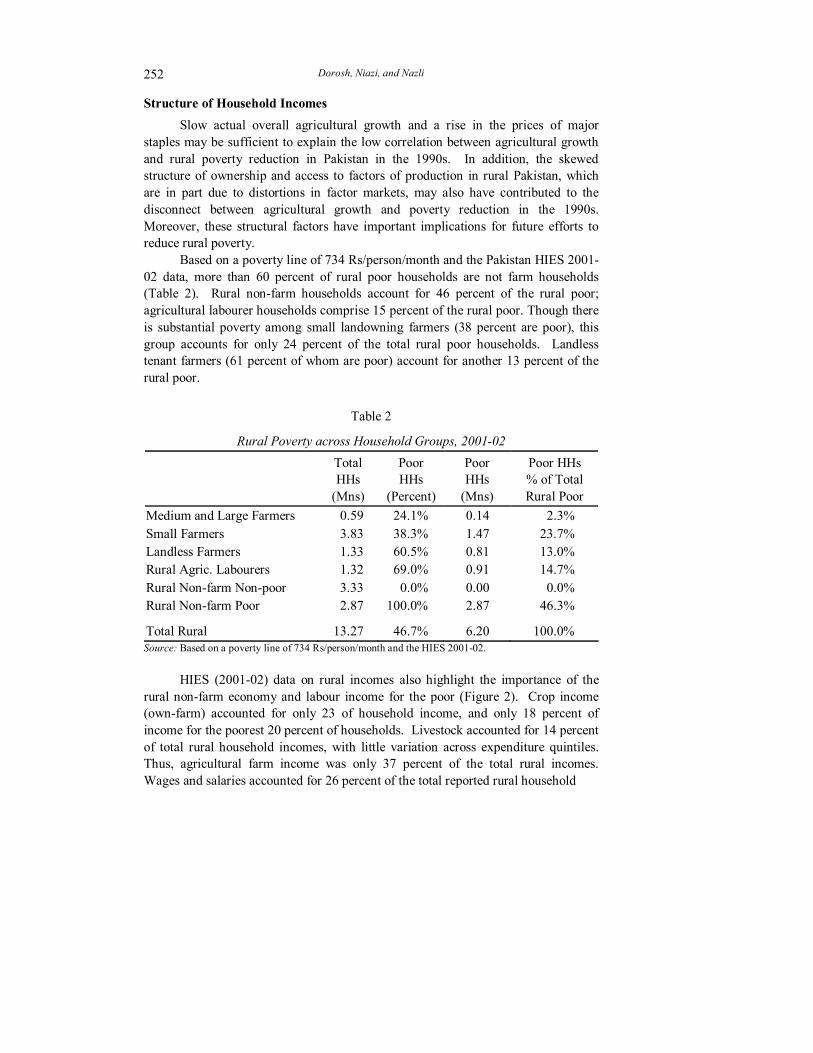
Based on a poverty line of 734 Rs/person/month and the Pakistan HIES 2001-02 data, more than 60 percent of rural poor households are not farm households (Table 2). Rural non-farm households account for 46 percent of the rural poor; agricultural labourer households comprise 15 percent of the rural poor. Though there is substantial poverty among small landowning farmers (38 percent are poor), this group accounts for only 24 percent of the total rural poor households. Landless tenant farmers (61 percent of whom are poor) account for another 13 percent of the rural poor.
Table 2
Rural Poverty across Household Groups, 2001-02
Total HHs
(Mns)
Poor HHs
(Percent)
Poor HHs
(Mns)
Poor HHs % of Total Rural Poor
Medium and Large Farmers 0.59 24.1% 0.14 2.3% Small Farmers 3.83 38.3% 1.47 23.7% Landless Farmers 1.33 60.5% 0.81 13.0% Rural Agric. Labourers 1.32 69.0% 0.91 14.7% Rural Non-farm Non-poor 3.33 0.0% 0.00 0.0% Rural Non-farm Poor 2.87 100.0% 2.87 46.3%
Total Rural 13.27 46.7% 6.20 100.0% Source: Based on a poverty line of 734 Rs/person/month and the HIES 2001-02.
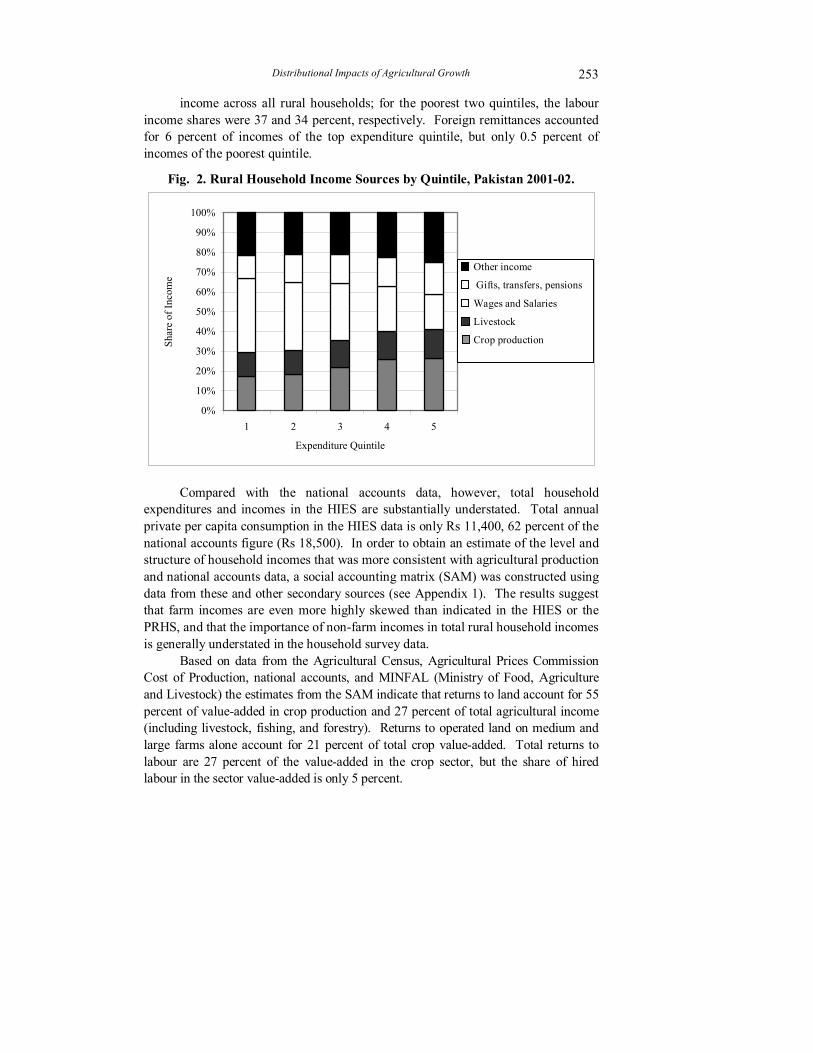
HIES (2001-02) data on rural incomes also highlight the importance of the rural non-farm economy and labour income for the poor (Figure 2). Crop income (own-farm) accounted for only 23 of household income, and only 18 percent of income for the poorest 20 percent of households. Livestock accounted for 14 percent of total rural household incomes, with little variation across expenditure quintiles. Thus, agricultural farm income was only 37 percent of the total rural incomes. Wages and salaries accounted for 26 percent of the total reported rural household
Distributional Impacts of Agricultural Growth 253
income across all rural households; for the poorest two quintiles, the labour income shares were 37 and 34 percent, respectively. Foreign remittances accounted for 6 percent of incomes of the top expenditure quintile, but only 0.5 percent of incomes of the poorest quintile.
Fig. 2. Rural Household Income Sources by Quintile, Pakistan 2001-02.
0%
10%
20%
30%
40%
50%
60%
70%
80%
90%
100%
1 2 3 4 5
Expenditure Quintile
Shar
e of
Inco
me Other income
Gifts, transfers, pensionsWages & Salaries Livestock Crop Production
Compared with the national accounts data, however, total household
expenditures and incomes in the HIES are substantially understated. Total annual private per capita consumption in the HIES data is only Rs 11,400, 62 percent of the national accounts figure (Rs 18,500). In order to obtain an estimate of the level and structure of household incomes that was more consistent with agricultural production and national accounts data, a social accounting matrix (SAM) was constructed using data from these and other secondary sources (see Appendix 1). The results suggest that farm incomes are even more highly skewed than indicated in the HIES or the PRHS, and that the importance of non-farm incomes in total rural household incomes is generally understated in the household survey data.
Based on data from the Agricultural Census, Agricultural Prices Commission Cost of Production, national accounts, and MINFAL (Ministry of Food, Agriculture and Livestock) the estimates from the SAM indicate that returns to land account for 55 percent of value-added in crop production and 27 percent of total agricultural income (including livestock, fishing, and forestry). Returns to operated land on medium and large farms alone account for 21 percent of total crop value-added. Total returns to labour are 27 percent of the value-added in the crop sector, but the share of hired labour in the sector value-added is only 5 percent.
Other income
Gifts, transfers, pensions
Wages and Salaries
Livestock
Crop production

Dorosh, Niazi, and Nazli 254
Given this large share of land incomes in agricultural value-added and the skewed distribution of land, medium and large land owners (those with 12.5 acres or more), who account for 10 percent of agricultural households, receive an estimated 32 percent of agricultural incomes.
However, agricultural incomes (including livestock) generally account for only 56 percent of total incomes for agricultural households (41 percent of total population in Pakistan). Including rural non-agricultural households (31 percent of national population), the share of agricultural incomes in total rural incomes is only 37 percent. Thus, incomes from rural non-agricultural activities, including processing and trade of agricultural products, small industry, construction, and general trade and transport services account for 63 percent of total rural incomes, and essentially all of non-transfer incomes for about 40 percent of the rural population (Table 3).
Table 3
Pakistan Rural Agricultural Incomes
PRHS Agric. Inc. Per Capita ('000 Rs)
PRHS Agric. Inc.
Share (Percent)
SAM Agric. Inc. Per Capita ('000 Rs)
SAM Agric. Inc.
Share (Percent)
Medium and Large Farms 15.7 83.5 29.9 57.2
Small Farms 6.1 67.9 8.6 54.8
Landless Farmers 7.2 87.7 5.3 59.7
Rural Agric. Workers 2.2 53.1 5.5 53.1
Rural Non-farm Non-poor 0.3 1.9 0.1 0.4
Rural Non-farm Poor 0.2 6.3 0.2 4.5
Total Rural 6.1 69.7 5.6 37.2 Rural Agric. Households 7.1 74.8 9.6 55.9 Source: Pakistan SAM 2001-02; PIDE/World Bank (2002).
The contribution of agricultural growth to increased rural incomes is not limited to farm incomes, however. Increases in agricultural production generally involve increased demand for agricultural inputs, processing, and marketing services. Also, as household incomes rise, consumer demand for both urban and rural products and services increases. To the extent that the supply of goods and services is elastic, these increases in demand can spur increases in production and further increases in demand.
Distributional Impacts of Agricultural Growth 255
III. THE SAM-BASED SEMI-INPUT-OUTPUT MODEL This analysis of growth linkages in Pakistan uses a variant of the fixed-price,
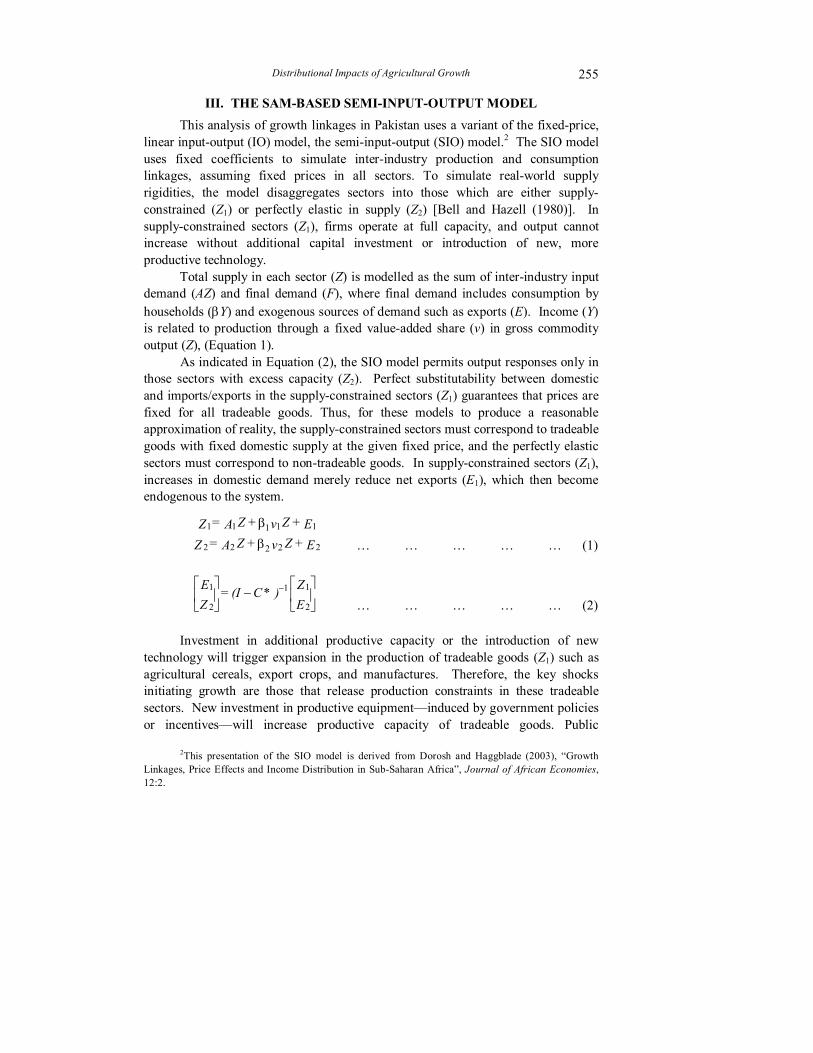
linear input-output (IO) model, the semi-input-output (SIO) model.2 The SIO model uses fixed coefficients to simulate inter-industry production and consumption linkages, assuming fixed prices in all sectors. To simulate real-world supply rigidities, the model disaggregates sectors into those which are either supply-constrained (Z1) or perfectly elastic in supply (Z2) [Bell and Hazell (1980)]. In supply-constrained sectors (Z1), firms operate at full capacity, and output cannot increase without additional capital investment or introduction of new, more productive technology.
Total supply in each sector (Z) is modelled as the sum of inter-industry input demand (AZ) and final demand (F), where final demand includes consumption by households (βY) and exogenous sources of demand such as exports (E). Income (Y) is related to production through a fixed value-added share (v) in gross commodity output (Z), (Equation 1).
As indicated in Equation (2), the SIO model permits output responses only in those sectors with excess capacity (Z2). Perfect substitutability between domestic and imports/exports in the supply-constrained sectors (Z1) guarantees that prices are fixed for all tradeable goods. Thus, for these models to produce a reasonable approximation of reality, the supply-constrained sectors must correspond to tradeable goods with fixed domestic supply at the given fixed price, and the perfectly elastic sectors must correspond to non-tradeable goods. In supply-constrained sectors (Z1), increases in domestic demand merely reduce net exports (E1), which then become endogenous to the system.
E + Zv + ZA = ZE + Zv + ZA = Z
22222
11111
β
β
−
−
EZ )*C(I =
ZE
2
11
2
1
Investment in additional productive capacity or the introduction of new
technology will trigger expansion in the production of tradeable goods (Z1) such as agricultural cereals, export crops, and manufactures. Therefore, the key shocks initiating growth are those that release production constraints in these tradeable sectors. New investment in productive equipment—induced by government policies or incentives—will increase productive capacity of tradeable goods. Public
2This presentation of the SIO model is derived from Dorosh and Haggblade (2003), “Growth Linkages, Price Effects and Income Distribution in Sub-Saharan Africa”, Journal of African Economies, 12:2.
… … … … … (1)
… … … … … (2)
Dorosh, Niazi, and Nazli 256
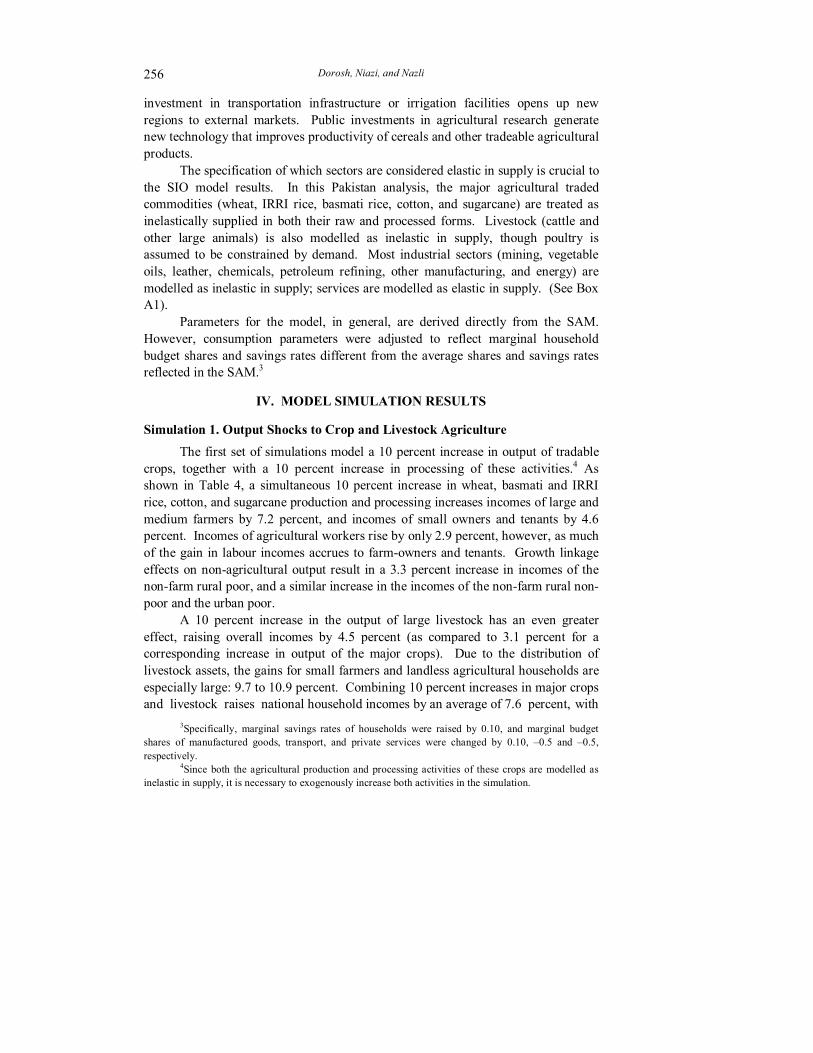
investment in transportation infrastructure or irrigation facilities opens up new regions to external markets. Public investments in agricultural research generate new technology that improves productivity of cereals and other tradeable agricultural products.
The specification of which sectors are considered elastic in supply is crucial to the SIO model results. In this Pakistan analysis, the major agricultural traded commodities (wheat, IRRI rice, basmati rice, cotton, and sugarcane) are treated as inelastically supplied in both their raw and processed forms. Livestock (cattle and other large animals) is also modelled as inelastic in supply, though poultry is assumed to be constrained by demand. Most industrial sectors (mining, vegetable oils, leather, chemicals, petroleum refining, other manufacturing, and energy) are modelled as inelastic in supply; services are modelled as elastic in supply. (See Box A1).
Parameters for the model, in general, are derived directly from the SAM. However, consumption parameters were adjusted to reflect marginal household budget shares and savings rates different from the average shares and savings rates reflected in the SAM.3
IV. MODEL SIMULATION RESULTS
Simulation 1. Output Shocks to Crop and Livestock Agriculture
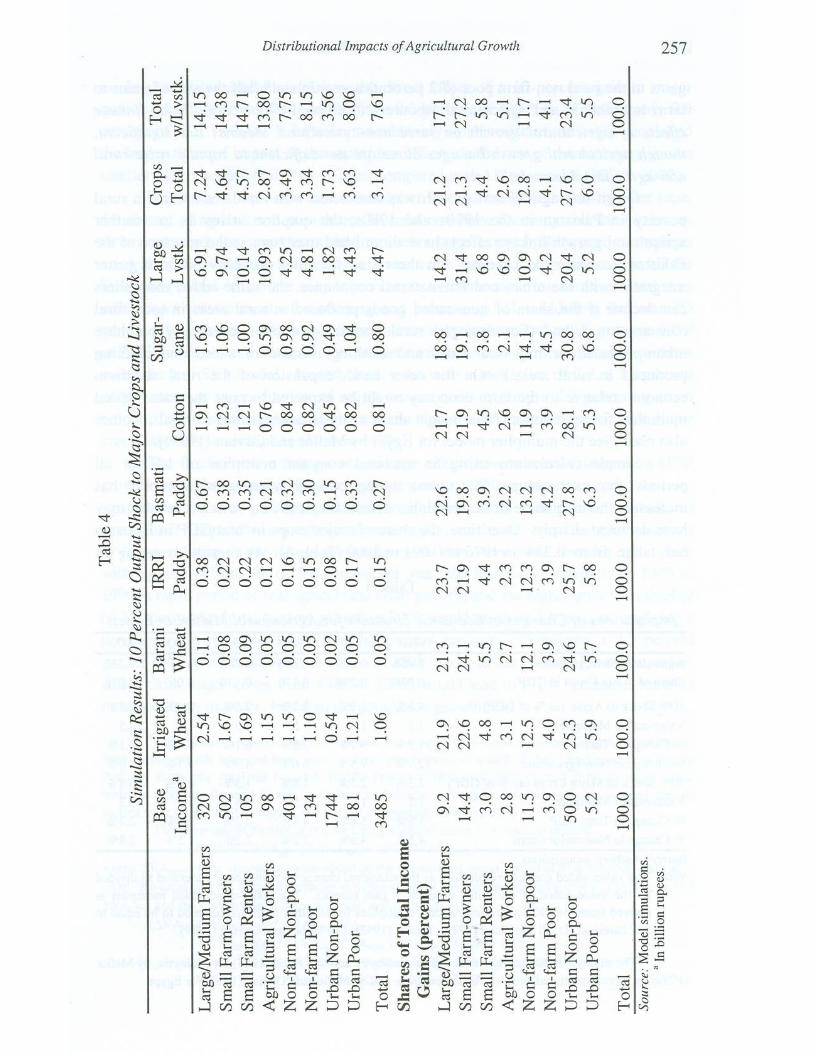
The first set of simulations model a 10 percent increase in output of tradable crops, together with a 10 percent increase in processing of these activities.4 As shown in Table 4, a simultaneous 10 percent increase in wheat, basmati and IRRI rice, cotton, and sugarcane production and processing increases incomes of large and medium farmers by 7.2 percent, and incomes of small owners and tenants by 4.6 percent. Incomes of agricultural workers rise by only 2.9 percent, however, as much of the gain in labour incomes accrues to farm-owners and tenants. Growth linkage effects on non-agricultural output result in a 3.3 percent increase in incomes of the non-farm rural poor, and a similar increase in the incomes of the non-farm rural non-poor and the urban poor.
A 10 percent increase in the output of large livestock has an even greater effect, raising overall incomes by 4.5 percent (as compared to 3.1 percent for a corresponding increase in output of the major crops). Due to the distribution of livestock assets, the gains for small farmers and landless agricultural households are especially large: 9.7 to 10.9 percent. Combining 10 percent increases in major crops and livestock raises national household incomes by an average of 7.6 percent, with
3Specifically, marginal savings rates of households were raised by 0.10, and marginal budget shares of manufactured goods, transport, and private services were changed by 0.10, –0.5 and –0.5, respectively.
4Since both the agricultural production and processing activities of these crops are modelled as inelastic in supply, it is necessary to exogenously increase both activities in the simulation.
Dorosh, Niazi, and Nazli 258
gains to the rural non-farm poor (8.2 percent) approximately half the size of gains to farm households and agricultural labourers (13.8 to 14.7 percent). Thus, linkage effects of agricultural growth on rural non-agricultural incomes are significant, though agricultural growth linkages alone are not sufficient to rapidly raise rural non-agricultural household incomes.
Given that agricultural growth was associated with rapid reductions in rural poverty in Pakistan in the 1970s and 1980s, the question arises as to whether agricultural growth linkage effects have diminished over time as the structure of the Pakistan economy has changed. In theory, as the rural economy becomes better integrated with the urban and international economies, the value-added multipliers can decline if the share of non-traded goods produced in rural areas in total rural consumption falls. (For example, rural consumers could increasingly purchase urban-produced or imported shoes and clothing, instead of shoes and clothing produced in rural areas.) On the other hand, expansion of the rural non-farm economy relative to the farm economy might be expected to raise the value-added multiplier for agriculture if the budget share of these commodities in rural incomes also rises [See the multiplier model for Egypt by Mellor and Gavian (1999)].
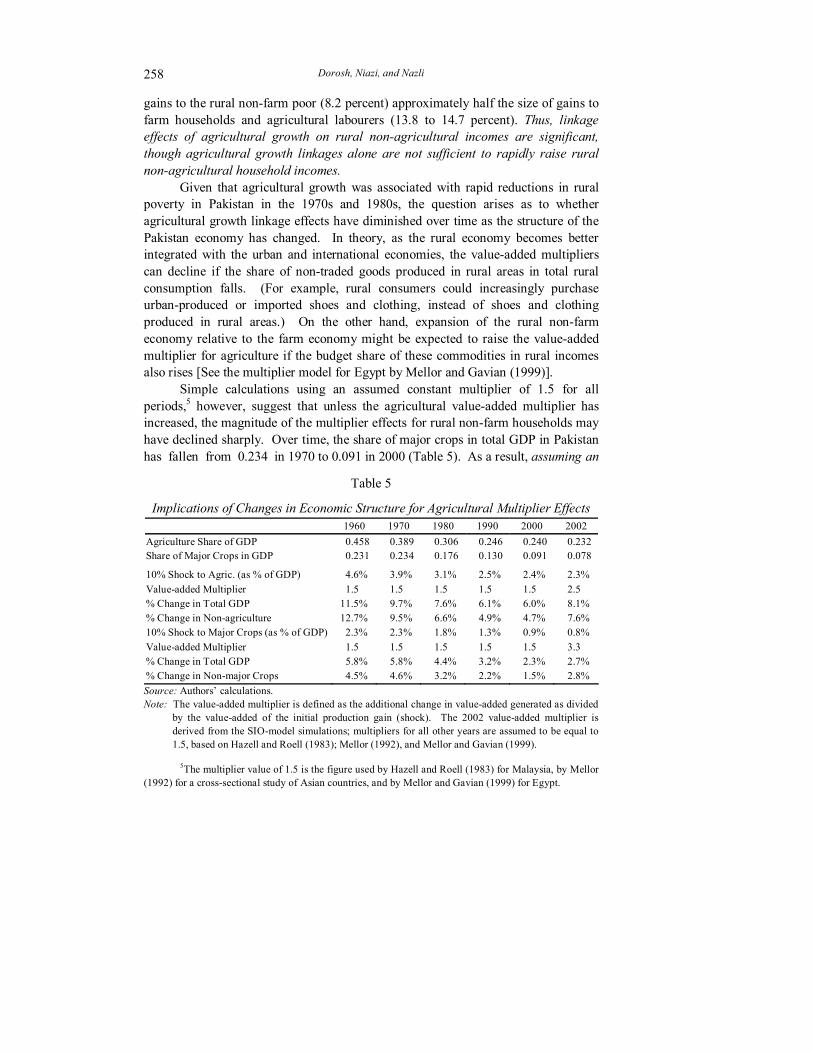
Simple calculations using an assumed constant multiplier of 1.5 for all periods,5 however, suggest that unless the agricultural value-added multiplier has increased, the magnitude of the multiplier effects for rural non-farm households may have declined sharply. Over time, the share of major crops in total GDP in Pakistan has fallen from 0.234 in 1970 to 0.091 in 2000 (Table 5). As a result, assuming an
Table 5
Implications of Changes in Economic Structure for Agricultural Multiplier Effects 1960 1970 1980 1990 2000 2002 Agriculture Share of GDP 0.458 0.389 0.306 0.246 0.240 0.232 Share of Major Crops in GDP 0.231 0.234 0.176 0.130 0.091 0.078
10% Shock to Agric. (as % of GDP) 4.6% 3.9% 3.1% 2.5% 2.4% 2.3% Value-added Multiplier 1.5 1.5 1.5 1.5 1.5 2.5 % Change in Total GDP 11.5% 9.7% 7.6% 6.1% 6.0% 8.1% % Change in Non-agriculture 12.7% 9.5% 6.6% 4.9% 4.7% 7.6% 10% Shock to Major Crops (as % of GDP) 2.3% 2.3% 1.8% 1.3% 0.9% 0.8% Value-added Multiplier 1.5 1.5 1.5 1.5 1.5 3.3 % Change in Total GDP 5.8% 5.8% 4.4% 3.2% 2.3% 2.7% % Change in Non-major Crops 4.5% 4.6% 3.2% 2.2% 1.5% 2.8% Source: Authors’ calculations. Note: The value-added multiplier is defined as the additional change in value-added generated as divided
by the value-added of the initial production gain (shock). The 2002 value-added multiplier is derived from the SIO-model simulations; multipliers for all other years are assumed to be equal to 1.5, based on Hazell and Roell (1983); Mellor (1992), and Mellor and Gavian (1999).
5The multiplier value of 1.5 is the figure used by Hazell and Roell (1983) for Malaysia, by Mellor
(1992) for a cross-sectional study of Asian countries, and by Mellor and Gavian (1999) for Egypt.
Distributional Impacts of Agricultural Growth 259
unchanged value-added multiplier, the direct effect of a 10 percent gain in major crop production is smaller: equivalent to 2.3 percent of GDP in 1970, but only 0.9 percent of GDP in 2000. Likewise, the relatively smaller size of the initial shock and the larger share of impact of the multiplier effects on the rest of the economy is also smaller (4.6 percent of GDP in 1970 as compared with 1.5 percent of GDP in 2000).
However, if the value-added multiplier has increased substantially over time, the impact of agricultural growth on the rural non-farm economy and the rural non-farm poor need not have diminished to such a large extent.6 Simulated multipliers using the 2001-02 SAM SIO model are about 3.3 for major crops and about 1.7 for livestock (values which are very high relative to other countries, however, and may reflect an overstatement of marketing and processing value-added in Pakistan IO table). Using these multipliers and the shares of agriculture and major crops in GDP in 2002 results in estimated effects on the rural non-farm economy similar to those using the full SIO model. Nonetheless, even with a multiplier of 2.5, a 10 percent output increase in production of major crops results in only a 2.8 percent gain in output of other sectors, about 40 percent less than the estimated change in non-major crops assuming a multiplier of 1.5 in 1970.
The implication is that growth linkage effects have a smaller impact on GDP growth and rural poverty reduction today than in 1970, (unless the gains in non-agricultural incomes go disproportionately to the rural non-farm poor). Agricultural growth still has positive impacts on incomes of the rural poor, but these effects are not as large, relative to the size of the economy, as they were three decades ago. Even with agricultural growth of 3.9 percent per year (the historical average from 1975 to 1990, a rapid period of real agricultural GDP growth) and the higher growth multiplier of 2.5, non-agricultural income growth in 2002 would be about 2.9 percent, implying a per capita growth rate of less than 1.0 percent per year.7 Similarly, a 3.5 percent growth in output of major crops alone in 2002 (equal to the average growth in value-added from major crops from 1960 to 2002) would lead to a 1.0 percent increase in rural non-farm incomes, less than the population growth rate.
6Unfortunately, analyses of the Pakistan economy with a SAM-based semi-input-output model from earlier periods have not been done, in large part because of a lack of data. Earlier analysis by the Pakistan Economic Analysis Network (EAN) Project (1989) used 1975-76 and 1984-85 input-output tables to calculate demand-driven multipliers in Pakistan agriculture, but this analysis assumed that no sectors were constrained in supply, and did not disaggregate households.
7The value-added multiplier (m) for the agricultural sector as a whole is defined: m = (∆GDP – ∆VAagric ) / ∆VAagric = (∆GDP / ∆VAagric) – 1,
where ∆VAagric is the change in value-added of the agricultural sector, and ∆GDP is the total change in GDP. Re-arranging the terms, the change in value-added of the non-agricultural sector is: (∆VANA) = m * ∆VAagric, and the growth rate in the non-agricultural sector is:
(∆VANA) / VANA = m * ∆VAagric / VANA = m * (∆VAagric / VAagric ) * VAagric / GDP) * (GDP / VANA ) = m * % ∆VAagric * AgShareGDP / (Non-Ag Share GDP) = 2.5 * 3.9% * (0.232)/(1–0.232) = 2.9%
Dorosh, Niazi, and Nazli 260
These simple multiplier calculations do not exactly match the SAM-based SIO model results, since the fuller model does not treat all of agriculture as exogenous and the multipliers differ across sectors of the economy according to the input-output structure, shares of value-added received by various households, and household consumption patterns. In particular, the changes in household incomes in the model are determined not only by the changes in value-added generated in various sectors but also by a household’s share in value-added earned by each factor of production.8 The simulations assume that unskilled labour markets are segmented into own-farm labour, agricultural wage labour, and non-agricultural unskilled labour markets. Thus, in the simulations, most of the gains in total agricultural labour incomes accrue to farm households (reflecting the average distribution of agricultural labour incomes in the PRHS surveys). If this pattern still holds for marginal increases in agricultural output in the future, increased agricultural output will result in relatively little increase in demand for landless agricultural labour. The simulations also assume that rural and urban markets for unskilled non-agricultural labour are integrated. Thus the gains in non-agricultural unskilled labour incomes are split across both urban and rural households.9
Finally, it should be noted that the simulations show the average gains in incomes for the various household groups. If non-agricultural labour incomes are concentrated among only a segment of rural non-farm poor households, the percentage gains in income of this segment of households will be larger, (and the gains to other rural non-farm poor households correspondingly smaller). Simulation 2. Shift from Share-cropping to Fixed Rents
In theory, productivity of share-croppers is expected to be lower than of owners or those with fixed-rent tenants, because for some inputs (such as own-labour), share-croppers pay the full (implicit) cost but reap only a part (generally one-half) of the benefits in terms of value of output. Using data from the HIES 2001-02, Jacoby and Mansuri (2004) find no significant difference between productivity of share-croppers and owners for cultivation of major crops. However, share-croppers who are not supervised (those who meet their landlords fewer than ten times in a season to discuss a given plot) are found to be 18 percent less productive than land-owners or share-croppers who are supervised.
8The simple multiplier calculations in Table 5 do not provide direct estimates of changes in household incomes. Nonetheless, the percentage changes in incomes of rural non-farm households in the SIO simulations are similar to the percentage changes in value-added in non-major crops in Table 5.
9The PRHS data indicate that rural non-farm households have a lot of underemployed labour (per capita non-agricultural labour incomes are five times higher for rural non-farm non-poor households as compared with rural non-farm poor households). In the SIO model analysis here, the average shares of labour income by household from the SAM are used to allocate marginal gains in labour incomes to households. To the extent that rural non-farm poor households have higher marginal shares of the multiplier-effect gain in total labour incomes, the simulated income gains to rural non-farm poor households may be underestimated.
Distributional Impacts of Agricultural Growth 261
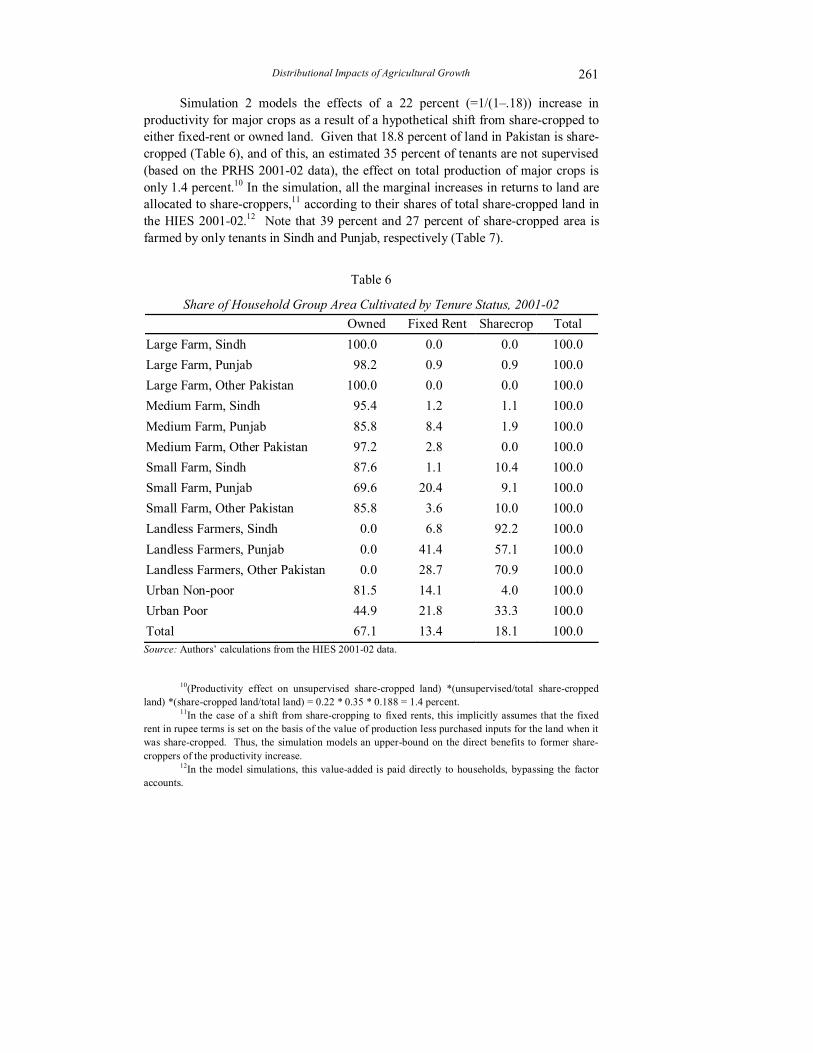
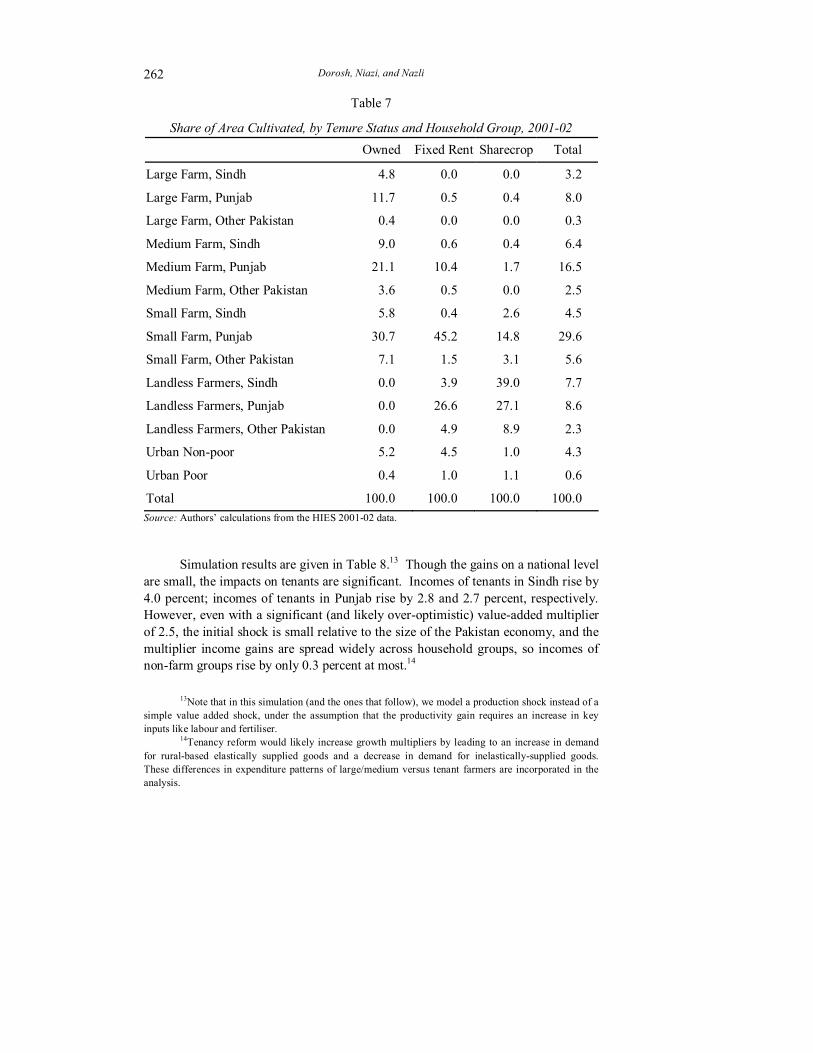
Simulation 2 models the effects of a 22 percent (=1/(1–.18)) increase in productivity for major crops as a result of a hypothetical shift from share-cropped to either fixed-rent or owned land. Given that 18.8 percent of land in Pakistan is share-cropped (Table 6), and of this, an estimated 35 percent of tenants are not supervised (based on the PRHS 2001-02 data), the effect on total production of major crops is only 1.4 percent.10 In the simulation, all the marginal increases in returns to land are allocated to share-croppers,11 according to their shares of total share-cropped land in the HIES 2001-02.12 Note that 39 percent and 27 percent of share-cropped area is farmed by only tenants in Sindh and Punjab, respectively (Table 7).
Table 6
Share of Household Group Area Cultivated by Tenure Status, 2001-02 Owned Fixed Rent Sharecrop Total Large Farm, Sindh 100.0 0.0 0.0 100.0 Large Farm, Punjab 98.2 0.9 0.9 100.0 Large Farm, Other Pakistan 100.0 0.0 0.0 100.0 Medium Farm, Sindh 95.4 1.2 1.1 100.0 Medium Farm, Punjab 85.8 8.4 1.9 100.0 Medium Farm, Other Pakistan 97.2 2.8 0.0 100.0 Small Farm, Sindh 87.6 1.1 10.4 100.0 Small Farm, Punjab 69.6 20.4 9.1 100.0 Small Farm, Other Pakistan 85.8 3.6 10.0 100.0 Landless Farmers, Sindh 0.0 6.8 92.2 100.0 Landless Farmers, Punjab 0.0 41.4 57.1 100.0 Landless Farmers, Other Pakistan 0.0 28.7 70.9 100.0 Urban Non-poor 81.5 14.1 4.0 100.0 Urban Poor 44.9 21.8 33.3 100.0 Total 67.1 13.4 18.1 100.0 Source: Authors’ calculations from the HIES 2001-02 data.
10(Productivity effect on unsupervised share-cropped land) *(unsupervised/total share-cropped land) *(share-cropped land/total land) = 0.22 * 0.35 * 0.188 = 1.4 percent.
11In the case of a shift from share-cropping to fixed rents, this implicitly assumes that the fixed rent in rupee terms is set on the basis of the value of production less purchased inputs for the land when it was share-cropped. Thus, the simulation models an upper-bound on the direct benefits to former share-croppers of the productivity increase.
12In the model simulations, this value-added is paid directly to households, bypassing the factor accounts.
Dorosh, Niazi, and Nazli 262
Table 7
Share of Area Cultivated, by Tenure Status and Household Group, 2001-02 Owned Fixed Rent Sharecrop Total
Large Farm, Sindh 4.8 0.0 0.0 3.2
Large Farm, Punjab 11.7 0.5 0.4 8.0
Large Farm, Other Pakistan 0.4 0.0 0.0 0.3
Medium Farm, Sindh 9.0 0.6 0.4 6.4
Medium Farm, Punjab 21.1 10.4 1.7 16.5
Medium Farm, Other Pakistan 3.6 0.5 0.0 2.5
Small Farm, Sindh 5.8 0.4 2.6 4.5
Small Farm, Punjab 30.7 45.2 14.8 29.6
Small Farm, Other Pakistan 7.1 1.5 3.1 5.6
Landless Farmers, Sindh 0.0 3.9 39.0 7.7
Landless Farmers, Punjab 0.0 26.6 27.1 8.6
Landless Farmers, Other Pakistan 0.0 4.9 8.9 2.3
Urban Non-poor 5.2 4.5 1.0 4.3
Urban Poor 0.4 1.0 1.1 0.6
Total 100.0 100.0 100.0 100.0 Source: Authors’ calculations from the HIES 2001-02 data.
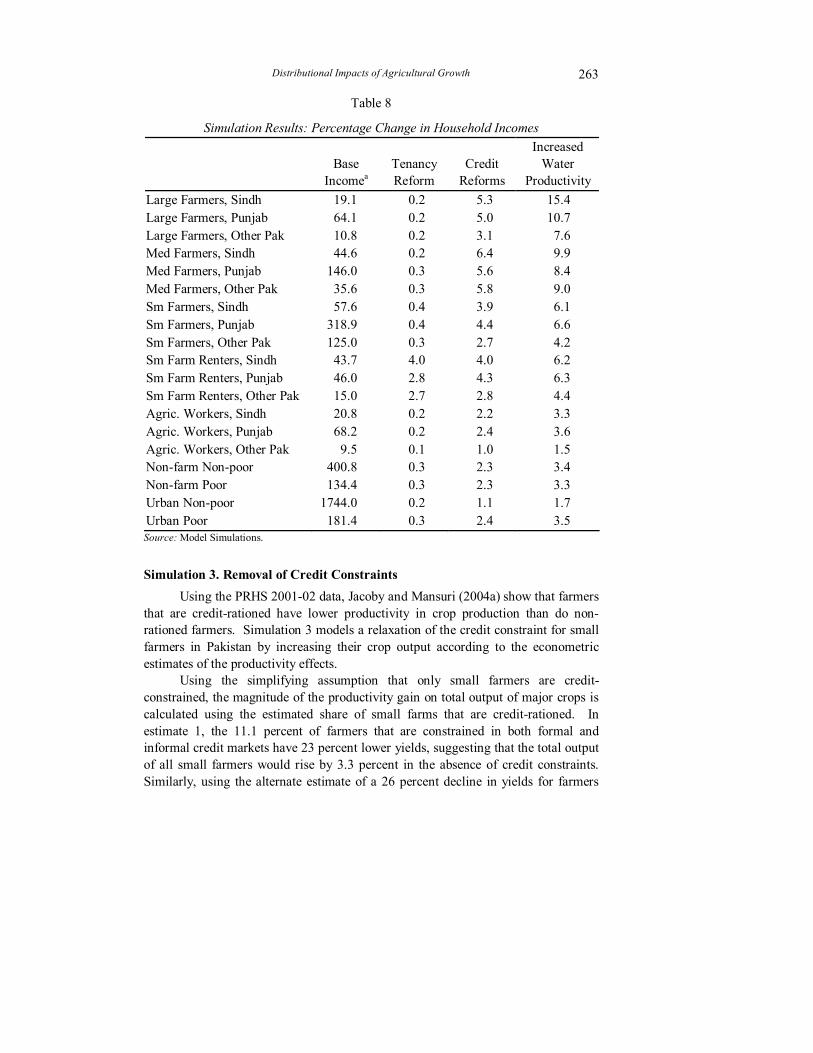
Simulation results are given in Table 8.13 Though the gains on a national level
are small, the impacts on tenants are significant. Incomes of tenants in Sindh rise by 4.0 percent; incomes of tenants in Punjab rise by 2.8 and 2.7 percent, respectively. However, even with a significant (and likely over-optimistic) value-added multiplier of 2.5, the initial shock is small relative to the size of the Pakistan economy, and the multiplier income gains are spread widely across household groups, so incomes of non-farm groups rise by only 0.3 percent at most.14
13Note that in this simulation (and the ones that follow), we model a production shock instead of a
simple value added shock, under the assumption that the productivity gain requires an increase in key inputs like labour and fertiliser.
14Tenancy reform would likely increase growth multipliers by leading to an increase in demand for rural-based elastically supplied goods and a decrease in demand for inelastically-supplied goods. These differences in expenditure patterns of large/medium versus tenant farmers are incorporated in the analysis.
Distributional Impacts of Agricultural Growth 263
Table 8
Simulation Results: Percentage Change in Household Incomes
Base
Incomea Tenancy Reform
Credit Reforms
Increased Water
Productivity Large Farmers, Sindh 19.1 0.2 5.3 15.4 Large Farmers, Punjab 64.1 0.2 5.0 10.7 Large Farmers, Other Pak 10.8 0.2 3.1 7.6 Med Farmers, Sindh 44.6 0.2 6.4 9.9 Med Farmers, Punjab 146.0 0.3 5.6 8.4 Med Farmers, Other Pak 35.6 0.3 5.8 9.0 Sm Farmers, Sindh 57.6 0.4 3.9 6.1 Sm Farmers, Punjab 318.9 0.4 4.4 6.6 Sm Farmers, Other Pak 125.0 0.3 2.7 4.2 Sm Farm Renters, Sindh 43.7 4.0 4.0 6.2 Sm Farm Renters, Punjab 46.0 2.8 4.3 6.3 Sm Farm Renters, Other Pak 15.0 2.7 2.8 4.4 Agric. Workers, Sindh 20.8 0.2 2.2 3.3 Agric. Workers, Punjab 68.2 0.2 2.4 3.6 Agric. Workers, Other Pak 9.5 0.1 1.0 1.5 Non-farm Non-poor 400.8 0.3 2.3 3.4 Non-farm Poor 134.4 0.3 2.3 3.3 Urban Non-poor 1744.0 0.2 1.1 1.7 Urban Poor 181.4 0.3 2.4 3.5 Source: Model Simulations.
Simulation 3. Removal of Credit Constraints
Using the PRHS 2001-02 data, Jacoby and Mansuri (2004a) show that farmers that are credit-rationed have lower productivity in crop production than do non-rationed farmers. Simulation 3 models a relaxation of the credit constraint for small farmers in Pakistan by increasing their crop output according to the econometric estimates of the productivity effects.
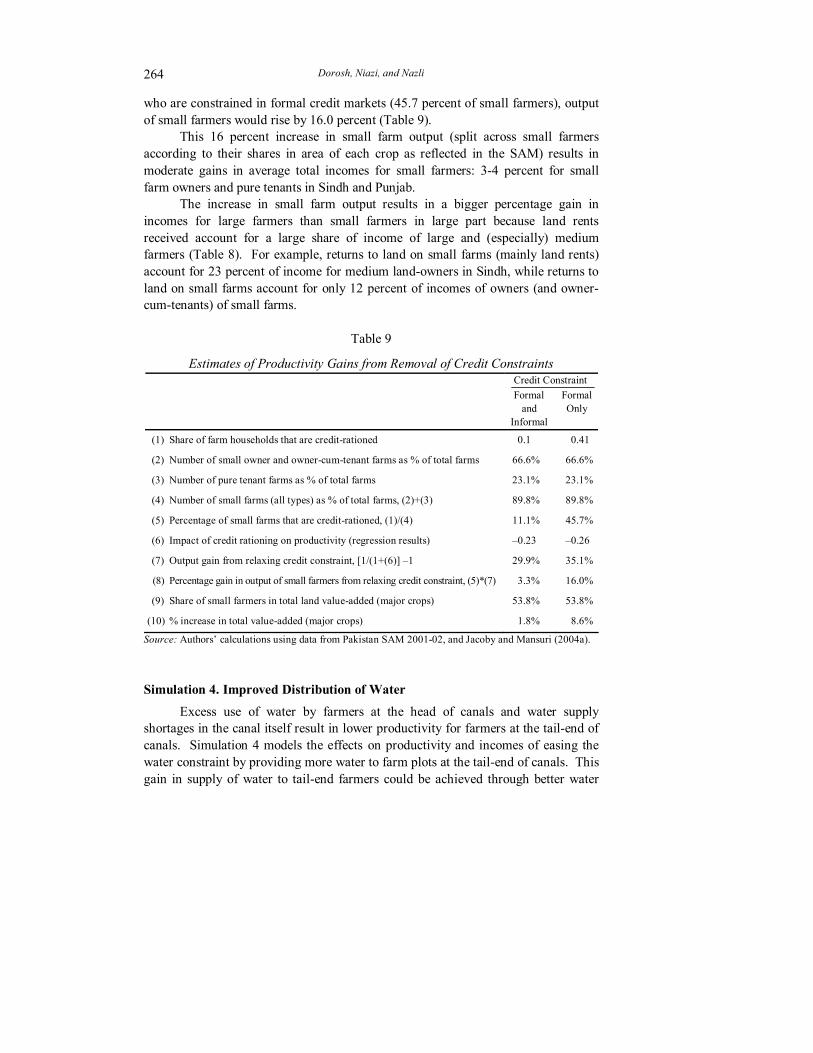
Using the simplifying assumption that only small farmers are credit-constrained, the magnitude of the productivity gain on total output of major crops is calculated using the estimated share of small farms that are credit-rationed. In estimate 1, the 11.1 percent of farmers that are constrained in both formal and informal credit markets have 23 percent lower yields, suggesting that the total output of all small farmers would rise by 3.3 percent in the absence of credit constraints. Similarly, using the alternate estimate of a 26 percent decline in yields for farmers
Dorosh, Niazi, and Nazli 264
who are constrained in formal credit markets (45.7 percent of small farmers), output of small farmers would rise by 16.0 percent (Table 9).
This 16 percent increase in small farm output (split across small farmers according to their shares in area of each crop as reflected in the SAM) results in moderate gains in average total incomes for small farmers: 3-4 percent for small farm owners and pure tenants in Sindh and Punjab.
The increase in small farm output results in a bigger percentage gain in incomes for large farmers than small farmers in large part because land rents received account for a large share of income of large and (especially) medium farmers (Table 8). For example, returns to land on small farms (mainly land rents) account for 23 percent of income for medium land-owners in Sindh, while returns to land on small farms account for only 12 percent of incomes of owners (and owner-cum-tenants) of small farms.
Table 9
Estimates of Productivity Gains from Removal of Credit Constraints Credit Constraint Formal
and Informal
Formal Only
(1) Share of farm households that are credit-rationed 0.1 0.41
(2) Number of small owner and owner-cum-tenant farms as % of total farms 66.6% 66.6%
(3) Number of pure tenant farms as % of total farms 23.1% 23.1%
(4) Number of small farms (all types) as % of total farms, (2)+(3) 89.8% 89.8%
(5) Percentage of small farms that are credit-rationed, (1)/(4) 11.1% 45.7%
(6) Impact of credit rationing on productivity (regression results) –0.23 –0.26
(7) Output gain from relaxing credit constraint, [1/(1+(6)] –1 29.9% 35.1%
(8) Percentage gain in output of small farmers from relaxing credit constraint, (5)*(7) 3.3% 16.0%
(9) Share of small farmers in total land value-added (major crops) 53.8% 53.8%
(10) % increase in total value-added (major crops) 1.8% 8.6%
Source: Authors’ calculations using data from Pakistan SAM 2001-02, and Jacoby and Mansuri (2004a).
Simulation 4. Improved Distribution of Water
Excess use of water by farmers at the head of canals and water supply shortages in the canal itself result in lower productivity for farmers at the tail-end of canals. Simulation 4 models the effects on productivity and incomes of easing the water constraint by providing more water to farm plots at the tail-end of canals. This gain in supply of water to tail-end farmers could be achieved through better water
Distributional Impacts of Agricultural Growth 265
distribution or increased availability of water achieved through measures such as canal lining. In the simulation, this increase in water at the tail-end is assumed to have no effect on productivity of farmers at the head-end, however.
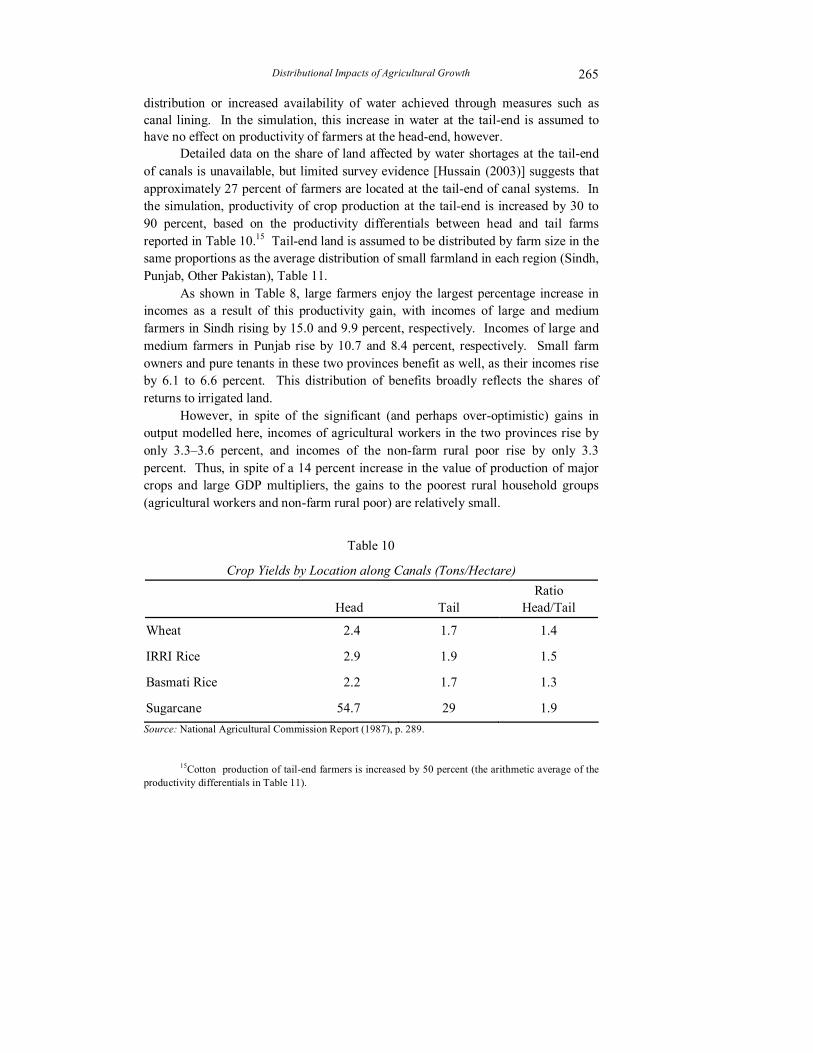
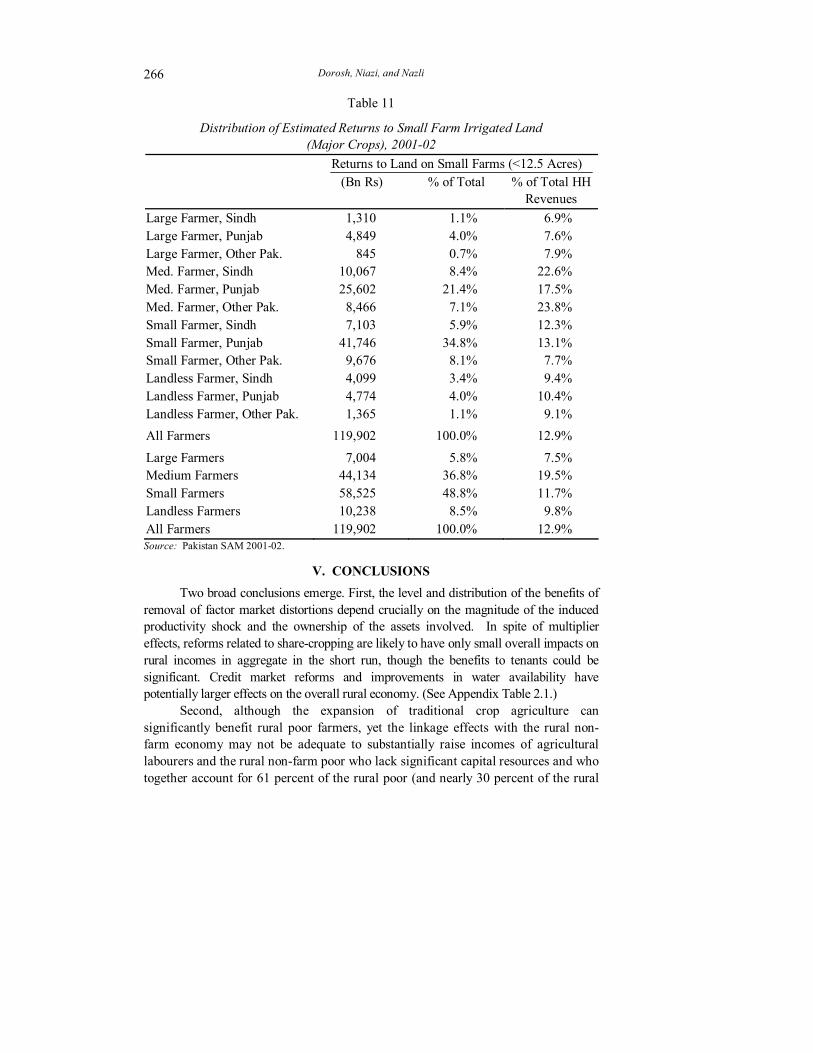
Detailed data on the share of land affected by water shortages at the tail-end of canals is unavailable, but limited survey evidence [Hussain (2003)] suggests that approximately 27 percent of farmers are located at the tail-end of canal systems. In the simulation, productivity of crop production at the tail-end is increased by 30 to 90 percent, based on the productivity differentials between head and tail farms reported in Table 10.15 Tail-end land is assumed to be distributed by farm size in the same proportions as the average distribution of small farmland in each region (Sindh, Punjab, Other Pakistan), Table 11.
As shown in Table 8, large farmers enjoy the largest percentage increase in incomes as a result of this productivity gain, with incomes of large and medium farmers in Sindh rising by 15.0 and 9.9 percent, respectively. Incomes of large and medium farmers in Punjab rise by 10.7 and 8.4 percent, respectively. Small farm owners and pure tenants in these two provinces benefit as well, as their incomes rise by 6.1 to 6.6 percent. This distribution of benefits broadly reflects the shares of returns to irrigated land.
However, in spite of the significant (and perhaps over-optimistic) gains in output modelled here, incomes of agricultural workers in the two provinces rise by only 3.3–3.6 percent, and incomes of the non-farm rural poor rise by only 3.3 percent. Thus, in spite of a 14 percent increase in the value of production of major crops and large GDP multipliers, the gains to the poorest rural household groups (agricultural workers and non-farm rural poor) are relatively small.
Table 10
Crop Yields by Location along Canals (Tons/Hectare)
Head Tail Ratio
Head/Tail
Wheat 2.4 1.7 1.4
IRRI Rice 2.9 1.9 1.5
Basmati Rice 2.2 1.7 1.3
Sugarcane 54.7 29 1.9 Source: National Agricultural Commission Report (1987), p. 289.
15Cotton production of tail-end farmers is increased by 50 percent (the arithmetic average of the productivity differentials in Table 11).
Dorosh, Niazi, and Nazli 266
Table 11
Distribution of Estimated Returns to Small Farm Irrigated Land (Major Crops), 2001-02
Returns to Land on Small Farms (<12.5 Acres)
(Bn Rs) % of Total % of Total HH
Revenues Large Farmer, Sindh 1,310 1.1% 6.9% Large Farmer, Punjab 4,849 4.0% 7.6% Large Farmer, Other Pak. 845 0.7% 7.9% Med. Farmer, Sindh 10,067 8.4% 22.6% Med. Farmer, Punjab 25,602 21.4% 17.5% Med. Farmer, Other Pak. 8,466 7.1% 23.8% Small Farmer, Sindh 7,103 5.9% 12.3% Small Farmer, Punjab 41,746 34.8% 13.1% Small Farmer, Other Pak. 9,676 8.1% 7.7% Landless Farmer, Sindh 4,099 3.4% 9.4% Landless Farmer, Punjab 4,774 4.0% 10.4% Landless Farmer, Other Pak. 1,365 1.1% 9.1% All Farmers 119,902 100.0% 12.9%
Large Farmers 7,004 5.8% 7.5% Medium Farmers 44,134 36.8% 19.5% Small Farmers 58,525 48.8% 11.7% Landless Farmers 10,238 8.5% 9.8% All Farmers 119,902 100.0% 12.9% Source: Pakistan SAM 2001-02.
V. CONCLUSIONS Two broad conclusions emerge. First, the level and distribution of the benefits of
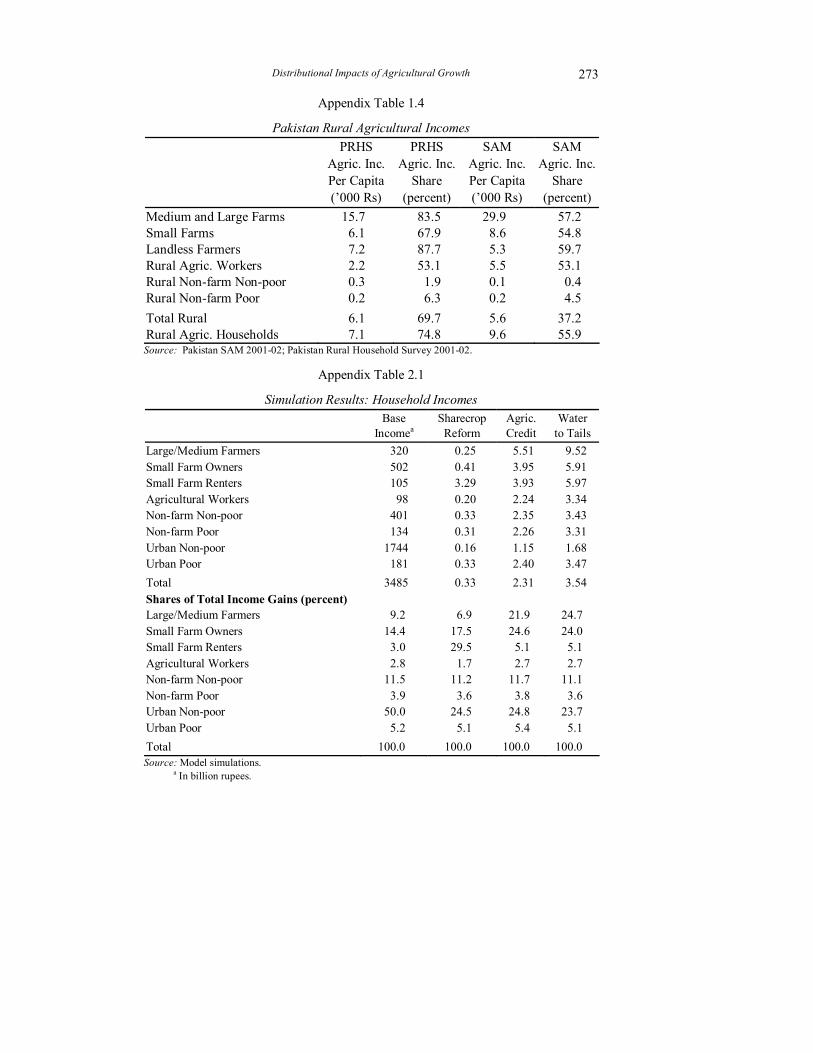
removal of factor market distortions depend crucially on the magnitude of the induced productivity shock and the ownership of the assets involved. In spite of multiplier effects, reforms related to share-cropping are likely to have only small overall impacts on rural incomes in aggregate in the short run, though the benefits to tenants could be significant. Credit market reforms and improvements in water availability have potentially larger effects on the overall rural economy. (See Appendix Table 2.1.)
Second, although the expansion of traditional crop agriculture can significantly benefit rural poor farmers, yet the linkage effects with the rural non-farm economy may not be adequate to substantially raise incomes of agricultural labourers and the rural non-farm poor who lack significant capital resources and who together account for 61 percent of the rural poor (and nearly 30 percent of the rural

Distributional Impacts of Agricultural Growth 267
population). Model simulations suggest that a 3.9 percent rate of growth in real agricultural output (the average rate of growth in real agricultural GDP from 1975 to 1990), in the absence of reduced real prices of staple foods, would raise rural non-farm income growth by only about 2.9 percent per year, implying a per capita income growth of less than 1.0 percent per year.
Because of data uncertainties and simplifying assumptions used, the above analysis of the effects of increases in agricultural output illustrates only the broad order of magnitude of the effects. More work is needed both to improve the database and the modelling approach. Of particular importance is data on the detailed structure of rural non-farm output and income—about what is produced and which household groups buy the products and services. Further refinements in the SAM could also be made using an updated input-output table (when available), greater disaggregation of service activities, and more detailed specification of urban households. Continued efforts are needed, as well, in household survey design and construction of national accounts to achieve more consistency between national consumption and income estimates from these two sources. Finally, model simulations with a general equilibrium model could incorporate wage and price effects.16
Nonetheless, the broad structure of rural production, distribution of land and other factors of production, and structure of household incomes are reflected in the analysis. In particular, the analysis captures the major implications of the skewed distribution of ownership of land and the dependence of much of the poor on non-agricultural income sources. Because of this distribution of assets and the sources of income, the direct and indirect effects of growth in the traditional crop sector (though substantial) are unlikely to significantly reduce poverty among landless agricultural labourers and the rural non-farm poor.
Agricultural growth and associated growth linkages to the rural non-farm economy still remain very important for reducing rural poverty. Indeed, the evidence suggests that slow rates of growth of the agricultural sector would likely result in stagnant or increased rural poverty in Pakistan. But while robust agricultural growth may be a necessary condition for rapid rural poverty reduction, the analysis suggests that it is not a sufficient condition. In the absence of a change in the structure of rural incomes and employment, further measures will likely be needed for rapid poverty reduction in Pakistan, including greater efforts to boost the livestock sector, expansion of the rural non-farm economy (in addition to agricultural growth-induced linkage effects), and targeted interventions to the poorest rural households.
16Comparative analysis of growth linkage effects using the SIO multiplier models and the CGE models for sub-Saharan African countries shows that the linkage effects of agricultural growth are somewhat overstated in the SIO multiplier analysis, suggesting that these modelling refinements would strengthen the conclusions of this paper regarding the limitations of agricultural growth as a means of raising incomes of rural non-farm households in Pakistan [Dorosh and Haggblade (2003)].
Dorosh, Niazi, and Nazli 268
APPENDIX 1
The 2001-02 Pakistan SAM
The data base for the analysis presented in this paper is a 2001-02 social accounting matrix (SAM), a consistent set of accounts of the economic flows between production activities, earnings of factors of production, incomes of various types of households, and demand for goods and services.
The 2001-02 Pakistan SAM includes 34 activities, each producing a single commodity, except for irrigated wheat and non-irrigated wheat, both of which produce a single commodity (wheat) (Box A3.1). For the twelve agricultural activities, returns to land and own-family labour are disaggregated by region (Punjab, Sindh, and Other Pakistan) and by size of farm (small (0–12.5 acres), medium (12.5–50 acres) and large (50 acres plus) farms (defined according to operated area, not land-ownership). Out of the 27 factors of production that are specified, 23 involve only agricultural production: 8 types of agricultural labour, 12 types of land, and 3 other factors: water, livestock capital, and other agricultural capital.
This detailed treatment of rural factors and agriculture in the SAM reflects the primary objective of constructing the SAM: to better understand the relationship between agricultural performance and rural income growth in the context of imperfect rural factor markets. Fifteen of the nineteen household categories are rural agricultural households, split according to amount of land cultivated (large farm, small farm, landless) and region (Sindh, Punjab, and Other Pakistan). Non-farm households, both rural and urban, are split into poor and non-poor according to their 2000-01 per capita household expenditures, with poor households defined as those with a per capita expenditure of less than 748 rupees/month per capita. By this definition, 23.5 percent of the rural population (19.8 percent of total population) are classified as non-farm rural poor households,17 and 22.7 percent of urban households (15.3 percent of the total national population) are poor.
Data used in construction of the SAM derive mainly from the 1990-91 Input-Output Table (97 sectors), 2001-02 National Accounts (value-added for 15 sectors), 2001-02 Pakistan Integrated Household Survey (consumption disaggregation), the 2001 Pakistan Rural Household Survey (household income disaggregation), and the 2001-02 Pakistan Economic Survey (sector/commodity data on production, prices, trade).18
17Non-farm rural households are defined as rural households for which the main occupation of the
head of household is not crop or livestock farming. 18See Dorosh, Niazi, and Nazli (2004) “A Social Accounting Matrix for Pakistan, 2001-02:
Methodology and Results” for details of the construction of the SAM.
Distributional Impacts of Agricultural Growth 269
Household incomes and expenditures relative to those of other household groups follow similar patterns as in the PRHS and the HIES surveys, though absolute levels of household incomes and expenditures are substantially higher, given the apparent substantial under-reporting of expenditures (particularly on services) and informal sector incomes in the surveys.
On average, household incomes in the SAM are 2.1 times greater than household expenditures in the HIES Survey, and rural household incomes in the SAM are 1.7 times greater than rural household incomes in the PRHS survey (Appendix Table 1.1). These ratios vary by household group, however. The SAM calculations suggest that expenditures of large and medium farmers are seriously understated in the HIES—by a factor of 3.8, on average. Compared to total incomes in the PRHS survey results, however, factor incomes of medium and large farmers in the SAM are only 2.8 times higher. Note that much of the difference in incomes is due to estimated returns to cultivated land. For only two household groups, rural non-farm poor and rural agricultural labour in Sindh, are the SAM household incomes less than household expenditures in the HIES.19
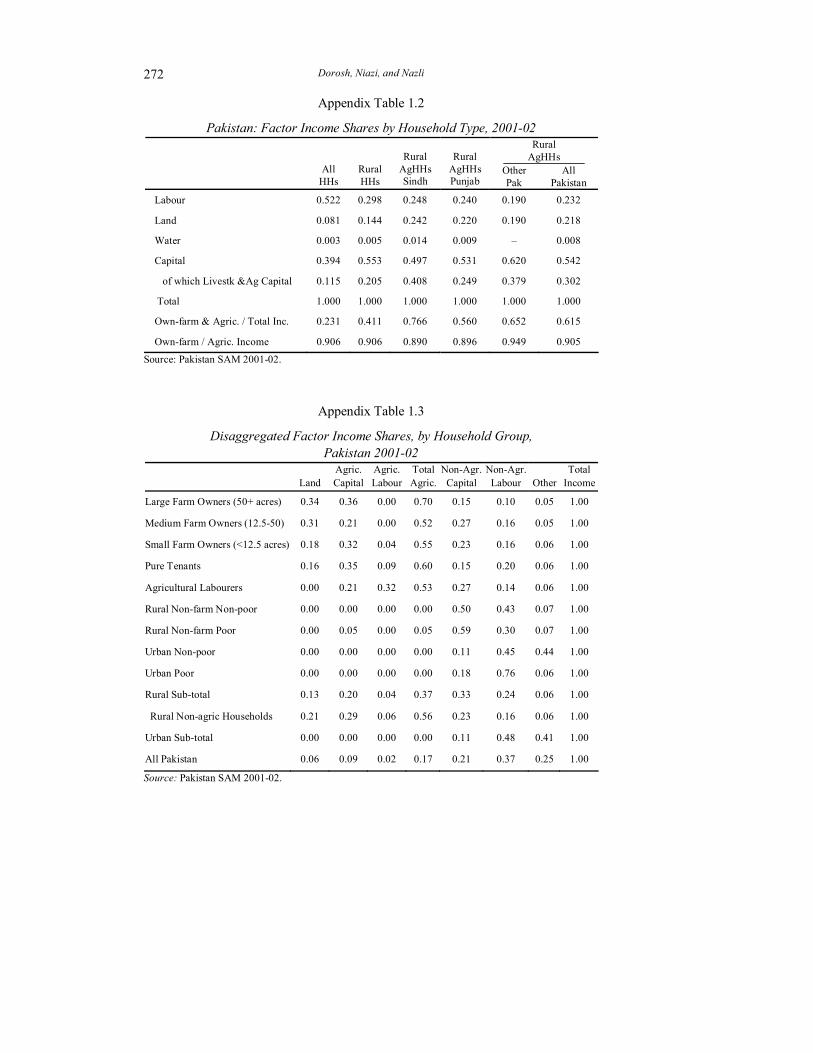
Agricultural factor incomes account for only 23 percent of total factor incomes in Pakistan; but 60 percent of total factor incomes for agricultural households (77 percent for agricultural households in Sindh) (Appendix Table 1.2). Ninety-one percent of agricultural incomes derive from land, water, own-farm labour, or livestock, so that without access to land or livestock, earnings from hired labour, and (non-livestock) agricultural capital account for only 9 percent of agricultural incomes.
Land accounts for more than 30 percent of household incomes, only for medium and large farm owners (Appendix Table 1.3). Agricultural labour accounts for 32 percent of incomes for agricultural wage labourer households, but only 9 percent of incomes of tenants and 4 percent of incomes of small farmers. Overall, agricultural incomes account for an average of 56 percent of estimated incomes of agricultural households in the SAM, compared with 75 percent in the PRHS (Appendix Table 1.4). As described above, the higher figures in the SAM arise mainly because of allocation of income from non-agricultural labour and informal capital to rural households.
19Note that because of a lack of reliable data, the SAM does not contain household transfers
received from other households. Including transfer income would likely bring the SAM household per capita income estimates for these groups to approximately the same level as the HIES household per capita expenditure estimates.

Distributional Impacts of Agricultural Growth 271
Box A1.1
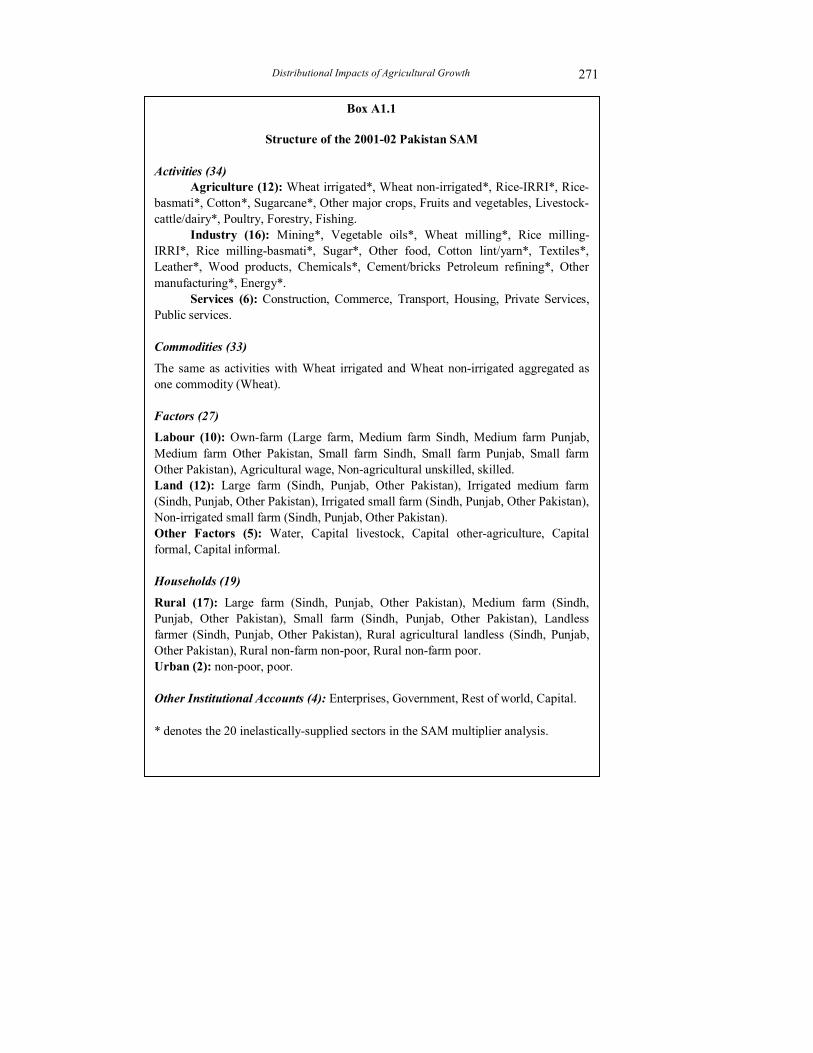
Structure of the 2001-02 Pakistan SAM Activities (34)
Agriculture (12): Wheat irrigated*, Wheat non-irrigated*, Rice-IRRI*, Rice-basmati*, Cotton*, Sugarcane*, Other major crops, Fruits and vegetables, Livestock-cattle/dairy*, Poultry, Forestry, Fishing.
Industry (16): Mining*, Vegetable oils*, Wheat milling*, Rice milling-IRRI*, Rice milling-basmati*, Sugar*, Other food, Cotton lint/yarn*, Textiles*, Leather*, Wood products, Chemicals*, Cement/bricks Petroleum refining*, Other manufacturing*, Energy*.
Services (6): Construction, Commerce, Transport, Housing, Private Services, Public services.
Commodities (33)
The same as activities with Wheat irrigated and Wheat non-irrigated aggregated as one commodity (Wheat). Factors (27) Labour (10): Own-farm (Large farm, Medium farm Sindh, Medium farm Punjab, Medium farm Other Pakistan, Small farm Sindh, Small farm Punjab, Small farm Other Pakistan), Agricultural wage, Non-agricultural unskilled, skilled. Land (12): Large farm (Sindh, Punjab, Other Pakistan), Irrigated medium farm (Sindh, Punjab, Other Pakistan), Irrigated small farm (Sindh, Punjab, Other Pakistan), Non-irrigated small farm (Sindh, Punjab, Other Pakistan). Other Factors (5): Water, Capital livestock, Capital other-agriculture, Capital formal, Capital informal. Households (19)
Rural (17): Large farm (Sindh, Punjab, Other Pakistan), Medium farm (Sindh, Punjab, Other Pakistan), Small farm (Sindh, Punjab, Other Pakistan), Landless farmer (Sindh, Punjab, Other Pakistan), Rural agricultural landless (Sindh, Punjab, Other Pakistan), Rural non-farm non-poor, Rural non-farm poor. Urban (2): non-poor, poor. Other Institutional Accounts (4): Enterprises, Government, Rest of world, Capital. * denotes the 20 inelastically-supplied sectors in the SAM multiplier analysis.
Dorosh, Niazi, and Nazli 272
Appendix Table 1.2
Pakistan: Factor Income Shares by Household Type, 2001-02 Rural
AgHHs
All HHs
Rural HHs
Rural AgHHs Sindh
Rural AgHHs Punjab
Other Pak
All Pakistan
Labour 0.522 0.298 0.248 0.240 0.190 0.232
Land 0.081 0.144 0.242 0.220 0.190 0.218
Water 0.003 0.005 0.014 0.009 – 0.008
Capital 0.394 0.553 0.497 0.531 0.620 0.542
of which Livestk &Ag Capital 0.115 0.205 0.408 0.249 0.379 0.302
Total 1.000 1.000 1.000 1.000 1.000 1.000
Own-farm & Agric. / Total Inc. 0.231 0.411 0.766 0.560 0.652 0.615
Own-farm / Agric. Income 0.906 0.906 0.890 0.896 0.949 0.905
Source: Pakistan SAM 2001-02.
Appendix Table 1.3
Disaggregated Factor Income Shares, by Household Group, Pakistan 2001-02
Land Agric. Capital
Agric. Labour
Total Agric.
Non-Agr.Capital
Non-Agr.Labour Other
Total Income
Large Farm Owners (50+ acres) 0.34 0.36 0.00 0.70 0.15 0.10 0.05 1.00
Medium Farm Owners (12.5-50) 0.31 0.21 0.00 0.52 0.27 0.16 0.05 1.00
Small Farm Owners (<12.5 acres) 0.18 0.32 0.04 0.55 0.23 0.16 0.06 1.00
Pure Tenants 0.16 0.35 0.09 0.60 0.15 0.20 0.06 1.00
Agricultural Labourers 0.00 0.21 0.32 0.53 0.27 0.14 0.06 1.00
Rural Non-farm Non-poor 0.00 0.00 0.00 0.00 0.50 0.43 0.07 1.00
Rural Non-farm Poor 0.00 0.05 0.00 0.05 0.59 0.30 0.07 1.00
Urban Non-poor 0.00 0.00 0.00 0.00 0.11 0.45 0.44 1.00
Urban Poor 0.00 0.00 0.00 0.00 0.18 0.76 0.06 1.00
Rural Sub-total 0.13 0.20 0.04 0.37 0.33 0.24 0.06 1.00
Rural Non-agric Households 0.21 0.29 0.06 0.56 0.23 0.16 0.06 1.00
Urban Sub-total 0.00 0.00 0.00 0.00 0.11 0.48 0.41 1.00
All Pakistan 0.06 0.09 0.02 0.17 0.21 0.37 0.25 1.00
Source: Pakistan SAM 2001-02.
Distributional Impacts of Agricultural Growth 273
Appendix Table 1.4
Pakistan Rural Agricultural Incomes
PRHS Agric. Inc. Per Capita (’000 Rs)
PRHS Agric. Inc.
Share (percent)
SAM Agric. Inc. Per Capita (’000 Rs)
SAM Agric. Inc.
Share (percent)
Medium and Large Farms 15.7 83.5 29.9 57.2 Small Farms 6.1 67.9 8.6 54.8 Landless Farmers 7.2 87.7 5.3 59.7 Rural Agric. Workers 2.2 53.1 5.5 53.1 Rural Non-farm Non-poor 0.3 1.9 0.1 0.4 Rural Non-farm Poor 0.2 6.3 0.2 4.5 Total Rural 6.1 69.7 5.6 37.2 Rural Agric. Households 7.1 74.8 9.6 55.9 Source: Pakistan SAM 2001-02; Pakistan Rural Household Survey 2001-02.
Appendix Table 2.1
Simulation Results: Household Incomes
Base
Incomea Sharecrop
Reform Agric. Credit
Water to Tails
Large/Medium Farmers 320 0.25 5.51 9.52 Small Farm Owners 502 0.41 3.95 5.91 Small Farm Renters 105 3.29 3.93 5.97 Agricultural Workers 98 0.20 2.24 3.34 Non-farm Non-poor 401 0.33 2.35 3.43 Non-farm Poor 134 0.31 2.26 3.31 Urban Non-poor 1744 0.16 1.15 1.68 Urban Poor 181 0.33 2.40 3.47 Total 3485 0.33 2.31 3.54 Shares of Total Income Gains (percent) Large/Medium Farmers 9.2 6.9 21.9 24.7 Small Farm Owners 14.4 17.5 24.6 24.0 Small Farm Renters 3.0 29.5 5.1 5.1 Agricultural Workers 2.8 1.7 2.7 2.7 Non-farm Non-poor 11.5 11.2 11.7 11.1 Non-farm Poor 3.9 3.6 3.8 3.6 Urban Non-poor 50.0 24.5 24.8 23.7 Urban Poor 5.2 5.1 5.4 5.1 Total 100.0 100.0 100.0 100.0 Source: Model simulations. a In billion rupees.
Dorosh, Niazi, and Nazli 274
REFERENCES Ahluwalia, Montek S. (1978) Rural Poverty and Agricultural Performance in India.
Journal of Development Studies, 298–323. Bell, Clive L., and Peter B. R. Hazell (1980) Measuring the Indirect Effects of an
Agricultural Investment Project on its Surrounding Region. American Journal of Agricultural Economics 62, 75–86.
Datt, Gaurav, and Martin Ravallion (1998) Farm Productivity and Rural Poverty in India. Journal of Development Studies No. 34.
Dorosh, Paul, and Steven Haggblade (2003) Growth Linkages, Price Effects and Income Distribution in Sub-Saharan Africa. Journal of African Economies 12:2.
Dorosh, Paul, Md. Khan Niazi, and Hina Nazli (2004) A Social Accounting Matrix for Pakistan 2001-02: Methodology and Results. Background paper prepared for the Pakistan Rural Factor Markets Study (Manuscript).
Hazell, P. B. R., and A. Roell (1983) Rural Growth Linkages: Household Expenditure Patterns in Malaysia and Nigeria. International Food Policy Research Institute, Washington, D.C. (Research Report 41.)
Hazell, P. B. R., and C. Ramasamy (eds.) (1991) The Green Revolution Reconsidered: The Impact of High-Yielding Rice Varieties in South India. Baltimore: The Johns Hopkins University Press.
Hussain, Zakir (2003) Rural Water Markets in Pakistan: Institutions and Constraints. Background paper prepared for the Rural Factor Market Studies. The World Bank, Washington, D. C.
Jacoby, Hanan G., and Ghazala Mansuri (2004) The (In)-Efficiency of Share-Tenancy Revisited: Evidence from Pakistan. (Draft Manuscript.)
Jacoby, Hanan G., and Ghazala Mansuri (2004a) Agricultural Credit and Farm Performance: Evidence from Pakistan. Background paper prepared for the Pakistan Rural Factor Markets Study (Manuscript).
Malik, Sohail J. (2003) Agricultural Growth and Rural Poverty in Pakistan: A Review of Evidence. Report to the Asian Development Bank, Pakistan Country Office (Manuscript).
Mellor, John W. (1978) Food Price Policy and Income Distribution in Low-income Countries. Economic Development and Cultural Change (January), 1–26.
Mellor, John W. (1976) The New Economics of Growth. Ithaca, NY: Cornell University Press.
Mellor, John W. (1992) Agriculture on the Road to Industrialisation. Baltimore: Johns Hopkins University Press.
Mellor, John W., and Sarah Gavian (1999) Determinants of Employment Growth in Egypt: The Dominant Role of Agriculture and the Rural Small-Scale Sector. Monitoring, Verification and Evaluation Unit, Agricultural Policy Reform Programme. Abt Associates, Inc. (Manuscript). (Impact Assessment Report No. 7.)
Distributional Impacts of Agricultural Growth 275
Pakistan Economic Analysis Network (EAN) Project (1989) Contributions and Interlinkages of the Food and Fiber System in Pakistan’s Economy. Islamabad, (Unpublished Manuscript). (Special Report Series No. 12.)
Pakistan, Government of (1998) Report of the National Commission on Agriculture. Ministry of Food and Agriculture.
Pakistan, Government of (2003) Pakistan Economic Survey (2002-03). Islamabad: Economic Adviser’s Wing, Finance Division. http://www.finance.gov.pk.
PIDE/World Bank (2002) Pakistan Rural Household Survey 2001-02. Pakistan Institute of Development Economics and World Bank, Washington, D. C.
Ravallion, Martin, and Gaurav Datt (2002) Why Has Economic Growth Been More Pro-Poor in Some States of India than Others? Journal of Development Economics, 381–400.
Thirtle, Colin (2001) Relationship between Changes in Agricultural Productivity and the Incidence of Poverty in Developing Countries. London. (DIVD Report No. 7946.)
Timmer, C. Peter (1997) How Well do the Poor Connect to the Growth Process? Harvard Institute for International Development, Cambridge. (CAER Discussion Paper No. 178.)
World Bank (2002) Pakistan Poverty Assessment: Poverty in Pakistan: Vulnerabilities, Social Gaps, and Rural Dynamics. Poverty Reduction and Economic Management Sector Unit. South Asia Region. (Report No. 24296-PAK.)