Distribution of sources of household air pollution: a ...
12
Page 1/12 Distribution of sources of household air pollution: a cross-sectional study in Cameroon Esong Miranda Baame ( [email protected] ) University of Dschang André Pascal Goura M.A. Santé Yaounde Cameroon Bertrand Hugo Ngahane Mbatchou Douala General hospital Berenice Walage University of Dschang: Universite de Dschang Herman Styve Yomi Simo University of Dschang: Universite de Dschang Romarique Mboumo Medjou University of Dschang: Universite de Dschang Martial Pianta Sonkoue University of Dschang: Universite de Dschang Cyrielle Douanla Djouda University of Dschang: Universite de Dschang Rose Suzie Fowoh Ngnewa University of Dschang: Universite de Dschang Milaine Sandra Teugueu Guiagain University of Dschang: Universite de Dschang Brice-Donald Kemnang Agokeng University of Dschang: Universite de Dschang Olivia Tania Megaptche Homla University of Dschang: Universite de Dschang Dan Pope University of Liverpool Jerome Ateudjieu M.A Santé Yaounde, Cameroon Research article Keywords: Indoor air pollution, household air pollution, LPG, fuel type, Dschang-Cameroon Posted Date: November 6th, 2020 DOI: https://doi.org/10.21203/rs.3.rs-21688/v3 License: This work is licensed under a Creative Commons Attribution 4.0 International License. Read Full License Version of Record: A version of this preprint was published on February 8th, 2021. See the published version at https://doi.org/10.1186/s12889-021-10350-6.
Transcript of Distribution of sources of household air pollution: a ...

Page 1/12
Distribution of sources of household air pollution: a cross-sectionalstudy in CameroonEsong Miranda Baame ( [email protected] )
University of DschangAndré Pascal Goura
M.A. Santé Yaounde CameroonBertrand Hugo Ngahane Mbatchou
Douala General hospitalBerenice Walage
University of Dschang: Universite de DschangHerman Styve Yomi Simo
University of Dschang: Universite de DschangRomarique Mboumo Medjou
University of Dschang: Universite de DschangMartial Pianta Sonkoue
University of Dschang: Universite de DschangCyrielle Douanla Djouda
University of Dschang: Universite de DschangRose Suzie Fowoh Ngnewa
University of Dschang: Universite de DschangMilaine Sandra Teugueu Guiagain
University of Dschang: Universite de DschangBrice-Donald Kemnang Agokeng
University of Dschang: Universite de DschangOlivia Tania Megaptche Homla
University of Dschang: Universite de DschangDan Pope
University of LiverpoolJerome Ateudjieu
M.A Santé Yaounde, Cameroon
Research article
Keywords: Indoor air pollution, household air pollution, LPG, fuel type, Dschang-Cameroon
Posted Date: November 6th, 2020
DOI: https://doi.org/10.21203/rs.3.rs-21688/v3
License: This work is licensed under a Creative Commons Attribution 4.0 International License. Read Full License
Version of Record: A version of this preprint was published on February 8th, 2021. See the published version athttps://doi.org/10.1186/s12889-021-10350-6.
Page 2/12
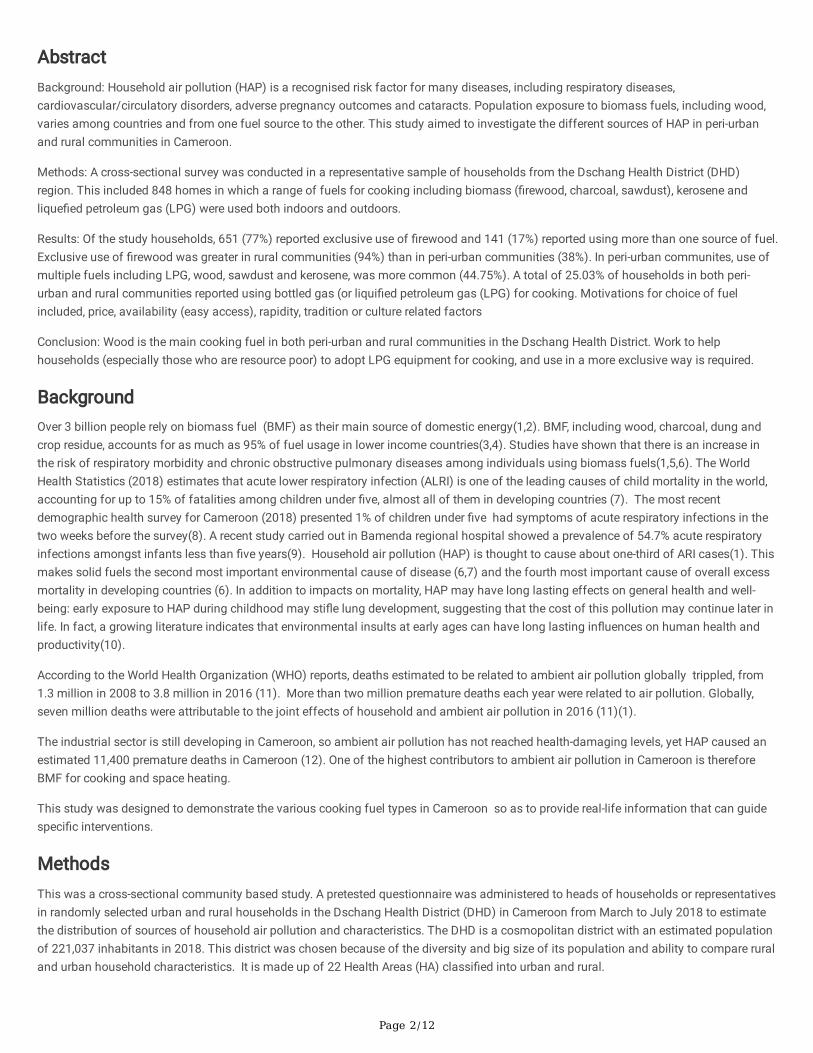
AbstractBackground: Household air pollution (HAP) is a recognised risk factor for many diseases, including respiratory diseases,cardiovascular/circulatory disorders, adverse pregnancy outcomes and cataracts. Population exposure to biomass fuels, including wood,varies among countries and from one fuel source to the other. This study aimed to investigate the different sources of HAP in peri-urbanand rural communities in Cameroon.
Methods: A cross-sectional survey was conducted in a representative sample of households from the Dschang Health District (DHD)region. This included 848 homes in which a range of fuels for cooking including biomass (�rewood, charcoal, sawdust), kerosene andlique�ed petroleum gas (LPG) were used both indoors and outdoors.
Results: Of the study households, 651 (77%) reported exclusive use of �rewood and 141 (17%) reported using more than one source of fuel.Exclusive use of �rewood was greater in rural communities (94%) than in peri-urban communities (38%). In peri-urban communites, use ofmultiple fuels including LPG, wood, sawdust and kerosene, was more common (44.75%). A total of 25.03% of households in both peri-urban and rural communities reported using bottled gas (or liqui�ed petroleum gas (LPG) for cooking. Motivations for choice of fuelincluded, price, availability (easy access), rapidity, tradition or culture related factors
Conclusion: Wood is the main cooking fuel in both peri-urban and rural communities in the Dschang Health District. Work to helphouseholds (especially those who are resource poor) to adopt LPG equipment for cooking, and use in a more exclusive way is required.
BackgroundOver 3 billion people rely on biomass fuel (BMF) as their main source of domestic energy(1,2). BMF, including wood, charcoal, dung andcrop residue, accounts for as much as 95% of fuel usage in lower income countries(3,4). Studies have shown that there is an increase inthe risk of respiratory morbidity and chronic obstructive pulmonary diseases among individuals using biomass fuels(1,5,6). The WorldHealth Statistics (2018) estimates that acute lower respiratory infection (ALRI) is one of the leading causes of child mortality in the world,accounting for up to 15% of fatalities among children under �ve, almost all of them in developing countries (7). The most recentdemographic health survey for Cameroon (2018) presented 1% of children under �ve had symptoms of acute respiratory infections in thetwo weeks before the survey(8). A recent study carried out in Bamenda regional hospital showed a prevalence of 54.7% acute respiratoryinfections amongst infants less than �ve years(9). Household air pollution (HAP) is thought to cause about one-third of ARI cases(1). Thismakes solid fuels the second most important environmental cause of disease (6,7) and the fourth most important cause of overall excessmortality in developing countries (6). In addition to impacts on mortality, HAP may have long lasting effects on general health and well-being: early exposure to HAP during childhood may sti�e lung development, suggesting that the cost of this pollution may continue later inlife. In fact, a growing literature indicates that environmental insults at early ages can have long lasting in�uences on human health andproductivity(10).
According to the World Health Organization (WHO) reports, deaths estimated to be related to ambient air pollution globally trippled, from1.3 million in 2008 to 3.8 million in 2016 (11). More than two million premature deaths each year were related to air pollution. Globally,seven million deaths were attributable to the joint effects of household and ambient air pollution in 2016 (11)(1).
The industrial sector is still developing in Cameroon, so ambient air pollution has not reached health-damaging levels, yet HAP caused anestimated 11,400 premature deaths in Cameroon (12). One of the highest contributors to ambient air pollution in Cameroon is thereforeBMF for cooking and space heating.
This study was designed to demonstrate the various cooking fuel types in Cameroon so as to provide real-life information that can guidespeci�c interventions.
MethodsThis was a cross-sectional community based study. A pretested questionnaire was administered to heads of households or representativesin randomly selected urban and rural households in the Dschang Health District (DHD) in Cameroon from March to July 2018 to estimatethe distribution of sources of household air pollution and characteristics. The DHD is a cosmopolitan district with an estimated populationof 221,037 inhabitants in 2018. This district was chosen because of the diversity and big size of its population and ability to compare ruraland urban household characteristics. It is made up of 22 Health Areas (HA) classi�ed into urban and rural.

Page 3/12
The minimum sample size was estimated assuming a proportion of 50% of the population used biomass (since the prevalence of HAP wasunknown, to the best of our knowledge), a 95% con�dence level, a 5% relative precision, a cluster effect of 2 and a 20% nonresponse rate.
Multistage strati�ed random sampling was performed among 22 HA to select 11 HA with equal representation of urban (2/4) and rural(9/18) health areas. Within selected health areas, villages/quarters were selected by simple randomisation from the list of clustersobtained from the National Institute of Statistics. The sample required from each health area was calculated with respect to theirrepresentativity in the general population (2018). In villages/quarters, a guide was solicited from the local traditional authorities and thecentral spot was identi�ed. On the left/right side of the street, one household was targeted after one was skipped till the end of the street.The process was repeated until the expected sample size of households for the village was reached.
A household was de�ned in this study as one or more persons living together, sharing the same roof and kitchen. All unoccupied buildingswere excluded and replaced by the one immediately next to it.
Data collection and management
In targeted households, data was collected from head of households or representative after verbal/signed consent was obtained. Data wascollected using a structured questionnaire administered in face to face interview by a trained surveyor. For each household, data wascollected on socio demographic information and characteristics of indoor sources of air pollution including fuels used for cooking. Primarycooking fuel was de�ned as the fuel used mainly by a household for cooking(4). Secondary cooking fuel was de�ned as the fuel used as abackup for fuel-speci�c cooking activities by a household.
Resulting forms were veri�ed daily to assess quality and completion. The resulting database was cleaned and analyzed by a statisticianusing Epi info version 7.2.2 software. Main analysis performed were proportions with a 95% con�dence interval and tables were designedusing MS-Excel 2013.
Ethical considerations
The proposal of this study was submitted and evaluated by the National Ethics Committee of Human Health Research of Cameroon andapproval was given with the reference number 1030. Prior to this evaluation, authorization was obtained in a signed document from localhealth authorities of the DHD. For each village/quarter, authorization was obtained from local traditional authorities. Data was collectedfrom consenting households.
ResultsEleven health areas were selected – 2/4 in urban and 9/18 in rural setting - leading to a �nal sample of 848 households (98% responserate) within 85 villages/quarters. The study sample included 257 urban and 591 rural household. Approximately 80% of respondents werefemales. The mean age of respondents was 38 ( 18.8) years, median age was 33 [range: 15 – 97] years. Average household size was 5(Table 2). Nearly 15% of female respondents had never been to school and 60% of female participants reported peasant farming as theirmain occupation.
Table 1: Distribution of households reached in targeted health areas with population in 2018 by cluster and setting.

Page 4/12
Targeted Health Areas of thestudy
Urban orRural
Population size in 2018(inhabitants)
Clusters
(Reached/Expected)
Householdsreached
Fiala-Foreke (1) Urban 34,760 20/20 197
Balevouni (2) Rural 1,856 1/1 12
Nkeuli (3) Rural 2,691 2/2 19
Fotetsa (4) Rural 5,128 3/3 28
Maka (5) Urban 10,804 6/6 60
Fonakeukeu (6) Rural 5,149 3/3 30
Lepoh (7) Rural 10,472 6/6 60
Ndoh-Djuttitsa (8) Rural 13,663 9/9 93
Baleveng (9) Rural 20,658 12/12 118
Doumbouo (10) Rural 16,908 10/10 99
Mbeng (11) Rural 20,508 13/13 132
TOTAL / 142,597 85/85 848
Table 2: Socio-demographic presentation of the study sample.

Page 5/12
Characteristics Modalities Urban Rural Total P value
Reachedhouseholds (n) / 257 591 848
Response rate (%) / 99.2 100 99.8
Gender
[n (%)]
Female 187 (72.8) 481 (81.4) 668 (78.8) 0.005
Male 70 (27.2) 110 (18.6) 180 (21.2)
Age of respondent
(µ ± SD)
/ 31.1 ± 12.9 41.5 ± 20.0 38.3± 18.8 < 0.0005
Average household size
(µ ± SD)
/ 5.4 ± 2.8 4.7 ± 2.4 4.9 ± 2.6 < 0.0005
Mother’s level of education [n (%)] No school 13 (5.5) 96 (16.3) 109 (13.2) < 0.0005
Primary 63 (26.7) 307 (52.0) 370 (44.8)
Secondary 112 (47.5) 181 (30.7) 293 (35.5)
Higher 48 (20.3) 6 (1.0) 54 (6.5)
Father’s level of education [n (%)] No school 10 (4.4) 103 (18.0) 113 (14.1) < 0.0005
Primary 70 (30.6) 275 (48.2) 345 (43.1)
Secondary 92 (40.2) 168 (29.4) 181 (32.5)
Higher 57 (24.9) 25 (4.4) 6 (10.2)
Mother’s occupation
[n (%)]
Housewife 47 (20.0) 29 (4.9) 76 (9.3) < 0.0005
Farming 55 (23.4) 452 (77.4) 507 (61.9)
Self-employment 69 (29.4) 73 (12.5) 142 (17.3)
Civil servant 29 (12.3) 23 (3.9) 52 (6.3)
Student 35 (14.9) 7 (1.2) 42 (5.1)
Main sources of Household air pollution in the DHDFrom this study, 90% of households used �rewood and about 75% (630 households) of them exclusively used wood. Almost all households(98%) used wood to meet at least some of their cooking needs in rural HAs. Our results also reveal that 25% household have access todomestic gas for cooking, with a higher proportion in urban areas (55.6%) (Table 3). Figure 1 & 2 show the pictures of a charcoal and�rewood fuel source, snapped in two separate households enrolled in the study. P-value less than 0.0005 as presented in table 3 means thedifference in proportion between urban and rural settings is statistically signi�cant.
Table 3: Distribution of cooking fuel types in the households of the Dschang Health District

Page 6/12
Cooking instruments Urban [n (%)] Rural [n (%)] Total [n (%)] P value
Firewood only* 97 (37.7) 533 (74.3) 630 (74.3) < 0.0005
Firewood 191 (74.3) 577 (97.8) 768 (90.6) < 0.0005
Gas only* 38 (14.8) 10 (1.7) 48 (5.7) < 0.0005
Gas 143 (55.6) 69 (11.7) 212 (25.0) < 0.0005
Kerosene stove 14 (5.5) 12 (2.0) 26 (3.1) 0.008
Charcoal 33 (12.8) 6 (1.0) 39 (4.6) < 0.0005
Saw dust 26 (10.1) 6 (1.0) 32 (3.0) < 0.0005
* Exclusive use of the fuel type
Approximately 75% of households in the DHD use more than one cooking fuel type (Table 4). However, rural areas are signi�cantly lesslikely to ‘stack’ fuels (11%).
Table 4: Distribution of multiple cooking fuel type utilization in the Dschang Health District
Number of cooking fuel sources Urban [n (%)] Rural [n (%)] Total [n (%)] P value
More than one source of cooking fuel 114 (44.4) 67 (11.3) 630 (74.3) < 0.0005
More than two sourcesof cooking fuel 29 (11.3) 4 (0.7) 33 (3.9) < 0.0005
More than three sources of cooking fuel 8 (3.1) 0 (0.0) 8 (0.9) < 0.0005
It is important to note that no one was found to use an electric cooker or a micro wave.
Factors in�uencing the choice of cooking fuel type
Nearly 60% of households choose their fuel type based on affordability and only 18% based on availability (Tables 5 and 6). Availabilitymeant the presence of the fuel type in the surroundings of the household.
Table 5: Distribution of reasons in�uencing choice of cooking fuel type in the Dschang Health District.
Reasons Urban[n (%)] Rural [n (%)] Total [n (%)] P value
Affordability 130 (50.6) 375 (63.4) 505 (59.5) < 0.0005
Availability 27 (10.5) 122 (20.6) 149 (17.6)
Rapidity 44 (17.1) 31 (5.2) 75 (8.8)
Culture 8 (3.1) 40 (6.8) 48 (5.7)
Easy to use 33 (12.8) 17 (2.9) 50 (5.9)
Cleanliness 10 (3.9) 5 (0.8) 15 (1.8)
Other reason 5 (1.9) 1 (0.2) 6 (0.7)
Table 6: Distribution of main reasons of choice per main cooking fuel types in the Dschang Health District.

Page 7/12
Firewood [n(%)]
Gas [n(%)]
Charcoal[n (%)]
Reasons U R T P value U R T Pvalue
U R T Pvalue
Affordability 118(61.8)
373 (64.5) 491(63.9)
<0.0005 52(36.4)
37(53.6)
89(42.0)
0.08 16(48.5)
4(66.7)
20(51.3)
0.05
Culture 8 (4.2) 40 (6.9) 48(6.2)
4 (2.8) 3(4.4)
7(3.3)
0(0.0)
0(0.0)
0(0.0)
Rapidity 22(11.5)
28 (4.8) 50(6.5)
36(25.2)
9(13.0)
45(21.2)
5(15.2)
0(0.0)
5(12.8)
Cleanliness 5 (2.6) 3(0.5) 8 (1.0) 8 (5.6) 2(2.9)
10(4.7)
4(12.1)
0(0.0)
4(10.3)
Easy to use 12(6.3)
13 (2.2) 25(3.2)
25(17.5)
6(8.7)
31(14.6)
7(21.2)
0(0.0)
7(17.9)
Availability 24(12.6)
120 (20.8) 144(18.7)
15(10.5)
11(15.9)
26(12.3)
1(3.0)
2(33.3)
3(7.7)
Otherreason
2 (1.1) 1 (0.2) 3 (0.4) 3 (2.1) 1(1.4)
4(1.9)
0(0.0)
0(0.0)
0(0.0)
U= Urban; R=Rural; T=Total
Burden of exposure to sources household of air pollution.
Figure 3 shows the frequency of both lone and multiple cooks in households. In 9 out of 10 households interviewed, women were reportedto be the main cook. Children were involved in cooking in more than 60% of the households and men in only 7% of the households. It is tobe emphasised that only the mothers in 270 (31.84%) and the children in 42(4.95%) were in charge of the cooking.
Food was cooked an average of one time (1.3± 0.5) per day in study households, with no variation between rural and urban areas. Morethan ¾ of households have been using their primary fuel type for more than �ve years (Table 7). Firewood has been used for the entirelifespan in almost all the households.
Table 7: Duration of usage of principal fuel type
Fuel types Duration Urban Rural Total P value
n (%) (95% CI) n (%) (95% CI) n (%) (95% CI)
Firewood <= 5 yrs 14 (7.3) (4.1 – 12.0) 9 (1.6) (0.8 – 2.9) 23 (3.0) (2.0 – 4.5) <0.0005
> 5 yrs 177 (92.7) (88.0 – 95.9) 569 (98.4) (97.1 – 99.2) 746 (97.0) (95.5 – 98.0)
Gas <= 5 yrs 40 (28.0) (20.8 – 36.1) 10 (14.5) (7.2 – 25.0) 50 (23.6) (18.0 – 29.9) 0.03
> 5 yrs 103 (72.0) (63.9 – 79.1) 59 (85.5) (75.0 – 92.8) 162 (76.4) (70.1 – 82.0)
Charcoal <= 5 yrs 6 (18.2) (7.0 – 35.5) 1 (16.7) (0.4 – 64.1) 7 (17.5) (7.5 – 33.5) 0.93
> 5 yrs 27 (81.8) (64.5 – 93.0) 5 (83.3) (35.9 – 99.6) 32 (82.0) (66.5 – 92.5)
Kerosene <= 5 yrs 4 (28.6) (8.4 – 58.1) 1 (8.3) (0.2– 38.5) 5 (19.2) (6.5 – 39.3) 0.19
> 5 yrs 10 (71.4) (41.9 – 91.6) 11 (91.7) (61.5 – 99.8) 21 (80.8) (60.6 – 93.4)
Saw dust <= 5 yrs 4 (15.4) (4.4 – 34.9) 1 (16.7) (0.4 – 64.1) 5 (15.6) (5.3– 32.8) 0.94
> 5 yrs 22 (84.6) (65.1 – 95.6) 5 (83.3) (35.9 – 99.6) 27 (84.4) (67.2 – 94.7)
DiscussionThis study describes the different primary fuel types used by households in a highly populated district in Cameroon. The use of �rewoodturned to be more dominant comparatively to the use of other fuels, though available. The population preferred to use wood since they
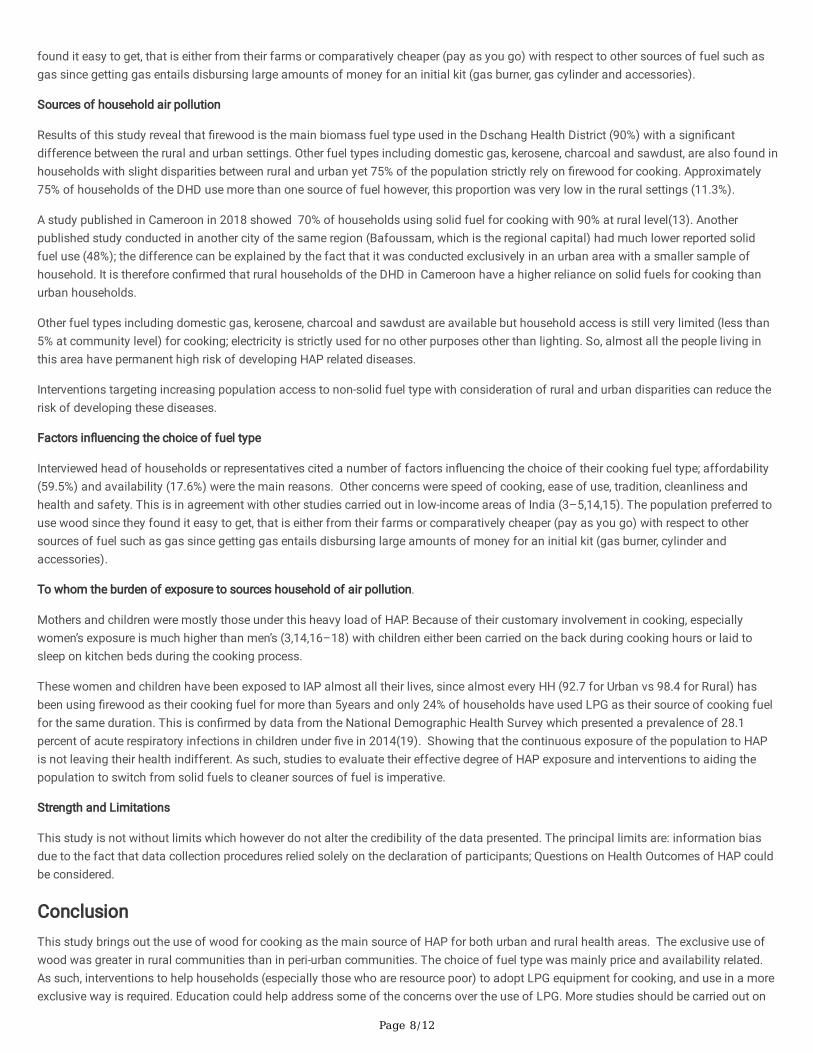
Page 8/12
found it easy to get, that is either from their farms or comparatively cheaper (pay as you go) with respect to other sources of fuel such asgas since getting gas entails disbursing large amounts of money for an initial kit (gas burner, gas cylinder and accessories).
Sources of household air pollution
Results of this study reveal that �rewood is the main biomass fuel type used in the Dschang Health District (90%) with a signi�cantdifference between the rural and urban settings. Other fuel types including domestic gas, kerosene, charcoal and sawdust, are also found inhouseholds with slight disparities between rural and urban yet 75% of the population strictly rely on �rewood for cooking. Approximately75% of households of the DHD use more than one source of fuel however, this proportion was very low in the rural settings (11.3%).
A study published in Cameroon in 2018 showed 70% of households using solid fuel for cooking with 90% at rural level(13). Anotherpublished study conducted in another city of the same region (Bafoussam, which is the regional capital) had much lower reported solidfuel use (48%); the difference can be explained by the fact that it was conducted exclusively in an urban area with a smaller sample ofhousehold. It is therefore con�rmed that rural households of the DHD in Cameroon have a higher reliance on solid fuels for cooking thanurban households.
Other fuel types including domestic gas, kerosene, charcoal and sawdust are available but household access is still very limited (less than5% at community level) for cooking; electricity is strictly used for no other purposes other than lighting. So, almost all the people living inthis area have permanent high risk of developing HAP related diseases.
Interventions targeting increasing population access to non-solid fuel type with consideration of rural and urban disparities can reduce therisk of developing these diseases.
Factors in�uencing the choice of fuel type
Interviewed head of households or representatives cited a number of factors in�uencing the choice of their cooking fuel type; affordability(59.5%) and availability (17.6%) were the main reasons. Other concerns were speed of cooking, ease of use, tradition, cleanliness andhealth and safety. This is in agreement with other studies carried out in low-income areas of India (3–5,14,15). The population preferred touse wood since they found it easy to get, that is either from their farms or comparatively cheaper (pay as you go) with respect to othersources of fuel such as gas since getting gas entails disbursing large amounts of money for an initial kit (gas burner, cylinder andaccessories).
To whom the burden of exposure to sources household of air pollution.
Mothers and children were mostly those under this heavy load of HAP. Because of their customary involvement in cooking, especiallywomen’s exposure is much higher than men’s (3,14,16–18) with children either been carried on the back during cooking hours or laid tosleep on kitchen beds during the cooking process.
These women and children have been exposed to IAP almost all their lives, since almost every HH (92.7 for Urban vs 98.4 for Rural) hasbeen using �rewood as their cooking fuel for more than 5years and only 24% of households have used LPG as their source of cooking fuelfor the same duration. This is con�rmed by data from the National Demographic Health Survey which presented a prevalence of 28.1percent of acute respiratory infections in children under �ve in 2014(19). Showing that the continuous exposure of the population to HAPis not leaving their health indifferent. As such, studies to evaluate their effective degree of HAP exposure and interventions to aiding thepopulation to switch from solid fuels to cleaner sources of fuel is imperative.
Strength and Limitations
This study is not without limits which however do not alter the credibility of the data presented. The principal limits are: information biasdue to the fact that data collection procedures relied solely on the declaration of participants; Questions on Health Outcomes of HAP couldbe considered.
ConclusionThis study brings out the use of wood for cooking as the main source of HAP for both urban and rural health areas. The exclusive use ofwood was greater in rural communities than in peri-urban communities. The choice of fuel type was mainly price and availability related.As such, interventions to help households (especially those who are resource poor) to adopt LPG equipment for cooking, and use in a moreexclusive way is required. Education could help address some of the concerns over the use of LPG. More studies should be carried out on

Page 9/12
HAP in other regions of Cameroon so that a true picture of the nation’s state as concerns household air pollution be exposed, to bring outthe relationship or association between indoor air pollution and respiratory related diseases and other health impacts, and to measure thedegree of exposure to indoor air pollution.
DeclarationsEthics approval and consent to participate
The proposal of this study was submitted and evaluated by the National Ethics Committee of Human Health Research of Cameroon(reference number 1030). Prior to this evaluation, authorization was obtained from local health authorities of the DHD and for eachvillage/quarter, authorization was obtained from local traditional authorities. Data was collected from consenting households and personaldata are not published in this study.
Consent for publication
Not applicable
Availability of data and material
The database of this study is not available online but can be shared on request from the author.
Competing interests
The authors declare that they have no competing interests.
Funding
The study was funded by the principal investigator, who was involved in the design of the study and collection, analysis, and interpretationof data and in writing the manuscript.
Authors' contributions
Conception and design of the study and data collection tools: MBE and JA;
Data collection and entry: MBE, WB, HSYS, BDKA, OTMH, CDD, RSFN, MSTG;
Database cleaning and data analysis: APG;
Drafting and editing the manuscript: EMB, APG, DP, BHNM, MPS
All authors red and approved the �nal manuscript.
Acknowledgements
The authors hereby thank all:
The health and traditional authorities for giving them access into their communities;
Interviewees for their patience and collaboration during the data collection.
AbbreviationsDHD: Dschang Health District
HA: Health Area
HH: Household
HD: Health District
IAP: indoor Air Pollution

Page 10/12
ARI: Acute Respiratory Infection
References1. Fullerton DG, Semple S, Kalambo F, Suseno A, Malamba R, Henderson G, et al. Biomass fuel use and indoor air pollution in homes in
Malawi. Occup Environ Med. 2009 Nov;66(11):777–83.
2. Langbein J. Firewood, smoke and respiratory diseases in developing countries—The neglected role of outdoor cooking. PLoS One[Internet]. 2017 Jun 28 [cited 2019 May 8];12(6). Available from: https://www.ncbi.nlm.nih.gov/pmc/articles/PMC5489158/
3. Agrawal S, Yamamoto S. Effect of indoor air pollution from biomass and solid fuel combustion on symptoms ofpreeclampsia/eclampsia in Indian women. Indoor Air. 2015 Jun;25(3):341–52.
4. Manish A. Desai KRS. Indoor smoke from solid fuels Assessing the environmental burden of disease at national and local levels[Internet]. World Health Organization Protection of the Human Environment Geneva 2004; 2004. Available from:https://www.who.int/quantifying_ehimpacts/publications/en/Indoorsmoke.pdf
5. Gupta D, Agarwal R, Aggarwal AN, Maturu VN, Dhooria S, Prasad KT, et al. Guidelines for diagnosis and management of chronicobstructive pulmonary disease: Joint ICS/NCCP (I) recommendations. Lung India. 2013 Jan 7;30(3):228.
�. Bruce N, Perez-Padilla R, Albalak R. Indoor air pollution in developing countries: a major environmental and public health challenge.Bull World Health Organ. 2000;78(9):1078–92.
7. Forum of International Respiratory Societies. The Global Impact of Respiratory Disease [Internet]. European Respiratory Society; 2017.Report No.: 2nd edition. Available from: https://www.who.int/gard/publications/The_Global_Impact_of_Respiratory_Disease.pdf
�. National Institute of Statistics C. 2018 Demographic and Health Survey [Internet]. Cameroon: National Institute of Statistics; 2019.Available from: https://dhsprogram.com/pubs/pdf/SR266/SR266.pdf
9. Tazinya AA, Halle-Ekane GE, Mbuagbaw LT, Abanda M, Atashili J, Obama MT. Risk factors for acute respiratory infections in childrenunder �ve years attending the Bamenda Regional Hospital in Cameroon. BMC Pulm Med [Internet]. 2018 Jan 16 [cited 2020 Sep16];18. Available from: https://www.ncbi.nlm.nih.gov/pmc/articles/PMC5771025/
10. Santus P, Russo A, Madonini E, Allegra L, Blasi F, Centanni S, et al. How air pollution in�uences clinical management of respiratorydiseases. A case-crossover study in Milan. Respir Res. 2012;13(1):95.
11. World Health Organisation. WORLD HEALTH STATISTICS 2018 [Internet]. WHO; 2018. Available from:https://apps.who.int/iris/bitstream/handle/10665/272596/9789241565585-eng.pdf?ua=1
12. Cameroon M of PH. HEALTH SECTOR STRATEGY 2016-2027 [Internet]. 2016. Available from:https://www.minsante.cm/site/sites/default/�les/HSS_english_0.pdf
13. Pope D, Bruce N, Higgerson J, Hyseni L, Stanistreet D, MBatchou B, et al. Household Determinants of Liqui�ed Petroleum Gas (LPG) asa Cooking Fuel in SW Cameroon. EcoHealth. 2018 Dec;15(4):729–43.
14. Behera D, Balamugesh T. Indoor air pollution as a risk factor for lung cancer in women. J Assoc Physicians India. 2005 Mar;53:190–2.
15. Pye A, Ronzi S, Mbatchou Ngahane BH, Puzzolo E, Ashu AH, Pope D. Drivers of the Adoption and Exclusive Use of Clean Fuel forCooking in Sub-Saharan Africa: Learnings and Policy Considerations from Cameroon. Int J Environ Res Public Health [Internet]. 2020Aug [cited 2020 Sep 16];17(16). Available from: https://www.ncbi.nlm.nih.gov/pmc/articles/PMC7459573/
1�. Ranabhat CL, Kim C-B, Kim C-S, Jha N, Deepak KC, Connel FA. Consequence of Indoor Air Pollution in Rural Area of Nepal: A Simpli�edMeasurement Approach. Front Public Health [Internet]. 2015 [cited 2019 Jul 6];3. Available from:https://www.frontiersin.org/articles/10.3389/fpubh.2015.00005/full
17. Lu C-Y, Kang S-Y, Liu S-H, Mai C-W, Tseng C-H. Controlling Indoor Air Pollution from Moxibustion. International Journal ofEnvironmental Research and Public Health. 2016 Jun 20;13:612.
1�. Cameroon - ministerial outcome.pdf [Internet]. [cited 2019 Jul 21]. Available from:https://wedocs.unep.org/bitstream/handle/20.500.11822/21238/Cameroon%20-%20ministerial%20outcome.pdf?sequence=3&isAllowed=y
19. National Institute of Statistics. 2014 Demographic and Health Survey [Internet]. National Institute of Statistics; 2015. Available from:https://mics-surveys-prod.s3.amazonaws.com/MICS5/West%20and%20Central%20Africa/Cameroon/2014/Final/Cameroon%202014%20MICS_French.pdf
Figures

Page 11/12
Figure 1
Picture of a charcoal fuel sources, taken in a household enrolled in the study.
Figure 2
Picture of a �rewood fuel source at household level. This picture was snapped in a household enrolled in the study.

Page 12/12
Figure 3
Distribution (%) of persons in charge of cooking in households of the Dschang Health District.
Supplementary Files
This is a list of supplementary �les associated with this preprint. Click to download.
QUESTIONNAIRE.pdf
STROBEchecklistv4combinedPlosMedicine.pdf