DISTRIBUTED M. - dtic.mil · G 100 JeI20 J 20 CleClevis Clevis November 1972 Blake #1 Blake #4 Fig....
53
AD/A-001 130 LRAPP VERTICAL ARRAY C. H. Jones Westinghouse Research Laboratories Prepared for: Otfice of Naval Research Defense Contract Administration Services District 5 November 1973 DISTRIBUTED M.: NOWi Toeie bhu.snulc U. S. DEPARTMENT OF COMEROE
Transcript of DISTRIBUTED M. - dtic.mil · G 100 JeI20 J 20 CleClevis Clevis November 1972 Blake #1 Blake #4 Fig....

AD/A-001 130
LRAPP VERTICAL ARRAY
C. H. Jones
Westinghouse Research Laboratories
Prepared for:
Otfice of Naval ResearchDefense Contract Administration ServicesDistrict
5 November 1973
DISTRIBUTED M.:
NOWi Toeie bhu.snulcU. S. DEPARTMENT OF COMEROE

Un-cLi=.-ifiedSECURITY CLASSIFICATION OF T41S PAGE (lWhmn Date Fntoere_ _
READ RJSTUCIIONSREPORT DO MENTATION PAGE BEFORE COMPLETING FORMI. REPOT NUM . 2. GOVT ACCESSION4 NO S. 3tECIPIE T'S CATALOG NSER
4. TITLE (Ord $yb•i4le) $. TYP Of REPORT & PEROD COVERED
LR)hPP VERTICAL ARRAY - PHASE III Technical ReportApril 1 to August 30, 1973
C. PERFORMING OnG. REPORT NUMBER
___________ ______________________ 7 3-9I47-VEMAY-R27. AUTHOR(e) S. CONTRACT O GRANT NUIVIER(a)
C. H. Jones N00014-72-C-0120
9. PERFlrMING ORGANIZATION NAME AND ADDRESS .0. PnOGRAM ELEMENT. PROJECT, TASI.
Westinghouse Electric Corporation AR292 0&4/5 22 73 (469)
Research & Development Center
Beulah Road, Pittsburgh, PA 15235II. CONTROLLING OFFICE NAME AND ADDRES 12. REPORT DATE
Procuring Contracting Officer November 5, 1973Office of Naval Research Is. NUMBER OF PAGESDepartment of the Nave"Arlington, VA 22217 1'-4
14. MONITORING AGENCY NAME & AODRESS(if dilferet from Contrlti 0111'Of' IS. SECURITY CLASS. (of due report)Commander, Defense Ccontract Administration UnclassifiedServices District1610-S Federal Building, 1000 Liberty Aven 11Z DCASSIFICATIONIDOWNGRAD4NG
Pittsburgh, PA 15222 SCHEDULE
IS. ODSTRIBUTION STATEMENT (*I th. Report)
h4xpaoed imOb~
I?. DISTRIBUTION STATEMENT (of the abstract entered In Block 20, if dIf.,tf~ them Report)
NA
IS. SUPPLEMENTARY NOTESReproduced by
NATIONAL TECHNICALINFORMATION SERVICEU S Department of Commerce
Springfield VA 22151
IS. KEY WORDS (Contina. reerse , , de if n.ce.s.ar ad Ide.n 4' b.y ock • ub.er.)
Acoustics Vertical cablec signalsocean arrays connes:'ors preamplifiersnoise hydrophones pressure ratiosline acced.eration release
20 ADSTRACT (Conitinu an reverse side It necooar.y and Identify by' block numnb"t)
An earlier report describes a vertical array of acoustic hyirophonesthat were built in 1972 for measuring noise in the ocean over the tiequencyspectrum from 10 Hz to 300 Hz. This report describes modifications in theequipment that were made for two deployments at the Blake Basin in theAtlantic Ocean.
i
DDI ORM 1473 EDITION OF I NCV ,S IS OBSOLETEDO i 2147 Unclassified
SECURITY CLASSIFICATION OF THIS PAGE (Whna Dste Er•nfto

i
II
tI TABLE OF CONTENTS
Page
1. INTRODUCTION
[ 2. BHDROPHONES AND PREAMPLIFIERS 5
3. CABLES AN) CONNECTORS 7
4 £. TEST AMPLIFIERS 11
5. HYDROPHONE SYSTEM SENSITIVITY AND TERMINATION AMPLIFIERS 17
L 6. POWER CONVERTER 21
7. TESTS 25
7.1 Orlando 25
7.2 Pittsburgh 25
7.3 Jupiter 32
7.4 Galveston 35
8. CONCLUSIONS 46
9. REFERENCES 47
I.
S!.
•°i

71,
I
1. INTRODUCTION
A set of low noise, high sensitivity acceleration canceling
hydrophones were built and tested in 1972 for winchable vertical arrays
to be used at depths to 5,000 meters. In the spring of 1973 cables and
associated equipment were prepared for two deployments on the Blake
Plateau. A single hydrophone is shown in Fig. 1, an array of hydrophones
reeled onto a drum is illustrated in Fig. 2, and a partially exploded view
of a cable connector is shown in Fig. 3.

A#
0
00S-H
2
RM61

I-
I;I
Fig. 2 - Reel with a 4,000 Meter Array Containing Six Hydrophones
3
RM-6 1615
0
0 V
-H I
-0 4)
0 0
2. HYDROPHONES AND PREAMPLIFIERS
The hydrophones were basically the same units that were used
in the November 1972 tests and which have been described in previous
repirts 2 ' However, it was found that silver coating on most of the
ceramic cylinders was attacked by sulfur so that patches of the coating
became nonconducting. These cylinders were replaced by ones with a
nickel coating and a 1old flash. These I 'e proven very satisfactory.
Some of the potted preamplifiers attached to the hydrophones
as illustrated in Fig. 3 behaved in an erratic way. Although the
surfaces of all of the semiconductor elements were passivated before
being potted in poJyurethane the forces exerted during pressure cycling
sometimes caused the gain of the amplifiers to drop to zero. Therefore,
as s back-up effort, experiments were made with two new encapsulation
methods. The first consisted of cutting off the lids of the transistor
cans, attaching a Tygon tube filled with moisture-free castor oil.
The second method consisted of sealing the units inside of a pressure
tight al-ainum cylinder. Figure 4 shows three transistors with oil-
filled tubv-s attached. On the left is an aluminum capsule covered with
black tape. Both types of encapsulation proved satisfactory under pressure
cycling. The second method was chosen because it isolates the semi-
conductor assembly from any large pressure changes. Before being tested
at the Naval Research Laboratory at Orlando, Florida, hyerophone-preamplifiers
are pressure cycled 10 times to 55 MPa at 4*C. The pressure is increased
linearly over a 15 minute period in order to avoid damaging the low noise
input stage of the preamp.
I'S

F -
I1' 04-4
00.0
U
0S.d
a)U0S..
-' 0*
0.44
5
000
00a)
jS.'04JU
.44U005.4
1-4
0
'-4.44
0
00S...0I-4
.04J.4.4
S.d0
.4.4mA 4.4
A WY'-4
-. 0.SrSV 4)S..
bO'44
6
ft�f-�i6r

rp]
3. CABLES AND CONNECTORS
The cable lengths rined in the two Blake Deployments are shown
in Fig. 5. A new coupling unit shown in Fig. 6 was designed which made
it practical to couple cables B and D together to provide a 7,600 ft
cable length. The new cables, H, I. J, and K were made as described in
reference 2. In the 1972 deployment some of the connectors were
damaged because water ftiled to flow into the space behind the connector.
These connectors were potted into the mechanical cone which clamped the
steel cable strands. In order to prevent a pressure buildup, two holes
were drilled to provide easy access for free flooding behind the connector.
Broken hollow roll pins were replaced with solid index pins.
In order to facilitate connection of the cable connectors,
the fixture shown in Fig. 7 was built. This made it easy to hold the
two parts of the connector while the split coupler was being assembled.3
A detailed report covering the cables, terminations, and
connectors wa written by C. Hikes of ;- OR&EC.
A split metal cylinder is used to couple the cable to the
hydrophone. Figure 3 shows half of such a cylinder in place around
the male connector and the preamplifier and the other half removed.
Before assembly che "O-ring" groove was coated with row Corning 14
Silicone Dialectric. The inside surface of tne split coupler was coated
with Lubriplate made by Fisk Bros. Refining Corp. to reduce corrosion
and to make it easier to assemble the coupler. After the deployment
it was found that on many of the hydrophones the split cylinder had
pinched the polyurethane and caused the connector to leak. The inside
diameter of the coupler will be increased to eliminate the pinching
problem.
7

0ITClevis Spare Hydrophone
A 50 feet#27
50tAll #1 Hvdrophone
clevis H 2000A 50 ft.I
W2 #1 IICoupler
B 2000
D 5600
W24 #2 ClevisA 50 ft.
C 4000 All ) #1K 500
A8 #2 A8 #2
W15 Q 03 E 1000 E loco
D 5600 #o #3 A1o #3
H 1000 H 1000
W420 #4 A3 #4 A3 #4
E 1000 I 1000 I 1000
W422 #5 A14 6515 A14 #5F 300 F 1 300 F 1300W27 #6 A15 #6 A.15 #6G 100 JeI20 J 20
CleClevis Clevis
November 1972 Blake #1 Blake #4
Fig. 5 - ACODAC Configurations of ') Hydrophones withCable Designation Letters
8
U
--- t0
S4U,
-V.
C-

r4.
C-,
4.4
.4)
-HV
0• I.0
100
RM66
RM66

'1:
4. TEST AMPLIFIER
In order to make electrical calibration runs with the RPM
(record power module) and the cables, three dummy amplifiers, designated
J, K, and L, were built and tested. These were identical to the hydro-
phone preamplifier circuits except that they had an impedance connected
to the input to simulate the measured transducer impedance. See F.1g. 8.
The gain of these three units is given in Table 1 and is shown graphically
in Fig-. 9, 10 and ii.
! 11
OU)
4)0'" p
1 12 9
Hi I~Ji (~ .I
112

Table 1 - Gains of the Three Dummy AmplifiersSJ• with the Orlando Termination Amplifier
Gain in dBFrequency
Hz Unit "J" Unit "K" Unit "L"
1000 59.6 59.7 59.7
700 59.7 59.8 59.8
500 59.8 59.9 59.8
200 59.8 59.9 59.9
100 59.8 60.0 59.9
70 59.8 59.9 59.8
50 59.8 59.9 59.9
20 59.8 59.8 59.8
10 59.9 59.8 59.6
7 61.0 60.0 59.6
5 61.3 61.0 60.0
3.0 - - 63.2
3.3 - 65.6 --
3.5 66.4 -- --
2 46.0 48.9 52.0
1 32.0 32.0 38.1
13

,- ft
;: -
-, --
Allt4-
--
-
"14 "
-- - ":-
- -'r- -- - I -"-
: . -: ,
- -. -i .4 .
2....-.- .. -.-.. - - -I.
•I .4. .'' *
I- - i ' .- -* "- -,.. "
":7. .. ..
" ;
2- -- 1 2. , ... -.-.
* Ljffl I + , u i

* �. - . r..rw.�,T.rfl!' rr.7'.!.v .nr.�-.�7.�7.wvrYr.nr-rw.�.., .r.7rrr<r.�
x
i 1
Re- ___
�1 .7,, - Eq.-. 4 --- $- 4.-�-.. - j S
*8*4 5..-- .7- - 4tTrit7t, -i--- - 71J
- - -. - .-.-----. - - 4e.d 45 - -I � *4
4- � K -
- -
tT± 7 -
* .. .-. .
- t--.- -� -
U*4
'TI b.
- -�4 -
- . . -
- -t -h- -� -�
� .�.... - -
I -.- -*-
1 7.
I .....- ",,
3-
-a
4 * �
2.-. �. - - -- - - I
4-.--- -4--- - .. - .- '-.- --�1--
*..........- ___* 1.- �e-�- --
.u.::�-i- . .
-. . . . .
- - - .:z* - - -
*1'..[&iff.j� ± _
� 15�

0
I- !-4--4-4�4�-i44 �� � I
L. - .,-..-..-.. -t---1* - - *- -
4-
* �
. '1 --
,. -- .. A� I* . -. 4 1
4.�Z � � -
* . .4II.
I I
.454 t ,.� .
44 . 4 -
2..
r ..... . ha
*�* **� . 4 4.*4 . .
.. .±.4 -41i *i-, *4 *..: . J
*'� I
-t �++� � -*. .. *. . .. FIT �.
* ...
.4 . . . .
4-- - 74177774.�4 .
* . . . . . � t4v4
* . . . . . 444. .
44�
4 . �- -- ......4.. .-.L........ � 4 -.
4.-.-... ..
a - .-- -.-
-------------------
* L-..----.
44�I J::7J4P1b.L.

ff .+T
5. HYDROPHONE SYSTEM) SENSITIVITY ANDTERMINATION AMPLIFIERS
In order for the hydrophone system response to be able to
cover the signal level dynaric range of the Blake Deployment operation,
i.e., the high source level signalE f:om high power projectors and explosive
charges and lower level ambient noise signals, the sensitivity of the
Westinghouse hydropnone systems were set at -149 dB re 1 V/pPa. In the
previous operation, sensitivity had been set at -129 dB re 1 V/pPa. The
reduction in gafn was accomplished by reducing the gains of the termina-
tion amplifiers. The siA amplifiers in each of the two termination boxes,
X and Y, were modified.
In order to ensure that each of the six hydrophone systems have
similar sensitivities, two resistors in each termination amplifier are
adjusted to compensate for the impedances of the various cable lengths.
This equalizes the dc voltage on all preamplifiers and it also equalizes
the ac load on all preamplifiers. In the 5) system, dc power is fed from
the record power module (RPM) up the cable to the preamplifier instead of
havi-p battery packs at each hydrophone. The ideal resistance values,
tiog ijith the cable lengths for Blake Deployments #1 and #4, are shown
Tabls 2 and 3. The Rl resistors were first chosen so that the ac load
.n all preamplifier units would be identical. Then the R2 values were
chosen such aL to make the dc voltage on all preamplifiers equal.
When it was decided that the RPM unit was not to be opened
b-zween deployments #1 and #4, it became necessary to choose values for
RI And R2 which would be a satisfactory compromise for the two sets of
cat2e len;iths. The values used are given i.n Table 4.
The termiration amplifier units were modifie, so that they
could be easily plugged into place or removed when re• istor values have
t) be changed.
17

TABLE 2
Ideal Resistance Values for Termination Amplifiers for Blake Test #1
Hydrophone R1 R2 LengthLocation in Cable
Number ohms ohms Meters Designation
A1 0 694
1 2310 B&D
2 171 69403305 E
3 194 685305 H
4 216 685
5 238 740
6 245 75392 F
6 J
18

S° ~
TABLE 3
Ideal Resistance Values for Termination Amplifiers for Blake Test #4
Hydrophone R1 R2 CableLocation Lengths Cable
Number ohms ohms in DesignationMeters
A1 160 694 -2
A 171 694 15"305 E
3 194 685 O
4 216 685 305 H
5 238 740 305
6 245 75392 F6 J
19

TABLE 4
Actual Resistance Values Used for Both Blake #1 and #4 Deployments
Hydrophone R1 R2Location ohms ohms
1 0 774
2 172 693
3 193 685
4 216 685
5 239 740
6 245 752
20

6. POWER CONVERTER
A re-vised power converter block diagram is given in Fig. 12.
In the 1972 deployments the low impedance signal that turned the unit
off when the break-away connector was exposed to sea water came from
pin #6 (hydrophone #6). Since pin #7 was available and unused, we decided
this would give a larger change in impedance due to sea viter across the
terminals upon "break-away".
The revised po-aer supply schematic is given in Fig. 13 and the
now regulator circuit is ýhown in Fig. 14. With reference to Fig. 13,
Q7A was added in order to obtain a lower voltage drop across transistor
Q7 in order to improve the positive peak of the square wave voltage into
the transformer, Tl. Diodes Dl, D2, and capacitor, C13, were added to
insure self start-up of the multivibrator when dc power was applied.
An improved shutdown circuit consisting of Qll and associated components
was added. This will be activated when the impedance drops below 25,000
ohms as a result of exposure o'f the breakaway connector to sea water.
Q10 and SCR1 were used to replace two transistors in order to improve the
reliability of the shutdown circuit.
Referring to Fig. 14, the Zener diode, D32, was replaced with
R40 and C35 so as to allow a greater range of power converter output
voltages. The desired output voltage is a function of the array length.
21

'A
-J 00
CLC
C 2P f 4
En E
L^. I L-
00
C-40
o cc
22i

v LjIIV
',in
I ND
Q~~ cb
'a~~ t5,' -
\J4
-
Fill.90 v Z - N 0
(~ ~ '1off
44 N *LAI~'8
C '4 0 v
U- 10 "4
~HI' ' ~ '4 of"S ~ HI' N -
OWN,~j~+"~ :.'3~ C-or
Ci:
qb -41U-
9.5-

UU
0 0
41
I-L 0 0
00
+ V-4
In P
> co
in 0Oc f *
4 Ii.ILIn0
4-> 1
N tn 4c 00N Ln CD
oc ~IL0~~ - IJN
0, >
in w-~ S
LA 4.
a' inJI
24

7. TESTS
Before deployment four sets of tests were made. After testing
at I R&D in Pittsburgh, Pa., the hydrophones were calibrated by the
Naval Research Lab at Orlando, Florida. The hydrophones were connected
to the cable sections at Environ-Electronics Corp. in Jupiter, Florida
and a series of tests were run. Next the cables were sent to the R/V North
Seal at Galveston, Texas where tests were made with the electronics
package containing the magnetic tape recorder.
7.1 Orlando Tests
Hydrophones All, A8, A1O, A3, A14, and A15 were calibrated
by the Navai Research Laboratory Underwater Sound Reference Division
and the results are given in tabular form in two reports prepared by4
that laboratory. Some of their results have been graphed and are
shown in Figs. 15, 16, 17, and 18. Note that all units had flat
responses from 10 Hz to 300 Hz. They had a peak response at 3 Hz to
4 Hz which unfortunately will give a large response to cable strumming
at 3.5 Hz. It is desirable to reduce the response below 10 Hz.
A response of the type illustrated by Fig. 19 would be more desirable.
All units exhibited a reduction in sensitivity of about
3 dS in going from 0.7 to 55 MPa of hydrostatic pressure. See. Fig. 20.
The change is believed to be due to the change in the compliance of t:,e
silicone oil inside the ceramic cylinder with the change in static pressure.
The sensitivity as a function of pressure will be determined the next time
hydrophones are calibrated.
7.2 Pittsburgh Tests
Before the hydrophones were tested with the cables they were
tested by using resistors to simulate the impedance of the wires in
25

F' 0
'-41
V44
U 0
.Z .*
-0-0
a~I* ti IA BO
26*

AT
I
N 0
-4
I.'
* @1
edn/AP A3TTITW0
* 027

44
LL'-41
cc
$4
->
C14
A 0
f-Io0 00
-4 4 4
vart/Ap AITAITs-a
281

1. 0
- u r n I
I II
- -4
qh
L- - -- 4A
P+/9 At A o 4'O
-- 4------ - - - -29

40
w00
C>-4
CuC.r4
en~00 -T JN
en (n-
ap - ueg iajlIdw
30uz.

*100 +4;+70
- 4-
0
too
I. --
. -. ~4.& $4
- - 0
-T-0
L.)
C-
0 00 -0
C44
V94
oo 0 0en 0 ne
L.rtAg 4 IAISa
* .31

in the Lable. The cable capacity was not simulated. These tests
indicated that the cross talk between any two channels due to mutual
resistance alone was less than -70 dB.
Hydrophones with preamp assemblies were pressure cycled to
55 !Pa at 20"C. The sensitivity was measured before and after the
pressure cycling.
To insure proper operatior of the converter unit when battery
voltage is applied, a set of tests were made at both 10.5 and 14.5
volts. Both positive and negative voltages were turned on simultaneously,
then the positive voltage was applied a fraction of a second before the
negative voltage, and lastly the negative voltage was applied before the
positive voltage. The converter functioned satisfactorily in all cases.
To simulate the exposure of the break-away cable to sea water,
a 25 k ohm resistor was connected between coax lead #7 ard 2roand. This
test was repeated a number of times and the converter unit always shut
off. (The 25 k ohms simulated the expected sea water impedance.)
To simulate a faulty hydrophone a 100 ohm resistor was
connected between Dins #1 and #7 of Channel #1. The convertee unit shut
off. The normal dc impedance of a hydrophone is 2000 ohms.
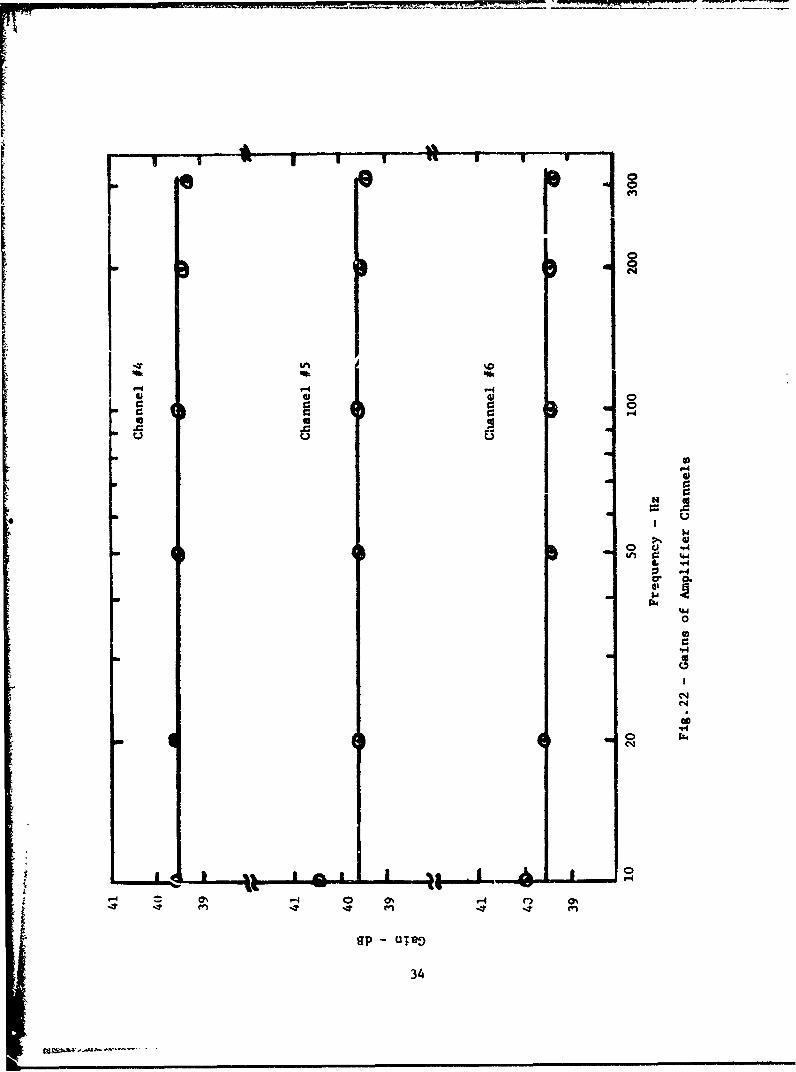
7.3 Jupiter Tests
Test records #1 to #31 were made in Jupiter, and given to the
Deputy Test Director. The gain of all six amplifier channels were
measured from 10 Hz to 300 Hz and the results are given in Figs. 21 and
22. The gain of channel #6 was measured at 100 Hz at input levels from
I to 10 mV. The gain was unchanged as the battery voltage ias varied
from 10.5 to 14.5 volts.
j 32

-OctI Ikt ... .m
iv
IT-I U 5
~C14
r 0
, 1.
iJ
•" 33
-f-
v-44* 41 441
cr m
.44
0wC.,
344.
I
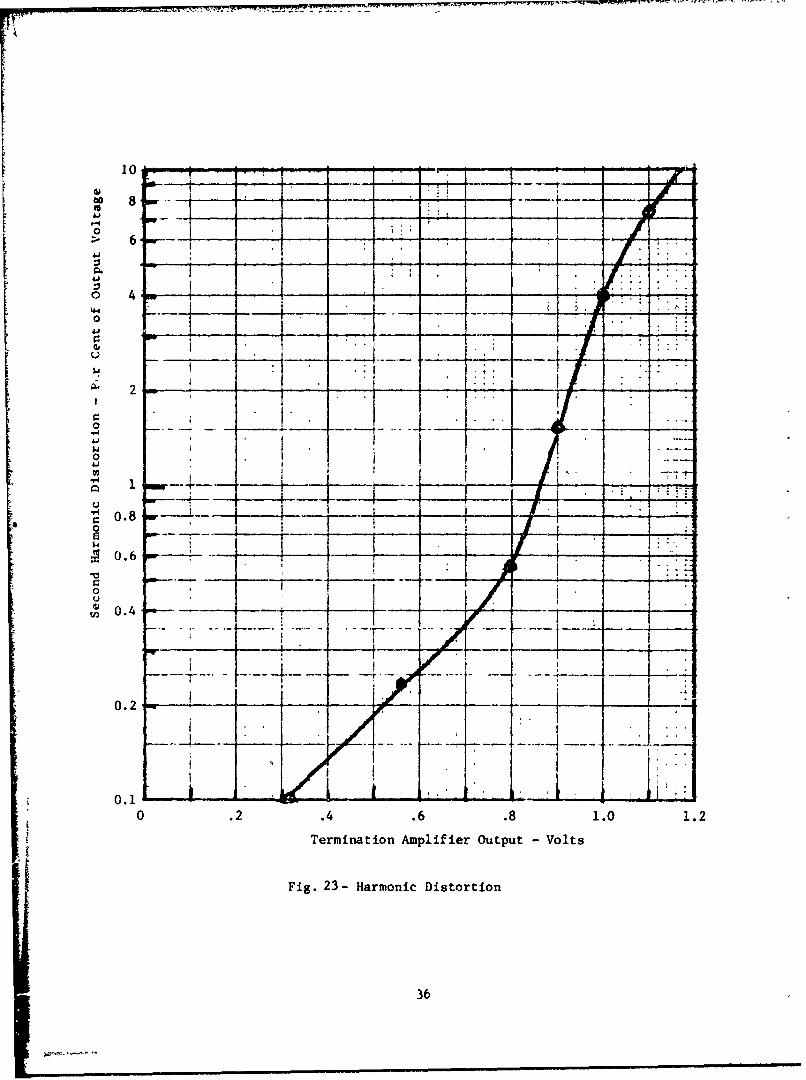
Measurements of input vs output voltage indicated that there
was little saturation at output levels below 0.9 volt. At an output
level of 0.9 volt the amount of second harmonic voltage was 36 dB below1 the fundamental. Figure 23 shows how the second harmonic distcrtion
voltage varied as a function of output level,
Tte cross talk between any two channels was found to be less
than -60 dB from 20 Hz to 300 Hz and less than -35 dB at 3 kHz. With
an acoustic signal into five channels at 100 Hz, the signal
coupled electrically into the sixth channel was at least 50 dB below
j j ithe weakest acoustic signal to any of the other channels.* ,
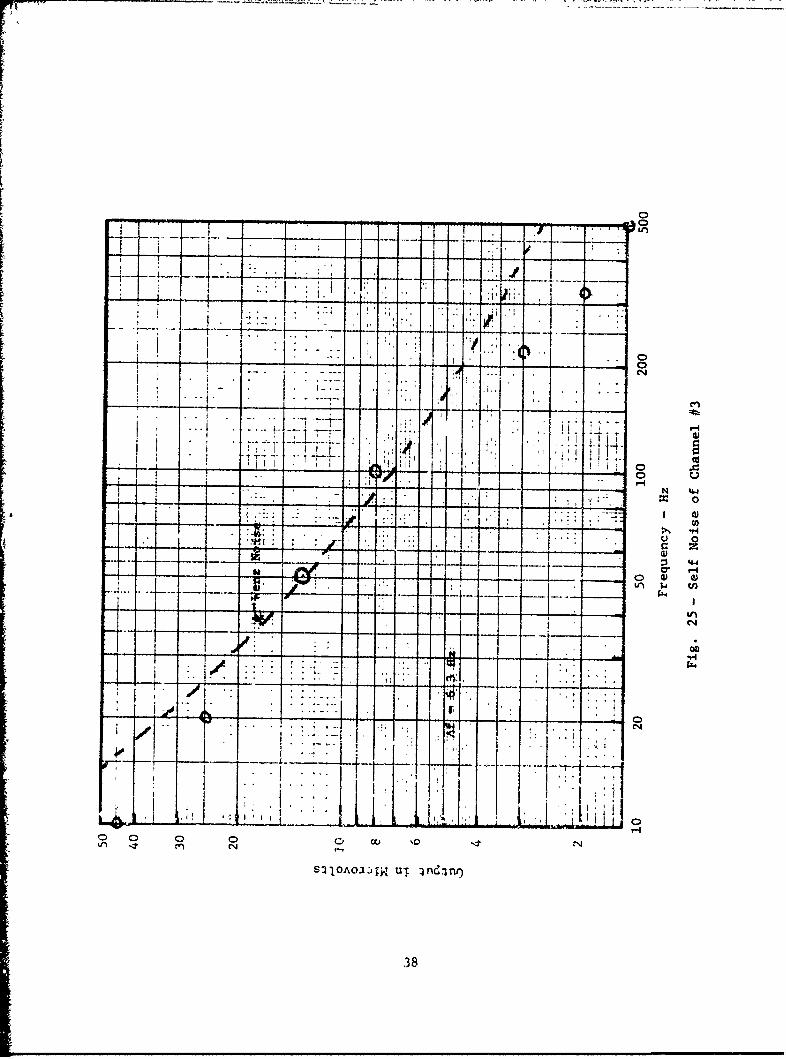
* Self-noise measurements were made on all six channels using
a wave analyzer that has a 6.3 Hz bandwidth. The results are shown in
Figs. 24 thru 28. The dotted line gives the ocean ambient noise as
given by the lower Wenz curve.
7.4 Galveston Tests
Tests were carried out on the North Seal in Galveston, Texas
on May 25 and 26, 1973, and recorded as Tests #32 to #47. Since the
cables between the top three hydrophones were not available, resistors
were used to simulate the missing cables.
Cross talk measurements confirmed that there was little
cross talk between channels. When an electrical signal was fed into
channel #2, the level on channel #1 output 4as 50 dB below that of
channel #2.
Linearitv measurements indicated that all six channels produced
an output voltage proportional to the input voltage up to a termination
amplifier level of 0.90 volts. This is illustrated for channel #4 by
Fig. 29.
Table 5 compares the measured input and output signals of all
six channels when the termination output level was 900 mV.
Calibration signals at a level of 316 mV were recorded on the
magnetic tape at frequencies of 12.5, 50, 100, and 250 Hz for channels #1
to #6. Each signal was applied for tw. ,minutes.
35
10 •• ••
=" 6---==--- ---- =--------+---"--_ - --- -••-8
06
-
0 4, -
0 ----
- 0. - -
U
C 0 .6 . . . . . ._ _ _. _ _• .. . . ..... .. .. .... " . .... .. .
0 .4 . "
07 7
S0.8
0.
0 .2 .4 .6 .8 1.0 1.2
Termination Amplifier Output - Volts
Fig. 23- Harmonic Distortion
36

444
0 ) 0
1 0 1U)
11> ~V. j~44Y4i ci
a~ i- 1,L- -- -- -- i I -
0 . 0 o % Mc
.4. fn N-- r -4
Ijtoj)~ u. in *
- - - - - - -~-*- -37-
ra
040
Li>::
0 0 COZ-
S: '',ý,j~ UTIit
38z:rzzzzz-

r7ftITI
K~i7Z777 iii 1z~kpz iIW:
0 a .0 1C4 .4
* -j~ o o j .T ,.-. -T
~ -39

4-1
C4)
I 0 04
-t r - i- --
40 0

1; 0
:3 0Iz
4)L
41P4
0002
.- c 00 % 4 r
0n 1' 4
41OA.1T UT IA dZ w.
411

1000S... . .-+- " -•" * + " ' , - - - -.+ + --
1-4
800 .. - . - - -
600 f ier
- . .. . . . ... . . ' - - - -+ t- + _ ' . . . . .
Apif iek
1...... .. .. ... ** 1 it ....
400
t...____- ... ..
S~~ c. >.;:+,o r•
200 --. .
00 2 4 6 8 10
Input Signal - mV
Fig. 29 - Channel #4 Linearity
42

TABLE 5
Comparative Gains of the Six Channels
Termination Record
Channel Amplifiers AmplifiersNo. Input Signal Output Output
1 9.4 mV 900 mV 955 mV
2 9.4 900 950
3 9.5 900 940
4 9.5 900 940
5 9.4 900 935
6 9.5 900 945
43

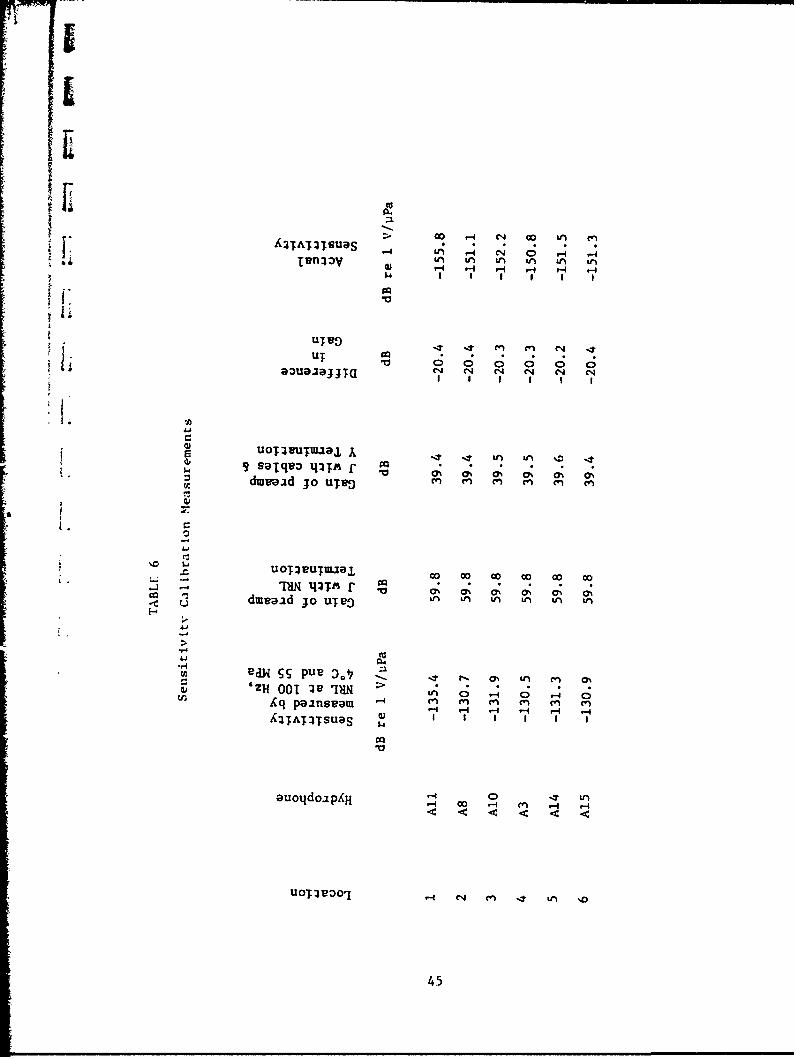
The sensltivltv ol the tv'rminatlon amriifiers used in the
denloyment was 20 dB less than tht tcr~mination amplifiers used for
hydrophone calibration tests in Orlando. Table 6 gives the sensitivity
of each hydrophone as measured in Orlando, the gain of the dummy pre-
amplifier with the Orleado termination, the gain of the dummy preamplifier
with termination Y, the difference in the two gains, and the resultL.g
sensitivity of the hydrophones as used with the Y termination box.
The true sensitivity of the hydrophones used with the Y termination is
accurately found by adding the difference in gain to the sensitivity as
measured by NRL.
44
-4 rA ~ ( -4 .-I
IT ItISe b
UT e
40 ~~ 0av 0i, 0 0C0
X UOl3U. maeJl
UN 3TI f, a C 0% 0: 0*1 C4 0%
-C udvi j dg. n n L n t
>
UO1SS UP 0' - " ,LnO.zH OO nINmu IH 0%
4.45
8. CONCLUSIONS
Because of the intermittent behavior of some of the rejected
amplifiers, new methods for encasing semiconductors have been evaluated
since the Blake Tests. Future units will be pressure cycled 10 times
to insure reliable performance in the ocean.
The split sleeve couplers will be made with a larger inside
diameter so there is no danger of pinching the polyurethane surrounding
the preamp unit.
Since the exact hydrophone sensitivity is a function of depth,
the next time that hydrophones are calibrated, gain measurements will be
made at four or five ambient pressures.
Cable strumming produces noise at about 3.5 Hz and so it is
desirable for the hydrophone to have low sensitivity at that frequency.
Consequently, an amplifier with a modified response will be built. The
gain will be substantially flat from 30 Hz to 300 Hz but will be at least
10 dB less at 3.5 Hz.
The cross talk between channels was demonstrated to be very low.
46

IL
I
9. REFERENCES
1. A. Nelkin, "LRAPP Vertical Array, Preliminary Design Study, Phase I,"Westinghouse Research Report 72-9C6-VERAY-Rl, April 14, 1972.
2. C. H. Jones, "IIAPP Vertical Array of Hydrophones, Phase II,"Westinghouse ruesearch Report 73-9M7-VERAY-Rl, June 1973.
3. C. L. Hikes, "ACODAC Array: Cable, Terminations, and Connectors,"Westinghouse Report OER #73-19, July 1973.
4. H. J. Hebert, "Calibration of Westinghouse Model WX-VERAY-l Hydro-phones Serial Nos. 2, A3, A5, A6, 15, 22, 24, and 27, and A3, A4,A5, A8, A10, All, A12, A14, A15, and 22" Naval Research Laboratory,Underwater Sound Reference Division, Calibration Report Nos. 35i0and 3553, May 1973.
I.4
ii
S~47

DEPARTMENT OF THE NAVYOFFICE OF NAVAL RESEARCH
875 NORTH RANDOLPH STREETSUITE 1425
ARLINGTON VA 22203-1995IN REPLY REFER TO:
5510/1Ser 3210A/01 1/0631 Jan 06
MEMORANDUM FOR DISTRIBUTION LIST
Subj: DECLASSIFICATION OF LONG RANGE ACOUSTIC PROPAGATION PROJECT(LRAPP) DOCUMENTS
Ref: (a) SECNAVINST 5510.36
Encl: (1) List of DECLASSIFIED LRAPP Documents
1. In accordance with reference (a), a declassification review has been conducted on anumber of classified LRAPP documents.
2. The LRAPP documents listed in enclosure (1) have been downgraded toUNCLASSIFIED and have been approved for public release. These documents shouldbe remarked as follows:
Classification changed to UNCLASSIFIED by authority of the Chief of NavalOperations (N772) letter N772A/6U875630, 20 January 2006.
DISTRIBUTION STATEMENT A: Approved for Public Release; Distribution isunlimited.
3. Questions may be directed to the undersigned on (703) 696-4619, DSN 426-4619.
BRIAN LINKBy direction

Subj: DECLASSIFICATION OF LONG RANGE ACOUSTIC PROPAGATION PROJECT(LRAPP) DOCUMENTS
DISTRIBUTION LIST:NAVOCEANO (Code N 121LC - Jaime Ratliff)NRL Washington (Code 5596.3 - Mary Templeman)PEO LMW Det San Diego (PMS 181)DTIC-OCQ (Larry Downing)ARL, U of TexasBlue Sea Corporation (Dr.Roy Gaul)ONR 32B (CAPT Paul Stewart)ONR 3210A (Dr. Ellen Livingston)APL, U of WashingtonAPL, Johns Hopkins UniversityARL, Penn State UniversityMPL of Scripps Institution of OceanographyWHOINAVSEANAVAIRNUWCSAIC

;.m 00 .0(~- 00 N 0 .0 00 ~* C0 z
0 -c -ý -7 N 0 i 0UL* ~~~Z41N 0 C\ '04 z zc) 0<
C C ~ '4 C C C 73 C- Crn CDCý C2 (c CN -q 'I It It ~ '
6. C C C C
C.) -eC.CJt C.d 03-U .
C u C.) Cu cu 0
2 .) ~ . ~(~1) x) ca~Cu Cclb u Z 5u cIC C
C.)) u~
U> H> cu a0 '1 0 0I ~ 0 cJ) 000 - 5u Zu Cu C3?-' -- I i>- - . O t- 0 t
U)(- C. 0 u>C, z .9 CIS Q > 0 > 0
C. 0
O-: 0 'IT- ~0
Hn 0 u c
0D -n0CL CA~ o~ 7 cn -n 0 Ž. 4
V) CI En Zý4 0<
0n 0C 10 0
0 C
0 -Z-44 F. 0
00 0l p -< ) 4.C
0z - En C
'3 0. .Z U~C CC C
.0 0 40
P4 W
Z Z uo
Tu u C u u '- u- 0 Cu Cu
>~~c C 'C'ý ~ ~OC) C/ 9
_ ~~ _ _- PO ý< D<_ _ _