Distributed Generation Interconnection Seminar Generation Interconnection Seminar April 19, 2018...
63
Distributed Generation Interconnection Seminar April 19, 2018 National Grid 939 Southbridge Street, Worcester, Massachusetts 01610 Auditorium
Transcript of Distributed Generation Interconnection Seminar Generation Interconnection Seminar April 19, 2018...
Distributed Generation Interconnection
Seminar
April 19, 2018
National Grid
939 Southbridge Street, Worcester, Massachusetts 01610
Auditorium
Agenda
2
8:30 Registration
9:00 Welcome, Opening Remarks Will Kern
9:05 Expedited & Standard Process Overview Eric Munzert, Tim Kounlavouth
9:30 ISO-NE Ride Through Requirement Jim Ryan
9:50 New DG User Interface Andrea Agra, Adam Markopoulos
10:20 Break
10:30 SMART Program Summary Sam Nutter, CLEAResult®
11:30 Questions
12:00 Adjourn
DG Updates
This text box and image
can be deleted and
replaced with your own
selection from Brand
Central’s image library.
This text box and image
can be deleted and
replaced with your own
selection from Brand
Central’s image library.
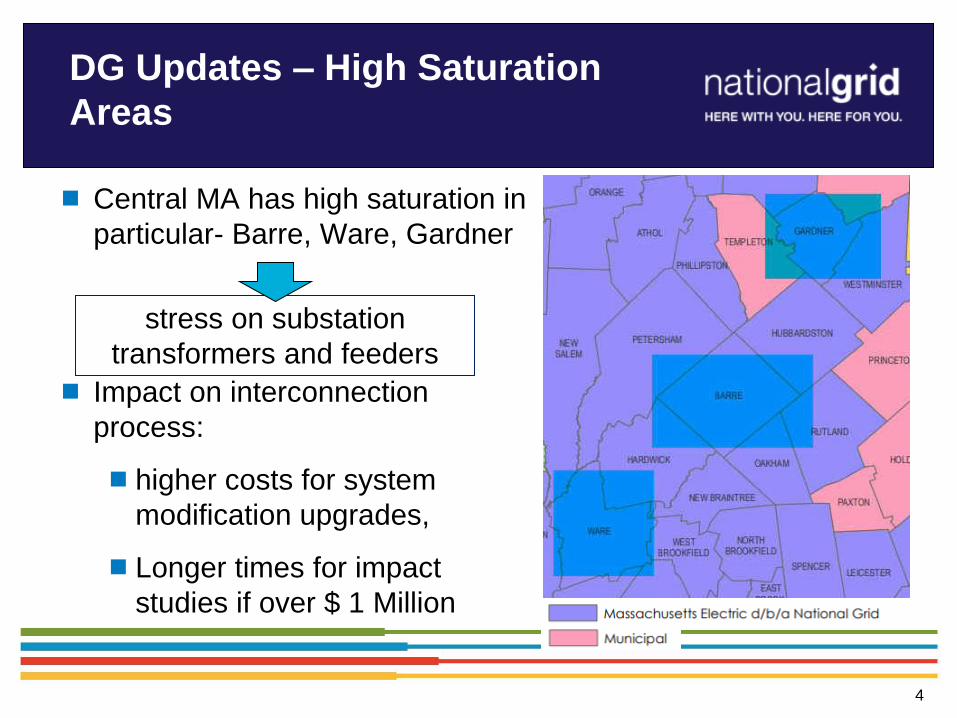
DG Updates – High Saturation
Areas
Central MA has high saturation in
particular- Barre, Ware, Gardner
Impact on interconnection
process:
higher costs for system
modification upgrades,
Longer times for impact
studies if over $ 1 Million
4
stress on substation
transformers and feeders

DG Updates- Energy Storage
Documentation
At a minimum the following supplemental data will be required for all
applications that include storage
an operating narrative for the energy storage including
Usage and operating modes
System configuration
Energy Storage and PCS Technical Details
System Applications
Documentation needed will be sent to the customer prior to the impact
study
Documents: 1) Supporting Documentation for Interconnection Study Application For Inverter-based
DER Systems 2) ESS Data Collection
5

Safety Moment:
Smith System 5 Keys to Safe Driving
6
# 1. Aim High in Steering.
• Look a minimum of 15 seconds ahead of you.
# 2. Get the Big Picture.
• Maintain 4 second following distance.
• Check mirrors every 5-8 second.
# 3. Keep Your Eyes Moving.
• Do not focus on any object for more than 2 seconds.
# 4. Leave Yourself an Out.
• Maintain open space around your vehicle.
# 5. Make Sure They See You.
• Seek eye contact or try and observe where other drivers are looking.

Agenda
7
8:30 Registration
9:00 Welcome, Opening Remarks Will Kern
9:05 Expedited & Standard Process Overview Eric Munzert, Tim Kounlavouth
9:30 ISO-NE Ride Through Requirement Jim Ryan
9:50 New DG User Interface Andrea Agra, Adam Markopoulos
10:20 Break
10:30 SMART Program Summary Sam Nutter, CLEAResult®
11:30 Questions
12:00 Adjourn

National Grid Interconnection Process for
Distributed Energy Resources
8
Topics Covered
Purpose and Scope
Process Mechanics
Milestones and timelines
9
Importance of the Interconnection
Process
Safety of utility workers and general public
No adverse impact to power quality, in terms of:
Islanding
Transient Voltage Conditions
Noise and Harmonics
Frequency
Voltage Level
Machine Reactive Capability
Customers cannot interconnect to the Electric Power System (EPS) without
the Company’s authorization.
Billing implications
10
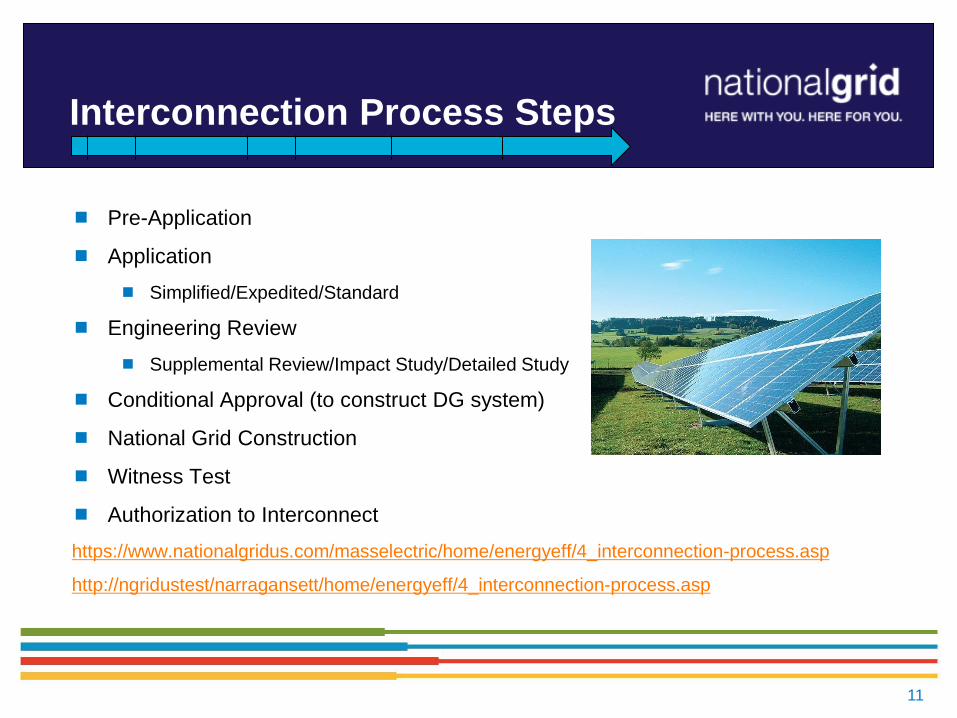
Interconnection Process Steps
Pre-Application
Application
Simplified/Expedited/Standard
Engineering Review
Supplemental Review/Impact Study/Detailed Study
Conditional Approval (to construct DG system)
National Grid Construction
Witness Test
Authorization to Interconnect
https://www.nationalgridus.com/masselectric/home/energyeff/4_interconnection-process.asp
http://ngridustest/narragansett/home/energyeff/4_interconnection-process.asp
11

Simplified Review Process

Simplified Criteria
UL Listed, inverter based systems with power ratings of
15kW (was previously 10 kW) or less on a single phase
service on a radial feed
UL Listed, inverter based systems with power ratings of
25kW or less on a three phase service on a radial feed.
The Simplified Process does not apply for:
non-listed inverters or other generators (induction / synchronous
/ asynchronous)
aggregate generation capacity of listed inverters that exceed the
above-mentioned limits
13

Expedited Review Process
Expedited Criteria
Single phase customers with listed single-phase inverter based systems with
power ratings of >15 kW on a radial feed
Three phase customers with listed three-phase inverter based systems with
power ratings of >25kW on a radial feed
Any project that did not pass the Simplified process screens
Non-simplified projects that do not require an impact study
Maximum size and supplemental review is based on review of screens
15

Expedited Review Path
If any screens are not passed, the
Company may require a
Supplemental Review Agreement
before providing an Interconnection
Service Agreement
Key threshold: if aggregate
generation is less than 67% of
minimum load on the feeder.
Other screens review voltage
quality, reliability and safety to
reduce the potential need for
impact studies.
Relay control system must be well
defined to make supplemental review
easier.
Expedited
Eligible Facilities Listed Inverter DG
Acknowledge Receipt of Application (3 days)
Review Application for
Completeness 10 days
Complete Review of All Screens 25 days
Complete Supplemental Review (if
needed) 20 days or Standard Process
Send Executable Agreement 10 days
Total Maximum Days 45/65 days
Construction Schedule By Mutual Agreement
Notice/ Witness Test Within 10 days of receiving CoC or by
mutual agreement
16

Standard Review Process
Standard Criteria
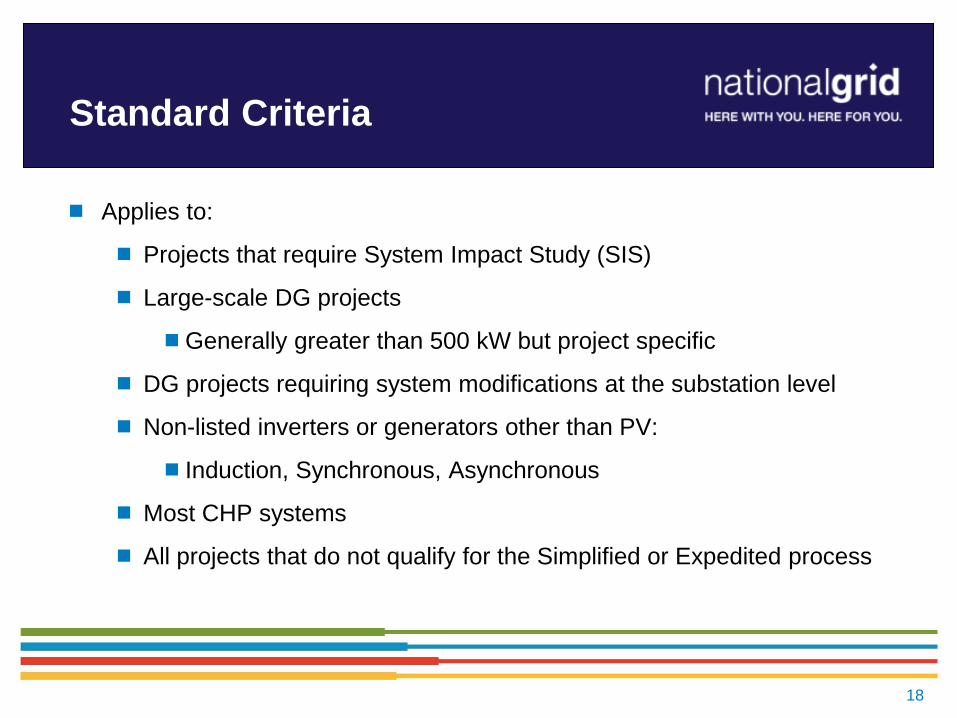
Applies to:
Projects that require System Impact Study (SIS)
Large-scale DG projects
Generally greater than 500 kW but project specific
DG projects requiring system modifications at the substation level
Non-listed inverters or generators other than PV:
Induction, Synchronous, Asynchronous
Most CHP systems
All projects that do not qualify for the Simplified or Expedited process
18
Standard Review Path
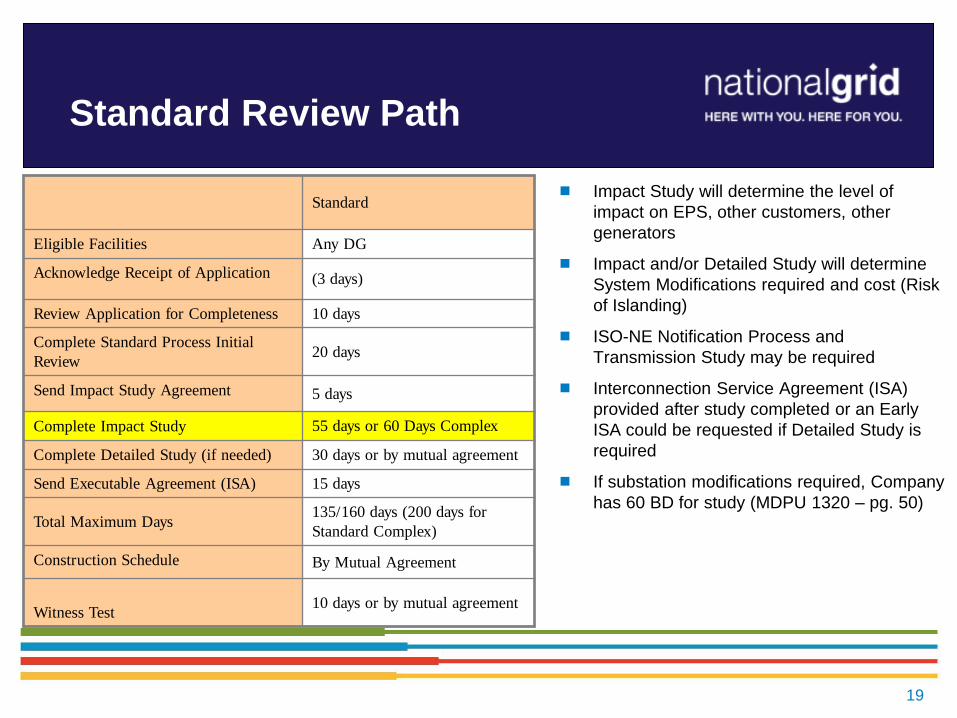
Impact Study will determine the level of
impact on EPS, other customers, other
generators
Impact and/or Detailed Study will determine
System Modifications required and cost (Risk
of Islanding)
ISO-NE Notification Process and
Transmission Study may be required
Interconnection Service Agreement (ISA)
provided after study completed or an Early
ISA could be requested if Detailed Study is
required
If substation modifications required, Company
has 60 BD for study (MDPU 1320 – pg. 50)
Standard
Eligible Facilities Any DG
Acknowledge Receipt of Application (3 days)
Review Application for Completeness 10 days
Complete Standard Process Initial
Review 20 days
Send Impact Study Agreement 5 days
Complete Impact Study 55 days or 60 Days Complex
Complete Detailed Study (if needed) 30 days or by mutual agreement
Send Executable Agreement (ISA) 15 days
Total Maximum Days 135/160 days (200 days for
Standard Complex)
Construction Schedule By Mutual Agreement
Witness Test 10 days or by mutual agreement
19
Summary and Recommendations
This is a high-level overview of the interconnection process. The interconnection tariff,
applicable rules, laws, regulations and MDPU orders set forth the interconnection
requirements. The customer must comply with all interconnection requirements.
Submit your interconnection application with National Grid early, during conception phase
before committing to buying no matter how simple or small the DG might be.
Large interconnection applications take longer to study
Proposed facilities ≥ 5MW must undergo ISO-NE Notification Process and
Transmission Study
Company processing time frames are standard working days (Business Days) and do not
include customer delays, including due to missing information, third party delays, or force
majeure events
http://www9.nationalgridus.com/masselectric/business/energyeff/distributed_generation.asp
20
Before considering any system design changes consult
your CEI project manager, including but not limited to:
Adding energy storage
Change in system size
Change in generator type
Change in inverters
Project Design Changes
21
Agenda
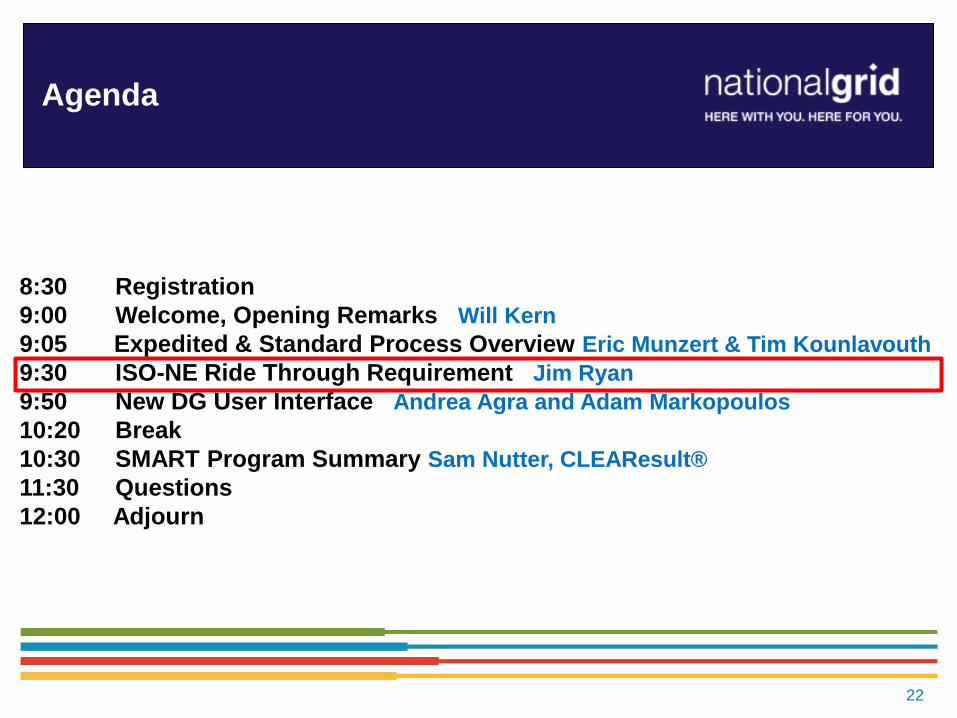
22
8:30 Registration
9:00 Welcome, Opening Remarks Will Kern
9:05 Expedited & Standard Process Overview Eric Munzert & Tim Kounlavouth
9:30 ISO-NE Ride Through Requirement Jim Ryan
9:50 New DG User Interface Andrea Agra and Adam Markopoulos
10:20 Break
10:30 SMART Program Summary Sam Nutter, CLEAResult®
11:30 Questions
12:00 Adjourn

Retail Connections Policy & Standards
Updates
23
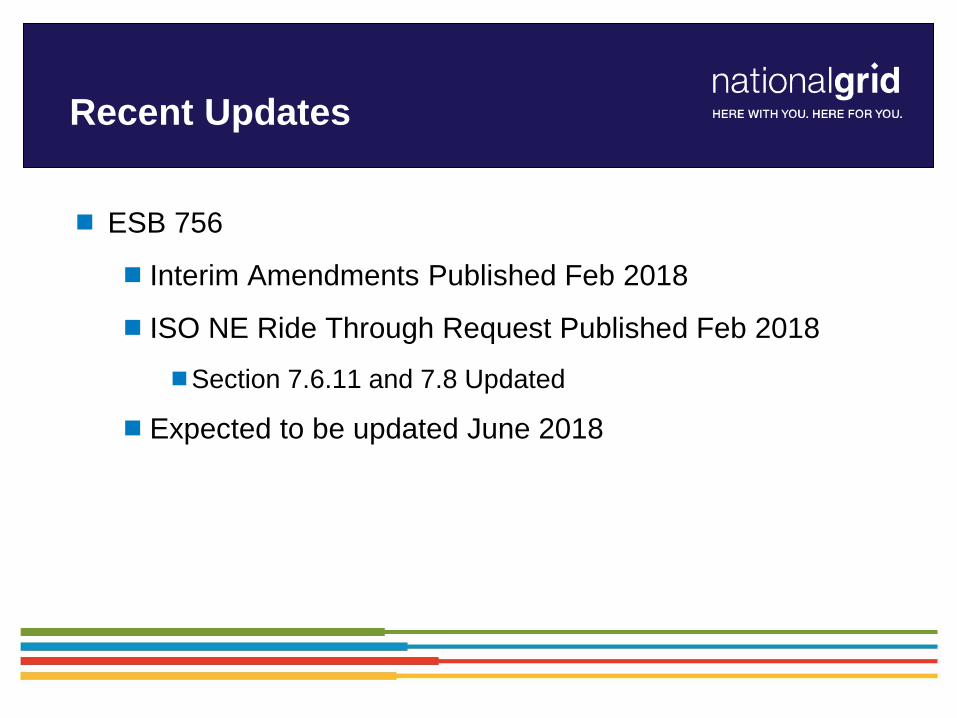
Recent Updates
ESB 756
Interim Amendments Published Feb 2018
ISO NE Ride Through Request Published Feb 2018
Section 7.6.11 and 7.8 Updated
Expected to be updated June 2018
ISO NE Ride Through Requirements
Who is ISO NE?
New England Independent System Operator
Operates the transmission system in New England
Directs the flow of electricity
Concerned with bulk stability (i.e. preventing major blackouts)
https://www.iso-ne.com/about/what-we-do/three-roles

ISO NE Ride Through
Requirements
Advanced implementation of new IEEE 1547 – 2018 settings
Similar to California Rule 21 and Hawaii ride through
requirements
New England is in the early beginning of a US-wide
industry change

Why is ISO NE Concerned?
Distributed Energy Resources (DERs) are adding up
National Grid presently has over 1.38 GW connected
across its system in the U.S.
Concerns with effects on transmission system reliability
Example – California Blue Cut Fire Event
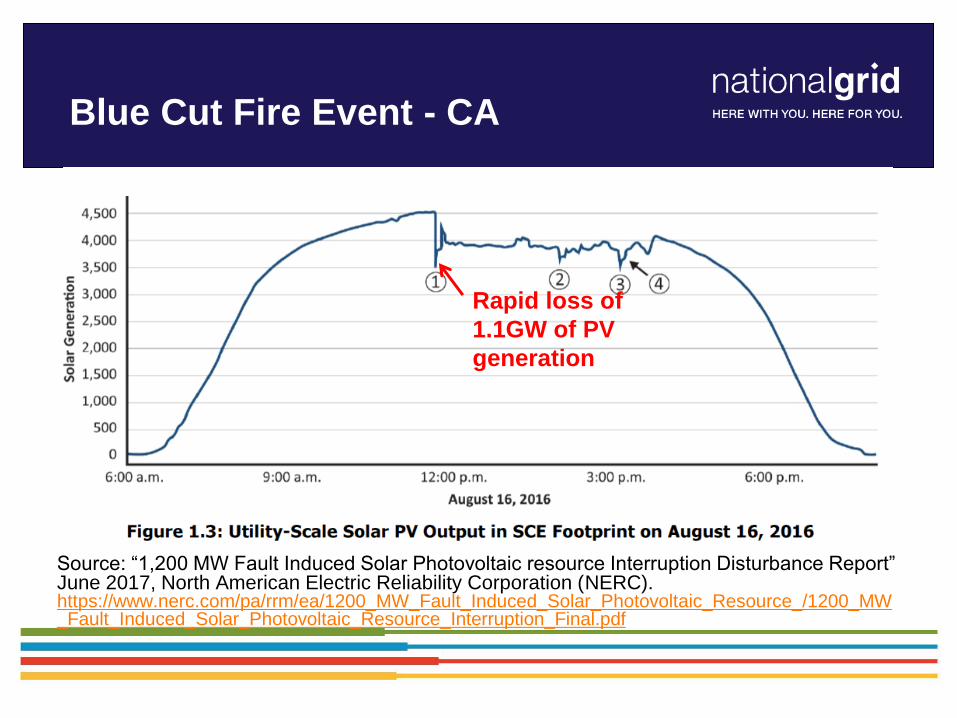
Blue Cut Fire Event - CA
Source: “1,200 MW Fault Induced Solar Photovoltaic resource Interruption Disturbance Report” June 2017, North American Electric Reliability Corporation (NERC). https://www.nerc.com/pa/rrm/ea/1200_MW_Fault_Induced_Solar_Photovoltaic_Resource_/1200_MW_Fault_Induced_Solar_Photovoltaic_Resource_Interruption_Final.pdf
Rapid loss of
1.1GW of PV
generation
Ride Through Requirements
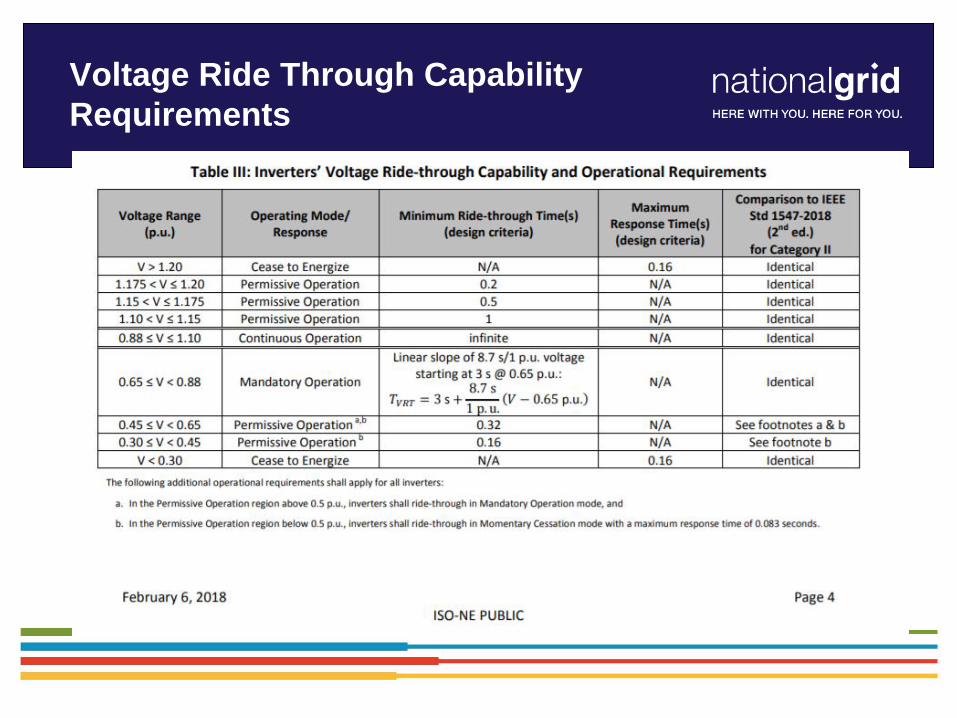
Voltage Ride Through Capability
Requirements
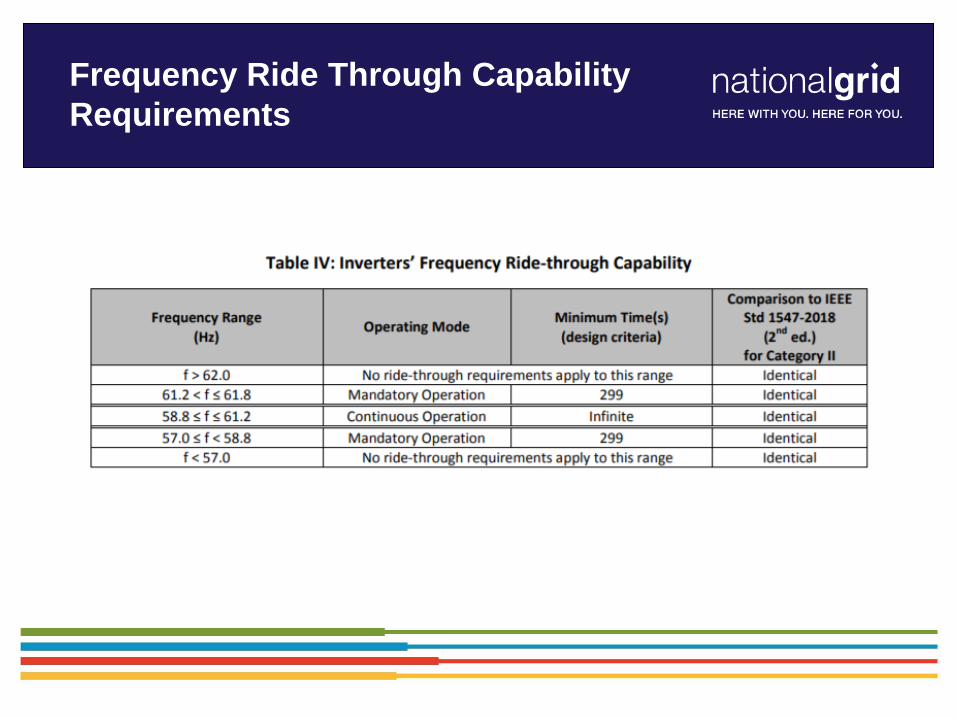
Frequency Ride Through Capability
Requirements
Trip Settings
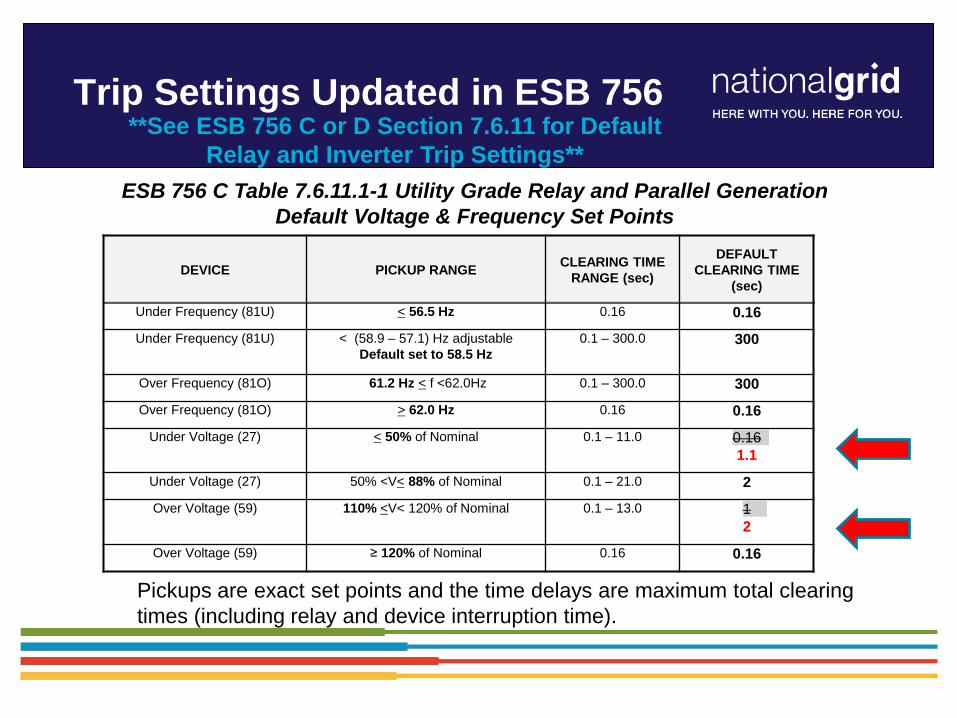
Trip Settings Updated in ESB 756
DEVICE PICKUP RANGE CLEARING TIME
RANGE (sec)
DEFAULT
CLEARING TIME
(sec)
Under Frequency (81U) < 56.5 Hz 0.16 0.16
Under Frequency (81U) < (58.9 – 57.1) Hz adjustable
Default set to 58.5 Hz
0.1 – 300.0 300
Over Frequency (81O) 61.2 Hz < f <62.0Hz 0.1 – 300.0 300
Over Frequency (81O) > 62.0 Hz 0.16 0.16
Under Voltage (27) < 50% of Nominal 0.1 – 11.0 0.16
1.1
Under Voltage (27) 50% <V< 88% of Nominal 0.1 – 21.0 2
Over Voltage (59) 110% <V< 120% of Nominal 0.1 – 13.0 1
2
Over Voltage (59) ≥ 120% of Nominal 0.16 0.16
ESB 756 C Table 7.6.11.1-1 Utility Grade Relay and Parallel Generation
Default Voltage & Frequency Set Points
**See ESB 756 C or D Section 7.6.11 for Default
Relay and Inverter Trip Settings**
Pickups are exact set points and the time delays are maximum total clearing
times (including relay and device interruption time).
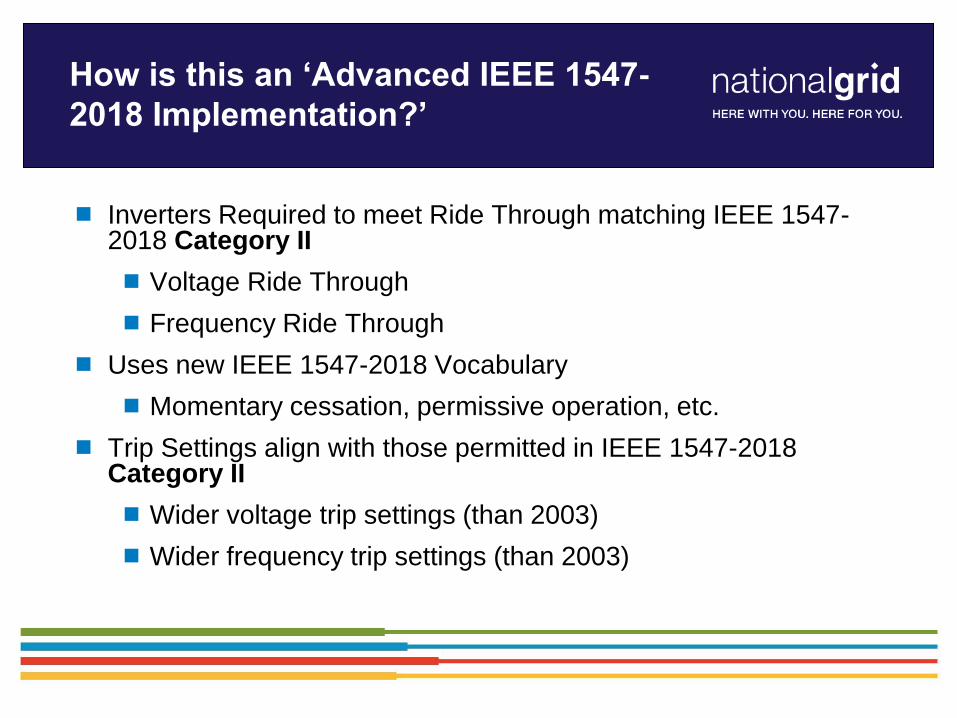
How is this an ‘Advanced IEEE 1547-
2018 Implementation?’
Inverters Required to meet Ride Through matching IEEE 1547-2018 Category II
Voltage Ride Through
Frequency Ride Through
Uses new IEEE 1547-2018 Vocabulary
Momentary cessation, permissive operation, etc.
Trip Settings align with those permitted in IEEE 1547-2018 Category II
Wider voltage trip settings (than 2003)
Wider frequency trip settings (than 2003)
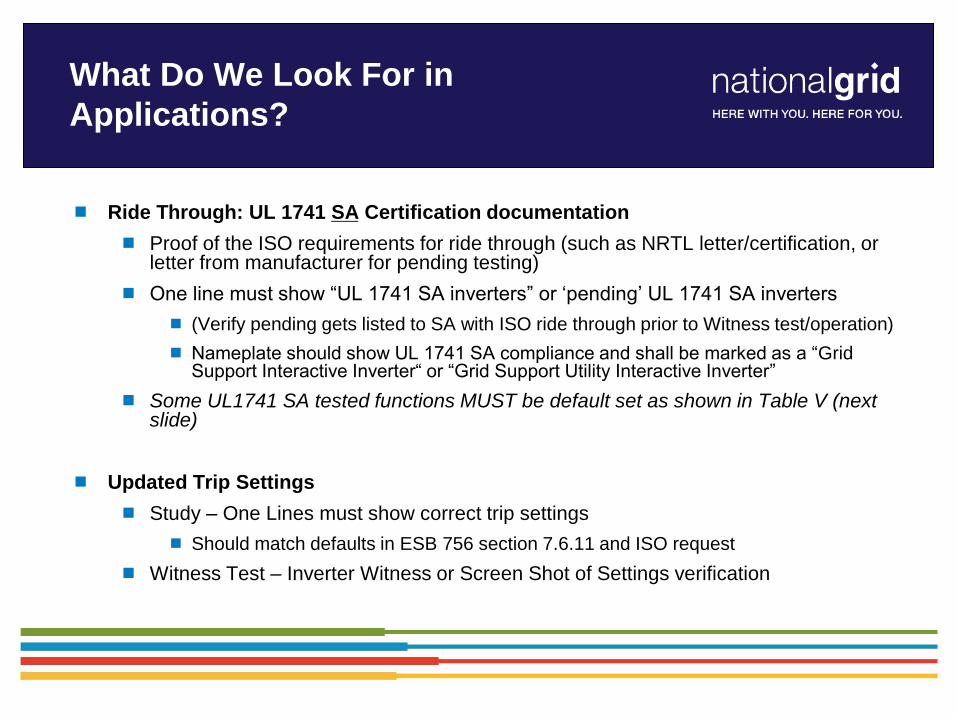
What Do We Look For in
Applications?
Ride Through: UL 1741 SA Certification documentation
Proof of the ISO requirements for ride through (such as NRTL letter/certification, or letter from manufacturer for pending testing)
One line must show “UL 1741 SA inverters” or ‘pending’ UL 1741 SA inverters
(Verify pending gets listed to SA with ISO ride through prior to Witness test/operation)
Nameplate should show UL 1741 SA compliance and shall be marked as a “Grid Support Interactive Inverter“ or “Grid Support Utility Interactive Inverter”
Some UL1741 SA tested functions MUST be default set as shown in Table V (next slide)
Updated Trip Settings
Study – One Lines must show correct trip settings
Should match defaults in ESB 756 section 7.6.11 and ISO request
Witness Test – Inverter Witness or Screen Shot of Settings verification
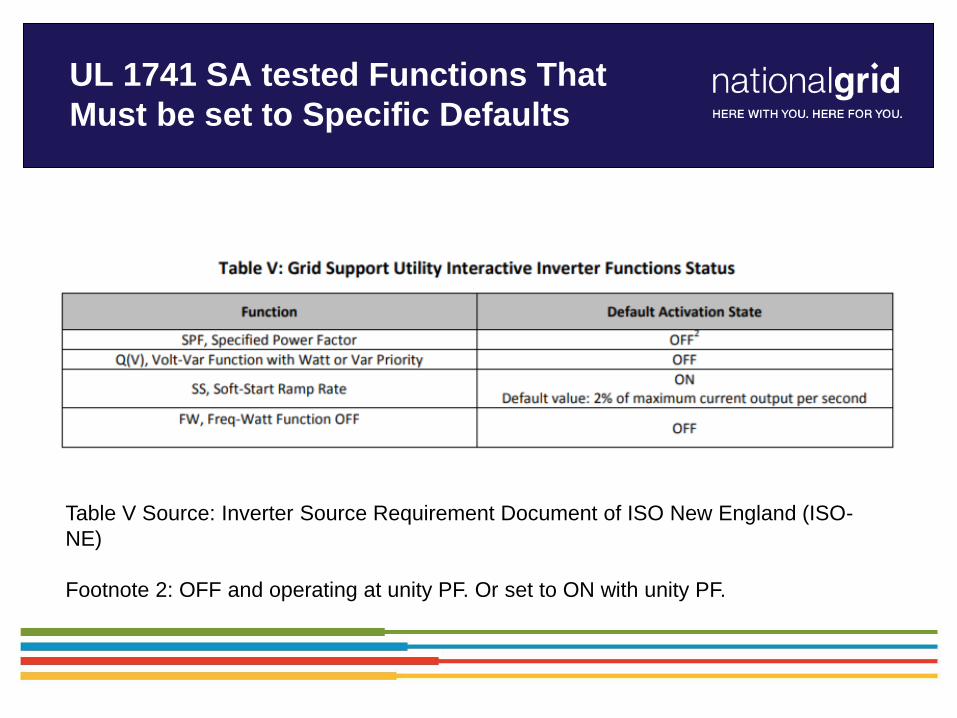
UL 1741 SA tested Functions That
Must be set to Specific Defaults
Table V Source: Inverter Source Requirement Document of ISO New England (ISO-
NE)
Footnote 2: OFF and operating at unity PF. Or set to ON with unity PF.
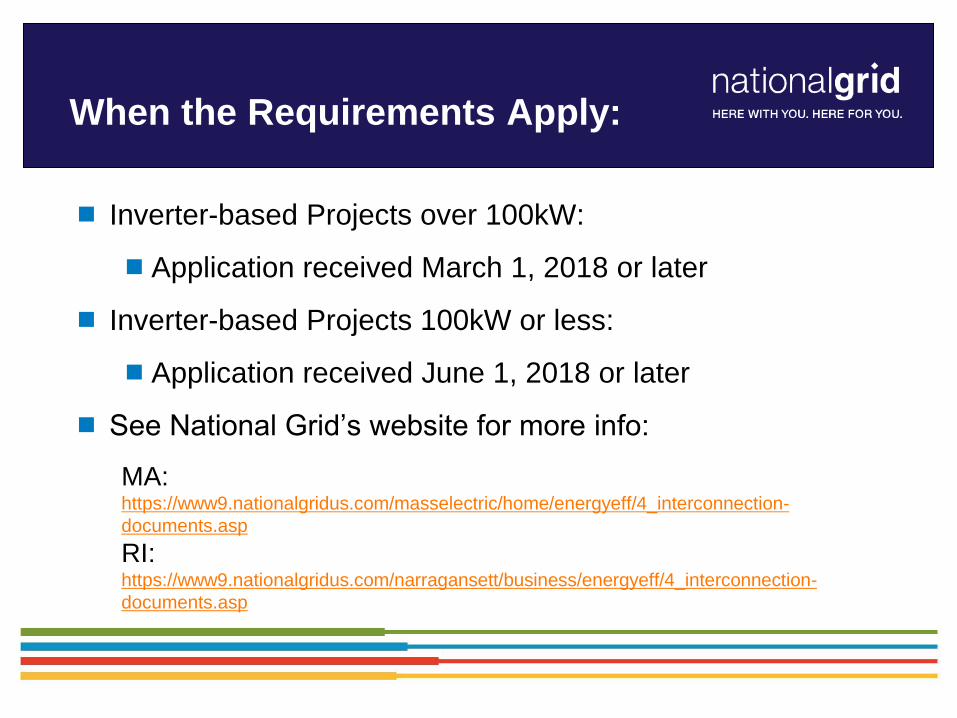
When the Requirements Apply:
Inverter-based Projects over 100kW:
Application received March 1, 2018 or later
Inverter-based Projects 100kW or less:
Application received June 1, 2018 or later
See National Grid’s website for more info:
MA: https://www9.nationalgridus.com/masselectric/home/energyeff/4_interconnection-
documents.asp
RI: https://www9.nationalgridus.com/narragansett/business/energyeff/4_interconnection-
documents.asp
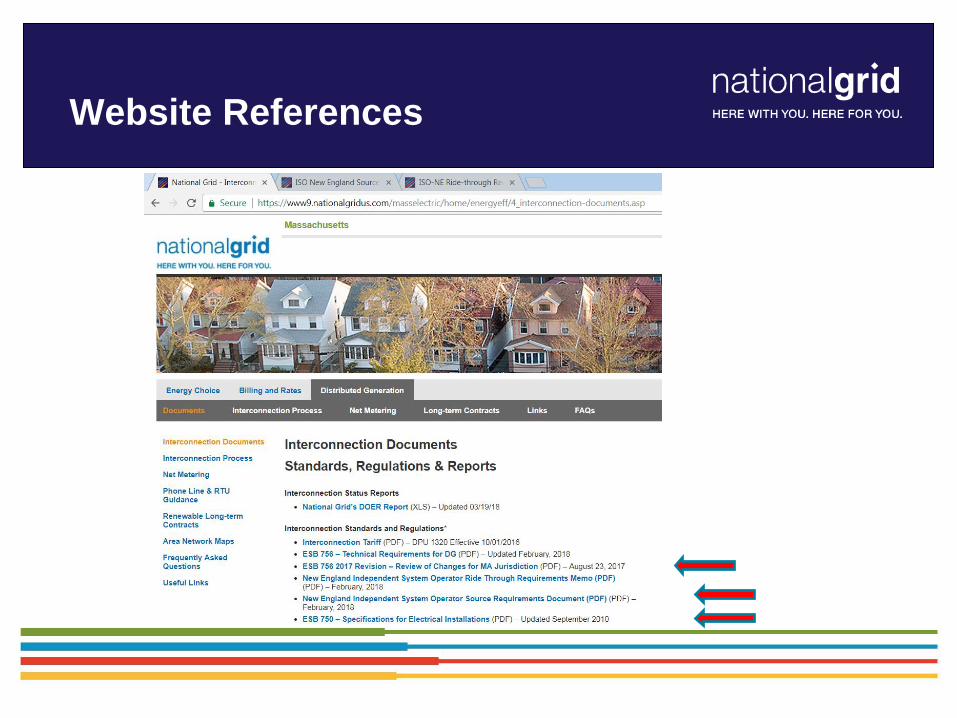
Website References

Agenda
40
8:30 Registration
9:00 Welcome, Opening Remarks Will Kern
9:05 Expedited & Standard Process Overview Eric Munzert & Tim Kounlavouth
9:30 ISO-NE Ride Through Requirement Jim Ryan
9:50 New DG User Interface Andrea Agra and Adam Markopoulos
10:20 Break
10:30 SMART Program Summary Sam Nutter, CLEAResult®
11:30 Questions
12:00 Adjourn

Agenda
41
8:30 Registration
9:00 Welcome, Opening Remarks Will Kern
9:05 Expedited & Standard Process Overview Eric Munzert & Tim Kounlavouth
9:30 ISO-NE Ride Through Requirement Jim Ryan
9:50 New DG User Interface Andrea Agra and Adam Markopoulos
10:20 Break
10:30 SMART Program Summary Sam Nutter, CLEAResult®
11:30 Questions
12:00 Adjourn
Agenda
42
8:30 Registration
9:00 Welcome, Opening Remarks Will Kern
9:05 Expedited & Standard Process Overview Eric Munzert & Tim Kounlavouth
9:30 ISO-NE Ride Through Requirement Jim Ryan
9:50 New DG User Interface Andrea Agra and Adam Markopoulos
10:20 Break
10:30 SMART Program Summary Sam Nutter, CLEAResult®
11:30 Questions
12:00 Adjourn
Creating A Clean, Affordable, and Resilient Energy Future For the Commonwealth
Solar Massachusetts Renewable Target (SMART) Program Summary
COMMONWEALTH OF MASSACHUSETTS Charles D. Baker, Governor
Karyn E. Polito, Lt. Governor Matthew A. Beaton, Secretary
Judith F. Judson, Commissioner
March 2018
Creating A Clean, Affordable, and Resilient Energy Future For the Commonwealth
Purpose of Presentation and Links to Program Resources
44
• This presentation is designed to provide stakeholders with easily digestible information on the current design and status of the SMART Program, but should not necessarily be relied upon by stakeholders when making financial decisions. DOER strongly recommends that stakeholders consult the official resources listed below.
• For the official program rules, procedures, and eligibility criteria, stakeholders should consult the Department of Energy Resources’ (DOER) SMART regulation (225 CMR 20.00), which was promulgated on August 25, 2017 and can be accessed at: https://www.mass.gov/files/documents/2017/10/16/225cmr20.pdf
• Additionally, the SMART regulation is supplemented by several Guidelines published by DOER, which clarify how elements of the regulation will be enforced and can be found at: Development of the SMART Program Webpage
• At this time, the SMART Program is not fully in effect as the Department of Public Utilities still has an open proceeding to review the model tariff that was jointly filed by the electric distribution companies in September 2017. Information on the status of this proceeding can be found at: http://web1.env.state.ma.us/DPU/Fileroom/dockets/bynumber (type in 17-140 and click go)
• Program updates will continue to be provided by DOER as the program moves closer towards full implementation. Status updates and more information on the program can be found at the following two webpages: masmartsolar.com (Solar Program Administrator’s SMART Website) Development of the SMART Program Webpage
• Interested stakeholders can sign up for email updates from DOER at: https://www.mass.gov/forms/subscribe-to-doer-email-lists (select “Solar PV list include SREC
Contacts”) • Questions on the program should be directed to one of the following:
Creating A Clean, Affordable, and Resilient Energy Future For the Commonwealth
Basic Features of SMART Program
• 1,600 MW AC declining block tariff program that provides fixed Base Compensation Rates to qualified generators
• Base Compensation Rates decline as Capacity Blocks are filled • Applies to all investor owned electric distribution companies • The amount of time a facility may receive compensation under the tariff is
based on facility’s AC rated capacity 10-year term for facilities less than or equal to 25 kW AC 20-year term for facilities larger than 25 kW AC
• Compensation structure differentiated between behind-the-meter and standalone facilities
• Four types of Compensation Rate Adders are available to eligible facilities: Location Based Adders Off-taker Based Adders Energy Storage Adder Solar Tracking Adder
• Maximum project size of 5 MW AC per parcel
45
Creating A Clean, Affordable, and Resilient Energy Future For the Commonwealth
Additional Program Features • Initial Base Compensation Rates were established using the
results of a competitive procurement for larger projects (> 1 MW) and were announced on January 11, 2018
• Base Compensation Rates are based on a facility’s electric distribution company and Capacity Block
• Eligible projects may elect to receive compensation for energy through one of three mechanisms: Net metering (via Net Metering Tariffs) Qualifying facility tariff (via QF Tariffs) Alternative on-bill crediting mechanism (via SMART Tariffs)
• Alternative on-bill crediting mechanism is a new energy compensation option that is designed to be an alternative to virtual net metering
• Alternative on-bill credit is not proposed to be made available to facilities with on-site load
46
Creating A Clean, Affordable, and Resilient Energy Future For the Commonwealth
Additional Program Features
• Program design steers projects towards optimal locations by providing Location Based Adders and Greenfield Subtractors A Greenfield Subtractor will be applied to the Base
Compensation Rate of any facility sited on open space that does not meet the criteria to receive the full incentive
• Energy storage will be compensated via variable adder that is based on the ratio of storage capacity to solar capacity as well as the duration of the storage Minimum performance standards will apply to
ensure grid benefits are realized
47
Creating A Clean, Affordable, and Resilient Energy Future For the Commonwealth
Solar Program Administrator
48
• CLEAResult was announced as the Solar Program Administrator on November 13, 2017
• CLEAResult has partnered with Clean Power Research and will utilize its PowerClerk platform to accept applications
• CLEAResult will be responsible for: Reviewing applications and managing block
reservations Calculating total compensation rates Making recommendations to DOER and electric
distribution companies on project eligibility Creating the public interface for SMART program,
through its website and application portal • CLEAResult’s SMART Program website is now live:
https://masmartsolar.com
Creating A Clean, Affordable, and Resilient Energy Future For the Commonwealth
Factors that Establish a Solar Tariff Generation Unit’s Total Compensation Rate
49
• Electric Distribution Company Service Territory Base Compensation Rates are differentiated by electric distribution company
service territory • Capacity Block
Base Compensation Rates are differentiated by Capacity Block, which are established for each service territory and may be subscribed faster in one service territory than another
• Facility’s AC Rated Capacity Base Compensation Rates are also differentiated by system size
• Compensation Rate Adder Eligibility Depending on its rate capacity, a facility may be eligible to receive one or more
Compensation Rate Adders • Greenfield Subtractor Applicability
If a facility falls under Category 2 or Category 3 Land Use, it will be subject to a Greenfield Subtractor (see slides 14-17)
• Behind-the-Meter Facility vs. Standalone Facility While being classified as Behind-the-Meter vs. Standalone does not change the
total compensation rate for which a facility is eligible under the tariff, the actual incentive payment is calculated differently depending on whether the facility serves an on-site load or exports 100% of its output to the electric grid
Creating A Clean, Affordable, and Resilient Energy Future For the Commonwealth
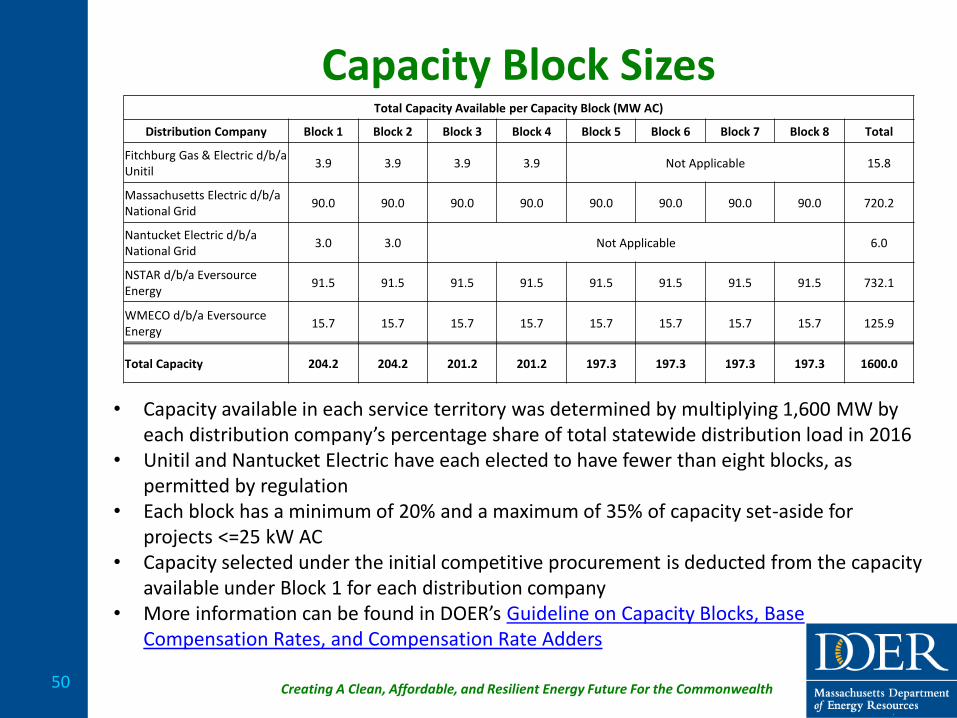
Capacity Block Sizes
50
• Capacity available in each service territory was determined by multiplying 1,600 MW by each distribution company’s percentage share of total statewide distribution load in 2016
• Unitil and Nantucket Electric have each elected to have fewer than eight blocks, as permitted by regulation
• Each block has a minimum of 20% and a maximum of 35% of capacity set-aside for projects <=25 kW AC
• Capacity selected under the initial competitive procurement is deducted from the capacity available under Block 1 for each distribution company
• More information can be found in DOER’s Guideline on Capacity Blocks, Base Compensation Rates, and Compensation Rate Adders
Total Capacity Available per Capacity Block (MW AC)
Distribution Company Block 1 Block 2 Block 3 Block 4 Block 5 Block 6 Block 7 Block 8 Total
Fitchburg Gas & Electric d/b/a Unitil
3.9 3.9 3.9 3.9 Not Applicable 15.8
Massachusetts Electric d/b/a National Grid
90.0 90.0 90.0 90.0 90.0 90.0 90.0 90.0 720.2
Nantucket Electric d/b/a National Grid
3.0 3.0 Not Applicable 6.0
NSTAR d/b/a Eversource Energy
91.5 91.5 91.5 91.5 91.5 91.5 91.5 91.5 732.1
WMECO d/b/a Eversource Energy
15.7 15.7 15.7 15.7 15.7 15.7 15.7 15.7 125.9
Total Capacity 204.2 204.2 201.2 201.2 197.3 197.3 197.3 197.3 1600.0
Creating A Clean, Affordable, and Resilient Energy Future For the Commonwealth
Competitive Procurement Results
51
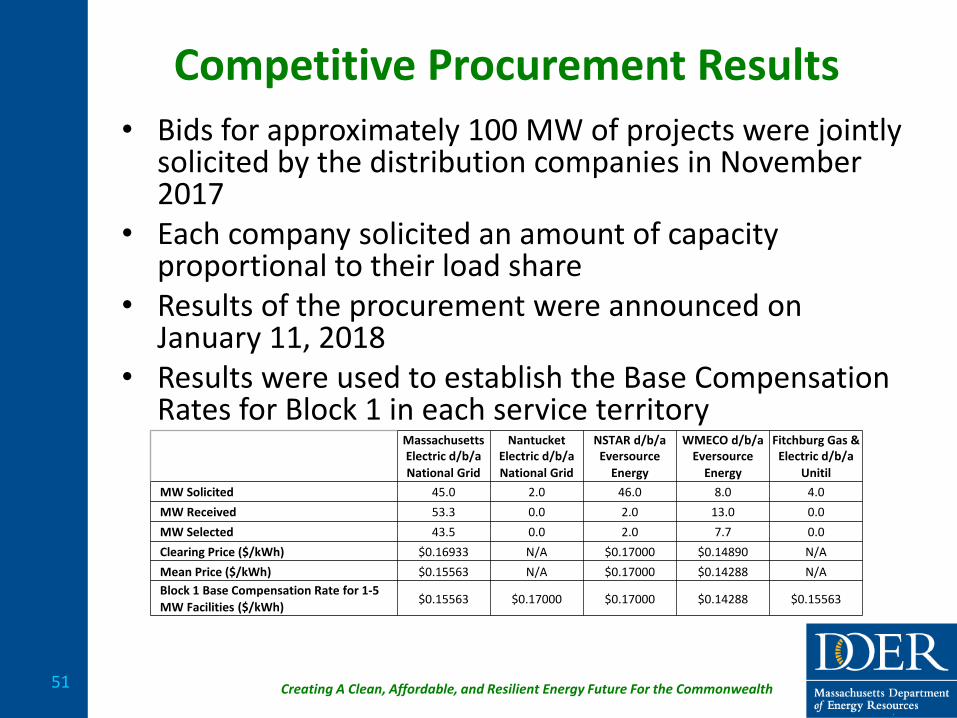
• Bids for approximately 100 MW of projects were jointly solicited by the distribution companies in November 2017
• Each company solicited an amount of capacity proportional to their load share
• Results of the procurement were announced on January 11, 2018
• Results were used to establish the Base Compensation Rates for Block 1 in each service territory
Massachusetts Electric d/b/a
National Grid
Nantucket Electric d/b/a
National Grid
NSTAR d/b/a Eversource
Energy
WMECO d/b/a Eversource
Energy
Fitchburg Gas & Electric d/b/a
Unitil
MW Solicited 45.0 2.0 46.0 8.0 4.0
MW Received 53.3 0.0 2.0 13.0 0.0
MW Selected 43.5 0.0 2.0 7.7 0.0
Clearing Price ($/kWh) $0.16933 N/A $0.17000 $0.14890 N/A
Mean Price ($/kWh) $0.15563 N/A $0.17000 $0.14288 N/A Block 1 Base Compensation Rate for 1-5
MW Facilities ($/kWh) $0.15563 $0.17000 $0.17000 $0.14288 $0.15563

Creating A Clean, Affordable, and Resilient Energy Future For the Commonwealth
Block 1 Base Compensation Rates
52
Electric Distribution Company Generation Unit Capacity Term Length Block 1 Compensation Rate
Fitchburg Gas & Electric d/b/a Unitil Massachusetts Electric d/b/a National Grid
Low income less than or equal to 25 kW AC 10-year $0.35795
Less than or equal to 25 kW AC 10-year $0.31126
Greater than 25 kW AC to 250 kW AC 20-year $0.23345
Greater than 250 kW AC to 500 kW AC 20-year $0.19454
Greater than 500 kW AC to 1,000 kW AC 20-year $0.17119
Greater than 1,000 kW AC to 5,000 kW AC 20-year $0.15563
Nantucket Electric d/b/a National Grid NSTAR Electric d/b/a Eversource Energy
Low income less than or equal to 25 kW AC 10-year $0.39100
Less than or equal to 25 kW AC 10-year $0.34000
Greater than 25 kW AC to 250 kW AC 20-year $0.25500
Greater than 250 kW AC to 500 kW AC 20-year $0.21250
Greater than 500 kW AC to 1,000 kW AC 20-year $0.18700
Greater than 1,000 kW AC to 5,000 kW AC 20-year $0.17000
WMECO d/b/a Eversource Energy
Low income less than or equal to 25 kW AC 10-year $0.32862
Less than or equal to 25 kW AC 10-year $0.28576
Greater than 25 kW AC to 250 kW AC 20-year $0.21432
Greater than 250 kW AC to 500 kW AC 20-year $0.17860
Greater than 500 kW AC to 1,000 kW AC 20-year $0.15717
Greater than 1,000 kW AC to 5,000 kW AC 20-year $0.14288
• Base Compensation Rates in Massachusetts Electric, NSTAR Electric, and WMECO decline 4% per Capacity Block over eight blocks
• Base Compensation Rates in Fitchburg Gas & Electric decline 8.8% per Capacity Block over four blocks • Base Compensation Rates in Nantucket Electric decline by 16% per Capacity Block over two blocks • More information can be found in DOER’s Guideline on Capacity Blocks, Base Compensation Rates, and Compensation
Rate Adders
Creating A Clean, Affordable, and Resilient Energy Future For the Commonwealth
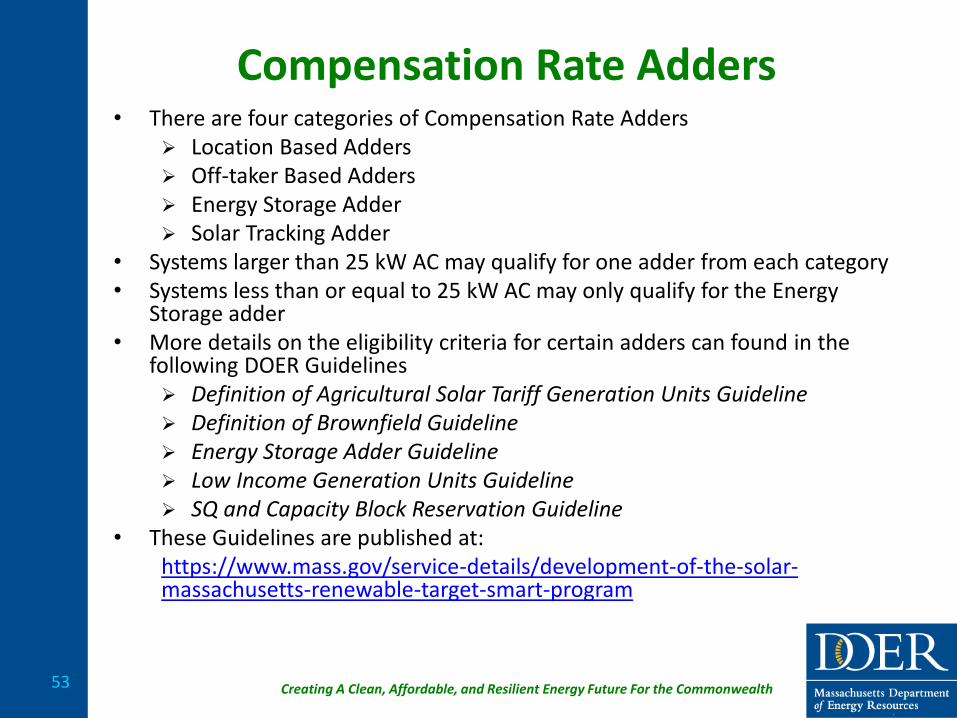
Compensation Rate Adders • There are four categories of Compensation Rate Adders
Location Based Adders Off-taker Based Adders Energy Storage Adder Solar Tracking Adder
• Systems larger than 25 kW AC may qualify for one adder from each category • Systems less than or equal to 25 kW AC may only qualify for the Energy
Storage adder • More details on the eligibility criteria for certain adders can found in the
following DOER Guidelines Definition of Agricultural Solar Tariff Generation Units Guideline Definition of Brownfield Guideline Energy Storage Adder Guideline Low Income Generation Units Guideline SQ and Capacity Block Reservation Guideline
• These Guidelines are published at: https://www.mass.gov/service-details/development-of-the-solar-massachusetts-renewable-target-smart-program
53
Creating A Clean, Affordable, and Resilient Energy Future For the Commonwealth
Adder Values
54
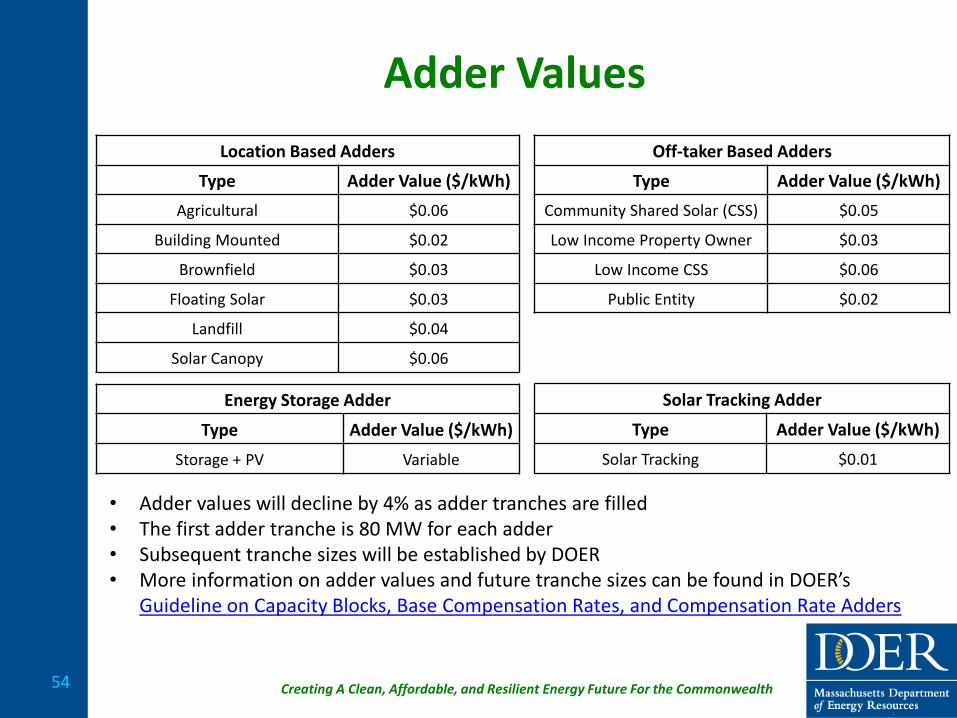
Energy Storage Adder
Type Adder Value ($/kWh)
Storage + PV Variable
Location Based Adders
Type Adder Value ($/kWh)
Agricultural $0.06
Building Mounted $0.02
Brownfield $0.03
Floating Solar $0.03
Landfill $0.04
Solar Canopy $0.06
Off-taker Based Adders
Type Adder Value ($/kWh)
Community Shared Solar (CSS) $0.05
Low Income Property Owner $0.03
Low Income CSS $0.06
Public Entity $0.02
Solar Tracking Adder
Type Adder Value ($/kWh)
Solar Tracking $0.01
• Adder values will decline by 4% as adder tranches are filled • The first adder tranche is 80 MW for each adder • Subsequent tranche sizes will be established by DOER • More information on adder values and future tranche sizes can be found in DOER’s
Guideline on Capacity Blocks, Base Compensation Rates, and Compensation Rate Adders
Creating A Clean, Affordable, and Resilient Energy Future For the Commonwealth
Incentive Payments: Standalone vs. Behind-the-Meter
55
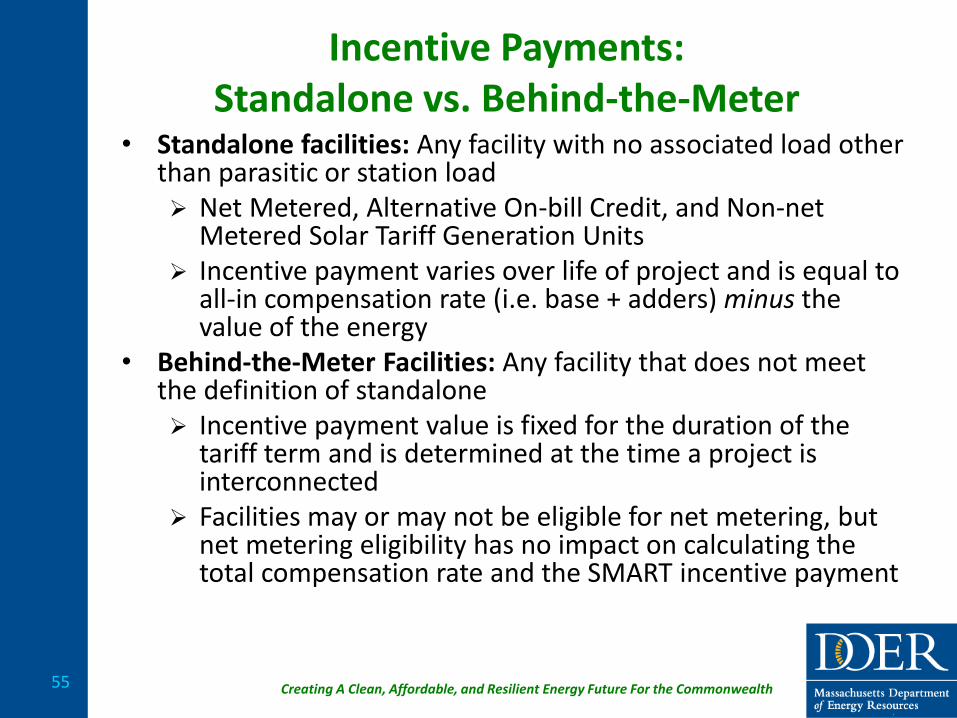
• Standalone facilities: Any facility with no associated load other than parasitic or station load Net Metered, Alternative On-bill Credit, and Non-net
Metered Solar Tariff Generation Units Incentive payment varies over life of project and is equal to
all-in compensation rate (i.e. base + adders) minus the value of the energy
• Behind-the-Meter Facilities: Any facility that does not meet the definition of standalone Incentive payment value is fixed for the duration of the
tariff term and is determined at the time a project is interconnected
Facilities may or may not be eligible for net metering, but net metering eligibility has no impact on calculating the total compensation rate and the SMART incentive payment

Creating A Clean, Affordable, and Resilient Energy Future For the Commonwealth
Energy Compensation and Incentive Compensation for Standalone Facilities
56
• The total compensation to all SMART facilities is intended to account for energy and for incentive compensation
• The method of calculating the incentive payment depends on whether a system is classified as Behind-the-Meter or Standalone
• Standalone facilities: The Value of Energy depends on the type of energy compensation the facility is receiving and will be either a bill credit or direct payment Net Metered Generation Unit
The value of the bill credit determined by the system’s net metering eligibility pursuant to MGL c. 164 § 138 and 220 CMR 18.00
Alternative On-bill Credit Generation Unit The value of the bill credit determined by the final SMART Tariff,
currently proposed at basic service
Non-net Metered Generation Unit The value of the direct compensation subject to the utility
company’s Qualifying Facility Tariff
• Energy compensation + incentive payment always equals the total compensation rate for which a system is qualified under SMART
Creating A Clean, Affordable, and Resilient Energy Future For the Commonwealth
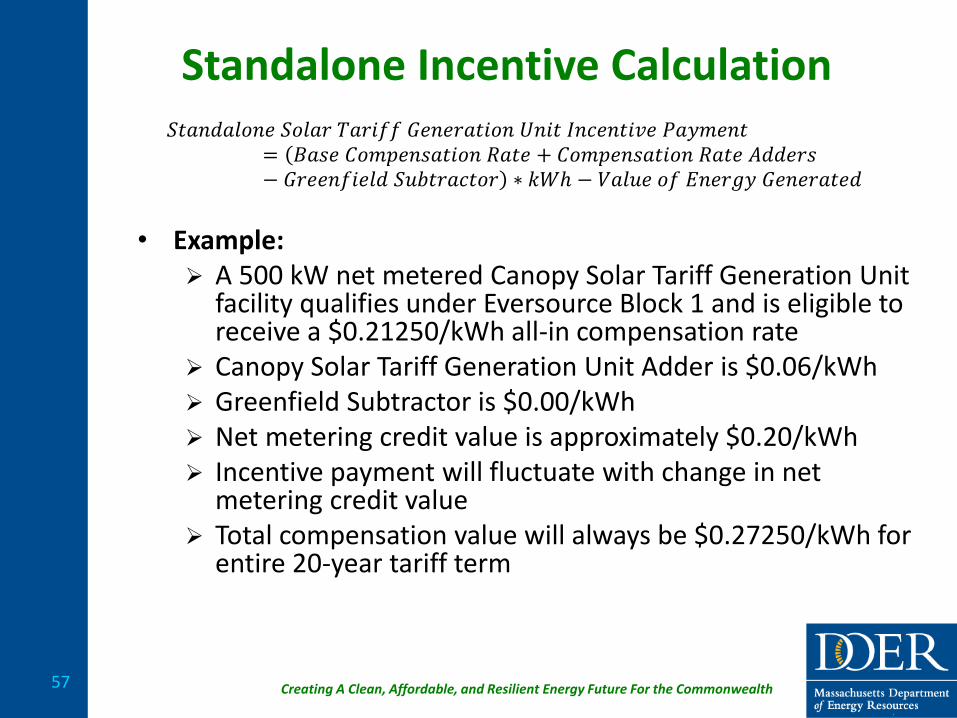
Standalone Incentive Calculation
57
𝑆𝑡𝑎𝑛𝑑𝑎𝑙𝑜𝑛𝑒 𝑆𝑜𝑙𝑎𝑟 𝑇𝑎𝑟𝑖𝑓𝑓 𝐺𝑒𝑛𝑒𝑟𝑎𝑡𝑖𝑜𝑛 𝑈𝑛𝑖𝑡 𝐼𝑛𝑐𝑒𝑛𝑡𝑖𝑣𝑒 𝑃𝑎𝑦𝑚𝑒𝑛𝑡= 𝐵𝑎𝑠𝑒 𝐶𝑜𝑚𝑝𝑒𝑛𝑠𝑎𝑡𝑖𝑜𝑛 𝑅𝑎𝑡𝑒 + 𝐶𝑜𝑚𝑝𝑒𝑛𝑠𝑎𝑡𝑖𝑜𝑛 𝑅𝑎𝑡𝑒 𝐴𝑑𝑑𝑒𝑟𝑠− 𝐺𝑟𝑒𝑒𝑛𝑓𝑖𝑒𝑙𝑑 𝑆𝑢𝑏𝑡𝑟𝑎𝑐𝑡𝑜𝑟 ∗ 𝑘𝑊ℎ − 𝑉𝑎𝑙𝑢𝑒 𝑜𝑓 𝐸𝑛𝑒𝑟𝑔𝑦 𝐺𝑒𝑛𝑒𝑟𝑎𝑡𝑒𝑑
• Example: A 500 kW net metered Canopy Solar Tariff Generation Unit
facility qualifies under Eversource Block 1 and is eligible to receive a $0.21250/kWh all-in compensation rate
Canopy Solar Tariff Generation Unit Adder is $0.06/kWh Greenfield Subtractor is $0.00/kWh Net metering credit value is approximately $0.20/kWh Incentive payment will fluctuate with change in net
metering credit value Total compensation value will always be $0.27250/kWh for
entire 20-year tariff term

Creating A Clean, Affordable, and Resilient Energy Future For the Commonwealth
Energy Compensation and Incentive Compensation for Behind-the-Meter Facilities
58
• The total compensation to all SMART facilities is intended to account for energy and for incentive compensation
• The method of calculating the incentive payment depends on whether a system is classified as Behind-the-Meter or Standalone
• Value of Energy: The Value of Energy approximates the avoided costs of electricity from a kWh of on-site load offset by a solar facility and is equal to the sum of the following: Current volumetric distribution rate Current volumetric transmission rate Current volumetric transition rate Three-year average Basic Service Rate
• These values are based on the distribution company service territory and the rate class of the End-use Customer’s meter (e.g. Massachusetts Electric customer on an R-1 residential rate)
• The value of the incentive payment the facility is eligible to receive is calculated by subtracting the Value of Energy from the total compensation rate to which it is entitled under the tariff
• This resulting incentive payment value is fixed for the duration of the tariff term of the facility and does not fluctuate as electricity prices change as it does for Standalone Facilities
• Because of this structure, Behind-the-Meter facilities will not necessarily always receive the total compensation rate for which a system is qualified under SMART, but may receive more or less depending on 1) the future retail price of electricity, and 2) the amount of electricity exported by the facility to the grid (i.e. facilities that export more electricity may receive less total compensation because their avoided electricity costs will be lower than if the electricity was consumed behind-the-meter)
• More information on how to calculate an estimated Value of Energy and SMART incentive payment value can be found in DOER’s Value of Energy Guideline and Calculator for Behind-the-Meter facilities:
NEED HYPERLINK
Creating A Clean, Affordable, and Resilient Energy Future For the Commonwealth
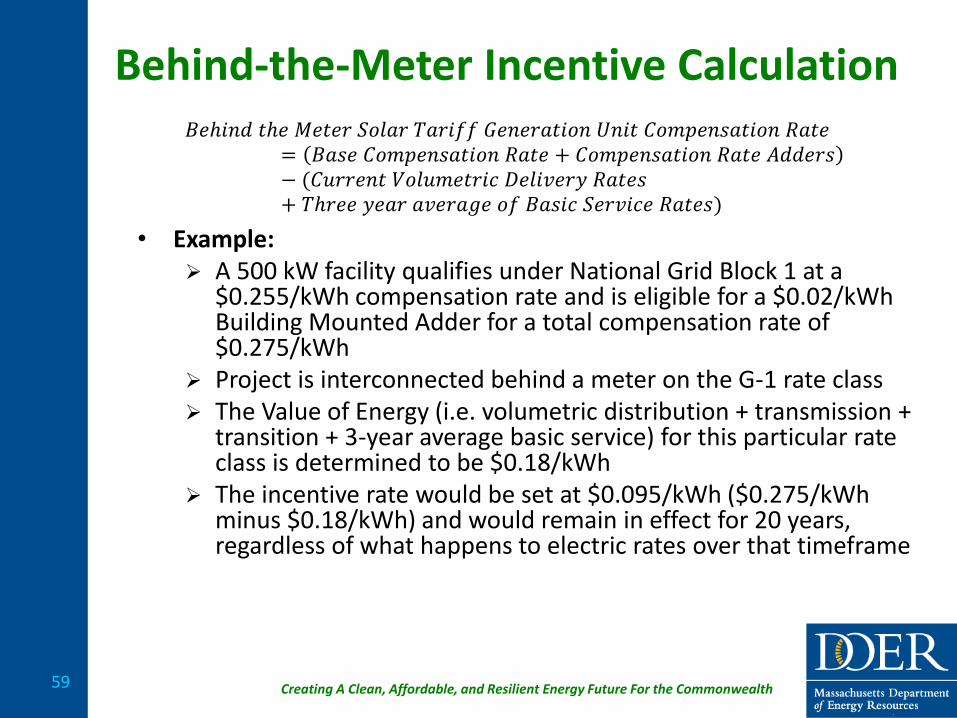
Behind-the-Meter Incentive Calculation
59
𝐵𝑒ℎ𝑖𝑛𝑑 𝑡ℎ𝑒 𝑀𝑒𝑡𝑒𝑟 𝑆𝑜𝑙𝑎𝑟 𝑇𝑎𝑟𝑖𝑓𝑓 𝐺𝑒𝑛𝑒𝑟𝑎𝑡𝑖𝑜𝑛 𝑈𝑛𝑖𝑡 𝐶𝑜𝑚𝑝𝑒𝑛𝑠𝑎𝑡𝑖𝑜𝑛 𝑅𝑎𝑡𝑒= 𝐵𝑎𝑠𝑒 𝐶𝑜𝑚𝑝𝑒𝑛𝑠𝑎𝑡𝑖𝑜𝑛 𝑅𝑎𝑡𝑒 + 𝐶𝑜𝑚𝑝𝑒𝑛𝑠𝑎𝑡𝑖𝑜𝑛 𝑅𝑎𝑡𝑒 𝐴𝑑𝑑𝑒𝑟𝑠− 𝐶𝑢𝑟𝑟𝑒𝑛𝑡 𝑉𝑜𝑙𝑢𝑚𝑒𝑡𝑟𝑖𝑐 𝐷𝑒𝑙𝑖𝑣𝑒𝑟𝑦 𝑅𝑎𝑡𝑒𝑠+ 𝑇ℎ𝑟𝑒𝑒 𝑦𝑒𝑎𝑟 𝑎𝑣𝑒𝑟𝑎𝑔𝑒 𝑜𝑓 𝐵𝑎𝑠𝑖𝑐 𝑆𝑒𝑟𝑣𝑖𝑐𝑒 𝑅𝑎𝑡𝑒𝑠
• Example: A 500 kW facility qualifies under National Grid Block 1 at a
$0.255/kWh compensation rate and is eligible for a $0.02/kWh Building Mounted Adder for a total compensation rate of $0.275/kWh
Project is interconnected behind a meter on the G-1 rate class The Value of Energy (i.e. volumetric distribution + transmission +
transition + 3-year average basic service) for this particular rate class is determined to be $0.18/kWh
The incentive rate would be set at $0.095/kWh ($0.275/kWh minus $0.18/kWh) and would remain in effect for 20 years, regardless of what happens to electric rates over that timeframe
Creating A Clean, Affordable, and Resilient Energy Future For the Commonwealth
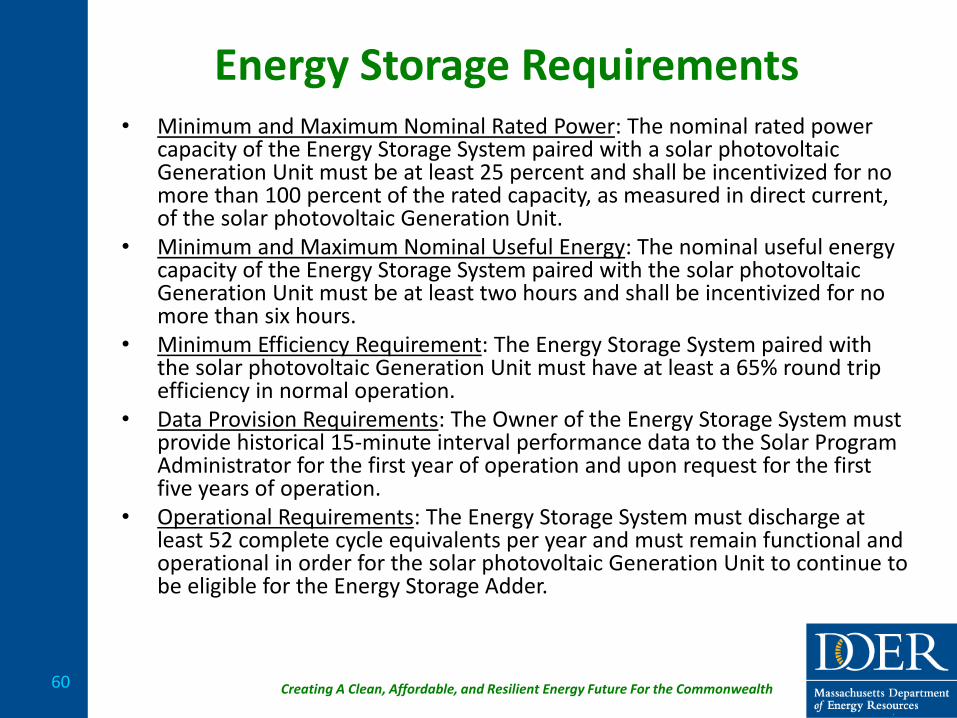
Energy Storage Requirements
60
• Minimum and Maximum Nominal Rated Power: The nominal rated power capacity of the Energy Storage System paired with a solar photovoltaic Generation Unit must be at least 25 percent and shall be incentivized for no more than 100 percent of the rated capacity, as measured in direct current, of the solar photovoltaic Generation Unit.
• Minimum and Maximum Nominal Useful Energy: The nominal useful energy capacity of the Energy Storage System paired with the solar photovoltaic Generation Unit must be at least two hours and shall be incentivized for no more than six hours.
• Minimum Efficiency Requirement: The Energy Storage System paired with the solar photovoltaic Generation Unit must have at least a 65% round trip efficiency in normal operation.
• Data Provision Requirements: The Owner of the Energy Storage System must provide historical 15-minute interval performance data to the Solar Program Administrator for the first year of operation and upon request for the first five years of operation.
• Operational Requirements: The Energy Storage System must discharge at least 52 complete cycle equivalents per year and must remain functional and operational in order for the solar photovoltaic Generation Unit to continue to be eligible for the Energy Storage Adder.
Creating A Clean, Affordable, and Resilient Energy Future For the Commonwealth
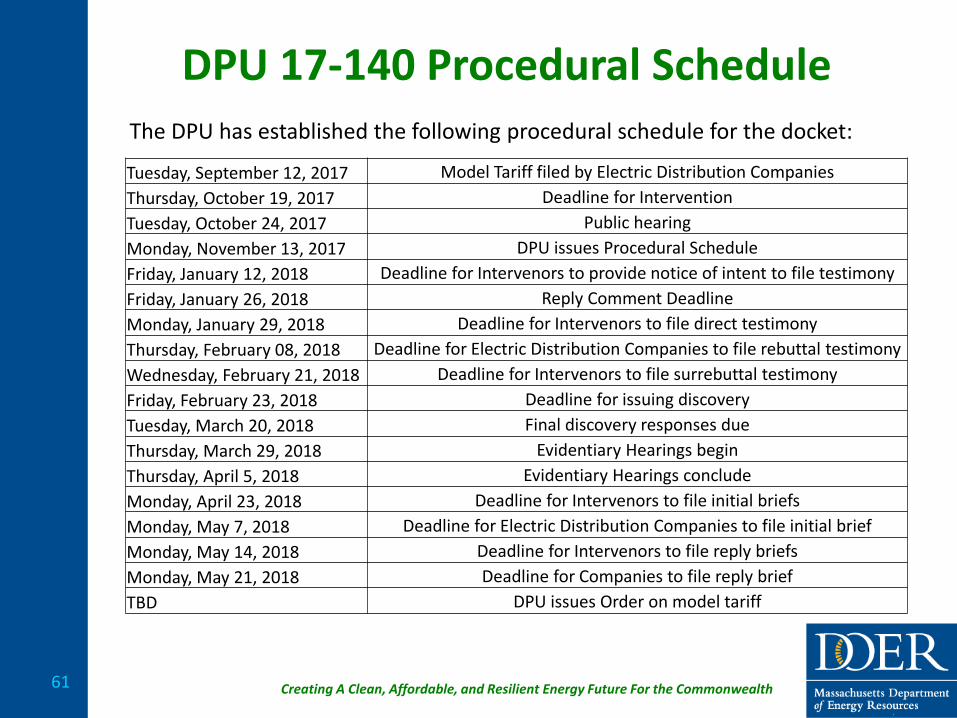
DPU 17-140 Procedural Schedule
61
Tuesday, September 12, 2017 Model Tariff filed by Electric Distribution Companies
Thursday, October 19, 2017 Deadline for Intervention
Tuesday, October 24, 2017 Public hearing
Monday, November 13, 2017 DPU issues Procedural Schedule
Friday, January 12, 2018 Deadline for Intervenors to provide notice of intent to file testimony
Friday, January 26, 2018 Reply Comment Deadline
Monday, January 29, 2018 Deadline for Intervenors to file direct testimony
Thursday, February 08, 2018 Deadline for Electric Distribution Companies to file rebuttal testimony
Wednesday, February 21, 2018 Deadline for Intervenors to file surrebuttal testimony
Friday, February 23, 2018 Deadline for issuing discovery
Tuesday, March 20, 2018 Final discovery responses due
Thursday, March 29, 2018 Evidentiary Hearings begin
Thursday, April 5, 2018 Evidentiary Hearings conclude
Monday, April 23, 2018 Deadline for Intervenors to file initial briefs
Monday, May 7, 2018 Deadline for Electric Distribution Companies to file initial brief
Monday, May 14, 2018 Deadline for Intervenors to file reply briefs
Monday, May 21, 2018 Deadline for Companies to file reply brief
TBD DPU issues Order on model tariff
The DPU has established the following procedural schedule for the docket:

Massachusetts SMART Program
Solar Program Administrator:
888-989-7752 http://masmartsolar.com/ [email protected]
Sam Nutter, Program Director
Questions?
Additional Questions?
For any interconnection questions that are not related to a
submitted application please contact: