Distinct patterns of microbial metabolism associated to riverine ...
12
Distinct patterns of microbial metabolism associated to riverine dissolved organic carbon of different source and quality Berggren, Martin; del Giorgio, Paul A. Published in: Journal of Geophysical Research - Biogeosciences DOI: 10.1002/2015JG002963 Published: 2015-01-01 Link to publication Citation for published version (APA): Berggren, M., & del Giorgio, P. A. (2015). Distinct patterns of microbial metabolism associated to riverine dissolved organic carbon of different source and quality. Journal of Geophysical Research - Biogeosciences, 120(6), 989-999. DOI: 10.1002/2015JG002963 General rights Copyright and moral rights for the publications made accessible in the public portal are retained by the authors and/or other copyright owners and it is a condition of accessing publications that users recognise and abide by the legal requirements associated with these rights. • Users may download and print one copy of any publication from the public portal for the purpose of private study or research. • You may not further distribute the material or use it for any profit-making activity or commercial gain • You may freely distribute the URL identifying the publication in the public portal ?
-
Upload
nguyenthien -
Category
Documents
-
view
223 -
download
0
Transcript of Distinct patterns of microbial metabolism associated to riverine ...
LUND UNIVERSITY
PO Box 117221 00 Lund+46 46-222 00 00
Distinct patterns of microbial metabolism associated to riverine dissolved organiccarbon of different source and quality
Berggren, Martin; del Giorgio, Paul A.
Published in:Journal of Geophysical Research - Biogeosciences
DOI:10.1002/2015JG002963
Published: 2015-01-01
Link to publication
Citation for published version (APA):Berggren, M., & del Giorgio, P. A. (2015). Distinct patterns of microbial metabolism associated to riverinedissolved organic carbon of different source and quality. Journal of Geophysical Research - Biogeosciences,120(6), 989-999. DOI: 10.1002/2015JG002963
General rightsCopyright and moral rights for the publications made accessible in the public portal are retained by the authorsand/or other copyright owners and it is a condition of accessing publications that users recognise and abide by thelegal requirements associated with these rights.
• Users may download and print one copy of any publication from the public portal for the purpose of privatestudy or research. • You may not further distribute the material or use it for any profit-making activity or commercial gain • You may freely distribute the URL identifying the publication in the public portal ?

Distinct patterns of microbial metabolism associatedto riverine dissolved organic carbonof different source and qualityMartin Berggren1,2 and Paul A. del Giorgio1
1Département des sciences biologiques, Université du Québec à Montréal, Montréal, Québec, Canada, 2Now at Departmentof Physical Geography and Ecosystem Science, Lund University, Lund, Sweden
Abstract Dissolved organic carbon (DOC) in rivers contains a wide range ofmolecules that can be assimilatedby microbes. However, there is today no integrated understanding of how the source and composition of thisDOC regulate the extent to which the DOC can support microbial growth and respiration. We analyzed patternsin microbial metabolism of DOC from different streams and rivers in Québec, by combining short-term bacterialproduction and respiration measurements with long-term DOC loss and analyses of bacterial use of differentsingle substrates. We show that distinct metabolic patterns indeed exist across catchments, reflecting thevarying nature and sources of the DOC. For example, DOC from forest headwaters systematically supported thehighest bacterial growth efficiency (BGE) that was recorded, while in contrast DOC in peat bog drainage wasused with significantly lower BGE. The carbon consumption in clear mountain rivers, possibly represented byautochthonous algal DOC, supported the highest bacterial respiration rates and the highest long-term DOClosses. By using principle component analysis, we demonstrate how the major axes of variation in all of themeasuredmetabolic responses are tightly connected to spectrofluorometrical DOC composition indicators andto isotopic indicators of DOC source. If causality is assumed, our results imply that changes in DOC supply fromdifferent sources, for example, caused by land use or climate change, should result in dramatic changes inthe patterns of aquatic microbial metabolism and thus in altered aquatic ecosystem functioning, with likelyconsequences for food-web structures and greenhouse gas balances.
1. Introduction
Loading of terrestrially derived dissolved organic carbon (DOC) shapes the functioning of inland waterecosystems, particularly through processes that are controlled by bacteria. For example, the bacterialbiomass production (BP) based on DOC is increasingly recognized as a pathway fueling aquatic microbialfood webs [Azam et al., 1983; Jansson et al., 2007]. Furthermore, the bacterial respiration (BR) of DOCcontributes to globally significant greenhouse gas emissions [Lapierre et al., 2013; Tranvik et al., 2009] andis one of the causes of hypoxia in poorly mixed surface waters [Kerr et al., 2013; Zhang and Li, 2010].Bacterial DOC degradation processes can partly be predicted from the physical environment in the water,defined by factors such as temperature, inorganic nutrient supply, and ultraviolet (UV) radiation [Anesioet al., 2005; Apple et al., 2006; Tranvik, 1998], but they are also dependent upon the intrinsic chemicalproperties of the DOC, i.e., the DOC composition [Berggren et al., 2007; Moran et al., 1999].
It has recently been shown that the composition of the DOC strongly influences the overall potential of theDOC to be consumed on different time scales [Koehler et al., 2012]. Furthermore, the DOC compositionregulates both absolute and relative microbial C consumption rates [Guillemette and del Giorgio, 2011] andthe metabolic allocation of this consumed C to either BP or BR [Berggren et al., 2007]. Thus, the microbialprocessing of DOC clearly has “various facets” (in the sense of Guillemette and del Giorgio [2011]), yet fewstudies have simultaneously considered these different aspects of the metabolism [Guillemette anddel Giorgio, 2011; Koehler et al., 2012]. Surprisingly, there is today no integrated understanding of how DOCsource regulates the patterns in microbial C assimilation, growth, and respiration and how this regulationis mediated by variations in DOC composition.
Most studies that consider the degradability of DOC are centered around the use of a single variable,generically referred to as bioavailable DOC (BDOC) [Servais et al., 1987], measured as the cumulativebacterial DOC consumption in the dark during a fixed time period. However, this approach ignores the
BERGGREN AND DEL GIORGIO METABOLIC RESPONSES TO DOC SOURCE 989
PUBLICATIONSJournal of Geophysical Research: Biogeosciences
RESEARCH ARTICLE10.1002/2015JG002963
Key Points:• Riverine DOC is associated to patternsin microbial metabolic responses
• These metabolic responses arestrongly linked to both DOC qualityand DOC source
• Changes in DOC source affect aquaticecosystem functioning
Supporting Information:• Supporting Information S1
Correspondence to:M. Berggren,[email protected]
Citation:Berggren, M., and P. A. del Giorgio (2015),Distinct patterns of microbial metabolismassociated to riverine dissolved organiccarbon of different source and quality,J. Geophys. Res. Biogeosci., 120, 989–999,doi:10.1002/2015JG002963.
Received 18 FEB 2015Accepted 2 MAY 2015Accepted article online 7 MAY 2015Published online 3 JUN 2015
©2015. The Authors.This is an open access article under theterms of the Creative CommonsAttribution-NonCommercial-NoDerivsLicense, which permits use and distri-bution in any medium, provided theoriginal work is properly cited, the use isnon-commercial and no modificationsor adaptations are made.
known reactivity continuum of the DOC, in which different compounds are used on different time scales[Amon and Benner, 1996]. Furthermore, the BDOC concept does not take anabolic (BP) and catabolic (BR)parts of the metabolism into consideration, nor key metabolic parameters such as bacterial growthefficiency (BGE=BP/(BP + BR)). These are all aspects of metabolism that have unique effects on thefunctioning of aquatic ecosystems and which are likely dependent on the chemical nature of the DOC andtherefore its source [Berggren et al., 2007; Guillemette and del Giorgio, 2011]. Finally, DOC degradationstudies very seldom measure the use of specific groups of compounds, which is a limitation consideringthe significant importance of amino acid (AA), carbohydrate (CH), and organic acid (OA) metabolism thathas recently been demonstrated [Berggren et al., 2010; Salcher et al., 2013]. Thus, there is clearly aknowledge gap in how DOC source and composition regulate these distinctly different aspects ofmicrobial processing of DOC in aquatic ecosystems.
To fill this gap, we performed bioassays that combine short-term bacterial production and respirationmeasurements with long-term DOC loss and analyses of bacterial substrate consumption profiles. Usingthis approach, we determine the pattern in bacterial metabolism of DOC from rivers that differ greatly inorder, location, and relative catchment cover of forests and peat bogs. Previous studies have shown thatthe degradation potential depends on the origin of the DOC in the landscape, e.g., peat wetlands, forestsoils, or autochthonous algae [Berggren et al., 2007; Guillemette and del Giorgio, 2011]. Differences in DOCmetabolism have also been found between headwater sources and downstream aquatic networks[Berggren et al., 2009] and between clear-water and brown-water systems [Koehler et al., 2012]. Therefore, itwas predicted that the DOC from our diverse set of streams and rivers in Québec (Canada) would result incontrasting patterns of metabolic responses that reflect the varying chemical nature and sources of theriverine DOC. Using basic ordination techniques and correlative analyses, we examine these metabolicpatterns in relation to DOC composition assessed through peaks in excitation-emission fluorescencespectra and in relation to the isotopic composition of both the bulk DOC and that of the CO2 that resultfrom the degradation of DOC. Our results provide comprehensive support to date for the view that thereare distinct microbial metabolic patterns associated to riverine DOC of different sources, suggesting thatchanges in DOC source have broad consequences on the functioning of the receiving aquatic ecosystems.
2. Materials and Methods2.1. Study Sites and Sampling Conditions
Twelve streams and rivers in Québec (Table 1) were selected to represent broad gradients in catchment area,peat-land influence, and degree of DOC and water color (Table 1). The rationale for selecting such a diverseset of sites was to maximize the representation of DOC of different terrestrial source (peat bogs versus arange of forest soils) but also DOC of different degradation state (less degraded terrestrial DOC inheadwaters, compared to in downstream nonheadwaters) and with different contribution fromautochthonous algae. Presumably, the relative contribution of algal DOC can be significant in clear watersand in large catchments with long water retention times. The sites were sampled twice between 31 May and24 August 2010, during summer low-flow conditions. Catchment discharge was 0.27± 0.47mmd�1 (mean±SD) in 14 out of 24 sampling occasions when in situ flow could be directly measured, using either ahandheld acoustic Doppler velocimeter (YSI/SonTek, Inc., San Diego, CA) or a bucket and stopwatch method.As the study was not designed to explore seasonal patterns, the duplicate sampling was performed only toobtain a minimum of replication needed to get representative summer mean values for each catchment.
2.2. Field Sampling
The streams and rivers were sampled at 20–30 cm depths, by hand or with wading suit and a 3m polesampler, and all samples were stored in cooling boxes with ice or in laboratory fridges until analysis. Waterfor analyses of in situ water chemistry (DOC concentrations, isotope ratios, optical properties, andnutrients) was filtered on-site (0.45 μm; Sarstedt, Germany) into acid-washed and stream water-rinsed40mL glass vials. In addition, one 20 L extensively prerinsed 20 L low-density polyethylene cubitainer wasfilled for each site to measure the various aspects of microbial metabolism targeted in this study: bacterialproduction and respiration, DOC consumption and the isotopic composition of DOC consumed duringdark incubations, and the substrate utilization profiles using Biolog Ecoplates (as described below). Allincubations were initiated on the same day as the sampling, within 2–6 h.
Journal of Geophysical Research: Biogeosciences 10.1002/2015JG002963
BERGGREN AND DEL GIORGIO METABOLIC RESPONSES TO DOC SOURCE 990

2.3. Microbial Metabolism
For all microbial metabolic measurements weused water from the 20 L cubitainer sample,gently pressure-filtered through 1.0μm “A/EGlass” filters (PALL Life Sciences, NY, USA;142mm diameter) using a peristaltic pump,allowing most bacteria to pass while removingmicrozooplankton and larger particles [delGiorgio and Pace, 2008]. To avoid influence onbacterial metabolic performance of variableambient inorganic nutrient concentrations andtemperature, which could mask the response tointrinsic DOC properties, the filtered water wasspiked with 0.5mgNL�1 as NH4NO3 and50μg P L�1 as KH2PO4 before initiation ofbioassays, and all incubations were carried outat 20 °C in the dark, using sealed containersplaced in circulating water baths or climatechambers.
On the same filtered and nutrient-spiked waterfrom the cubitainer, bacterial respiration (BR)was determined as dark O2 consumption using aFibox 3 system (PreSens, Germany) followingMarchand et al. [2009]. Duplicate 500mLErlenmeyer flasks, equipped with O2 optodes,were filled for each sample and sealed withsilicone stoppers. The O2 concentrations weremeasured 7 times during 72 h incubations.Respiration rates were calculated as the slope oflinear regression lines of O2 versus incubationtime assuming a RQ (respiratory quotient) of 1,which is close to the mean bacterial RQ in riversof the region [Berggren et al., 2012]. InErlenmeyer flasks of the same type, BP wasmeasured after 0, 12, 36, and 72 h of incubation,following the [3H]-leucine incorporation methodby Smith and Azam [1992]. Triplicate aliquots of1.5mL water samples were exposed to 40 nM[3H]-leucine during 1 h. Average blank-correctedrates of leucine uptake were converted tocarbon production rates by applying thestandard conversion factor 1.55 kg Cmol leu�1
multiplied by an isotopic dilution factor of 2[Simon and Azam, 1989]. Finally, integratedaverage values of BP over time were calculatedusing the trapezoidal rule and dividing byincubation time. BGE was calculated as BPdivided by the sum of BP and BR. BP and BRrates were expressed relative to the DOC, as%d�1. Long-term carbon consumption (LTCC;percentage lost) was assessed by comparingambient DOC concentration with DOC measuredin water that had been incubated for 1 yearTa
ble
1.Lo
catio
n,Drainag
eArea,an
dIn
Situ
Water
Che
mistryof
12Stream
andRiverSitesin
Qué
becDuringSu
mmer
LowFlow
2010
a ,b
No.
StationNam
eLatitud
e,Lo
ngitu
de(DD)
Headw
ater
Peat
Bogs
Drain
Area(km2)
DOC(m
gL�
1)
CDOMab
s440
(m�1)
Chl
a(μgL�
1)
TP(μgL�
1)
TN(m
gL�
1)
Site
Categ
ory
1Stream
#09
48.478
,�79
.437
YES
NO
0.2
10.7[10.2–
11.2]
2.6[2.6–2
.6]
0.9[0.6–1
.2]
28[28–
29]
0.29
[0.19–
0.39
]Headw
ater
foreststream
2Pe
tit-NordSu
ivit
49.678
,�79
.019
YES
YES
0.5
11.9[8.0–1
5.7]
7.4[4.4–1
0.5]
2.2[1.0–3
.3]
12[10–
14]
0.24
[0.20–
0.28
]Pe
at-in
flue
nced
stream
/river
3Stream
#08
48.476
,�79
.433
YES
NO
0.7
10.7[9.6– 1
1.8]
2.1[1.3–2
.9]
1.4[1.3–1
.4]
32[22–
42]
0.33
[0.31–
0.34
]Headw
ater
foreststream
4Stream
#07
48.530
,�79
.465
YES
NO
0.8
17.2[14.7–
19.8]
9.8[9.2–1
0.4]
0.9[0.5–1
.3]
18[16–
21]
0.45
[0.44–
0.46
]Headw
ater
foreststream
5Pe
titAigue
belle
48.449
,�78
.751
NO
NO
1.6
8.5[8.0–9
.1]
3.2[2.4–4
.0]
3.0[2.4–3
.5]
12[11–
13]
0.40
[0.35–
0.44
]Brow
nforestriv
er6
Stream
#32
45.749
,�74
.689
NO
NO
3.0
7.8[5.8–9
.8]
1.2[0.8–1
.6]
0.4[0.2–0
.5]
10[9–1
1]0.27
[0.23–
0.32
]Clear
mou
ntainriv
er7
Ruisseau
Brun
et48
.455
,�78
.731
NO
NO
17.7
12.5[9.8–1
5.1]
6.9[5.0–8
.9]
1.4[1.2–1
.6]
16[12–
19]
0.37
[0.30–
0.45
]Brow
nforestriv
er8
Inter-NordSu
ivit
49.745
,�79
.036
NO
YES
93.0
19.3[17.2–
21.4]
14.9[14.6–
15.2]
1.1[1.0–1
.2]
17[14–
19]
0.46
[0.39–
0.52
]Pe
at-in
flue
nced
stream
/river
9RivièreMag
ousi
48.436
,�79
.428
NO
NO
515.4
10.5[8.0–1
3.0]
4.7[2.0–7
.5]
7.4[5.2–9
.6]
66[48–
85]
0.42
[0.35–
0.48
]Brow
nforestriv
er10
RivièreKino
jevis
48.432
,�78
.662
NO
NO
1751
.410
.8[10.2–
11.5]
4.1[3.5–4
.7]
4.8[3.1–6
.6]
34[33–
35]
0.61
[0.55–
0.68
]Brow
nforestriv
er11
LaRo
uge
45.794
,�74
.690
NO
NO
5236
.78.6[6.7– 1
0.5]
1.3[1.2–1
.5]
1.5[0.4–2
.6]
11[10–
11]
0.25
[0.23–
0.27
]Clear
mou
ntainriv
er12
Harrican
a49
.859
,�78
.646
NO
YES
9651
.413
.3[11.8-14
.8]
7.2[6.4-7.9]
1.5[0.1-3.0]
41[36–
46]
0.43
[0.39-0.47
]Pe
at-in
flue
nced
stream
/river
a Becau
seof
missing
DOCinsitu
datainthreecases,theun
derline
dDOCvalues
represen
tDOCconcen
trations
measuredearly
durin
gthebioa
ssays,correctedforthe
amou
ntof
O2-in
ferred
DOC
loss
upto
thepo
intof
measuremen
t.bWater
chem
istryisprov
ided
asmeans
ofdu
plicatesamplings
(low-highrang
ein
brackets).Pe
atbo
gscovered10
–40%
ofthepe
atcatchm
ents,w
hich
issufficien
ttocausedo
minan
ceof
peat-
deriv
edDOCin
borealstream
sdu
ringlowflow
[Lau
donet
al.,20
11].
Journal of Geophysical Research: Biogeosciences 10.1002/2015JG002963
BERGGREN AND DEL GIORGIO METABOLIC RESPONSES TO DOC SOURCE 991

(365 days) in 1 L acid-washed Duran glass bottles, with a gas headspace (~100mL) that theoretically hadenough dissolved O2 to oxidize all DOC in the samples.
A 1.0μm filtered water sample from each cubitainer was also used to measure the capacity of the riverinebacterial communities to degrade six amino acids, 10 carbohydrates, and nine organic acids (standardsubstrates; in triplicate) using the Biolog EcoplateTM (CA, USA), in the dark at 20 °C. Incubations wereinitiated 2–6 h after field sampling. The respiration by the bacterial community reduces a tetrazolium dyethat is included with each substrate, thus inducing a color development that is measured in an opticalassay [Garland and Mills, 1991]. The bottom of the Ecoplate wells includes an inorganic nutrient mix bydefault (together with the C substrate and the color indicator), and thus, we avoided double nutrientadditions by not spiking the original sample water with N and P in this case. We calculated the mean colordevelopment values for each class of compounds, measured at the overall “average well colordevelopment” of 0.5.
2.4. Ambient Water Chemistry and DOC Composition
To characterize the ambient water chemistry (DOC, nutrients, and optical analyses), we used the 0.45μmfiltered 40mL samples, which had been prepared in field. The DOC was measured on an OI Analytical totalinorganic carbon/total organic carbon (TIC/TOC) analyzer (College Station, TX, USA), total phosphorus (TP)using the molybdenum-blue method after persulfate digestion and total nitrogen (TN) as nitrates afteralkaline persulphate digestion. The isotopic composition of organic carbon was analyzed as describedfurther below. DOC absorbance were scanned using a UV/visible UltroSpec 2100 spectrophotometer(Biochrom Ltd, Cambridge, UK), and Chl a was measured spectrophotometrically in ethanol extracts.Colored dissolved organic matter (CDOMabs440) was calculated as the absorbance at 440 nm, corrected forturbidity by subtracting the absorbance at 690 nm, and converted to naperian units through division bycuvette length in meters and by multiplying with standard correction factor 2.303.
The DOC fluorescence excitation-emission spectra were measured on nondiluted water samples using aShimadzu RF5301 PC (Japan), at excitation wavelengths of 250–450 nm in 5 nm increments and emissionwavelengths of 280–600 nm in 2 nm increments. The ultrapure water blank-corrected spectra were furthercorrected for inner filter effects [McKnight et al., 2001], converted to Raman units, and used together with aPARAFAC model to quantify the main fluorescence peaks (shown in Figure S1 in the supportinginformation). The model was developed using spectra for 1577 samples from lakes, rivers, ponds, andwetlands from boreal Québec [Lapierre and del Giorgio, 2014], using MATLAB DOMfluor 1.7 [Stedmon andBro, 2008]. Thus, the PARAFAC components reflect fluorescent properties that are widespread across borealaquatic ecosystems. Nonnegativity constraints were applied and outliers removed to maximize overallrepresentativeness. Among the outliers, three of the samples from this study were not included in themodeling process due to high absorbance (>0.6 cm�1 at 254 nm), which could affect the inner-filtercorrection and subsequently bias the model [Miller et al., 2010]. The outlier-free model contained 1349samples and was validated using split-half analysis. The outlier-free model was then reapplied a posteriorion these samples to evaluate the concentrations of the PARAFAC components [Lapierre and del Giorgio,2014]; the study by Miller et al. [2010] suggests that this procedure may slightly bias estimates of theconcentrations of humic- and fulvic-like components identified in this study by up to 10% in the highestabsorbance sample.
2.5. Isotope Composition of Respired Carbon and Bulk DOC
To determine the δ13C of the respired CO2, the Keeling plot method was used [Karlsson et al., 2007]. For eachsampling site, the filtered (1.0μm) and nutrient-spiked water from the cubitainers (see “MicrobialMetabolism” section above) was used to prepare a series of 40mL top-filled acid-washed borosilicate glassvials with butyl rubber septa. At four different time points, the first three within the initial month and thefourth after 4months of incubation, samples were poisoned by injection of 5μL of saturated HgCl2 andanalyzed for dissolved inorganic carbon (DIC) and δ13C-DIC. The δ13C of the respired CO2 was calculated asthe y axis intercept of the linear regression line for δ13C-DIC as a function of 1/[DIC]. Keeling plot resultsand associated uncertainties are presented in Figure S2 in the supporting information.
In selected stream samples, Δ14C of DIC was measured on day 0 and day 30 in parallel incubations in 300mLBOD vials with glass stoppers. Again, the prefiltered (1.0μm) and nutrient-spiked water was used. These were
Journal of Geophysical Research: Biogeosciences 10.1002/2015JG002963
BERGGREN AND DEL GIORGIO METABOLIC RESPONSES TO DOC SOURCE 992
fixed with 40μL of saturated HgCl2 and later sparged with ultrahigh purity helium gas after addition of 3mL of85% H3PO4, whereby the evolved CO2 was collected cryogenically, purified on a vacuum extraction line, andcollected in break-seal tubes for Δ14C analysis. Graphitizing and determination of mass and Δ14C of theextracted DIC were performed at the Vienna Environmental Research Accelerator (VERA) laboratory of theUniversity of Vienna. Although these incubations contained only two time points, Keeling plot interceptswere again used, here for Δ14C-DIC versus 1/[DIC], to estimate the Δ14C of the respired CO2. The δ13C of DOCand DIC was measured using an OI Analytical (College Station, TX, USA) TIC/TOC analyzer coupled to a DELTAplus XL (Thermo Finnigan, Bremen, Germany) isotope ratio mass spectrometer with a ConfloII system. Inaddition, DOC samples were freeze-dried, acidified, graphitized, and analyzed for Δ14C at VERA.
2.6. Statistics
Patterns in metabolism (bioassay variables) and DOC fluorescence (percent contribution by each PARAFACcomponent to total fluorescence) between sites were explored through principal component analysis(PCA; nonrotated solutions) using SPSS 19. Component scores were obtained using the “regression”method in SPSS. The same statistical software was also used for basic statistical tests.
3. Results and Discussion3.1. Patterns in DOC Composition Across Catchments
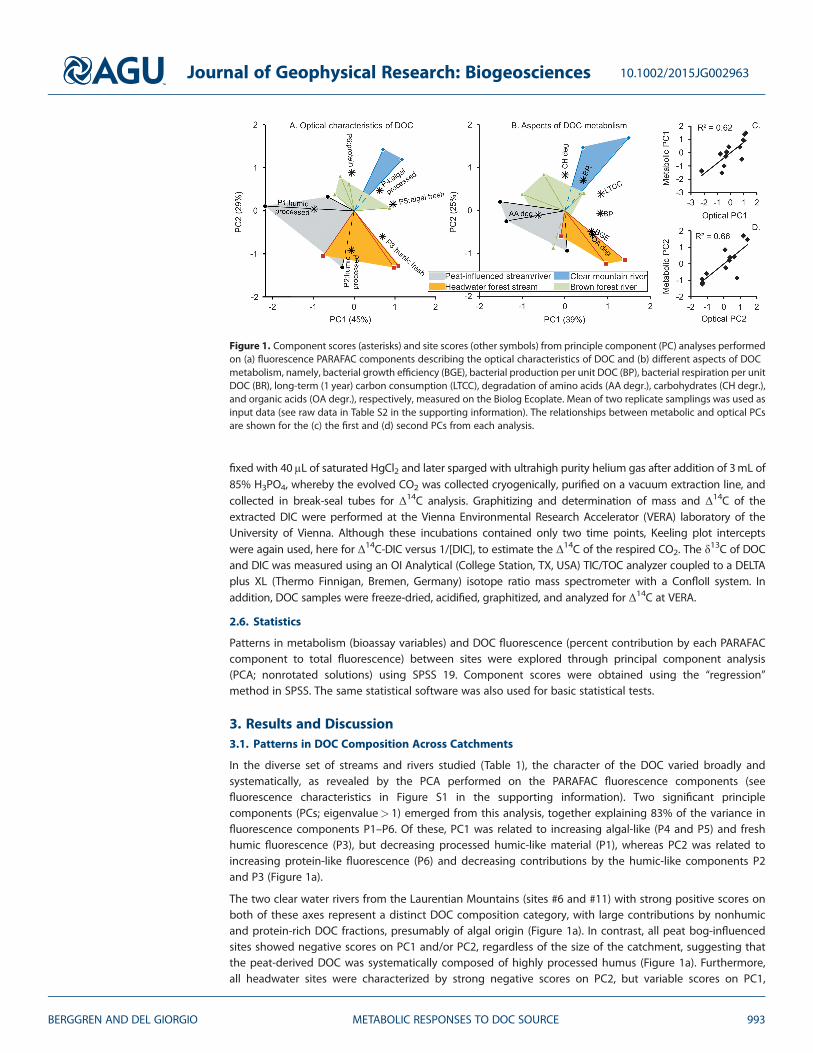
In the diverse set of streams and rivers studied (Table 1), the character of the DOC varied broadly andsystematically, as revealed by the PCA performed on the PARAFAC fluorescence components (seefluorescence characteristics in Figure S1 in the supporting information). Two significant principlecomponents (PCs; eigenvalue> 1) emerged from this analysis, together explaining 83% of the variance influorescence components P1–P6. Of these, PC1 was related to increasing algal-like (P4 and P5) and freshhumic fluorescence (P3), but decreasing processed humic-like material (P1), whereas PC2 was related toincreasing protein-like fluorescence (P6) and decreasing contributions by the humic-like components P2and P3 (Figure 1a).
The two clear water rivers from the Laurentian Mountains (sites #6 and #11) with strong positive scores onboth of these axes represent a distinct DOC composition category, with large contributions by nonhumicand protein-rich DOC fractions, presumably of algal origin (Figure 1a). In contrast, all peat bog-influencedsites showed negative scores on PC1 and/or PC2, regardless of the size of the catchment, suggesting thatthe peat-derived DOC was systematically composed of highly processed humus (Figure 1a). Furthermore,all headwater sites were characterized by strong negative scores on PC2, but variable scores on PC1,
Figure 1. Component scores (asterisks) and site scores (other symbols) from principle component (PC) analyses performedon (a) fluorescence PARAFAC components describing the optical characteristics of DOC and (b) different aspects of DOCmetabolism, namely, bacterial growth efficiency (BGE), bacterial production per unit DOC (BP), bacterial respiration per unitDOC (BR), long-term (1 year) carbon consumption (LTCC), degradation of amino acids (AA degr.), carbohydrates (CH degr.),and organic acids (OA degr.), respectively, measured on the Biolog Ecoplate. Mean of two replicate samplings was used asinput data (see raw data in Table S2 in the supporting information). The relationships between metabolic and optical PCsare shown for the (c) the first and (d) second PCs from each analysis.
Journal of Geophysical Research: Biogeosciences 10.1002/2015JG002963
BERGGREN AND DEL GIORGIO METABOLIC RESPONSES TO DOC SOURCE 993
indicating that different types of humicDOC, fresh or processed, dominatedthe DOC. The remaining sites, whichrepresented brown-water forest riversof intermediate sizes, showed slightpositive scores on PC2 (protein-likematerial), but both negative andpositive scores on PC1.
In another study of the same rivers,fluorescence peaks determined usingPARAFAC are associated with distinctand extremely diverse families ofmolecules, as determined usingultrahigh-resolution mass spectrometry(Fourier transform ion cyclotronresonance mass spectrometry) [Stubbinset al., 2014]. The segregation of riversbased on fluorescence properties ofthe DOC is thus based on fundamentaldifferences in their respective molecularcomposition.
3.2. Linking DOC Composition toBacterial Metabolic Responses
According to our prediction, patterns inDOC source and composition reflectedin the fluorescence characteristics andtheir underlying molecular structuresshould be linked to the various aspectsof bacterial DOC metabolism. To testthis, we performed a new PCA on all ofthe metabolic variables obtained fromthe bioassays and compared theresulting PCs with the PCs for DOCfluorescence characteristics. This time,the PCA procedure extracted threesignificant PCs that together explained85% of the variance in the metabolicdata. Site scores were again clearly
clustered on the first two axes of this model (Figure 1b); PC1 was characterized by positive loadings onvariables describing anabolism (BP and BGE), organic acid degradation, and long-term DOC consumption(LTCC); PC2 showed positive loadings for catabolism (BR) and carbohydrate degradation, but negativeloading for organic acid degradation.
In support of our prediction, the PCs based on metabolism and on fluorescence, respectively, were positivelyand significantly correlated with each other, both on the first axis (r2 = 0.62, p< 0.001, n= 12; Figure 1c) andon the second axis (r2 = 0.66, p< 0.01, n=12; Figure 1d). The third axis in the PCA for metabolism explained17% of the variation (data not shown) but was not included in this analysis because it showed no relationshipwith the DOC composition indicators (Table S1 in the supporting information).
3.3. Comparisons Between Emerging Categories of Catchment Type
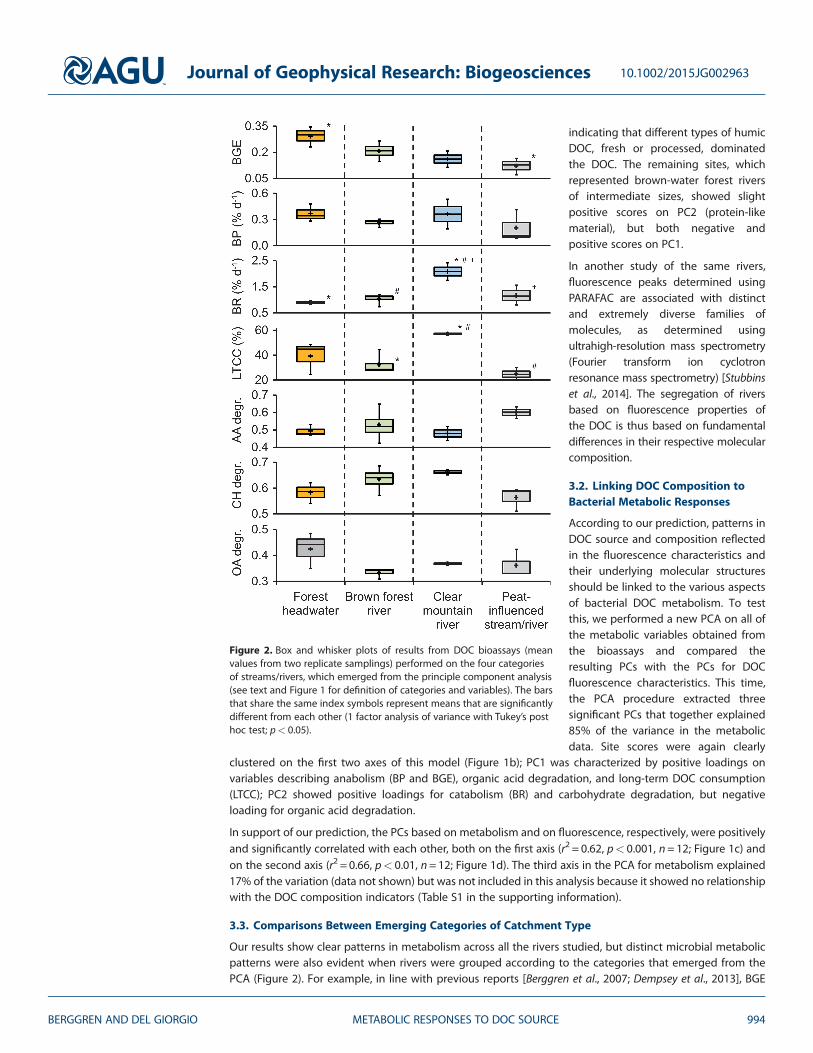
Our results show clear patterns in metabolism across all the rivers studied, but distinct microbial metabolicpatterns were also evident when rivers were grouped according to the categories that emerged from thePCA (Figure 2). For example, in line with previous reports [Berggren et al., 2007; Dempsey et al., 2013], BGE
Figure 2. Box and whisker plots of results from DOC bioassays (meanvalues from two replicate samplings) performed on the four categoriesof streams/rivers, which emerged from the principle component analysis(see text and Figure 1 for definition of categories and variables). The barsthat share the same index symbols represent means that are significantlydifferent from each other (1 factor analysis of variance with Tukey’s posthoc test; p< 0.05).
Journal of Geophysical Research: Biogeosciences 10.1002/2015JG002963
BERGGREN AND DEL GIORGIO METABOLIC RESPONSES TO DOC SOURCE 994
was relatively high in all forested brown-water catchments and forest headwaterswere associated with significantly higherBGE than peat bog-influenced streamsand rivers (Figure 2). BR, on the otherhand, was significantly higher in clearnonheadwater mountain rivers than inall other catchments, especially incomparison with the forest headwaters.This difference is shown for standardizedBR rates in Figure 2, but also absolute BRwas significantly higher (not shown) inthe clear forest rivers than in all othersites except in the catchments with peatbogs (see patterns for absolute BP and BRin Tables S1 and S2 in the supportinginformation). Furthermore, long-term DOCconsumption (LTCC) represented a largerfraction of the DOC in clear-waters,compared to brown forest rivers andpeat-influenced streams/rivers, but theDOC consumption in forest headwaterswas moderate (Figure 2). Although notstatistically significant, there were alsodifferences in the substrate uptakecapacities, with organic acid uptake beinghighest in headwater streams, aminoacid uptake capacity peaking in peat-influenced streams (Figure 2), andcarbohydrate uptake capacity peaking inclear water rivers (Figure 2).
Previous studies have shown linksbetween specific components of aquaticmicrobial metabolism such as BP to bulkproperties of the DOC, such as totalconcentration [Lennon and Pfaff, 2005]or specific ultraviolet light absorption[Berggren et al., 2009], but our resultsdemonstrate for the first time that thereare distinct patterns in the ensemble ofmetabolic variables that we measured,
that are directly linked to catchment category, and the associated differences in DOC composition. Bycomparing Figure 1a with Figure 1b, it becomes apparent that (1) the high anabolism and organic aciddegradation that is typical of forest headwaters are related to fresh humic DOC, (2) low metabolic rates inpeat-influenced river systems is related to processed humic DOC, (3) high catabolism and carbohydratedegradation in clear waters are related to protein- and algal-like fluorescence, and (4) the nonheadwaterbrown forest rivers show patterns intermediate to all other sites, suggesting that these rivers integratemultiple catchment signatures or in-lake processes (Figure 2).
Some of these patterns are expected from previous knowledge: For example, Berggren et al. [2010] showedthat high organic acid degradation and high BGE are both characteristic of metabolism of DOC in forestheadwater streams. Furthermore, the connection between protein-like fluorescence (P6) and respiration inclear-waters is classical [Cammack et al., 2004], and it is also expected that carbohydrate degradation issignificantly positively correlated to the protein-like fluorescence (Table S1 in the supporting information),
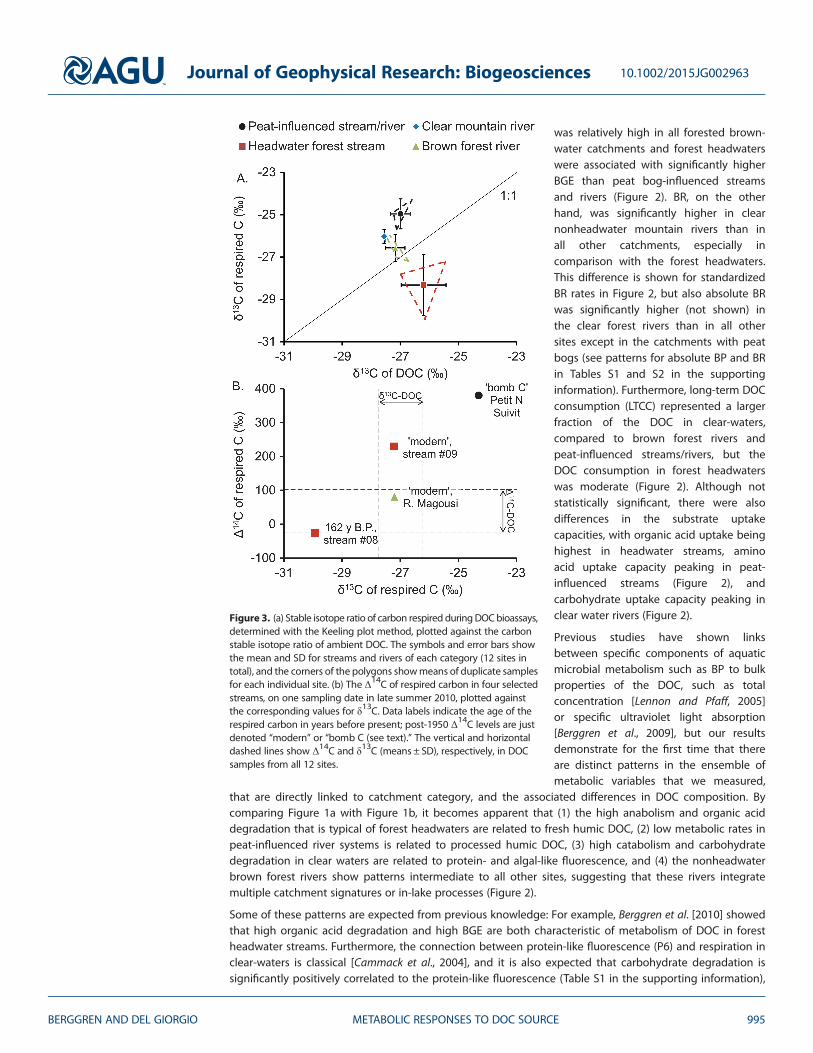
Figure 3. (a) Stable isotope ratio of carbon respired duringDOCbioassays,determined with the Keeling plot method, plotted against the carbonstable isotope ratio of ambient DOC. The symbols and error bars showthe mean and SD for streams and rivers of each category (12 sites intotal), and the corners of the polygons showmeans of duplicate samplesfor each individual site. (b) The Δ14C of respired carbon in four selectedstreams, on one sampling date in late summer 2010, plotted againstthe corresponding values for δ13C. Data labels indicate the age of therespired carbon in years before present; post-1950 Δ14C levels are justdenoted “modern” or “bomb C (see text).” The vertical and horizontaldashed lines show Δ14C and δ13C (means ± SD), respectively, in DOCsamples from all 12 sites.
Journal of Geophysical Research: Biogeosciences 10.1002/2015JG002963
BERGGREN AND DEL GIORGIO METABOLIC RESPONSES TO DOC SOURCE 995
since protein-like fluorescence not only trackshydrolysable amino acids but also low molecularweight aliphatic compounds such as simplecarbohydrates [Stubbins et al., 2014]. However, thesignificant negative correlation (see Table S1 inthe supporting information) between amino aciddegradation and the fresh algal fluorescencecomponent (P5) is unexpected and needs furtherresearch. The PCAs (Figure 3) suggest that highamino acid degradation is associated with humicDOC from peat bogs, possibly indicating that peatwetlands represent a more important source ofbioavailable organic N than previously thought.
It should be emphasized here that the DOC pools inour sampled catchments represent a mixture ofdifferent sources and that bacteria selectivelyconsume only a small portion of this bulk mixture.For example, much of the labile DOC in the clear
waters could originate in autotrophic production by benthic algae [Karlsson et al., 2009] or labile microbial-derived DOC from mineral soils [Olefeldt et al., 2013]. However, the fact that we still found a strongconnection between the microbial metabolic patterns and the spectrofluorometric properties of bulk DOCsuggests that the source of the DOC is one of the master regulators of both bulk DOC properties andproperties of the labile DOC.
3.4. Isotopic Evidence of Differences in Source of the Consumed DOC
It could also be argued that the DOC from the peat-influenced water courses comes from a mixture of forest,wetland, and algal sources and that the DOC in the brown forest rivers, owing to their elevated Chl aconcentrations (Table 1), may include a significant but variable phytoplankton-derived component. Therefore,to test the assumption that differences in metabolic responses in samples from different catchment categoriesare driven by systematic differences in consumption of DOC from different sources, we used the Keeling plotmethod [Karlsson et al., 2007] to determine the carbon isotope composition of the metabolized DOC in eachriver, assessed as the intercepts in δ13C-DIC versus 1/[DIC] regressions. The analytical uncertainties resulted inrelatively large site-level variability in the δ13C of the respired C (1.8‰ SD of replicates on average, seeFigure S1 in the supporting information). However, the estimates typically did not vary more than ~1‰within each catchment category (Figure 3a), which made between-category comparisons possible.
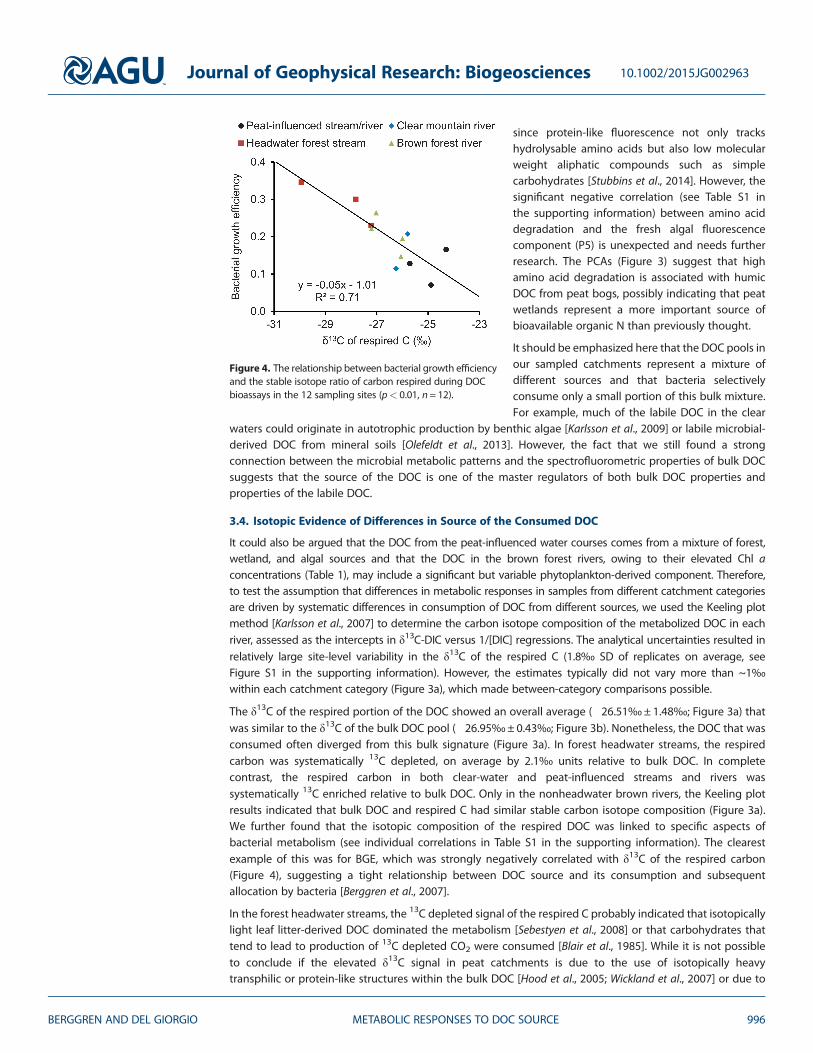
The δ13C of the respired portion of the DOC showed an overall average (�26.51‰± 1.48‰; Figure 3a) thatwas similar to the δ13C of the bulk DOC pool (�26.95‰± 0.43‰; Figure 3b). Nonetheless, the DOC that wasconsumed often diverged from this bulk signature (Figure 3a). In forest headwater streams, the respiredcarbon was systematically 13C depleted, on average by 2.1‰ units relative to bulk DOC. In completecontrast, the respired carbon in both clear-water and peat-influenced streams and rivers wassystematically 13C enriched relative to bulk DOC. Only in the nonheadwater brown rivers, the Keeling plotresults indicated that bulk DOC and respired C had similar stable carbon isotope composition (Figure 3a).We further found that the isotopic composition of the respired DOC was linked to specific aspects ofbacterial metabolism (see individual correlations in Table S1 in the supporting information). The clearestexample of this was for BGE, which was strongly negatively correlated with δ13C of the respired carbon(Figure 4), suggesting a tight relationship between DOC source and its consumption and subsequentallocation by bacteria [Berggren et al., 2007].
In the forest headwater streams, the 13C depleted signal of the respired C probably indicated that isotopicallylight leaf litter-derived DOC dominated the metabolism [Sebestyen et al., 2008] or that carbohydrates thattend to lead to production of 13C depleted CO2 were consumed [Blair et al., 1985]. While it is not possibleto conclude if the elevated δ13C signal in peat catchments is due to the use of isotopically heavytransphilic or protein-like structures within the bulk DOC [Hood et al., 2005; Wickland et al., 2007] or due to
Figure 4. The relationship between bacterial growth efficiencyand the stable isotope ratio of carbon respired during DOCbioassays in the 12 sampling sites (p< 0.01, n= 12).
Journal of Geophysical Research: Biogeosciences 10.1002/2015JG002963
BERGGREN AND DEL GIORGIO METABOLIC RESPONSES TO DOC SOURCE 996

something else, it appears beyond doubt that the sources of DOC that were respired in the forest headwaterstreams and in the peat-influenced running waters were different. Also, in the clear-water streams, therespired carbon was 13C enriched, which is logical as both protein-like DOC (which is high in the clear-water streams) and DOC produced by benthic algae and macrophytes (common autochthonous producersin clear-waters) represent labile components within the DOC pool that are typically enriched in 13C [Heckyand Hesslein, 1995; Tank et al., 2011; Wickland et al., 2007].
We further performed Δ14C Keeling plots in a few selected samples to assess the age of the DOC respired.Samples were selected if (1) a relevant amount of DIC (>0.5mg) could be extracted both at the beginningand end of the incubations and (2) the respired CO2 added substantially (>50%) to the background DIC,i.e., the DIC that was there from the beginning. There was an overall positive relationship between theΔ14C and δ13C of the respired carbon (Figure 3b). In forest headwaters, the respired DOC ranged fromapproximately 162 years old to modern, while the respired DOC in a peat-influenced stream showed highconcentrations of so-called “bomb carbon,” which peaked approximately 60 years ago. Interestingly,although the isotopic signature of the bulk DOC was remarkably similar across sites (Figures 3a and 3b),the DOC consumed was isotopically distinct from this bulk DOC signature, which confirms that bacteria indifferent categories of catchments selectively remove specific pools of DOC with different sources[Guillemette et al., 2013; Lennon and Pfaff, 2005] and age [McCallister and del Giorgio, 2012].
The summer of 2010, when this study was carried out, was warmer and significantly dryer (50% lessprecipitation) than the long-term annual average of the region [Campeau et al., 2014]. Thus, it is notsurprising that we found traces of a several decades’ old DOC (bomb carbon) in the streams, consideringthe combination of warm conditions that favor enzymatic release of DOC from peat [Freeman et al., 2001]and dry conditions that lower the water table and potentially make older peat layers relatively moreimportant for the export. It is more surprising that the bacteria appeared to favor the use of such DOCbefore recently fixed carbon. The mechanisms for the apparent use of bomb-spiked carbon are not clear,but it should be emphasized that selective use of aged DOC (even thousands of years old) has been notedbefore [McCallister and del Giorgio, 2012]. Our results add to the emerging view that a high radiocarbon-inferred age of the DOC is not indicative of recalcitrance.
4. Summary and Conclusions
Our results empirically confirm the widespread assumption that the composition of DOC (here reflected in itsoptical properties) strongly influences bacterial metabolism, but we further demonstrate that this metabolicresponse to the nature of riverine DOC is complex and involves multiple facets. The main PCA axis in themetabolic data, which described anabolism (growth), was positively related to the main DOC compositionaxis representing algal and fresh humic DOC. The second PCA axis, which described catabolism(respiration), was positively related to the second DOC composition axis representing protein-likefluorescence. From this we can conclude that anabolism and catabolism are two fundamentally differentdimensions of the bacterial metabolism that are systematically linked to different DOC components.
The bacterial metabolism is also strongly linked to the DOC source that is utilized, as revealed by the isotopiccomposition of the metabolized DOC. Our results suggest that bacteria selectively remove specific C fractionsthat are isotopically distinct from that of the bulk DOC and that these fractions are dramatically andsystematically different between rivers belonging to different catchment types. In fact, the data allowed usto group the sites into distinct catchment categories, such as “forest headwater” or “peat bog-influenced,”where each category represents a specific metabolic response, a specific DOC composition and a specificcarbon isotope composition of the degraded DOC. For example, fresh humic DOC from forest headwatershad a relatively “isotopically light” degradable fraction, which effectively supported anabolism at asystematically high level of BGE. In contrast processed humic DOC in peat bog drainage had anisotopically heavier degradable fraction, which was used with significantly lower BGE. The carbonconsumption in clear mountain rivers appeared to be represented by relatively isotopically heavyautochthonous DOC (possibly produced by benthic algae) that simultaneously supported high anabolism,high catabolism, and also the highest long-term DOC losses.
Journal of Geophysical Research: Biogeosciences 10.1002/2015JG002963
BERGGREN AND DEL GIORGIO METABOLIC RESPONSES TO DOC SOURCE 997
This study targeted contrasting catchments during low flow, but it could also be expected that the bacterialmetabolic responses change seasonally in rivers that receive DOC from different sources during high and lowflow, respectively. Considering the fundamentally different ecosystem consequences that are associated withdifferent aspects of bacterial metabolism, we suggest that changes in DOC loading and sources caused byland use or climate change (browning) could result in major changes in aquatic ecosystem functioning.Specifically, by knowing the source of the DOC in the landscape, it is possible to not only predict themicrobial anabolism in receiving waters, e.g., with spinoff effects on aquatic food-web structures but alsothe microbial catabolism that contributes to greenhouse gas production.
ReferencesAmon, R. M. W., and R. Benner (1996), Bacterial utilization of different size classes of dissolved organic matter, Limnol. Oceanogr., 41(1), 41–51,
doi:10.4319/lo.1996.41.1.0041.Anesio, A. M., W. Granéli, G. R. Aiken, D. J. Kieber, and K. Mopper (2005), Effect of humic substance photodegradation on bacterial growth and
respiration in lake water, Appl. Environ. Microbiol., 71(10), 6267–6275, doi:10.1128/AEM.71.10.6267-6275.2005.Apple, J. K., P. A. del Giorgio, and W. M. Kemp (2006), Temperature regulation of bacterial production, respiration, and growth efficiency in a
temperate salt-marsh estuary, Aquat. Microb. Ecol., 43(3), 243–254, doi:10.3354/ame043243.Azam, F., T. Fenchel, J. G. Field, R. A. Meyer-Reil, and T. F. Thingstad (1983), The ecological role of water-column microbes in the sea, Mar.
Ecol-Prog. Ser., 10, 257–263, doi:10.3354/meps010257.Berggren, M., H. Laudon, and M. Jansson (2007), Landscape regulation of bacterial growth efficiency in boreal freshwaters, Global
Biogeochem. Cycles, 21, GB4002, doi:10.1029/2006GB002844.Berggren, M., H. Laudon, and M. Jansson (2009), Aging of allochthonous organic carbon regulates bacterial production in unproductive
boreal lakes, Limnol. Oceanogr., 54(4), 1333–1342, doi:10.4319/lo.2009.54.4.1333.Berggren, M., H. Laudon, M. Haei, L. Ström, and M. Jansson (2010), Efficient aquatic bacterial metabolism of dissolved low molecular weight
compounds from terrestrial sources, ISME J., 4(3), 408–416, doi:10.1038/ismej.2009.120.Berggren, M., J. F. Lapierre, and P. A. Del Giorgio (2012), Magnitude and regulation of bacterioplankton respiratory quotient across freshwater
environmental gradients, ISME J., 6, 984–993, doi:10.1038/ismej.2011.157.Blair, N., A. Leu, E. Muñoz, J. Olsen, E. Kwong, and D. Desmarais (1985), Carbon isotopic fractionation in heterotrophic microbial metabolism,
Appl. Environ. Microbiol., 50(4), 996–1001.Cammack, W. K. L., J. Kalff, Y. T. Prairie, and E. M. Smith (2004), Fluorescent dissolved organic matter in lakes: Relationships with heterotrophic
metabolism, Limnol. Oceanogr., 49(6), 2034–2045, doi:10.4319/lo.2004.49.6.2034.Campeau, A., J. F. Lapierre, D. Vachon, and P. A. del Giorgio (2014), Regional contribution of CO2 and CH4 fluxes from the fluvial network in a
lowland boreal landscape of Quebec, Global Biogeochem. Cycles, 28, 57–69, doi:10.1002/2013GB004685.del Giorgio, P. A., and M. L. Pace (2008), Relative independence of dissolved organic carbon transport and processing in a large temperate
river: The Hudson River as both pipe and reactor, Limnol. Oceanogr., 53(1), 185–197, doi:10.4319/lo.2008.53.1.0185.Dempsey, C. M., D. P. Morris, and S. C. Peters (2013), Assessing changes in microbial respiration, bacterial growth efficiency, and bacterial
production with nutrient addition to batch cultures, J. Freshwater Ecol., 28(3), 411–421, doi:10.1080/02705060.2013.773463.Freeman, C., C. D. Evans, D. T. Monteith, B. Reynolds, and N. Fenner (2001), Export of organic carbon from peat soils, Nature, 412(6849),
785–785, doi:10.1038/35090628.Garland, J. L., and A. L. Mills (1991), Classification and characterization of heterotrophic microbial communities on the basis of patterns of
community-level sole-carbon-source utilization, Appl. Environ. Microbiol., 57(8), 2351–2359.Guillemette, F., and P. A. del Giorgio (2011), Reconstructing the various facets of dissolved organic carbon bioavailability in freshwater
ecosystems, Limnol. Oceanogr., 56(2), 734–748, doi:10.4319/lo.2011.56.2.0734.Guillemette, F., S. L. McCallister, and P. A. del Giorgio (2013), Differentiating the degradation dynamics of algal and terrestrial carbon within
complex natural dissolved organic carbon in temperate lakes, J. Geophys. Res. Biogeosci., 118, 963–973, doi:10.1002/Jgrg.20077.Hecky, R. E., and R. H. Hesslein (1995), Contributions of benthic algae to lake food webs as revealed by stable isotope analysis, J. N. Am.
Benthol. Soc., 14(4), 631–653.Hood, E., M. W. Williams, and D. M. McKnight (2005), Sources of dissolved organic matter (DOM) in a Rocky Mountain stream using chemical
fractionation and stable isotopes, Biogeochemistry, 74(2), 231–255, doi:10.1007/s10533-004-4322-5.Jansson, M., L. Persson, A. M. DeRoos, R. I. Jones, and L. J. Tranvik (2007), Terrestrial carbon and intraspecific size-variation shape lake
ecosystems, Trends Ecol. Evol., 22(6), 316–322, doi:10.1016/j.tree.2007.02.015.Karlsson, J., M. Jansson, and A. Jonsson (2007), Respiration of allochthonous organic carbon in unproductive forest lakes determined by the
Keeling plot method, Limnol. Oceanogr., 52(2), 603–608, doi:10.4319/lo.2007.52.2.0603.Karlsson, J., P. Byström, J. Ask, P. Ask, L. Persson, and M. Jansson (2009), Light limitation of nutrient-poor lake ecosystems, Nature, 460(7254),
506–509, doi:10.1038/nature08179.Kerr, J. L., D. S. Baldwin, and K. L. Whitworth (2013), Options for managing hypoxic blackwater events in river systems: A review, J. Environ.
Manage., 114, 139–147, doi:10.1016/j.jenvman.2012.10.013.Koehler, B., E. von Wachenfeldt, D. Kothawala, and L. J. Tranvik (2012), Reactivity continuum of dissolved organic carbon decomposition in
lake water, J. Geophys. Res., 117, G01024, doi:10.1029/2011JG001793.Lapierre, J. F., and P. A. del Giorgio (2014), Partial coupling and differential regulation of biologically and photochemically labile dissolved
organic carbon across boreal aquatic networks, Biogeosciences, 11(20), 5969–5985, doi:10.5194/bg-11-5969-2014.Lapierre, J. F., F. Guillemette, M. Berggren, and P. A. del Giorgio (2013), Increases in terrestrially derived carbon stimulate organic carbon
processing and CO2 emissions in boreal aquatic ecosystems, Nat. Commun., 4, 2972, doi:10.1038/ncomms3972.Laudon, H., M. Berggren, A. Ågren, I. Buffam, K. Bishop, T. Grabs, M. Jansson, and S. Köhler (2011), Patterns and dynamics of dissolved organic
carbon (DOC) in boreal streams: The role of processes, connectivity, and scaling, Ecosystems, 14(6), 880–893, doi:10.1007/s10021-011-9452-8.Lennon, J. T., and L. E. Pfaff (2005), Source and supply of terrestrial organic matter affects aquatic microbial metabolism, Aquat. Microb. Ecol.,
39(2), 107–119, doi:10.3354/ame039107.Marchand, D., Y. T. Prairie, and P. A. del Giorgio (2009), Linking forest fires to lake metabolism and carbon dioxide emissions in the boreal
region of Northern Quebec, Global Change Biol., 15(12), 2861–2873, doi:10.1111/j.1365-2486.2009.01979.x.
AcknowledgmentsJean-François Lapierre performedPARAFAC modeling of DOC fluorescence.We also thank Annick St-Pierre, AliceParkes, Dominic Vachon, Jean-PhilippeDesindes, Véronique Ducharme-Riel,Lisa Fauteux, Audrey Campeau, JustineLacombe Bergeron, and GenevièveThibodeau for their assistance andFrançois Guillemette and J.F.L. for theirvaluable comments. M.B. was supportedby a postdoctoral grant from theSwedish Research Council (VR). Thisproject was part of the large-scaleresearch program of the IndustrialResearch Chair in CarbonBiogeochemistryin Boreal Aquatic Systems, cofunded bythe Natural Sciences and EngineeringResearch Council of Canada andHydro-Québec. All directly relevantdata are included in the paper andits supplementary files; additionalbackground data of potential interestwill be made available by the authorsupon request, according to the AGUdata policy.
Journal of Geophysical Research: Biogeosciences 10.1002/2015JG002963
BERGGREN AND DEL GIORGIO METABOLIC RESPONSES TO DOC SOURCE 998
McCallister, S. L., and P. A. del Giorgio (2012), Evidence for the respiration of ancient terrestrial organic C in northern temperate lakes andstreams, Proc. Natl. Acad. Sci. U.S.A., 109(42), 16,963–16,968, doi:10.1073/pnas.1207305109.
McKnight, D. M., E. W. Boyer, P. K. Westerhoff, P. T. Doran, T. Kulbe, and D. T. Andersen (2001), Spectrofluorometric characterization of dissolvedorganic matter for indication of precursor organic material and aromaticity, Limnol. Oceanogr., 46(1), 38–48, doi:10.4319/lo.2001.46.1.0038.
Miller, M. P., B. E. Simone, D. M. McKnight, R. M. Cory, M. W. Williams, and E. W. Boyer (2010), New light on a dark subject: Comment, Aquat. Sci.,72(3), 269–275, doi:10.1007/s00027-010-0130-2.
Moran, M. A., W. M. Sheldon, and J. E. Sheldon (1999), Biodegradation of riverine dissolved organic carbon in five estuaries of the southeasternUnited States, Estuaries, 22(1), 55–64, doi:10.2307/1352927.
Olefeldt, D., K. J. Devito, and M. R. Turetsky (2013), Sources and fate of terrestrial dissolved organic carbon in lakes of a Boreal Plains regionrecently affected by wildfire, Biogeosciences, 10(10), 6247–6265, doi:10.5194/bg-10-6247-2013.
Salcher, M. M., T. Posch, and J. Pernthaler (2013), In situ substrate preferences of abundant bacterioplankton populations in a prealpinefreshwater lake, ISME J., 7(5), 896–907, doi:10.1038/ismej.2012.162.
Sebestyen, S. D., E. W. Boyer, J. B. Shanley, C. Kendall, D. H. Doctor, G. R. Aiken, and N. Ohte (2008), Sources, transformations, and hydrologicalprocesses that control stream nitrate and dissolved organic matter concentrations during snowmelt in an upland forest, Water Resour.Res., 44, W12410, doi:10.1029/2008WR006983.
Servais, P., G. Billen, and M. C. Hascoet (1987), Determination of the biodegradable fraction of dissolved organic matter in waters,Water Res.,21(4), 445–450, doi:10.1016/0043-1354(87)90192-8.
Simon, M., and F. Azam (1989), Protein content and protein synthesis rates of planktonic marine bacteria,Mar. Ecol-Prog. Ser., 51(3), 201–213.Smith, D. C., and F. Azam (1992), A simple, economical method for measuring bacterial protein synthesis rates in seawater using 3H-leucine,
Mar. Microb. Food Webs, 6(2), 107–114.Stedmon, C. A., and R. Bro (2008), Characterizing dissolved organic matter fluorescence with parallel factor analysis: A tutorial, Limnol.
Oceanogr. Methods, 6, 572–579, doi:10.4319/lom.2008.6.572.Stubbins, A., J. F. Lapierre, M. Berggren, Y. T. Prairie, T. Dittmar, and P. A. del Giorgio (2014), What’s in an EEM? Molecular signatures associated
with dissolved organic fluorescence in boreal Canada, Environ. Sci. Technol., 48(18), 10,598–10,606, doi:10.1021/es502086e.Tank, S. E., L. F. W. Lesack, J. A. L. Gareis, C. L. Osburn, and R. H. Hesslein (2011), Multiple tracers demonstrate distinct sources of dissolved organic
matter to lakes of the Mackenzie Delta, western Canadian Arctic, Limnol. Oceanogr., 56(4), 1297–1309, doi:10.4319/lo.2011.56.4.1297.Tranvik, L. J. (1998), Degradation of dissolved organic matter in humic waters by bacteria, in Aquatic Humic Substances: Ecology and
Biogeochemistry, edited by L. J. Tranvik and D. O. Hessen, pp. 259–283, Springer, Berlin.Tranvik, L. J., et al. (2009), Lakes and reservoirs as regulators of carbon cycling and climate, Limnol. Oceanogr., 54(6), 2298–2314, doi:10.4319/
lo.2009.54.6_part_2.2298.Wickland, K. P., J. C. Neff, and G. R. Aiken (2007), Dissolved organic carbon in Alaskan boreal forest: Sources, chemical characteristics, and
biodegradability, Ecosystems, 10(8), 1323–1340, doi:10.1007/s10021-007-9101-4.Zhang, H., and S. Y. Li (2010), Effects of physical and biochemical processes on the dissolved oxygen budget for the Pearl River Estuary during
summer, J. Mar. Syst., 79(1–2), 65–88, doi:10.1016/j.jmarsys.2009.07.002.
Journal of Geophysical Research: Biogeosciences 10.1002/2015JG002963
BERGGREN AND DEL GIORGIO METABOLIC RESPONSES TO DOC SOURCE 999