Disregarding the restrictive vial-opening policy for BCG ...
35
1 Thysen SM, et al. BMJ Global Health 2021;6:e006127. doi:10.1136/bmjgh-2021-006127 Disregarding the restrictive vial-opening policy for BCG vaccine in Guinea-Bissau: impact and cost- effectiveness for tuberculosis mortality and all-cause mortality in children aged 0–4 years Sanne M Thysen , 1,2,3,4 Ane Baerent Fisker , 1,2,3 Stine Byberg, 2,3 Peter Aaby, 2,3 Partho Roy, 5 Richard White, 5 Ulla Griffiths, 6 Rebecca C Harris 5 Original research To cite: Thysen SM, Fisker AB, Byberg S, et al. Disregarding the restrictive vial-opening policy for BCG vaccine in Guinea-Bissau: impact and cost-effectiveness for tuberculosis mortality and all-cause mortality in children aged 0–4 years. BMJ Global Health 2021;6:e006127. doi:10.1136/ bmjgh-2021-006127 Handling editor Lei Si Received 27 April 2021 Accepted 2 July 2021 For numbered affiliations see end of article. Correspondence to Dr Sanne M Thysen; [email protected] © Author(s) (or their employer(s)) 2021. Re-use permitted under CC BY-NC. No commercial re-use. See rights and permissions. Published by BMJ. ABSTRACT Objective BCG vaccination is frequently delayed in low- income countries. Restrictive vial-opening policies, where a vial of BCG vaccine is not opened for few children, are a major reason for delay. During delays, children are unprotected against tuberculosis (TB) and deprived of non- specific effects of BCG. We assessed the potential effect and cost-effectiveness of disregarding the restrictive vial-opening policy, on TB and all-cause mortality, in children aged 0–4 years in Guinea-Bissau. Methods Using static mathematical models, we estimated the absolute and percentage change in TB and all-cause deaths, in children aged 0–4 years, between the current BCG vaccine restrictive-opening policy scenario, and a non-restrictive policy scenario where all children were vaccinated in the first health-facility contact. Incremental cost-effectiveness was estimated by integration of vaccine and treatment costs. Findings Disregarding the restrictive BCG vial-opening policy was estimated to reduce TB deaths by 11.0% (95% uncertainty range (UR):0.5%–28.8%), corresponding to 4 (UR:0–15) TB deaths averted per birth cohort in Guinea- Bissau, resulting in incremental cost-effectiveness of US$ 911 per discounted life-year gained (LYG) (UR:145–9142). For all-cause deaths, the estimated reduction was 8.1% (UR: 3.3%–12.7%) corresponding to 392 (UR:158–624) fewer all- cause deaths and an incremental cost-effectiveness of US$ 9 (UR:5–23) per discounted LYG. Conclusions Disregarding the restrictive BCG vial-opening policy was associated with reductions in TB deaths and all-cause deaths and low cost-effectiveness ratios. Our results suggest that it would be cost-effective to disregard the restrictive vial-opening policy. Other settings with similar practice are also likely to gain from disregarding this policy. INTRODUCTION The BCG vaccine was developed to protect against tuberculosis (TB), and is currently the only approved TB vaccine. 1 The efficacy and effectiveness of BCG against TB varies consider- ably between studies and populations, 2 however, neonatal BCG has consistently been associated with reduced prevalence of TB disease. 2 Key questions What is already known? ► BCG is the only improved vaccine against tuberculo- sis (TB). However, BCG vaccination is often delayed in low-income countries, and a major cause of delay in Guinea-Bissau is the restrictive vial-opening policy, where a vial of BCG is not opened unless 10–12 chil- dren are present for vaccination at the same time. ► We identified one mathematical modelling study that estimated the global impact of different BCG coverage scenarios on TB mortality in children aged 0–14 years, which concluded that improving timeliness of BCG vaccination at birth was associated with reductions in TB deaths. ► We found no study estimating the health economic im- pact of increasing timeliness, the impact of improving BCG timeliness on all-cause mortality, nor any studies assessing the impact at the country level. What are the new findings? ► In this study, we provide the first country-level esti- mates of the impact of change in BCG coverage and timeliness. We estimated that disregarding the restric- tive vial-opening policy and vaccinating every child at the first contact with a health facility in Guinea-Bissau could reduce TB and all-cause mortality. ► Our study provides the first effect and cost- effectiveness estimates for this easily implementable intervention of disregarding the restrictive vial-opening policy, and our estimates show that it is both effec- tive and cost-effective to disregard the restrictive vial- opening policy. on March 26, 2022 by guest. Protected by copyright. http://gh.bmj.com/ BMJ Glob Health: first published as 10.1136/bmjgh-2021-006127 on 3 August 2021. Downloaded from on March 26, 2022 by guest. Protected by copyright. http://gh.bmj.com/ BMJ Glob Health: first published as 10.1136/bmjgh-2021-006127 on 3 August 2021. Downloaded from on March 26, 2022 by guest. Protected by copyright. http://gh.bmj.com/ BMJ Glob Health: first published as 10.1136/bmjgh-2021-006127 on 3 August 2021. Downloaded from on March 26, 2022 by guest. Protected by copyright. http://gh.bmj.com/ BMJ Glob Health: first published as 10.1136/bmjgh-2021-006127 on 3 August 2021. Downloaded from on March 26, 2022 by guest. Protected by copyright. http://gh.bmj.com/ BMJ Glob Health: first published as 10.1136/bmjgh-2021-006127 on 3 August 2021. Downloaded from on March 26, 2022 by guest. Protected by copyright. http://gh.bmj.com/ BMJ Glob Health: first published as 10.1136/bmjgh-2021-006127 on 3 August 2021. Downloaded from on March 26, 2022 by guest. Protected by copyright. http://gh.bmj.com/ BMJ Glob Health: first published as 10.1136/bmjgh-2021-006127 on 3 August 2021. Downloaded from on March 26, 2022 by guest. Protected by copyright. http://gh.bmj.com/ BMJ Glob Health: first published as 10.1136/bmjgh-2021-006127 on 3 August 2021. Downloaded from on March 26, 2022 by guest. Protected by copyright. http://gh.bmj.com/ BMJ Glob Health: first published as 10.1136/bmjgh-2021-006127 on 3 August 2021. Downloaded from on March 26, 2022 by guest. Protected by copyright. http://gh.bmj.com/ BMJ Glob Health: first published as 10.1136/bmjgh-2021-006127 on 3 August 2021. Downloaded from on March 26, 2022 by guest. Protected by copyright. http://gh.bmj.com/ BMJ Glob Health: first published as 10.1136/bmjgh-2021-006127 on 3 August 2021. Downloaded from on March 26, 2022 by guest. Protected by copyright. http://gh.bmj.com/ BMJ Glob Health: first published as 10.1136/bmjgh-2021-006127 on 3 August 2021. Downloaded from on March 26, 2022 by guest. Protected by copyright. http://gh.bmj.com/ BMJ Glob Health: first published as 10.1136/bmjgh-2021-006127 on 3 August 2021. Downloaded from on March 26, 2022 by guest. Protected by copyright. http://gh.bmj.com/ BMJ Glob Health: first published as 10.1136/bmjgh-2021-006127 on 3 August 2021. Downloaded from on March 26, 2022 by guest. Protected by copyright. http://gh.bmj.com/ BMJ Glob Health: first published as 10.1136/bmjgh-2021-006127 on 3 August 2021. Downloaded from on March 26, 2022 by guest. Protected by copyright. http://gh.bmj.com/ BMJ Glob Health: first published as 10.1136/bmjgh-2021-006127 on 3 August 2021. Downloaded from on March 26, 2022 by guest. Protected by copyright. http://gh.bmj.com/ BMJ Glob Health: first published as 10.1136/bmjgh-2021-006127 on 3 August 2021. Downloaded from on March 26, 2022 by guest. Protected by copyright. http://gh.bmj.com/ BMJ Glob Health: first published as 10.1136/bmjgh-2021-006127 on 3 August 2021. Downloaded from on March 26, 2022 by guest. Protected by copyright. http://gh.bmj.com/ BMJ Glob Health: first published as 10.1136/bmjgh-2021-006127 on 3 August 2021. Downloaded from on March 26, 2022 by guest. Protected by copyright. http://gh.bmj.com/ BMJ Glob Health: first published as 10.1136/bmjgh-2021-006127 on 3 August 2021. Downloaded from on March 26, 2022 by guest. Protected by copyright. http://gh.bmj.com/ BMJ Glob Health: first published as 10.1136/bmjgh-2021-006127 on 3 August 2021. Downloaded from on March 26, 2022 by guest. Protected by copyright. http://gh.bmj.com/ BMJ Glob Health: first published as 10.1136/bmjgh-2021-006127 on 3 August 2021. Downloaded from on March 26, 2022 by guest. Protected by copyright. http://gh.bmj.com/ BMJ Glob Health: first published as 10.1136/bmjgh-2021-006127 on 3 August 2021. Downloaded from on March 26, 2022 by guest. Protected by copyright. http://gh.bmj.com/ BMJ Glob Health: first published as 10.1136/bmjgh-2021-006127 on 3 August 2021. Downloaded from on March 26, 2022 by guest. Protected by copyright. http://gh.bmj.com/ BMJ Glob Health: first published as 10.1136/bmjgh-2021-006127 on 3 August 2021. Downloaded from
Transcript of Disregarding the restrictive vial-opening policy for BCG ...

1Thysen SM, et al. BMJ Global Health 2021;6:e006127. doi:10.1136/bmjgh-2021-006127
Disregarding the restrictive vial- opening policy for BCG vaccine in Guinea- Bissau: impact and cost- effectiveness for tuberculosis mortality and all- cause mortality in children aged 0–4 years
Sanne M Thysen ,1,2,3,4 Ane Baerent Fisker ,1,2,3 Stine Byberg,2,3 Peter Aaby,2,3 Partho Roy,5 Richard White,5 Ulla Griffiths,6 Rebecca C Harris5
Original research
To cite: Thysen SM, Fisker AB, Byberg S, et al. Disregarding the restrictive vial- opening policy for BCG vaccine in Guinea- Bissau: impact and cost- effectiveness for tuberculosis mortality and all- cause mortality in children aged 0–4 years. BMJ Global Health 2021;6:e006127. doi:10.1136/bmjgh-2021-006127
Handling editor Lei Si
Received 27 April 2021Accepted 2 July 2021
For numbered affiliations see end of article.
Correspondence toDr Sanne M Thysen; s. thysen@ bandim. org
© Author(s) (or their employer(s)) 2021. Re- use permitted under CC BY- NC. No commercial re- use. See rights and permissions. Published by BMJ.
ABSTRACTObjective BCG vaccination is frequently delayed in low- income countries. Restrictive vial- opening policies, where a vial of BCG vaccine is not opened for few children, are a major reason for delay. During delays, children are unprotected against tuberculosis (TB) and deprived of non- specific effects of BCG. We assessed the potential effect and cost- effectiveness of disregarding the restrictive vial- opening policy, on TB and all- cause mortality, in children aged 0–4 years in Guinea- Bissau.Methods Using static mathematical models, we estimated the absolute and percentage change in TB and all- cause deaths, in children aged 0–4 years, between the current BCG vaccine restrictive- opening policy scenario, and a non- restrictive policy scenario where all children were vaccinated in the first health- facility contact. Incremental cost- effectiveness was estimated by integration of vaccine and treatment costs.Findings Disregarding the restrictive BCG vial- opening policy was estimated to reduce TB deaths by 11.0% (95% uncertainty range (UR):0.5%–28.8%), corresponding to 4 (UR:0–15) TB deaths averted per birth cohort in Guinea- Bissau, resulting in incremental cost- effectiveness of US$ 911 per discounted life- year gained (LYG) (UR:145–9142). For all- cause deaths, the estimated reduction was 8.1% (UR: 3.3%–12.7%) corresponding to 392 (UR:158–624) fewer all- cause deaths and an incremental cost- effectiveness of US$ 9 (UR:5–23) per discounted LYG.Conclusions Disregarding the restrictive BCG vial- opening policy was associated with reductions in TB deaths and all- cause deaths and low cost- effectiveness ratios. Our results suggest that it would be cost- effective to disregard the restrictive vial- opening policy. Other settings with similar practice are also likely to gain from disregarding this policy.
INTRODUCTIONThe BCG vaccine was developed to protect against tuberculosis (TB), and is currently the
only approved TB vaccine.1 The efficacy and effectiveness of BCG against TB varies consider-ably between studies and populations,2 however, neonatal BCG has consistently been associated with reduced prevalence of TB disease.2
Key questions
What is already known? ► BCG is the only improved vaccine against tuberculo-sis (TB). However, BCG vaccination is often delayed in low- income countries, and a major cause of delay in Guinea- Bissau is the restrictive vial- opening policy, where a vial of BCG is not opened unless 10–12 chil-dren are present for vaccination at the same time.
► We identified one mathematical modelling study that estimated the global impact of different BCG coverage scenarios on TB mortality in children aged 0–14 years, which concluded that improving timeliness of BCG vaccination at birth was associated with reductions in TB deaths.
► We found no study estimating the health economic im-pact of increasing timeliness, the impact of improving BCG timeliness on all- cause mortality, nor any studies assessing the impact at the country level.
What are the new findings? ► In this study, we provide the first country- level esti-mates of the impact of change in BCG coverage and timeliness. We estimated that disregarding the restric-tive vial- opening policy and vaccinating every child at the first contact with a health facility in Guinea- Bissau could reduce TB and all- cause mortality.
► Our study provides the first effect and cost- effectiveness estimates for this easily implementable intervention of disregarding the restrictive vial- opening policy, and our estimates show that it is both effec-tive and cost- effective to disregard the restrictive vial- opening policy.
on March 26, 2022 by guest. P
rotected by copyright.http://gh.bm
j.com/
BM
J Glob H
ealth: first published as 10.1136/bmjgh-2021-006127 on 3 A
ugust 2021. Dow
nloaded from
on March 26, 2022 by guest. P
rotected by copyright.http://gh.bm
j.com/
BM
J Glob H
ealth: first published as 10.1136/bmjgh-2021-006127 on 3 A
ugust 2021. Dow
nloaded from
on March 26, 2022 by guest. P
rotected by copyright.http://gh.bm
j.com/
BM
J Glob H
ealth: first published as 10.1136/bmjgh-2021-006127 on 3 A
ugust 2021. Dow
nloaded from
on March 26, 2022 by guest. P
rotected by copyright.http://gh.bm
j.com/
BM
J Glob H
ealth: first published as 10.1136/bmjgh-2021-006127 on 3 A
ugust 2021. Dow
nloaded from
on March 26, 2022 by guest. P
rotected by copyright.http://gh.bm
j.com/
BM
J Glob H
ealth: first published as 10.1136/bmjgh-2021-006127 on 3 A
ugust 2021. Dow
nloaded from
on March 26, 2022 by guest. P
rotected by copyright.http://gh.bm
j.com/
BM
J Glob H
ealth: first published as 10.1136/bmjgh-2021-006127 on 3 A
ugust 2021. Dow
nloaded from
on March 26, 2022 by guest. P
rotected by copyright.http://gh.bm
j.com/
BM
J Glob H
ealth: first published as 10.1136/bmjgh-2021-006127 on 3 A
ugust 2021. Dow
nloaded from
on March 26, 2022 by guest. P
rotected by copyright.http://gh.bm
j.com/
BM
J Glob H
ealth: first published as 10.1136/bmjgh-2021-006127 on 3 A
ugust 2021. Dow
nloaded from
on March 26, 2022 by guest. P
rotected by copyright.http://gh.bm
j.com/
BM
J Glob H
ealth: first published as 10.1136/bmjgh-2021-006127 on 3 A
ugust 2021. Dow
nloaded from
on March 26, 2022 by guest. P
rotected by copyright.http://gh.bm
j.com/
BM
J Glob H
ealth: first published as 10.1136/bmjgh-2021-006127 on 3 A
ugust 2021. Dow
nloaded from
on March 26, 2022 by guest. P
rotected by copyright.http://gh.bm
j.com/
BM
J Glob H
ealth: first published as 10.1136/bmjgh-2021-006127 on 3 A
ugust 2021. Dow
nloaded from
on March 26, 2022 by guest. P
rotected by copyright.http://gh.bm
j.com/
BM
J Glob H
ealth: first published as 10.1136/bmjgh-2021-006127 on 3 A
ugust 2021. Dow
nloaded from
on March 26, 2022 by guest. P
rotected by copyright.http://gh.bm
j.com/
BM
J Glob H
ealth: first published as 10.1136/bmjgh-2021-006127 on 3 A
ugust 2021. Dow
nloaded from
on March 26, 2022 by guest. P
rotected by copyright.http://gh.bm
j.com/
BM
J Glob H
ealth: first published as 10.1136/bmjgh-2021-006127 on 3 A
ugust 2021. Dow
nloaded from
on March 26, 2022 by guest. P
rotected by copyright.http://gh.bm
j.com/
BM
J Glob H
ealth: first published as 10.1136/bmjgh-2021-006127 on 3 A
ugust 2021. Dow
nloaded from
on March 26, 2022 by guest. P
rotected by copyright.http://gh.bm
j.com/
BM
J Glob H
ealth: first published as 10.1136/bmjgh-2021-006127 on 3 A
ugust 2021. Dow
nloaded from
on March 26, 2022 by guest. P
rotected by copyright.http://gh.bm
j.com/
BM
J Glob H
ealth: first published as 10.1136/bmjgh-2021-006127 on 3 A
ugust 2021. Dow
nloaded from
on March 26, 2022 by guest. P
rotected by copyright.http://gh.bm
j.com/
BM
J Glob H
ealth: first published as 10.1136/bmjgh-2021-006127 on 3 A
ugust 2021. Dow
nloaded from
on March 26, 2022 by guest. P
rotected by copyright.http://gh.bm
j.com/
BM
J Glob H
ealth: first published as 10.1136/bmjgh-2021-006127 on 3 A
ugust 2021. Dow
nloaded from
on March 26, 2022 by guest. P
rotected by copyright.http://gh.bm
j.com/
BM
J Glob H
ealth: first published as 10.1136/bmjgh-2021-006127 on 3 A
ugust 2021. Dow
nloaded from
on March 26, 2022 by guest. P
rotected by copyright.http://gh.bm
j.com/
BM
J Glob H
ealth: first published as 10.1136/bmjgh-2021-006127 on 3 A
ugust 2021. Dow
nloaded from
on March 26, 2022 by guest. P
rotected by copyright.http://gh.bm
j.com/
BM
J Glob H
ealth: first published as 10.1136/bmjgh-2021-006127 on 3 A
ugust 2021. Dow
nloaded from
on March 26, 2022 by guest. P
rotected by copyright.http://gh.bm
j.com/
BM
J Glob H
ealth: first published as 10.1136/bmjgh-2021-006127 on 3 A
ugust 2021. Dow
nloaded from
on March 26, 2022 by guest. P
rotected by copyright.http://gh.bm
j.com/
BM
J Glob H
ealth: first published as 10.1136/bmjgh-2021-006127 on 3 A
ugust 2021. Dow
nloaded from
on March 26, 2022 by guest. P
rotected by copyright.http://gh.bm
j.com/
BM
J Glob H
ealth: first published as 10.1136/bmjgh-2021-006127 on 3 A
ugust 2021. Dow
nloaded from

2 Thysen SM, et al. BMJ Global Health 2021;6:e006127. doi:10.1136/bmjgh-2021-006127
BMJ Global Health
TB is estimated to be among the top ten causes of death worldwide.3 In 2015, global paediatric all- cause mortality was estimated at 5.9 million deaths,4 and 191 000 (95% CI: 132 000 to 257 000) of these were esti-mated as attributable to TB.5 As paediatric TB is difficult to diagnose, prevention may be more feasible than cure, particularly in settings with high TB burden and few resources. Vaccination is part of the WHO strategy for reducing TB deaths by 95% between 2015 and 2035.1 6 Recent estimates suggested that increasing global BCG coverage from 92% final coverage to an immediate 92% coverage at birth could reduce TB deaths <15 years by 5449 per global birth cohort (95% uncertainty range (UR): 218–15 071).7
BCG may have beneficial non- specific effects (NSEs), protecting against disease unrelated to TB.8–11 In 2014, a WHO- commissioned review concluded that BCG may have beneficial NSEs reducing all- cause child mortality.12 Thus, BCG delays may be important for both TB- specific mortality and all- cause mortality.
BCG is recommended at birth, and although global coverage is estimated at 88% by 12 months,13 this does not reveal underlying vaccination delays. To meet vaccine wastage targets, local practices of not opening a vial of BCG unless a sufficient number of children are present for vaccination have arisen (restrictive vial- opening policy) and BCG is consequently delayed in many low- income countries.14–16
The restrictive vial- opening policy is imposed with the goal of using scarce resources effectively. However, this saving may come at a cost and the impact has not been examined. The objective of this study was to esti-mate the epidemiological impact and cost- effectiveness of disregarding the restrictive BCG vial- opening policy in Guinea- Bissau, considering both the TB- specific and all- cause mortality effects.
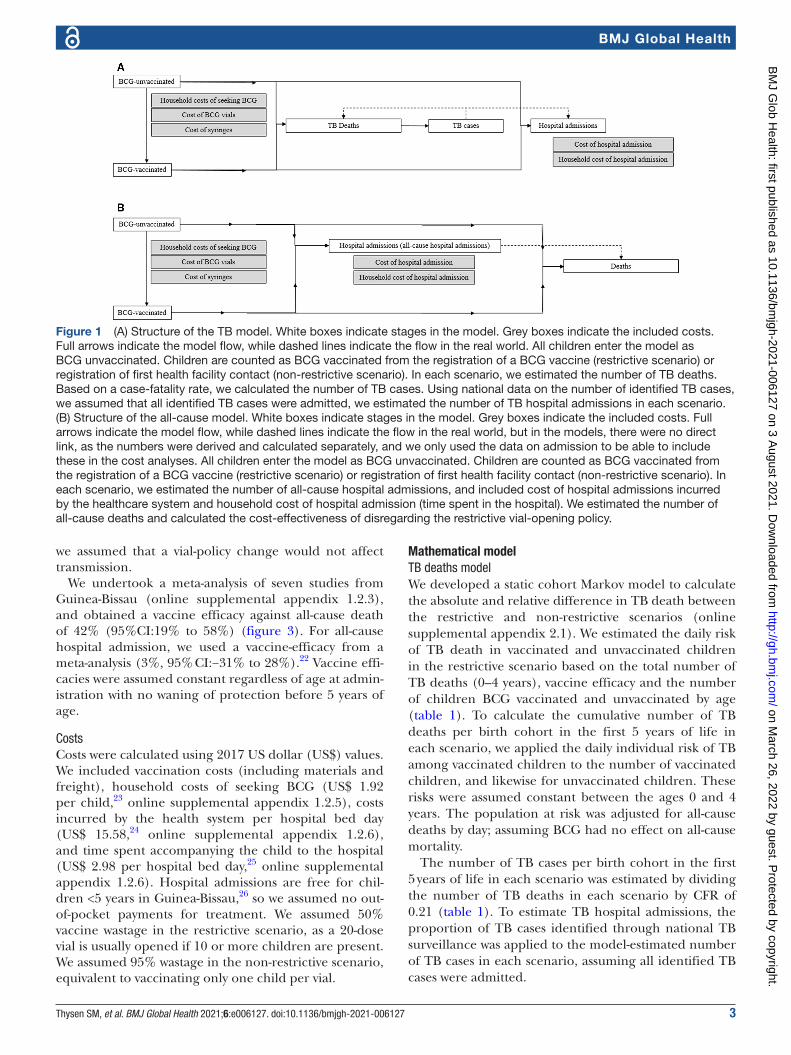
METHODSWe developed two static mathematical models, one for TB deaths based on a model developed by Roy et al7 and one for all- cause deaths, both in Microsoft Excel 2013 (figure 1A,B). The model by Roy assumed all- or- nothing efficacy, where a proportion (corresponding to the vaccine efficacy) of BCG- vaccinated children are assumed
to be fully protected, and the remainder are assumed to be unprotected. However, the mechanism of efficacy is unknown. As it is unrealistic to assume complete protec-tion against all- cause mortality, we assumed leaky BCG vaccine efficacy in both models, that is, all BCG- vaccinated children are assumed partly protected corresponding to the vaccine efficacy (online supplemental appendix 3.1).
The primary outcomes were absolute and percentage change in TB deaths and all- cause deaths averted among children <5 years per birth cohort due to disregarding the restricted BCG vial- opening policy (vial- policy change). The current scenario with restrictive BCG vial- opening policy (baseline) was compared with the non- restrictive scenario, defined as a scenario in which every child was BCG vaccinated at the first registered health facility contact.
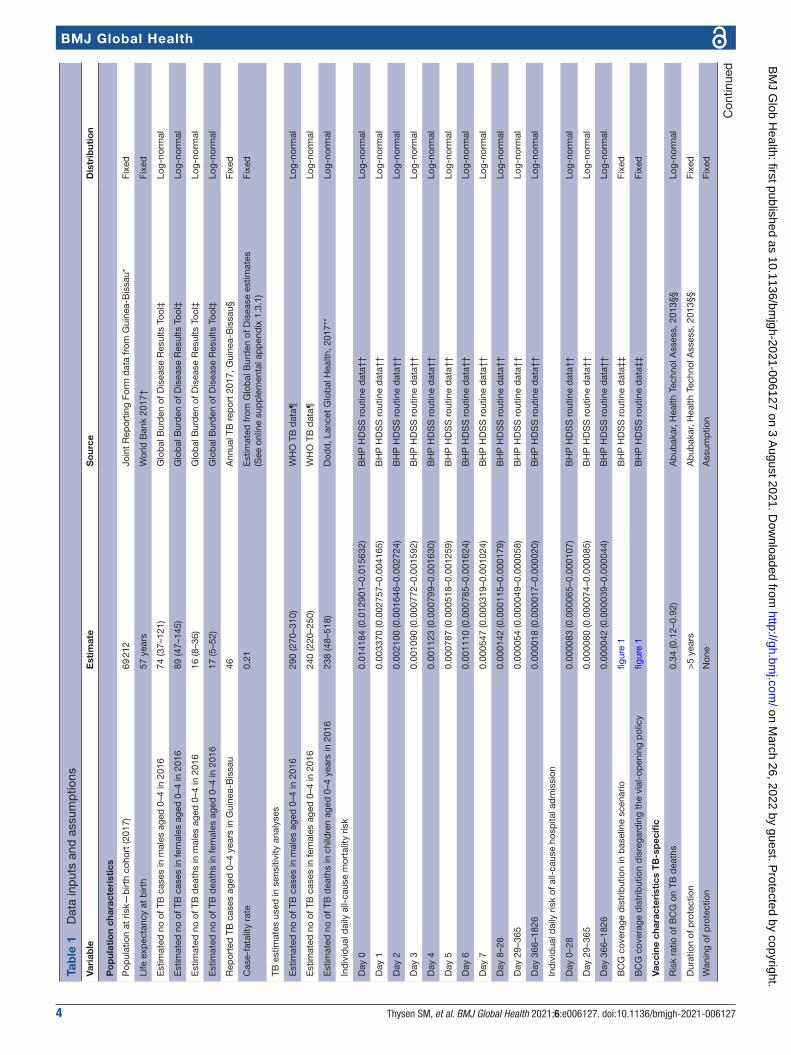
Data inputs and assumptionsWhere data were available, we used country- specific estimates for Guinea- Bissau. Parameter values and data sources are summarised in table 1.
Population estimatesWe used routine 2012–2017 surveillance data from the Bandim Health Project’s (BHP) urban and rural Health and Demographic Surveillance Systems (HDSS) to esti-mate the daily individual risk of all- cause mortality and all- cause hospital admission in children aged 0–4 years (table 1, online supplemental appendix 1.2.1). We used WHO/UNICEF birth cohort estimates (online supple-mental appendix 1.1) and World Bank estimate of 57 years life- expectancy in Guinea- Bissau in 2017.17
TB dataFor TB incidence and TB mortality, we used the 2016 Guinea- Bissau Global Burden of Disease18 (GBD) esti-mates, as reported TB data from Guinea- Bissau are likely underestimates. Using this information, we calculated a TB case fatality rate (CFR) of 0.21 (table 1). We assumed that all reported paediatric TB19 cases were hospitalised [personal communication: Victor Gomes, Programmatic Manager of MDR- TB, National TB Programme]. We calculated the proportion of hospitalised TB cases as reported cases divided by the GBD case estimate.
BCG coverage and timelinessUsing BHP routine data, we estimated BCG coverage and timeliness for the restrictive scenario using current estimates, and in the non- restrictive scenario using first health facility contact (figure 2, online supplemental appendix 1.2.2).
BCG vaccine efficacyWe used a BCG vaccine efficacy against TB death of 66% (95%CI: 8% to 88%).20 We assumed vaccine efficacy was constant regardless of age of administration.7 BCG protection may last for up to 15 years20, we, therefore, assumed no waning of protection between the ages 0 and 4 years. As children rarely contribute to transmission,21
Key questions
What do the new findings imply? ► Existing empirical evidence has demonstrated the importance of early BCG vaccination for TB control and that early BCG may reduce all- cause mortality. Our study strongly supports disregarding the re-strictive vial- opening policy, as we find that this would reduce child mortality and be cost- effective.
► Since Guinea- Bissau is not the only setting with this restrictive vial- opening policy and delays in BCG vaccination, other settings are likely to also gain by disregarding the restrictive vial- opening policy.
on March 26, 2022 by guest. P
rotected by copyright.http://gh.bm
j.com/
BM
J Glob H
ealth: first published as 10.1136/bmjgh-2021-006127 on 3 A
ugust 2021. Dow
nloaded from
Thysen SM, et al. BMJ Global Health 2021;6:e006127. doi:10.1136/bmjgh-2021-006127 3
BMJ Global Health
we assumed that a vial- policy change would not affect transmission.
We undertook a meta- analysis of seven studies from Guinea- Bissau (online supplemental appendix 1.2.3), and obtained a vaccine efficacy against all- cause death of 42% (95%CI:19% to 58%) (figure 3). For all- cause hospital admission, we used a vaccine- efficacy from a meta- analysis (3%, 95% CI:−31% to 28%).22 Vaccine effi-cacies were assumed constant regardless of age at admin-istration with no waning of protection before 5 years of age.
CostsCosts were calculated using 2017 US dollar (US$) values. We included vaccination costs (including materials and freight), household costs of seeking BCG (US$ 1.92 per child,23 online supplemental appendix 1.2.5), costs incurred by the health system per hospital bed day (US$ 15.58,24 online supplemental appendix 1.2.6), and time spent accompanying the child to the hospital (US$ 2.98 per hospital bed day,25 online supplemental appendix 1.2.6). Hospital admissions are free for chil-dren <5 years in Guinea- Bissau,26 so we assumed no out- of- pocket payments for treatment. We assumed 50% vaccine wastage in the restrictive scenario, as a 20- dose vial is usually opened if 10 or more children are present. We assumed 95% wastage in the non- restrictive scenario, equivalent to vaccinating only one child per vial.
Mathematical modelTB deaths modelWe developed a static cohort Markov model to calculate the absolute and relative difference in TB death between the restrictive and non- restrictive scenarios (online supplemental appendix 2.1). We estimated the daily risk of TB death in vaccinated and unvaccinated children in the restrictive scenario based on the total number of TB deaths (0–4 years), vaccine efficacy and the number of children BCG vaccinated and unvaccinated by age (table 1). To calculate the cumulative number of TB deaths per birth cohort in the first 5 years of life in each scenario, we applied the daily individual risk of TB among vaccinated children to the number of vaccinated children, and likewise for unvaccinated children. These risks were assumed constant between the ages 0 and 4 years. The population at risk was adjusted for all- cause deaths by day; assuming BCG had no effect on all- cause mortality.
The number of TB cases per birth cohort in the first 5 years of life in each scenario was estimated by dividing the number of TB deaths in each scenario by CFR of 0.21 (table 1). To estimate TB hospital admissions, the proportion of TB cases identified through national TB surveillance was applied to the model- estimated number of TB cases in each scenario, assuming all identified TB cases were admitted.
Figure 1 (A) Structure of the TB model. White boxes indicate stages in the model. Grey boxes indicate the included costs. Full arrows indicate the model flow, while dashed lines indicate the flow in the real world. All children enter the model as BCG unvaccinated. Children are counted as BCG vaccinated from the registration of a BCG vaccine (restrictive scenario) or registration of first health facility contact (non- restrictive scenario). In each scenario, we estimated the number of TB deaths. Based on a case- fatality rate, we calculated the number of TB cases. Using national data on the number of identified TB cases, we assumed that all identified TB cases were admitted, we estimated the number of TB hospital admissions in each scenario. (B) Structure of the all- cause model. White boxes indicate stages in the model. Grey boxes indicate the included costs. Full arrows indicate the model flow, while dashed lines indicate the flow in the real world, but in the models, there were no direct link, as the numbers were derived and calculated separately, and we only used the data on admission to be able to include these in the cost analyses. All children enter the model as BCG unvaccinated. Children are counted as BCG vaccinated from the registration of a BCG vaccine (restrictive scenario) or registration of first health facility contact (non- restrictive scenario). In each scenario, we estimated the number of all- cause hospital admissions, and included cost of hospital admissions incurred by the healthcare system and household cost of hospital admission (time spent in the hospital). We estimated the number of all- cause deaths and calculated the cost- effectiveness of disregarding the restrictive vial- opening policy.
on March 26, 2022 by guest. P
rotected by copyright.http://gh.bm
j.com/
BM
J Glob H
ealth: first published as 10.1136/bmjgh-2021-006127 on 3 A
ugust 2021. Dow
nloaded from
4 Thysen SM, et al. BMJ Global Health 2021;6:e006127. doi:10.1136/bmjgh-2021-006127
BMJ Global Health
Tab
le 1
D
ata
inp
uts
and
ass
ump
tions
Vari
able
Est
imat
eS
our
ceD
istr
ibut
ion
Po
pul
atio
n ch
arac
teri
stic
s
Pop
ulat
ion
at r
isk—
birt
h co
hort
(201
7)69
212
Join
t R
epor
ting
Form
dat
a fr
om G
uine
a- B
issa
u*Fi
xed
Life
exp
ecta
ncy
at b
irth
57 y
ears
Wor
ld B
ank
2017
†Fi
xed
Est
imat
ed n
o of
TB
cas
es in
mal
es a
ged
0–4
in 2
016
74 (3
7–12
1)G
lob
al B
urd
en o
f Dis
ease
Res
ults
Too
l‡Lo
g- no
rmal
Est
imat
ed n
o of
TB
cas
es in
fem
ales
age
d 0
–4 in
201
689
(47–
145)
Glo
bal
Bur
den
of D
isea
se R
esul
ts T
ool‡
Log-
norm
al
Est
imat
ed n
o of
TB
dea
ths
in m
ales
age
d 0
–4 in
201
616
(8–3
6)G
lob
al B
urd
en o
f Dis
ease
Res
ults
Too
l‡Lo
g- no
rmal
Est
imat
ed n
o of
TB
dea
ths
in fe
mal
es a
ged
0–4
in 2
016
17 (5
–52)
Glo
bal
Bur
den
of D
isea
se R
esul
ts T
ool‡
Log-
norm
al
Rep
orte
d T
B c
ases
age
d 0
–4 y
ears
in G
uine
a- B
issa
u46
Ann
ual T
B r
epor
t 20
17, G
uine
a- B
issa
u§Fi
xed
Cas
e- fa
talit
y ra
te0.
21E
stim
ated
from
Glo
bal
Bur
den
of D
isea
se e
stim
ates
(See
onl
ine
sup
ple
men
tal a
pp
end
ix 1
.3.1
)Fi
xed
TB e
stim
ates
use
d in
sen
sitiv
ity a
naly
ses
Est
imat
ed n
o of
TB
cas
es in
mal
es a
ged
0–4
in 2
016
290
(270
–310
)W
HO
TB
dat
a¶Lo
g- no
rmal
Est
imat
ed n
o of
TB
cas
es in
fem
ales
age
d 0
–4 in
201
624
0 (2
20–2
50)
WH
O T
B d
ata¶
Log-
norm
al
Est
imat
ed n
o of
TB
dea
ths
in c
hild
ren
aged
0–4
yea
rs in
201
623
8 (4
8–51
8)D
odd
, Lan
cet
Glo
bal
Hea
lth, 2
017*
*Lo
g- no
rmal
Ind
ivid
ual d
aily
all-
caus
e m
orta
lity
risk
Day
00.
0141
84 (0
.012
901–
0.01
5632
)B
HP
HD
SS
rou
tine
dat
a††
Log-
norm
al
Day
10.
0033
70 (0
.002
757–
0.00
4165
)B
HP
HD
SS
rou
tine
dat
a††
Log-
norm
al
Day
20.
0021
00 (0
.001
646–
0.00
2724
)B
HP
HD
SS
rou
tine
dat
a††
Log-
norm
al
Day
30.
0010
90 (0
.000
772–
0.00
1592
)B
HP
HD
SS
rou
tine
dat
a††
Log-
norm
al
Day
40.
0011
23 (0
.000
799–
0.00
1630
)B
HP
HD
SS
rou
tine
dat
a††
Log-
norm
al
Day
50.
0007
87 (0
.000
518–
0.00
1259
)B
HP
HD
SS
rou
tine
dat
a††
Log-
norm
al
Day
60.
0011
10 (0
.000
785–
0.00
1624
)B
HP
HD
SS
rou
tine
dat
a††
Log-
norm
al
Day
70.
0005
47 (0
.000
319–
0.00
1024
)B
HP
HD
SS
rou
tine
dat
a††
Log-
norm
al
Day
8–2
80.
0001
42 (0
.000
115–
0.00
0179
)B
HP
HD
SS
rou
tine
dat
a††
Log-
norm
al
Day
29–
365
0.00
0054
(0.0
0004
9–0.
0000
58)
BH
P H
DS
S r
outin
e d
ata†
†Lo
g- no
rmal
Day
366
–182
60.
0000
18 (0
.000
017–
0.00
0020
)B
HP
HD
SS
rou
tine
dat
a††
Log-
norm
al
Ind
ivid
ual d
aily
ris
k of
all-
caus
e ho
spita
l ad
mis
sion
Day
0–2
80.
0000
83 (0
.000
065–
0.00
0107
)B
HP
HD
SS
rou
tine
dat
a††
Log-
norm
al
Day
29–
365
0.00
0080
(0.0
0007
4–0.
0000
85)
BH
P H
DS
S r
outin
e d
ata†
†Lo
g- no
rmal
Day
366
–182
60.
0000
42 (0
.000
039–
0.00
0044
)B
HP
HD
SS
rou
tine
dat
a††
Log-
norm
al
BC
G c
over
age
dis
trib
utio
n in
bas
elin
e sc
enar
iofig
ure
1B
HP
HD
SS
rou
tine
dat
a‡‡
Fixe
d
BC
G c
over
age
dis
trib
utio
n d
isre
gard
ing
the
vial
- op
enin
g p
olic
yfig
ure
1B
HP
HD
SS
rou
tine
dat
a‡‡
Fixe
d
Vacc
ine
char
acte
rist
ics
TB
- sp
ecifi
c
Ris
k ra
tio o
f BC
G o
n TB
dea
ths
0.34
(0.1
2–0.
92)
Ab
ubak
ar, H
ealth
Tec
hnol
Ass
ess,
201
3§§
Log-
norm
al
Dur
atio
n of
pro
tect
ion
>5
year
sA
bub
akar
, Hea
lth T
echn
ol A
sses
s, 2
013§
§Fi
xed
Wan
ing
of p
rote
ctio
nN
one
Ass
ump
tion
Fixe
d
Con
tinue
d
on March 26, 2022 by guest. P
rotected by copyright.http://gh.bm
j.com/
BM
J Glob H
ealth: first published as 10.1136/bmjgh-2021-006127 on 3 A
ugust 2021. Dow
nloaded from

Thysen SM, et al. BMJ Global Health 2021;6:e006127. doi:10.1136/bmjgh-2021-006127 5
BMJ Global Health
Vari
able
Est
imat
eS
our
ceD
istr
ibut
ion
Pre
vent
ion
of t
rans
mis
sion
by
BC
GN
one
Ass
ump
tion
Fixe
d
Vacc
ine
char
acte
rist
ics
all-
caus
e ef
fect
s
Ris
k ra
tio o
f BC
G o
n al
l- ca
use
dea
ths
0.58
(0.4
2–0.
81)
Met
a- es
timat
e of
stu
die
s fr
om G
uine
a- B
issa
u¶¶
Log-
norm
al
Ris
k ra
tio o
f BC
G o
n al
l- ca
use
hosp
ital a
dm
issi
ons
0.97
(0.7
2–1.
31)
Met
a- es
timat
e of
stu
die
s fr
om G
uine
a- B
issa
u***
Log-
norm
al
Dur
atio
n of
pro
tect
ion
>5
year
sA
ssum
ptio
nFi
xed
Wan
ing
of p
rote
ctio
nN
one
Ass
ump
tion
Fixe
d
Pre
vent
ion
of t
rans
mis
sion
by
BC
GN
one
Ass
ump
tion
Fixe
d
Co
st e
stim
ates
BC
G v
acci
ne p
rice
per
dos
e in
cl. f
reig
ht0.
20 U
SD
Nat
iona
l dep
artm
ent
of t
he E
xpan
ded
Pro
gram
me
on Im
mun
isat
ion*
Fixe
d
Inje
ctio
n sy
ringe
pric
e in
cl. f
reig
ht0.
05 U
SD
Nat
iona
l dep
artm
ent
of t
he E
xpan
ded
Pro
gram
me
on Im
mun
isat
ion*
Fixe
d
Mix
ing
syrin
ge p
rice
incl
. fre
ight
0.03
US
DN
atio
nal d
epar
tmen
t of
the
Exp
and
ed P
rogr
amm
e on
Imm
unis
atio
n*Fi
xed
Saf
ety
box
0.67
US
DN
atio
nal d
epar
tmen
t of
the
Exp
and
ed P
rogr
amm
e on
Imm
unis
atio
n*Fi
xed
Med
ian
bed
day
per
TB
hos
pita
l ad
mis
sion
60 d
ays
Per
sona
l com
mun
icat
ion:
Vic
tor
Gom
es, N
atio
nal T
B P
rogr
amm
e§Fi
xed
Med
ian
bed
day
per
all-
caus
e ho
spita
l ad
mis
sion
5 d
ays
BH
P H
DS
S h
osp
ital a
dm
issi
on d
ata†
††Fi
xed
Cos
ts p
er h
osp
ital b
ed d
ay in
curr
ed b
y he
alth
sys
tem
15.5
8 U
SD
Ene
mar
k, in
pre
par
atio
n, 2
019‡
‡‡Fi
xed
Hou
seho
ld p
rod
uctiv
ity c
osts
per
bed
day
hos
pita
l ad
mis
sion
2.98
US
DK
nigh
t, P
NA
S, 2
014§
§§Fi
xed
Hou
seho
ld c
osts
of s
eeki
ng B
CG
vac
cina
tion
1.92
US
DTh
ysen
, Vac
cine
, 201
9¶¶
¶Fi
xed
Ave
rage
no
of t
imes
see
king
BC
G v
acci
natio
n—re
stric
tive
(bas
elin
e)
scen
ario
1.26
Thys
en, V
acci
ne, 2
019¶
¶¶
Fixe
d
Ave
rage
no
of t
imes
see
king
BC
G v
acci
natio
n—no
n- re
stric
tive
scen
ario
1A
ssum
ptio
nFi
xed
Vacc
ine
was
tage
—re
stric
tive
(bas
elin
e) s
cena
rio50
%A
ssum
ptio
nFi
xed
Vacc
ine
was
tage
—no
n- re
stric
tive
scen
ario
95%
Ass
ump
tion
Fixe
d
*Per
sona
l com
mun
icat
ion:
Car
litos
Bal
e, D
irect
or o
f the
Exp
and
ed P
rogr
amm
e on
Imm
unis
atio
n in
Gui
nea-
Bis
sau.
†Wor
ld B
ank.
17
‡Ins
titut
e fo
r H
ealth
Met
rics
and
Eva
luat
ion.
18
§Per
sona
l com
mun
icat
ion:
Vic
tor
Gom
es, P
rogr
amm
atic
Man
ager
of M
DR
- TB
, Nat
iona
l TB
Pro
gram
me.
¶W
HO
.31
**D
odd
PJ
etal
5
††on
line
sup
ple
men
tal a
pp
end
ix 1
.2.1
.‡‡
onlin
e su
pp
lem
enta
l ap
pen
dix
1.2
.2.
§§A
bub
akar
I et
al20
¶¶
onlin
e su
pp
lem
enta
l ap
pen
dix
1.2
.3, fi
gure
2.
***S
chal
tz- B
uchh
olze
r F
et a
l22
†††o
nlin
e su
pp
lem
enta
l ap
pen
dix
1.2
.6.
‡‡‡E
nem
ark
U e
t al
24
§§§K
nigh
t G
M e
t al
25
¶¶
¶Th
ysen
SM
eta
l23
BH
P, B
and
im H
ealth
Pro
ject
’s; H
DS
S, H
ealth
and
Dem
ogra
phi
c S
urve
illan
ce S
yste
ms;
TB
, tub
ercu
losi
s.
Tab
le 1
C
ontin
ued
on March 26, 2022 by guest. P
rotected by copyright.http://gh.bm
j.com/
BM
J Glob H
ealth: first published as 10.1136/bmjgh-2021-006127 on 3 A
ugust 2021. Dow
nloaded from

6 Thysen SM, et al. BMJ Global Health 2021;6:e006127. doi:10.1136/bmjgh-2021-006127
BMJ Global Health
All-cause deaths modelWe developed a static cohort Markov model to calcu-late the absolute and relative difference in all- cause death between the two scenarios (online supplemental appendix 2.2). We estimated daily, age- specific risk of all- cause death using the BHP routine all- cause mortality data (online supplemental appendix 1.2.1). Applying similar methods as the TB model, we used baseline data on BCG coverage by age, vaccine efficacy meta- estimate for all- cause death (online supplemental appendix 1.2.3), and the daily risk of all- cause death to calculate the daily risk of all- cause death in BCG- vaccinated children and in BCG- unvaccinated children, respectively.
We applied the estimated daily individual risk of all- cause mortality among BCG- vaccinated children to the
number of BCG- vaccinated children, and likewise for unvaccinated children, and estimated daily and cumu-lative all- cause deaths between 0 and 4 years under the restrictive and non- restrictive scenarios (online supple-mental appendix 2.2). Using a similar approach, we calculated the absolute and relative difference in all- cause hospital admissions between scenarios (online supplemental appendix 2.3).
Increasing evidence suggests that vaccines may interact.12 27 We, therefore, conducted a secondary anal-ysis to assess outcomes only in the period prior to receipt of other vaccines (0–6 weeks of age).
Cost-effectiveness analysesCost- effectiveness was assessed from a societal perspec-tive, including total population- level vaccination costs, household costs of seeking BCG vaccination, and costs of hospital admission incurred by the health system and the household (online supplemental appendix 2.4).
We added the number of deaths per year between the ages 0 and 5 years in 1- year intervals, to calculate the total number of deaths averted. Life- years gained (LYG) in the non- restrictive scenario were calculated in each model by multiplying the number of TB deaths or all- cause deaths averted per year of life by the remaining life expectancy.17 As WHO recommends,28 we discounted future costs and life years by 3%/year. We calculated incremental cost- effectiveness ratios (ICERs) of a vial- policy change. We used Wood’s purchasing power parity adjusted cost- effectiveness threshold for Guinea- Bissau of US$22–US$645.29
Urban versus rural subanalysesVaccination opportunities, healthcare- seeking behav-iour and number of children present at health centres are likely to differ between the urban and rural popu-lation, resulting in different effects of a vial- policy change. We, therefore, calculated separate estimates for urban and rural Guinea- Bissau. We used the same approaches, but substituted risk of all- cause mortality, risk of all- cause hospital admission, BCG coverage, and birth cohort estimates with regional estimates.
Uncertainty and sensitivity analysesWe performed a probabilistic uncertainty anal-ysis using Oracle Crystal Ball (Release 11.1.2.4.850, Oracle, USA), where a statistical distribution was set for each parameter with a reported UR (table 1). Location and scale parameters were estimated using the 2.5%, 50% and 97.5% percentiles in the ‘rriskDis-tributions’ R package. Parameters with fixed values were not considered uncertain. A total of 100 000 parameter sets and model outputs were generated through Monte- Carlo simulations. Median and 95% URs were calculated from the 100 000 model outputs.
In sensitivity analyses, we assessed the impact of assuming leaky BCG vaccine efficacy by adapting the TB model to all- or- nothing efficacy, as in previous
Figure 2 BCG coverage estimates in Guinea- Bissau in the restrictive (baseline) scenario and when disregarding the restrictive BCG vial- opening policy.
Figure 3 Meta- analysis of the effect of BCG on all- cause mortality in Guinea- Bissau HRs below 1 indicate that BCG vaccine is associated with lower mortality. HRs above 1 indicate that BCG vaccination is associated with higher mortality. 1: Kristensen et al9, 2: Aaby et al34, 3: Roth et al35, 4: Aaby et al36, 5: Biering- Sørensen et al37, 6: Biering- Sørensen et al8, 7: Thysen et al.38
on March 26, 2022 by guest. P
rotected by copyright.http://gh.bm
j.com/
BM
J Glob H
ealth: first published as 10.1136/bmjgh-2021-006127 on 3 A
ugust 2021. Dow
nloaded from

Thysen SM, et al. BMJ Global Health 2021;6:e006127. doi:10.1136/bmjgh-2021-006127 7
BMJ Global Health
models7 30 (online supplemental appendix 2.5). We evaluated the impact of using GBD estimates of TB mortality in two sensitivity analyses, using WHO TB incidence31 combined with CFR estimates from Jenkins,32 and using modelled estimates of TB mortality from Dodd.5 We also varied the assumption of perfect correlation between (1) male and female TB estimates, and (2) agewise mortality estimates, to be uncorrelated in sensitivity analyses. We assumed very high wastage (95%) in the non- restrictive scenario, and therefore conducted sensitivity analyses with wastage assumptions in the restrictive scenario from 35% to 60% with 5% intervals, and in the non- restrictive scenario from 70% to 90%.
Patient and public involvementThe communities were involved in locating households for the HDSS data collection, when the BHP HDSS was setup. No participant was involved in setting the research question or the outcome measure, nor were they involved in developing the models, or design of the study. No participant was asked to advise on inter-pretation or writing up the results. The results are
disseminated to the national public health institute. There are no plans to disseminate the results of the research to study participants or the community.
RESULTSEffects of a vial-policy change on TB-specific outcomesDisregarding the restrictive vial opening policy was estimated to reduce TB deaths, admissions and cases by 11.0% (95% UR: 0.5%–28.8%). The number of TB deaths was 33 (UR: 13–89) per birth cohort in the restrictive scenario and 29 (UR: 11–79) in the non- restrictive scenario, averting 4 (UR: 0–15) TB deaths per birth cohort in the first 5 years of life. TB cases were reduced from 162 (UR: 96–273) to 142 (UR: 82–245), and TB hospital admissions from 46 to 41 (table 2).
Effects of a vial-policy change on all-cause outcomesThe vial- policy change was estimated to reduce all- cause mortality by 8.1% (UR: 3.3%–12.7%), from 4820 (UR: 4309–5425) all- cause deaths in the restrictive scenario to 4429 (UR: 3920–5028) all- cause deaths in the non- restrictive
Table 2 Effects of disregarding the restrictive BCG vial- opening policy in Guinea- Bissau
Restrictive (baseline) scenario
Non- restrictive scenario Absolute change Percentage change
Median(95% uncertainty range)
Median(95% uncertainty range)
Median(95% uncertainty range)
Median(95% uncertainty range)
TB- specific effects
Total no of paediatric TB deaths
33 (13 to 89) 29 (11 to 79) −4 (−15 to 0) −11.0% (−28.8% to −0.5%)
Total no of paediatric TB cases
162 (96 to 273) 142 (82 to 245) −18 (−54 to −1) −11.0% (−28.8% to −0.5%)
Total no of paediatric TB hospital admissions
46* 41 (33 to 46) −5 (−13 to 0) −11.0% (−28.8% to −0.5%)
Sub- analysis stratifying urban and rural regions
Total no of paediatric TB deaths—urban data
8 (3 to 22) 8 (3 to 21) 0 (−1 to 0) −2.6% (−8.3% to −0.1%)
Total no of paediatric TB deaths—rural data
26 (10 to 69) 21 (8 to 57) −4 (−17 to 0) −16.4% (−38.6% to −0.8%)
All- cause effects
Total no of all- cause deaths 4820 (4309 to 5425) 4429 (3920 to 5028) −392 (−624 to −158) −8.1% (−12.7% to −3.3%)
Total no of all- cause hospital admissions
5926 (5538 to 6346) 5940 (5532 to 6380) 18 (−125 to 133) 0.4% (−2.6% to 2.8%)
Subanalysis stratifying urban and rural regions
Total no of all- cause deaths urban data
1071 (897 to 1302) 961 (795 to 1180) −111 (−172 to -47) −10.4% (−15.3% to −4.5%)
Total no of all- cause deaths rural data
3787 (3303 to 4386) 3467 (2992 to 4048) −319 (−527 to −124) −8.4% (−13.5% to −3.3%)
*The number of paediatric TB hospital admissions is the reported number of TB cases from Guinea- Bissau in 2017 (Programa Nacional de Luta contra a Tuberculose. Relatório anualde tuberculose 2017: Ministério da Saúde Publica da Guiné-Bissau, 2018).TB, tuberculosis.
on March 26, 2022 by guest. P
rotected by copyright.http://gh.bm
j.com/
BM
J Glob H
ealth: first published as 10.1136/bmjgh-2021-006127 on 3 A
ugust 2021. Dow
nloaded from
8 Thysen SM, et al. BMJ Global Health 2021;6:e006127. doi:10.1136/bmjgh-2021-006127
BMJ Global Health
scenario, averting 392 (UR: 158–624) all- cause deaths per birth cohort in the first 5 years of life (table 2). There was an estimated 0.4% (UR:−2.6 to 2.8%) increase in all- cause hospital admissions, due to more children surviving and becoming admitted to hospital (table 2).
Costs and cost-effectiveness of a vial-policy changeIn both models, the vial- policy change resulted in higher BCG- vaccination costs and lower household costs.
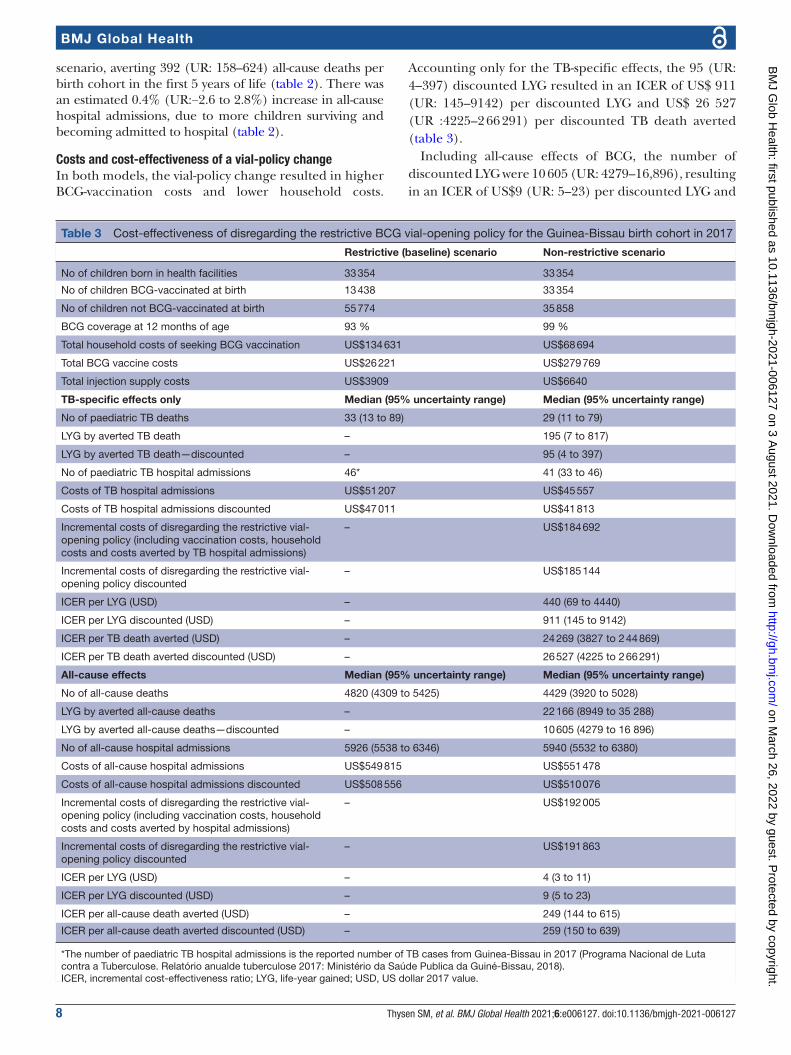
Accounting only for the TB- specific effects, the 95 (UR: 4–397) discounted LYG resulted in an ICER of US$ 911 (UR: 145–9142) per discounted LYG and US$ 26 527 (UR :4225–2 66 291) per discounted TB death averted (table 3).
Including all- cause effects of BCG, the number of discounted LYG were 10 605 (UR: 4279–16,896), resulting in an ICER of US$9 (UR: 5–23) per discounted LYG and
Table 3 Cost- effectiveness of disregarding the restrictive BCG vial- opening policy for the Guinea- Bissau birth cohort in 2017
Restrictive (baseline) scenario Non- restrictive scenario
No of children born in health facilities 33 354 33 354
No of children BCG- vaccinated at birth 13 438 33 354
No of children not BCG- vaccinated at birth 55 774 35 858
BCG coverage at 12 months of age 93 % 99 %
Total household costs of seeking BCG vaccination US$134 631 US$68 694
Total BCG vaccine costs US$26 221 US$279 769
Total injection supply costs US$3909 US$6640
TB- specific effects only Median (95% uncertainty range) Median (95% uncertainty range)
No of paediatric TB deaths 33 (13 to 89) 29 (11 to 79)
LYG by averted TB death – 195 (7 to 817)
LYG by averted TB death—discounted – 95 (4 to 397)
No of paediatric TB hospital admissions 46* 41 (33 to 46)
Costs of TB hospital admissions US$51 207 US$45 557
Costs of TB hospital admissions discounted US$47 011 US$41 813
Incremental costs of disregarding the restrictive vial- opening policy (including vaccination costs, household costs and costs averted by TB hospital admissions)
– US$184 692
Incremental costs of disregarding the restrictive vial- opening policy discounted
– US$185 144
ICER per LYG (USD) – 440 (69 to 4440)
ICER per LYG discounted (USD) – 911 (145 to 9142)
ICER per TB death averted (USD) – 24 269 (3827 to 2 44 869)
ICER per TB death averted discounted (USD) – 26 527 (4225 to 2 66 291)
All- cause effects Median (95% uncertainty range) Median (95% uncertainty range)
No of all- cause deaths 4820 (4309 to 5425) 4429 (3920 to 5028)
LYG by averted all- cause deaths – 22 166 (8949 to 35 288)
LYG by averted all- cause deaths—discounted – 10 605 (4279 to 16 896)
No of all- cause hospital admissions 5926 (5538 to 6346) 5940 (5532 to 6380)
Costs of all- cause hospital admissions US$549 815 US$551 478
Costs of all- cause hospital admissions discounted US$508 556 US$510 076
Incremental costs of disregarding the restrictive vial- opening policy (including vaccination costs, household costs and costs averted by hospital admissions)
– US$192 005
Incremental costs of disregarding the restrictive vial- opening policy discounted
– US$191 863
ICER per LYG (USD) – 4 (3 to 11)
ICER per LYG discounted (USD) – 9 (5 to 23)
ICER per all- cause death averted (USD) – 249 (144 to 615)
ICER per all- cause death averted discounted (USD) – 259 (150 to 639)
*The number of paediatric TB hospital admissions is the reported number of TB cases from Guinea- Bissau in 2017 (Programa Nacional de Luta contra a Tuberculose. Relatório anualde tuberculose 2017: Ministério da Saúde Publica da Guiné-Bissau, 2018).ICER, incremental cost- effectiveness ratio; LYG, life- year gained; USD, US dollar 2017 value.
on March 26, 2022 by guest. P
rotected by copyright.http://gh.bm
j.com/
BM
J Glob H
ealth: first published as 10.1136/bmjgh-2021-006127 on 3 A
ugust 2021. Dow
nloaded from

Thysen SM, et al. BMJ Global Health 2021;6:e006127. doi:10.1136/bmjgh-2021-006127 9
BMJ Global Health
US$259 (UR: 150–639) per discounted all- cause death averted (table 3).
Effects of a vial-policy change in urban and rural health regionsThe vial- policy change in urban Guinea- Bissau was estimated to have a smaller effect on TB mortality, with 2.6% (0.1%–8.3%) fewer TB deaths, corresponding to less than 1 TB death per birth cohort (table 2). There was, however, a larger impact in the all- cause model with 111 (UR: 47–172) fewer deaths and 10.4% (UR: 4.5%–15.3%) estimated lower mortality, as many children had vaccination opportunities within the first days of life, where all- cause mortality is highest. Including all- cause effects, the estimated ICERs were US$10 (UR: 6–23) per discounted LYG and US$280 (UR: 173–653) per discounted all- cause death averted (online supplemental appendix 3.4).
In the rural population, the policy change was esti-mated to reduce TB deaths by 16.4% (0.8%–38.6%), corresponding to 4 (UR: 0–17) fewer TB deaths. The
resulting ICERs were US$524 (UR: 77–5455) per discounted LYG and US$15 272 (UR: 2245–159 037) per TB death averted. The estimated reduction in all- cause mortality was 8.4% (3.3%–13.5%) corre-sponding to 319 (UR: 124–527) fewer all- cause deaths (table 4). The resulting ICERs were US$8 (UR: 4–20) per discounted LYG and US$221 (UR: 120–567) per discounted all- cause death averted (online supple-mental appendix 3.4).
Sensitivity analysesStructuralAdapting the TB model structure from a model assuming leaky vaccine efficacy (main analysis) to all- or- nothing efficacy did not alter results (table 4). Similarly, assuming no correlations between mortality estimates yielded similar results (online supplemental appendix 3.5). The vial- policy change was cost saving in both TB and all- cause models when vaccine wastage was 80% or less in the non- restrictive scenario (online supplemental appendix 3.6).
Table 4 Effects of disregarding the restrictive BCG vial- opening policy in Guinea- Bissau—sensitivity analyses
Restrictive (baseline) scenario
Non- restrictive scenario Absolute differences Percentage change*
Median (95% uncertainty range)
Median (95% uncertainty range)
Median (95% uncertainty range)
Median (95% uncertainty range)
TB- specific effects
Total no of paediatric TB deaths - main analysis
33 (13 to 89) 29 (11 to 79) −4 (−15 to 0) −11.0% (−28.8% to −0.5%)
Sensitivity to BCG mode of action model structure
Total no of paediatric TB deaths—all- or- nothing BCG effectiveness
33 (13 to 89) 29 (11 to 79) −4 (−15 to 0) −11.0% (−28.8% to −0.5%)
Sensitivity to calibration data
Total no of paediatric TB deaths—WHO† and Jenkins‡ data
231 (196 to 272) 204 (156 to 252) −25 (−68 to −1) −11.0% (−28.8% to −0.5%)
Total no of paediatric TB deaths—P. Dodd§ data
238 (110 to 519) 209 (94 to 463) −25 (−94 to −1) −11.0% (−28.8% to −0.5%)
All- cause effects
Total no of all- cause deaths day—main analysis day 0–1826
4820 (4309 to 5425) 4429 (3920 to 5028) −392 (−624 to −158) −8.1% (−12.7% to −3.3%)
Subanalysis limiting follow- up to scheduled age of next vaccination
Total no of all- cause deaths day 0–42
1922 (1612 to 2318) 1648 (1352 to 2028) −277 (−415 to −120) −14.5% (−20.7% to −6.3%)
Subanalysis excluding day 0
Total no of all- cause deaths day 1–1826
3838 (3417 to 4345) 3621 (3208 to 4112) −216 (−373 to −80) −5.6% (−9.5% to −2.1%)
*Percentage change comparing the non- restrictive scenario with the restrictive scenario.†WHO.31
‡Jenkins HE et al32
§Dodd PJ et al5
TB, tuberculosis.
on March 26, 2022 by guest. P
rotected by copyright.http://gh.bm
j.com/
BM
J Glob H
ealth: first published as 10.1136/bmjgh-2021-006127 on 3 A
ugust 2021. Dow
nloaded from

10 Thysen SM, et al. BMJ Global Health 2021;6:e006127. doi:10.1136/bmjgh-2021-006127
BMJ Global Health
Source of TB dataBoth the WHO TB incidence31 combined with Jenkins CFR32 and the Dodd estimates5 resulted in 25 averted TB deaths per birth cohort in the first 5 years of life. However, UR were greater when using Dodd estimates (table 4).
Prior to other routine vaccinesLimiting the analyses to the period prior to other sched-uled routine vaccines, the policy change was estimated to reduce all- cause mortality by 14.5% (UR: 6.3%–20.7%) (table 4).
DISCUSSIONMain findingsDisregarding the restrictive BCG vial- opening policy was estimated to reduce TB deaths by 11.0% (UR: 0.5%–28.8%) corresponding to 4 (UR: 0–15) TB deaths averted per birth cohort. All- cause death estimates were reduced by 8.1% (UR: 3.3%–12.7%) corresponding to 392 (UR: 158–624) all- cause deaths per birth cohort. The ICER of the vial- policy change was estimated as US$911 (UR: 145–9142) per discounted LYG by averting TB deaths. The estimated ICER considering all- cause mortality was considerably lower: US$9 (UR: 5–23) per discounted LYG. Compared with Wood’s purchasing power parity adjusted cost- effectiveness threshold for Guinea- Bissau (US$22–US$645),29 the most conservative wastage assumption (95% in the non- restrictive scenario) may not lead to the conclusion that the policy was cost effective assuming effect only on TB deaths. However, at less conservative wastage assumptions, the cost declined markedly and despite few TB deaths averted, changing the policy could be cost- effective for TB deaths, and the policy was highly cost- effective including the effect on all- cause deaths, demonstrating the potential importance of considering all- cause effects in vaccine cost- effectiveness evaluations. Importantly, in the non- restrictive scenario, increased costs were incurred by the health system, while household costs were reduced. Hence, the intervention is likely to increase equity.
The vial- policy change was associated with larger impact in rural than urban Guinea- Bissau, as vaccination delays are greater in rural Guinea- Bissau and mortality is higher.
Comparisons and perspectivesPreviously, Roy estimated that increasing BCG coverage to 92% at birth globally could reduce TB deaths <15 years of age by 2.8%.7 We found a greater percentage reduction in TB deaths (11.0%, UR: 0.5%–28.8%) by improving timeliness of BCG vaccination. Greater delays in BCG vaccination in the restrictive scenario and more precise estimates of BCG coverage in Guinea- Bissau contribute to the difference.
In recent years, manufacturing problems have created BCG shortages, estimated to be associated with 7433 (UR: 320–19 477) excess TB deaths in 0–14 year olds per global birth cohort,30 but potential excess all- cause deaths were not included. Our results suggest that if all- cause deaths
had been estimated, the assessed public health impact of these shortages would have been substantially higher, and emphasise the importance of including all- cause mortality to inform the full impact of a policy change.
Strengths and limitationsWe present the first model assessing impact and cost- effectiveness of the vial- opening policy change on all- cause mortality, and first country- level model assessing impact and cost- effectiveness of this change on any outcome. The BHP HDSS data allowed for country- representative age- specific estimates based on individual level data, which are more accurate than the aggregated data usually available. Results were robust to sensitivity analyses conducted.
Increasing vaccination coverage is usually resource demanding, but using the first registered health- facility contact to provide BCG could easily be implemented without additional initiatives. Thus, the high coverage in the non- restrictive scenario would be realistic if enough vaccines were available.
TB surveillance in Guinea- Bissau is limited and TB is likely underdiagnosed. Due to uncertainty in estimates of TB incidence and mortality, we assessed robustness of our results to the TB- calibration data by conducting sensitivity analyses using other data sources. The main estimates of absolute TB deaths averted were likely conservative, as using other data sources resulted in more TB deaths averted. The efficacy estimates of BCG against TB have varied between studies and populations,2 20 and thus the meta- analysed estimates have wide URs. We assumed that TB mortality was constant in 0–4 years old, since age- stratified data were not available. The estimates of TB cases and hospital admissions should be interpreted with caution as they are calculated based on different data sources assuming comparability.
The vaccine efficacy on all- cause deaths was estimated from trials in low- weight neonates and observational studies from Guinea- Bissau, which provided similar mortality estimates. More data from normal birth weight children would be of value. The current level of evidence is not sufficient to conclude on the duration of NSEs.
Cost estimates were derived from Guinea- Bissau. Household costs of seeking BCG vaccination23 and health system costs per hospital bed day were included.24 Out- of- pocket payments for treatment were not included, but as hospital admission for children is free, we expect out- of- pocket payments to be few. In main analyses, we conser-vatively assumed only one child was vaccinated per vial in the non- restrictive scenario, therefore likely overesti-mating the costs of the intervention, as more than one child would likely be vaccinated per vial. Sensitivity anal-yses showed that the intervention would potentially be cost saving, if on average four children were vaccinated per vial. However, we did not calculate URs for sensitivity analyses on wastage assumptions, and this conclusion should therefore be interpreted with caution.
on March 26, 2022 by guest. P
rotected by copyright.http://gh.bm
j.com/
BM
J Glob H
ealth: first published as 10.1136/bmjgh-2021-006127 on 3 A
ugust 2021. Dow
nloaded from

Thysen SM, et al. BMJ Global Health 2021;6:e006127. doi:10.1136/bmjgh-2021-006127 11
BMJ Global Health
Our models only included Guinea- Bissau. However, the restrictive vial- opening policy is not limited to Guinea- Bissau.15 33 While the exact impact and cost- effectiveness estimates are not directly transferable to other countries, the conclusions of the study are likely to be generalisable. Thus, important gains are likely to be possible in other settings with a similar practice.
CONCLUSIONDisregarding the restrictive vial- opening policy in Guinea- Bissau was estimated to result in small reductions in TB deaths and substantial reductions in all- cause deaths. Our results support that it would be cost- effective to disregard the restrictive vial- opening policy.
Author affiliations1OPEN, Institute of Clinical Research, University of Southern Denmark, Odense, Denmark2Bandim Health Project, Bissau, Guinea- Bissau3Research Centre for Vitamins and Vaccines, Bandim Health Project, Statens Serum Institut, Copenhagen, Denmark4Center for Global Health (GloHAU), Aarhus University, Aarhus, Denmark5TB Centre for Mathematical Modelling of Infectious Diseases, London School of Hygiene and Tropical Medicine Faculty of Epidemiology and Population Health, London, UK6Health section, UNICEF, New York, New York, USA
Twitter Sanne M Thysen @Sthysen and Ane Baerent Fisker @AneFisker
Acknowledgements We thank Carlitos Bale for providing data on population estimates. We thank Victor Gomes for providing insights and data on TB incidence and deaths in Guinea- Bissau. We thank all mothers and children who provided data for Bandim Health Projects’ urban and rural HDSS. We thank data collectors and colleagues from the BHP, who contributed to the data collection and cleaning of data for the present study.
Contributors SMT, ABF and RCH conceived the idea for the study. SMT and RCH developed the research method and the mathematical models with input from ABF, UG, PR and RW. SMT, ABF, SB and PA contributed to the original data collection. SMT extracted the data. SMT conducted the analyses, and wrote the manuscript with input from ABF, UG and RCH. All authors reviewed the manuscript and approved the final version for submission.
Funding This work was supported by European Union FP7 support for OPTIMUNISE (Health- F3-2011-261375), and by the Augustinus Foundation. The Bandim Health Project received support from the Danish National Research Foundation via Research Centre for Vitamins and Vaccines (DNRF108). RW is funded by the Wellcome Trust (218261/Z/19/Z); NIH (1R01AI147321-01); EDTCP (RIA208D- 2505B); UK MRC (CCF17-7779 via SET Bloomsbury); ESRC (ES/P008011/1); BMGF (OPP1084276, OPP1135288, INV-001754) and the WHO (2020/985800-0).
Disclaimer The sponsors had no role in designing the study, the data collection, data analysis, data interpretation or writing the paper.
Competing interests RCH reports employment at Sanofi Pasteur, unrelated to the subject of this research.
Patient consent for publication Not required.
Provenance and peer review Not commissioned; externally peer reviewed.
Data availability statement Data are available on request. Data are available on a collaborative basis, contact s. thysen@ bandim. org.
Supplemental material This content has been supplied by the author(s). It has not been vetted by BMJ Publishing Group Limited (BMJ) and may not have been peer- reviewed. Any opinions or recommendations discussed are solely those of the author(s) and are not endorsed by BMJ. BMJ disclaims all liability and responsibility arising from any reliance placed on the content. Where the content includes any translated material, BMJ does not warrant the accuracy and reliability of the translations (including but not limited to local regulations, clinical guidelines,
terminology, drug names and drug dosages), and is not responsible for any error and/or omissions arising from translation and adaptation or otherwise.
Open access This is an open access article distributed in accordance with the Creative Commons Attribution Non Commercial (CC BY- NC 4.0) license, which permits others to distribute, remix, adapt, build upon this work non- commercially, and license their derivative works on different terms, provided the original work is properly cited, appropriate credit is given, any changes made indicated, and the use is non- commercial. See: http:// creativecommons. org/ licenses/ by- nc/ 4. 0/.
ORCID iDsSanne M Thysen http:// orcid. org// 0000- 0003- 4541- 3901Ane Baerent Fisker http:// orcid. org/ 0000- 0002- 8521- 0992
REFERENCES 1 World Health Organisation. BCG vaccines: WHO position paper –
February 2018. Wkly Epidemiol Rec 2018;93:73–96. 2 Mangtani P, Abubakar I, Ariti C, et al. Protection by BCG vaccine
against tuberculosis: a systematic review of randomized controlled trials. Clin Infect Dis 2014;58:470–80.
3 World Health Organisation. Global Tubeculosis report 2018. Licence: CC BY- NC- SA 3.0 IGO, 2018.
4 Liu L, Oza S, Hogan D, et al. Global, regional, and national causes of under-5 mortality in 2000-15: an updated systematic analysis with implications for the sustainable development goals. Lancet 2016;388:3027–35.
5 Dodd PJ, Yuen CM, Sismanidis C, et al. The global burden of tuberculosis mortality in children: a mathematical modelling study. Lancet Glob Health 2017;5:e898–906.
6 World Health Organisation. Global strategy and targets for tuberculosis prevention, care and control after 2015, 2013. Available: http:// apps. who. int/ gb/ ebwha/ pdf_ files/ EB134/ B134_ 12- en. pdf? ua=1
7 Roy P, Vekemans J, Clark A, et al. Potential effect of age of BCG vaccination on global paediatric tuberculosis mortality: a modelling study. Lancet Glob Health 2019;7:e1655–63.
8 Biering- Sørensen S, Aaby P, Lund N, et al. Early BCG- Denmark and Neonatal Mortality Among Infants Weighing <2500 g: A Randomized Controlled Trial. Clin Infect Dis 2017;65:1183–90.
9 Kristensen I, Aaby P, Jensen H. Routine vaccinations and child survival: follow up study in Guinea- Bissau, West Africa. BMJ 2000;321:1435–8.
10 Butkeviciute E, Jones CE, Smith SG. Heterologous effects of infant BCG vaccination: potential mechanisms of immunity. Future Microbiol 2018;13:1193–208.
11 Arts RJW, Moorlag SJCFM, Novakovic B, et al. Bcg vaccination protects against experimental viral infection in humans through the induction of cytokines associated with trained immunity. Cell Host Microbe 2018;23:89–100.
12 Higgins JPT, Soares- Weiser K, López- López JA, et al. Association of BCG, DTP, and measles containing vaccines with childhood mortality: systematic review. BMJ 2016;355:i5170.
13 VanderEnde K, Gacic- Dobo M, Diallo MS, et al. Global Routine Vaccination Coverage - 2017. MMWR Morb Mortal Wkly Rep 2018;67:1261–4.
14 Thysen SM, Byberg S, Pedersen M, et al. BCG coverage and barriers to BCG vaccination in Guinea- Bissau: an observational study. BMC Public Health 2014;14:1037.
15 Kagoné M, Yé M, Nébié E, et al. Vaccination coverage and factors associated with adherence to the vaccination schedule in young children of a rural area in Burkina Faso. Glob Health Action 2017;10:1399749.
16 Scott S, Odutola A, Mackenzie G, et al. Coverage and timing of children's vaccination: an evaluation of the expanded programme on immunisation in the Gambia. PLoS One 2014;9:e107280.
17 World Bank. Guinea- Bissau: country profile. In: World development indicators database ed, 2017.
18 Institute for Health Metrics and Evaluation. Global health data exchange. global burden of disease. Institute for Health Metrics and Evaluation, ed, 2018. http:// ghdx. healthdata. org/ gbd- results- tool
19 Programa Nacional de Luta contra a Tuberculose. Relatório anualde tuberculose 2017. Ministério da Saúde Publica da Guiné-Bissau, 2018.
20 Abubakar I, Pimpin L, Ariti C, et al. Systematic review and meta- analysis of the current evidence on the duration of protection by Bacillus Calmette- Guérin vaccination against tuberculosis. Health Technol Assess 2013;17:1–372.
on March 26, 2022 by guest. P
rotected by copyright.http://gh.bm
j.com/
BM
J Glob H
ealth: first published as 10.1136/bmjgh-2021-006127 on 3 A
ugust 2021. Dow
nloaded from
12 Thysen SM, et al. BMJ Global Health 2021;6:e006127. doi:10.1136/bmjgh-2021-006127
BMJ Global Health
21 Starke JR. Transmission of Mycobacterium tuberculosis to and from children and adolescents. Seminars in Pediatric Infectious Diseases 2001;12:115–23.
22 Schaltz- Buchholzer F, Biering- Sørensen S, Lund N, et al. Early BCG vaccination, hospitalizations, and hospital deaths: analysis of a secondary outcome in 3 randomized trials from Guinea- Bissau. J Infect Dis 2019;219:624–32.
23 Thysen SM, Byberg S, Martins JSD, et al. Household costs of seeking BCG vaccination in rural Guinea- Bissau. Vaccine 2019;37:5505–8.
24 Enemark U, Byberg S, Thysen S, et al. Costs of hospital admissions and medical consultations in three African countries. (manuscript), 2021.
25 Knight GM, Griffiths UK, Sumner T, et al. Impact and cost- effectiveness of new tuberculosis vaccines in low- and middle- income countries. Proc Natl Acad Sci U S A 2014;111:15520–5.
26 Instituto Marqués de Valle Flör. PIMI – integrated programme to reduce maternal and child mortality – strengthening the availability and quality of maternal and child care in the health administration. Available: https://www. imvf. org/ en/ project/ pimi- integrated- programme- to- reduce- maternal- and- child- mortality/
27 Fisker AB, Thysen SM. Non- live pentavalent vaccines after live measles vaccine may increase mortality. Vaccine 2018;36:6039–42.
28 World Health Organisation. Making choices in health: who guide to cost- effectiveness analysis. Available: http:// apps. who. int/ iris/ bitstream/ handle/ 10665/ 42699/ 9241546018. pdf; jsessionid= 5C78 EAE8 2E49 0300 3536 ABD7 11D43BC6? sequence= 12003
29 Woods B, Revill P, Sculpher M, et al. Country- Level cost- effectiveness thresholds: initial estimates and the need for further research. Value Health 2016;19:929–35.
30 Harris RC, Dodd PJ, White RG. The potential impact of BCG vaccine supply shortages on global paediatric tuberculosis mortality. BMC Med 2016;14:138.
31 World Health Organisation. Tuberculosis data. World Health Organisation, ed, 2018. https://www. who. int/ tb/ data/ en/
32 Jenkins HE, Yuen CM, Rodriguez CA, et al. Mortality in children diagnosed with tuberculosis: a systematic review and meta- analysis. Lancet Infect Dis 2017;17:285–95.
33 Hanifi SMA, Das S, Rahman M. Bangladeshi neonates miss the potential benefits of early BCG vaccination. Int J Epidemiol 2018;47:348–9.
34 Aaby P, Jensen H, Gomes J, et al. The introduction of diphtheria- tetanus- pertussis vaccine and child mortality in rural Guinea- Bissau: an observational study. Int J Epidemiol 2004;33:374–80.
35 Adam R, Jensen H, Garly M- L, et al. Low birth weight infants and Calmette- Guérin Bacillus vaccination at birth. PIDJ2004;23:544–50.
36 Aaby P, Roth A, Ravn H, et al. Randomized trial of BCG vaccination at birth to low- birth- weight children: beneficial nonspecific effects in the neonatal period? J Infect Dis 2011;204:245–52.
37 Biering- Sørensen S, Aaby P, Napirna BM, et al. Small randomized trial among Low–birth- weight children receiving Bacillus Calmette- Guérin vaccination at first health center contact. PIDJ 2012;31:306–8.
38 Thysen SM, Clipet- Jensen C, Byberg S, et al. Effect of early BCG vaccination on neonatal mortality and morbidity: a natural experiment (manuscript)) 2021.
on March 26, 2022 by guest. P
rotected by copyright.http://gh.bm
j.com/
BM
J Glob H
ealth: first published as 10.1136/bmjgh-2021-006127 on 3 A
ugust 2021. Dow
nloaded from

1
Supplementary material
Disregarding the restrictive vial-opening policy for BCG vaccine in Guinea-Bissau: impact
and cost-effectiveness for tuberculosis mortality and all-cause mortality in children aged 0-4
years
Sanne M. Thysen, Ane B. Fisker, Stine Byberg, Peter Aaby, Partho Roy, Richard G. White, Ulla K. Griffiths, Rebecca C.
Harris
Appendix 1. Details on data sources ................................................................................................................................................... 2
1.1 Population estimates ................................................................................................................................................ 2 1.2 Details on data derived from the BHP’s urban and rural HDSS sites ...................................................................... 2
1.2.1 All-cause mortality and all-cause hospital admissions ..................................................................................... 2 1.2.2 BCG coverage .................................................................................................................................................. 2 1.2.3 Meta-analysis of BCG studies .......................................................................................................................... 3 1.2.4 Vaccination costs ............................................................................................................................................. 3 1.2.5 Household costs of seeking BCG ..................................................................................................................... 4 1.2.6 Costs of hospital admissions ............................................................................................................................ 4
1.3 Details on TB estimates ........................................................................................................................................... 4 1.3.1 Calculation of Case Fatality Ratio (CFR) ........................................................................................................ 4
2. Details on model and model equations ........................................................................................................................... 5 2.1 TB deaths model with equations .............................................................................................................................. 5 2.2 All-cause deaths model with equations .................................................................................................................... 6 2.3 All-cause hospital admission model with equations ................................................................................................ 8 2.4 Details on incremental costs and cost-effectiveness of disregarding the restrictive vial-opening policy with equations ...................................................................................................................................................................... 10 2.5 Details on TB model assuming all-or-nothing BCG vaccine efficacy ................................................................... 12
3. Supplementary Figures and tables ................................................................................................................................ 14 3.1 All-or-nothing and leaky vaccine efficacy ............................................................................................................. 14 3.2 BCG coverage estimates in urban Guinea-Bissau in the baseline scenario and the non-restrictive scenario ......... 15 3.3 BCG coverage estimates in rural Guinea-Bissau in the baseline scenario and the non-restrictive scenario .......... 16 3.4 Cost-effectiveness analyses of disregarding the restrictive BCG vial-opening policy by urban and rural population .................................................................................................................................................................... 17 3.5 Main results of disregarding the restrictive vial-opening policy with and without assumed correlation of mortality estimates and TB incidence estimates .......................................................................................................................... 19 3.6 Tables of incremental cost-effectiveness ratios (ICERs) in USD by varying vaccine wastage assumptions ......... 20
References ........................................................................................................................................................................ 22
BMJ Publishing Group Limited (BMJ) disclaims all liability and responsibility arising from any relianceSupplemental material placed on this supplemental material which has been supplied by the author(s) BMJ Global Health
doi: 10.1136/bmjgh-2021-006127:e006127. 6 2021;BMJ Global Health, et al. Thysen SM

2
1. Details on data sources
1.1 Population estimates
We used data from the WHO/UNICEF Joint Reporting Forms 2017 to obtain the annual birth cohort in Guinea-Bissau
[personal communication: Carlitos Bale, Director of the Expanded Programme on Immunization in Guinea-Bissau].
1.2 Details on data derived from the BHP’s urban and rural HDSS sites
1.2.1 All-cause mortality and all-cause hospital admissions
The daily individual risk of all-cause mortality was estimated based on data from 2012 to 2017. In survival models with
age as underlying time scale, we assessed the daily risk of dying between 0-4 years of age using Kaplan-Meier
estimates. Since mortality declines rapidly early in life, we estimated the risk of dying on a daily basis in the first week
(day 0 to day 7), and in intervals: day 8 to 28, day 29 to 365, and finally day 366 to 1826. Children entered the analysis
on January 1, 2012, registration in the HDSS, or birth, whichever came last. Children were followed until death, 5 years
of age, or December 31, 2017, whichever came first.
Likewise, we estimated the individual risk of all-cause hospital admission on data from 2012 to 2017. The risk of
hospital admission was estimated in survival models with age as underlying time scale in the following intervals: day 0
to 28, day 29 to 365, and day 366 to 1826. Children entered the analysis on January 1, 2012, registration in the HDSS,
or birth, whichever came last. Children were followed until death, migration, 5 years of age, or December 31, 2017,
whichever came first. After a hospital admission, children re-entered the analysis, and were able to contribute with more
than one event.
BHP covers a random sample of villages/towns in each region, but the regional sample is not weighted according to the
region’s population. BHP HDSS cover all regions, which comprise of one urban region and nine rural regions. All
estimates were computed by region. The regional estimates were weighted according to the sample representation of the
total population in the region according to data from the WHO/UNICEF Joint Reporting Forms.
1.2.2 BCG coverage
The coverage was estimated as daily BCG vaccination coverage until 365 days of life (Figure 1) using information
collected in the year following the coverage age, e.g. BCG coverage at day 1 was estimated using vaccination
information obtained between day 1 and day 366. Only those with assessed vaccination status in the relevant period
contributed to the BCG coverage estimate at a certain age. BCG is typically not provided after 1 year of age, and we
thus assumed that the BCG coverage was constant from 1 year of age. Using known prior contact with a health facility
BMJ Publishing Group Limited (BMJ) disclaims all liability and responsibility arising from any relianceSupplemental material placed on this supplemental material which has been supplied by the author(s) BMJ Global Health
doi: 10.1136/bmjgh-2021-006127:e006127. 6 2021;BMJ Global Health, et al. Thysen SM

3
(reported to be born at a health facility or registration of other vaccines according to the vaccination card); we
calculated the potential BCG coverage by age in the non-restrictive scenario, if all children were vaccinated at their first
registered contact with a health facility.
1.2.3 Meta-analysis of BCG studies
To assess the effect of BCG on all-cause mortality, we conducted a meta-analysis of all studies assessing the effect of
BCG versus no BCG in Guinea-Bissau. We identified six published studies1-6, and one manuscript under preparation7.
Of the six studies, three were randomised trials conducted in low-weight infants, where children were randomised to
BCG-at-birth or the usually delayed BCG. We used the effect of BCG in the neonatal period, since few children in the
control group had received BCG at this age6. BCG-at-birth was associated with 72% lower mortality in trial I (Hazard
Ratio (HR): 0.28 (0.06-1.37)5; 45% lower mortality in trial II (HR:0.55 (0.34-0.89)4, 11% of children in the control
group had received BCG at 28 days); and 30% lower mortality in trial III (HR: 0.70 (0.47-1.04)6, 17% of children in the
control group had received BCG at 28 days). The four other studies included in the meta-analysis were observational
studies, one of which was conducted in low-weight children2. All observational studies compared mortality of BCG-
vaccinated children with mortality of BCG-unvaccinated children1-3 7. In the meta-analysis, BCG was associated with
42% (19-58%) lower all-cause mortality (Figure 3).
1.2.4 Vaccination costs
We obtained costs of BCG vaccines, syringes, safety boxes and freight from the national department of the Expanded
Programme on Immunizations (EPI) [personal communication: Carlitos Bale, Director of the Expanded Programme on
Immunization in Guinea-Bissau] (Table 1). We assumed that there would be no other additional costs related with
disregarding the vial-opening policy. We thus assumed that the extra time spent by health staff to perform BCG
vaccination would correspond to the time used explaining the mothers to return for vaccination another day and
providing the vaccine to the majority of these children on a later occasion.
Currently a vial of BCG is opened if 10-12 children are present for vaccination. We therefore assumed 50% wastage of
BCG vaccine in the baseline scenario. When disregarding the restrictive vial-opening policy, a vial of BCG should be
opened even if only one child is present. We therefore assumed 95% wastage of BCG when disregarding the vial-
opening policy (non-restrictive scenario). In both scenarios, we assumed 5% wastage of syringes and safety boxes.
BMJ Publishing Group Limited (BMJ) disclaims all liability and responsibility arising from any relianceSupplemental material placed on this supplemental material which has been supplied by the author(s) BMJ Global Health
doi: 10.1136/bmjgh-2021-006127:e006127. 6 2021;BMJ Global Health, et al. Thysen SM

4
1.2.5 Household costs of seeking BCG
We have previously estimated the household costs of seeking BCG vaccination in rural Guinea-Bissau to 1.89 USD
(2016 value) per BCG vaccinated child8. Using the World Bank Consumer Price Index (CPI)9, we updated this value to
1.92 USD in 2017 values. We found that mothers on average went to the health facility 1.26 times before succeeding
getting their child vaccinated8. Children born in health facilities can be BCG-vaccinated without actively seeking BCG-
vaccination. We therefore estimated the proportion of children born in health facilities, and the proportion of these
vaccinated at birth according to BHP data, and applied these proportions to the WHO/UNICEF 2017-birth cohort
estimate (Table 3). For all children not vaccinated at birth, we assumed that their mother would seek vaccination 1.26
times in order to get the child vaccinated in the restrictive scenario. In the non-restrictive scenario, we assumed that
children born in health facilities would be vaccinated at birth and that all children would be vaccinated at the first
contact with a health facility. Thus, mothers would bring their child for BCG vaccination only once.
We did not have corresponding information for the urban population, and we therefore used the household costs of
seeking BCG vaccination obtained in the rural area for the whole population.
1.2.6 Costs of hospital admissions
Using data from the rural HDSS10 and from the National Hospital Simão Mendes11, we assessed the median number of
bed days for all-cause hospital admissions of children less than 5 years old. In both settings, the median number of bed
days per hospital admission was 5 days.
We have estimated the cost incurred by the health system per hospital bed day as 14.92 USD in a micro-costing study
from Guinea-Bissau in 201412, corresponding to a 2017-value of 15.58 USD using the World Bank CPI9. Hospital
admissions are free for all children below 5 years of age in Guinea-Bissau13. We therefore assumed that the costs
incurred by the household per hospital bed day only consisted of the value of the mothers’ time spent. We have
previously estimated the value of a mother’s time per day to 2.80 USD14 (2.98 2017-USD) based on a regression model
by Knight and colleagues estimating average monthly earnings in 201115.
1.3 Details on TB estimates
1.3.1 Calculation of Case Fatality Ratio (CFR)
We calculated the Case Fatality Ratio (CFR) for TB mortality by dividing the total number of TB deaths in children
aged 0 to 4 years with the total number of TB cases among children aged 0 to 4 years.
BMJ Publishing Group Limited (BMJ) disclaims all liability and responsibility arising from any relianceSupplemental material placed on this supplemental material which has been supplied by the author(s) BMJ Global Health
doi: 10.1136/bmjgh-2021-006127:e006127. 6 2021;BMJ Global Health, et al. Thysen SM
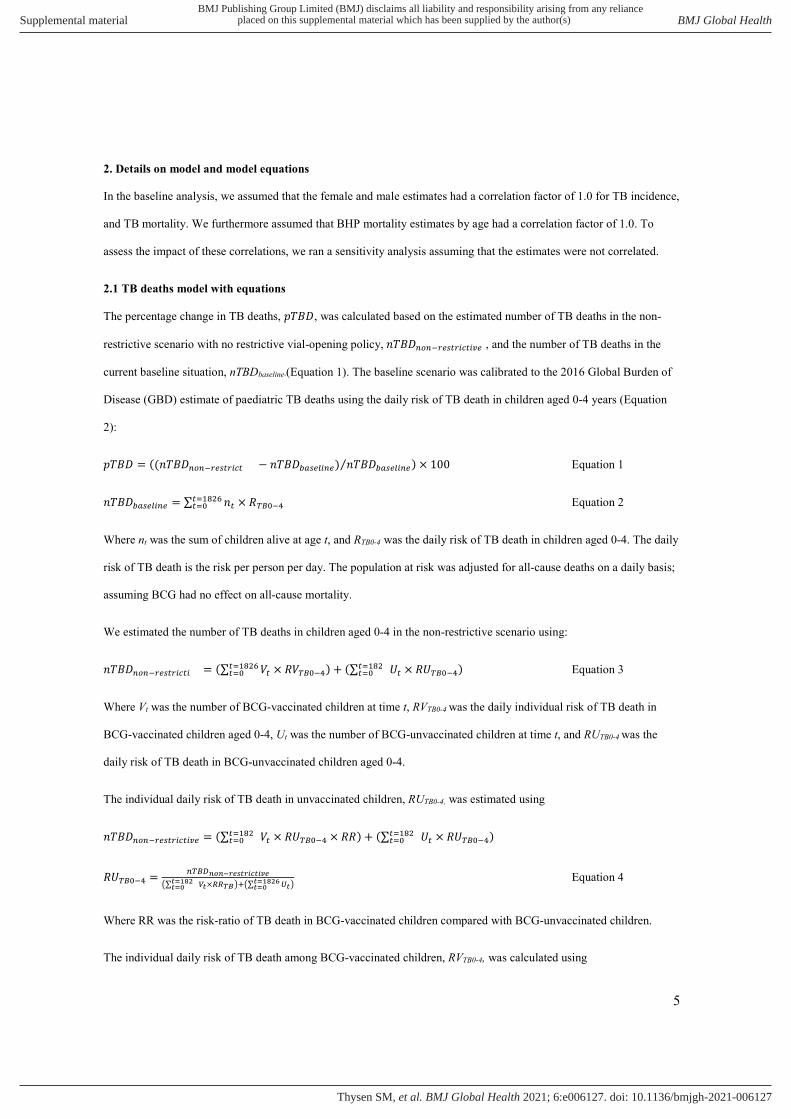
5
2. Details on model and model equations
In the baseline analysis, we assumed that the female and male estimates had a correlation factor of 1.0 for TB incidence,
and TB mortality. We furthermore assumed that BHP mortality estimates by age had a correlation factor of 1.0. To
assess the impact of these correlations, we ran a sensitivity analysis assuming that the estimates were not correlated.
2.1 TB deaths model with equations
The percentage change in TB deaths, 𝑝𝑇𝐵𝐷, was calculated based on the estimated number of TB deaths in the non-
restrictive scenario with no restrictive vial-opening policy, 𝑛𝑇𝐵𝐷 , and the number of TB deaths in the
current baseline situation, nTBDbaseline (Equation 1). The baseline scenario was calibrated to the 2016 Global Burden of
Disease (GBD) estimate of paediatric TB deaths using the daily risk of TB death in children aged 0-4 years (Equation
2):
𝑝𝑇𝐵𝐷 = ((𝑛𝑇𝐵𝐷 − 𝑛𝑇𝐵𝐷 ) 𝑛𝑇𝐵𝐷⁄ ) × 100 Equation 1
𝑛𝑇𝐵𝐷 = ∑ 𝑛 × 𝑅 Equation 2
Where nt was the sum of children alive at age t, and RTB0-4 was the daily risk of TB death in children aged 0-4. The daily
risk of TB death is the risk per person per day. The population at risk was adjusted for all-cause deaths on a daily basis;
assuming BCG had no effect on all-cause mortality.
We estimated the number of TB deaths in children aged 0-4 in the non-restrictive scenario using:
𝑛𝑇𝐵𝐷 = (∑ 𝑉 × 𝑅𝑉 ) + (∑ 𝑈 × 𝑅𝑈 ) Equation 3
Where Vt was the number of BCG-vaccinated children at time t, RVTB0-4 was the daily individual risk of TB death in
BCG-vaccinated children aged 0-4, Ut was the number of BCG-unvaccinated children at time t, and RUTB0-4 was the
daily risk of TB death in BCG-unvaccinated children aged 0-4.
The individual daily risk of TB death in unvaccinated children, RUTB0-4, was estimated using
𝑛𝑇𝐵𝐷 = (∑ 𝑉 × 𝑅𝑈 × 𝑅𝑅) + (∑ 𝑈 × 𝑅𝑈 )
𝑅𝑈 = ∑ × ∑ Equation 4
Where RR was the risk-ratio of TB death in BCG-vaccinated children compared with BCG-unvaccinated children.
The individual daily risk of TB death among BCG-vaccinated children, RVTB0-4, was calculated using
BMJ Publishing Group Limited (BMJ) disclaims all liability and responsibility arising from any relianceSupplemental material placed on this supplemental material which has been supplied by the author(s) BMJ Global Health
doi: 10.1136/bmjgh-2021-006127:e006127. 6 2021;BMJ Global Health, et al. Thysen SM

6
𝑅𝑉 = 𝑅𝑅 × 𝑅𝑈 Equation 5
We estimated the number of TB deaths at time t in the non-restrictive scenario for BCG-vaccinated (nTBDvtNR) and
BCG-unvaccinated children (nTBDutNR), respectively:
𝑛𝑇𝐵𝐷𝑣 = 𝑅𝑉 × 𝑉 Equation 6
𝑛𝑇𝐵𝐷𝑢 = 𝑅𝑈 × 𝑈 Equation 7
Where RVTB0-4 was the daily individual risk of TB death among BCG-vaccinated children aged 0-4 (calculated based on
the baseline scenario – Equation 5), VtNR was the number of BCG-vaccinated children at time t in the non-restrictive
scenario, RUTB0-4 was the daily individual risk of TB death among BCG-unvaccinated children aged 0-4 (calculated
based on the baseline scenario – Equation 4), and UtNR was the number of BCG-unvaccinated children at time t in the
non-restrictive scenario.
We then calculated the total number of TB deaths in children aged 0-4 in the non-restrictive scenario.
𝑛𝑇𝐵𝐷 = ∑ 𝑛𝑇𝐵𝐷𝑣 + ∑ 𝑛𝑇𝐵𝐷𝑢 Equation 8
Using the case-fatality ratio, 𝐶𝐹𝑅, we estimated the number of TB cases:
𝑛𝑇𝐵 = 𝑛𝑇𝐵𝐷 𝐶𝐹𝑅 Equation 9
2.2 All-cause deaths model with equations
The effect of disregarding the restrictive BCG vial-opening policy on all-cause deaths was estimated using the same
approach as for TB deaths, but with minor adjustments as we had more precise data for all-cause deaths allowing for
age-specific mortality estimates (Table 1).
The percentage change in all-cause deaths, 𝑝𝐴𝐶𝐷, was calculated based on number of all-cause deaths in the non-
restrictive scenario, 𝑛𝐴𝐶𝐷 , and the number of all-cause deaths in the baseline scenario, nACDbaseline. In
the baseline scenario, we used paediatric mortality estimates obtained from the Bandim Health Project 2012-2017
(Appendix 1.2.1), using the daily risk of all-cause death per person at age t.
𝑝𝐴𝐶𝐷 = ((𝑛𝐴𝐶𝐷 − 𝑛𝐴𝐶𝐷 ) 𝑛𝐴𝐶𝐷⁄ ) × 100 Equation 10
BMJ Publishing Group Limited (BMJ) disclaims all liability and responsibility arising from any relianceSupplemental material placed on this supplemental material which has been supplied by the author(s) BMJ Global Health
doi: 10.1136/bmjgh-2021-006127:e006127. 6 2021;BMJ Global Health, et al. Thysen SM
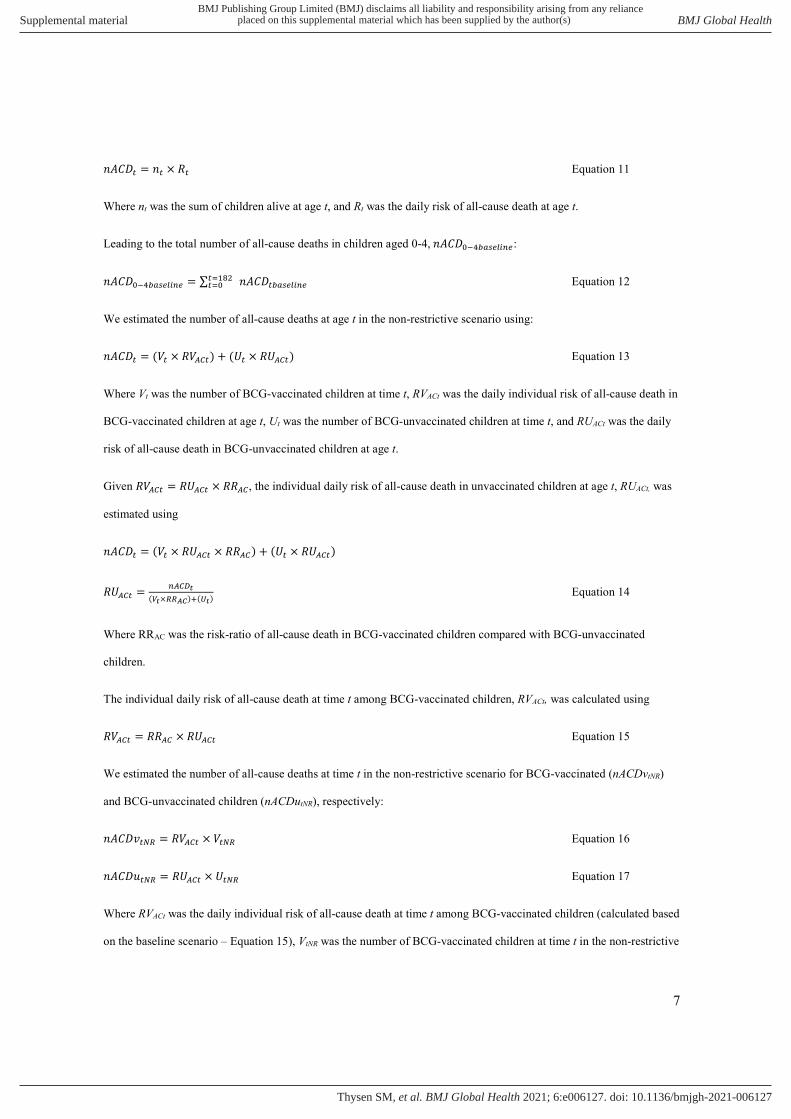
7
𝑛𝐴𝐶𝐷 = 𝑛 × 𝑅 Equation 11
Where nt was the sum of children alive at age t, and Rt was the daily risk of all-cause death at age t.
Leading to the total number of all-cause deaths in children aged 0-4, 𝑛𝐴𝐶𝐷 :
𝑛𝐴𝐶𝐷 = ∑ 𝑛𝐴𝐶𝐷 Equation 12
We estimated the number of all-cause deaths at age t in the non-restrictive scenario using:
𝑛𝐴𝐶𝐷 = (𝑉 × 𝑅𝑉 ) + (𝑈 × 𝑅𝑈 ) Equation 13
Where Vt was the number of BCG-vaccinated children at time t, RVACt was the daily individual risk of all-cause death in
BCG-vaccinated children at age t, Ut was the number of BCG-unvaccinated children at time t, and RUACt was the daily
risk of all-cause death in BCG-unvaccinated children at age t.
Given 𝑅𝑉 = 𝑅𝑈 × 𝑅𝑅 , the individual daily risk of all-cause death in unvaccinated children at age t, RUACt, was
estimated using
𝑛𝐴𝐶𝐷 = (𝑉 × 𝑅𝑈 × 𝑅𝑅 ) + (𝑈 × 𝑅𝑈 )
𝑅𝑈 = ( × ) ( ) Equation 14
Where RRAC was the risk-ratio of all-cause death in BCG-vaccinated children compared with BCG-unvaccinated
children.
The individual daily risk of all-cause death at time t among BCG-vaccinated children, RVACt, was calculated using
𝑅𝑉 = 𝑅𝑅 × 𝑅𝑈 Equation 15
We estimated the number of all-cause deaths at time t in the non-restrictive scenario for BCG-vaccinated (nACDvtNR)
and BCG-unvaccinated children (nACDutNR), respectively:
𝑛𝐴𝐶𝐷𝑣 = 𝑅𝑉 × 𝑉 Equation 16
𝑛𝐴𝐶𝐷𝑢 = 𝑅𝑈 × 𝑈 Equation 17
Where RVACt was the daily individual risk of all-cause death at time t among BCG-vaccinated children (calculated based
on the baseline scenario – Equation 15), VtNR was the number of BCG-vaccinated children at time t in the non-restrictive
BMJ Publishing Group Limited (BMJ) disclaims all liability and responsibility arising from any relianceSupplemental material placed on this supplemental material which has been supplied by the author(s) BMJ Global Health
doi: 10.1136/bmjgh-2021-006127:e006127. 6 2021;BMJ Global Health, et al. Thysen SM

8
scenario, RUACt was the daily individual risk of all-cause death at time t among BCG-unvaccinated children (calculated
based on the baseline scenario – Equation 14), and UtNR was the number of BCG-unvaccinated children at time t in the
non-restrictive scenario.
We then calculated the total number of all-cause deaths in children aged 0-4 in the non-restrictive scenario.
𝑛𝐴𝐶𝐷 = ∑ 𝑛𝐴𝐶𝐷𝑣 + ∑ 𝑛𝐴𝐶𝐷𝑢 Equation 18
2.3 All-cause hospital admission model with equations
The daily age-specific risk of all-cause hospital admission (risk of all-cause hospital admission per person per day) was
estimated using the BHP age-stratified hospital admission data (Methods explained in Appendix 1.2.1). Based on the
daily risk of all-cause hospital admission and the meta-estimate of the effect of BCG on all-cause hospital admission
(Appendix 1.2.1), we calculated the daily risk of all-cause hospital admission in BCG-vaccinated and BCG-
unvaccinated children, respectively.
The daily risk of all-cause hospital admission was applied to the WHO/UNICEF birth cohort estimate of 2017 [personal
communication: Carlitos Bale, Director of the Vaccination Programme in Guinea-Bissau]. We calculated the percentage
change in all-cause hospital admission, 𝑝𝐴𝐶𝐻, based on number of all-cause hospital admissions in the non-restrictive
scenario, 𝑛𝐴𝐶𝐻 , and the number of all-cause hospital admissions in the baseline scenario, nACHbaseline.
We used paediatric hospital admissions estimates obtained from the BHP surveillance data in 2012-2017 (Appendix
1.2.1) to obtain the daily risk of all-cause hospital admission at age t.
𝑝𝐴𝐶𝐻 = ((𝑛𝐴𝐶𝐻 − 𝑛𝐴𝐶𝐻 ) 𝑛𝐴𝐶𝐻⁄ ) × 100 Equation 19
𝑛𝐴𝐶𝐻 = 𝑛 × 𝑅 Equation 20
Where nt was the sum of children alive at age t, and RACHt was the daily risk of all-cause hospital admission at age t.
Leading to the total number of all-cause hospital admissions in children aged 0-4, 𝑛𝐴𝐶𝐻 :
𝑛𝐴𝐶𝐻 = ∑ 𝑛𝐴𝐶𝐻 Equation 21
We estimated the number of all-cause hospital admissions at age t in the non-restrictive scenario using:
𝑛𝐴𝐶𝐻 = 𝑉 × 𝑅𝑉 + 𝑈 × 𝑅𝑈 Equation 22
BMJ Publishing Group Limited (BMJ) disclaims all liability and responsibility arising from any relianceSupplemental material placed on this supplemental material which has been supplied by the author(s) BMJ Global Health
doi: 10.1136/bmjgh-2021-006127:e006127. 6 2021;BMJ Global Health, et al. Thysen SM
9
Where Vt was the number of BCG-vaccinated children at time t, RVACHt was the daily individual risk of all-cause
hospital admission in BCG-vaccinated children at age t, Ut was the number of BCG-unvaccinated children at time t, and
RUACHt was the daily risk of all-cause hospital admission in BCG-unvaccinated children at age t.
The individual daily risk of all-cause hospital admission in unvaccinated children at age t, RUACHt, was estimated using
𝑛𝐴𝐶𝐻 = (𝑉 × 𝑅𝑈 × 𝑅𝑅 ) + (𝑈 × 𝑅𝑈 )
𝑅𝑈 = ( × ) ( ) Equation 23
Where RRACH was the risk-ratio of all-cause hospital admission in BCG-vaccinated children compared with BCG-
unvaccinated children.
The individual daily risk of all-cause hospital admission at time t among BCG-vaccinated children, RVACHt, was
calculated using
𝑅𝑉 = 𝑅𝑅 × 𝑅𝑈 Equation 24
We estimated the number of all-cause hospital admissions at time t in the non-restrictive scenario for BCG-vaccinated
(nACHvtNR) and BCG-unvaccinated children (nACHutNR), respectively:
𝑛𝐴𝐶𝐻𝑣 = 𝑅𝑉 × 𝑉 Equation 25
𝑛𝐴𝐶𝐻𝑢 = 𝑅𝑈 × 𝑈 Equation 26
Where RVACHt was the daily individual risk of all-cause hospital admission at time t among BCG-vaccinated children
(calculated based on the baseline scenario – Equation 24), VtNR was the number of BCG-vaccinated children at time t in
the non-restrictive scenario, RUACHt was the daily individual risk of all-cause hospital admission at time t among BCG-
unvaccinated children (calculated based on the baseline scenario – Equation 23), and UtNR was the number of BCG-
unvaccinated children at time t in the non-restrictive scenario.
We then calculated the total number of all-cause hospital admissions in children aged 0-4 in the non-restrictive scenario.
𝑛𝐴𝐶𝐻 = ∑ 𝑛𝐴𝐶𝐻𝑣 + ∑ 𝑛𝐴𝐶𝐻𝑢 Equation 27
BMJ Publishing Group Limited (BMJ) disclaims all liability and responsibility arising from any relianceSupplemental material placed on this supplemental material which has been supplied by the author(s) BMJ Global Health
doi: 10.1136/bmjgh-2021-006127:e006127. 6 2021;BMJ Global Health, et al. Thysen SM

10
2.4 Details on incremental costs and cost-effectiveness of disregarding the restrictive vial-opening policy with
equations
We estimated the vaccine costs in each scenario based on the number of children vaccinated by 12 months of age, nBCG12,
the vaccine wastage factor, WF, and the price per dose including freight costs, priceBCG:
𝑣𝑎𝑐𝑐𝑖𝑛𝑒 = 𝑛𝐵𝐶𝐺 × 𝑊𝐹 × 𝑝𝑟𝑖𝑐𝑒 Equation 28
The wastage factor was based on the vaccine wastage assumed in each scenario. In the baseline scenario, we assumed
50% vaccine wastage corresponding to a wastage factor of 2. In the non-restrictive scenario, we assumed 95% vaccine
wastage corresponding to a wastage factor of 20. In sensitivity analyses, we adjusted the wastage factors in the baseline
scenario to 35%, 40%, 45%, 55% and 60% respectively, and wastage factors in the non-restrictive scenario to 70%, 75%,
80%, 85% and 90%, respectively.
We calculated the injection supply costs as a summation of the costs of application syringe costs, mixing syringe costs
and safety box cost:
𝑖𝑛𝑗𝑒𝑐𝑡𝑖𝑜𝑛 𝑠𝑢𝑝𝑝𝑙𝑦 = 𝑎𝑝𝑝𝑙𝑖𝑐𝑎𝑡𝑖𝑜𝑛 𝑠𝑦𝑟𝑖𝑛𝑔𝑒 + 𝑚𝑖𝑥𝑖𝑛𝑔 𝑠𝑦𝑟𝑖𝑛𝑔𝑒 + 𝑠𝑎𝑓𝑒𝑡𝑦 𝑏𝑜𝑥
Equation 29
For each item, we calculated the costs by multiplying the number of items used by the item unit price including freight:
𝑐𝑜𝑠𝑡 = 𝑛 × 𝑝𝑟𝑖𝑐𝑒 Equation 30
Number of items used were calculated by equations 31-33 assuming 5% wastage of each item, resulting in a wastage
factor of 1.05:
𝑛 . = 𝑛𝐵𝐶𝐺 × 𝑊𝐹 Equation 31
𝑛 . = × × 𝑊𝐹 . Equation 32
𝑛 = . . × 𝑊𝐹 Equation 33
Where vial size was assumed to be 20 dose vials and safety box capacity was assumed to be 100 syringes as used in
previous analyses14.
BMJ Publishing Group Limited (BMJ) disclaims all liability and responsibility arising from any relianceSupplemental material placed on this supplemental material which has been supplied by the author(s) BMJ Global Health
doi: 10.1136/bmjgh-2021-006127:e006127. 6 2021;BMJ Global Health, et al. Thysen SM
11
We calculated the incremental costs of averted/additional TB hospital admissions and all-cause hospital admissions:
𝑐𝑜𝑠𝑡𝑠 = 𝑛 × 𝑛 × (𝑐𝑜𝑠𝑡 + 𝑐𝑜𝑠𝑡 ) Equation 34
Where nhosp was the number of additional admissions (if negative, number of averted admissions) in the non-restrictive
scenario, nbedday was 60 days for TB hospital admissions and 5 days for all-cause hospital admissions, costbedday was the
cost incurred by the health system per bed day and costmother was the cost incurred by the household per bed day.
We calculated the household costs of seeking BCG vaccination. The number of children vaccinated at birth in the baseline
scenario was estimated based on the proportion of children born in health facilities multiplied by the proportion of these
vaccinated at birth. In the non-restrictive scenario, it was assumed that all children born in health facilities were vaccinated
at birth.
𝑛 = 𝑛 − 𝑛 × 𝑝 × 𝑝 Equation 35
Where ntotal was the birth cohort of 2017, pHF was the proportion born in health facilities and pBCG was the proportion of
children vaccinated at birth in the health facility, and nnoBCG was the number of children not BCG vaccinated at birth, and
for whom the mother should seek vaccination. As we have previously found that mothers on average bring their child for
vaccination 1.26 times before obtaining BCG vaccination at cost of USD 1.92 per time, we used this information to
calculate the household costs of seeking BCG vaccination in each scenario:
𝐻𝐻𝑐𝑜𝑠𝑡 = 𝑛 × 1.26 × 1.92 𝑈𝑆𝐷 Equation 36
The incremental household costs of seeking BCG when disregarding the restrictive vial-opening policy was obtained by
subtracting the household costs in the restrictive scenario from the household costs in the non-restrictive scenario.
We summed the incremental vaccination costs, the incremental hospital admission costs and incremental household costs
of seeking BCG vaccination, and obtained the total incremental costs of disregarding the restrictive vial-opening policy.
To obtain an estimate of the cost-effectiveness of disregarding the restrictive vial-opening policy, we initially calculated
life years gained (LYG) from disregarding the restrictive vial-opening policy accounting for TB-specific and all-cause
effects of BCG vaccine.
BMJ Publishing Group Limited (BMJ) disclaims all liability and responsibility arising from any relianceSupplemental material placed on this supplemental material which has been supplied by the author(s) BMJ Global Health
doi: 10.1136/bmjgh-2021-006127:e006127. 6 2021;BMJ Global Health, et al. Thysen SM

12
Using the estimated number of TB deaths, nTBD, and all-cause deaths, nACD, averted, and the World Bank estimate of
a life expectancy, LE, of 57 years at birth in Guinea-Bissau in 201716, we calculated the number of LYG per year
accounting for TB-specific, LYGyTB, and all-cause effects, LYGyAC, respectively:
𝐿𝑌𝐺 = 𝑛𝑇𝐵𝐷 × (𝐿𝐸 − 𝑦) Equation 37
𝐿𝑌𝐺 = 𝑛𝐴𝐶𝐷 × (𝐿𝐸 − 𝑦) Equation 38
We calculated the number of LYG per year for the first 5 years of age, where y was the age, by multiplying the number
of TB deaths/all-cause deaths averted per year of age by the remaining life expectancy.
In the base case analysis, we discounted x (future LYG, future costs, and future deaths) by 3% per year as recommended
by WHO17:
𝑥 = ( . ) Equation 39
The incremental cost-effectiveness ratio (ICER) of disregarding the restrictive vial opening policy was calculated
accounting for TB-specific and all-cause effects, respectively, using the same approach, described by equation 40-43:
𝐼𝐶𝐸𝑅 = Equation 40
𝐼𝐶𝐸𝑅 = Equation 41
𝐼𝐶𝐸𝑅 = Equation 42
𝐼𝐶𝐸𝑅 = Equation 43
2.5 Details on TB model assuming all-or-nothing BCG vaccine efficacy
As a sensitivity analyses, we changed the model structure from assuming leaky BCG vaccine efficacy to a model
structure assuming all-or-nothing BCG vaccine efficacy, as in the original model developed by Roy and colleagues18.
We calculated the absolute and percentage change in number of TB deaths per birth cohort during the first 5 years of
life in the non-restrictive scenario compared with the baseline scenario. The percentage change in TB deaths, 𝑝𝑇𝐵𝐷 ,
was calculated based on number of TB deaths in the non-restrictive scenario, 𝑛𝑇𝐵𝐷 , and the number of
BMJ Publishing Group Limited (BMJ) disclaims all liability and responsibility arising from any relianceSupplemental material placed on this supplemental material which has been supplied by the author(s) BMJ Global Health
doi: 10.1136/bmjgh-2021-006127:e006127. 6 2021;BMJ Global Health, et al. Thysen SM
13
TB deaths in the baseline scenario, nTBDANbaseline. As in the main analysis, the baseline scenario was calibrated to the
2016 Global Burden of Disease estimates19 of paediatric TB deaths using the daily risk of TB death in unprotected
children aged 0-4.
𝑝𝑇𝐵𝐷 = ((𝑛𝑇𝐵𝐷 − 𝑛𝑇𝐵𝐷 ) 𝑛𝑇𝐵𝐷⁄ ) × 100 Equation 44
The number of paediatric TB deaths per birth cohort in the first 5 years of life (nTBDAN) was estimated to be:
𝑛𝑇𝐵𝐷 = ∑ 𝑛𝑈𝑃 × 𝑅 Equation 45
Where t was the age in days; nUPt was the number of unprotected children at age t; R0-4 was the daily individual risk of
TB death in unprotected children aged 0-4 years.
The number of unprotected children at age t (nUPt) was estimated to be the number of unvaccinated children at age t
plus the number of vaccinated children with insufficient immune response to prevent TB death at age t:
𝑛𝑈𝑃 = 𝑈 + 𝑉 × (1 − 𝑉𝐸) Equation 46
Where Ut was the number of unvaccinated children at age t, Vt was the number of vaccinated children at age t, and VE
was the vaccine efficacy (proportion), and:
𝑈 = (𝐵𝐶 − 𝐷 ) × (1 − 𝐶𝑜𝑣 ) Equation 47
𝑉 = (𝐵𝐶 − 𝐷 ) × 𝐶𝑜𝑣 Equation 48
𝑉𝐸 = 1 − 𝑅𝑅 Equation 49
Where, BC was the annual number of live births in Guinea-Bissau in 2017, Dt was the number of all-cause deaths at age
t, Covt was the proportion of BCG-vaccinated children at t, and RRTB was the rate ratio of TB deaths in BCG-vaccinated
children compared with BCG-unvaccinated children.
The daily individual risk of TB death in unprotected children aged 0-4 years (R0-4) was:
𝑅 = 𝑀𝑜𝑟𝑡 ∑ 𝑛⁄ Equation 50
Where Mort0-4 was the number of TB deaths in each age group, and ∑ 𝑛 was the sum of unprotected person days.
BMJ Publishing Group Limited (BMJ) disclaims all liability and responsibility arising from any relianceSupplemental material placed on this supplemental material which has been supplied by the author(s) BMJ Global Health
doi: 10.1136/bmjgh-2021-006127:e006127. 6 2021;BMJ Global Health, et al. Thysen SM

14
3. Supplementary Figures and tables 3.1 All-or-nothing and leaky vaccine efficacy
BMJ Publishing Group Limited (BMJ) disclaims all liability and responsibility arising from any relianceSupplemental material placed on this supplemental material which has been supplied by the author(s) BMJ Global Health
doi: 10.1136/bmjgh-2021-006127:e006127. 6 2021;BMJ Global Health, et al. Thysen SM

15
3.2 BCG coverage estimates in urban Guinea-Bissau in the baseline scenario and the non-restrictive scenario
BMJ Publishing Group Limited (BMJ) disclaims all liability and responsibility arising from any relianceSupplemental material placed on this supplemental material which has been supplied by the author(s) BMJ Global Health
doi: 10.1136/bmjgh-2021-006127:e006127. 6 2021;BMJ Global Health, et al. Thysen SM
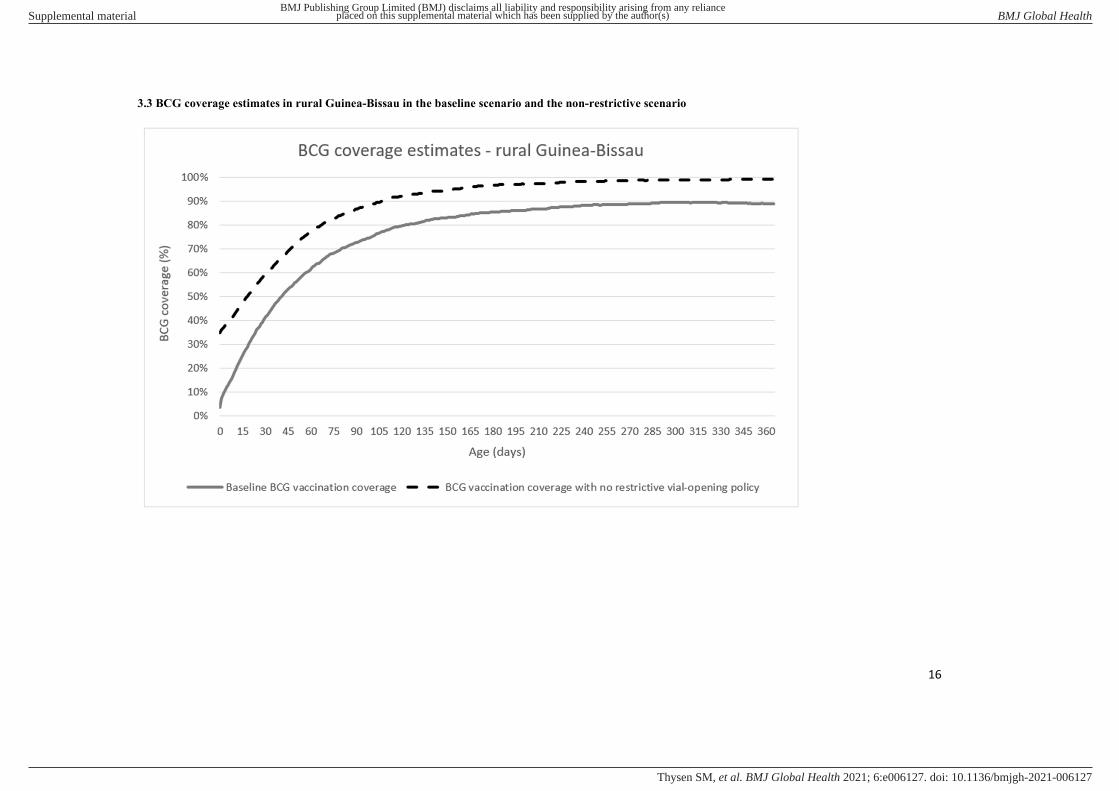
16
3.3 BCG coverage estimates in rural Guinea-Bissau in the baseline scenario and the non-restrictive scenario
BMJ Publishing Group Limited (BMJ) disclaims all liability and responsibility arising from any relianceSupplemental material placed on this supplemental material which has been supplied by the author(s) BMJ Global Health
doi: 10.1136/bmjgh-2021-006127:e006127. 6 2021;BMJ Global Health, et al. Thysen SM

17
3.4 Cost-effectiveness analyses of disregarding the restrictive BCG vial-opening policy by urban and rural population
URBAN POPULATION RURAL POPULATION
Restrictive (baseline) scenario Non-restrictive scenario Restrictive (baseline) scenario Non-restrictive scenario
Birth population of 2017 19,018 19,018 50,194 50,194
Total number of children born in health facilities 12,791 12,791 20,563 20,563
Number of children BCG-vaccinated at birth 7,987 12,791 5,119 20,563
Number of children not BCG-vaccinated at birth 11,031 6,227 45,075 29,631
BCG coverage at 12 months of age 98 % 99 % 89 % 99 %
Total household costs of seeking BCG vaccination* 26,626 USD 11,929 USD 108,803 USD 56,765 USD
Total BCG vaccine costs* 7,621 USD 77,008 USD 18,257 USD 203,330 USD
Total Injection supply costs 1,136 USD 1,828 USD 2,722 USD 4,826 USD
TB-specific effects only
Median (95% Uncertainty
Range)
Median (95% Uncertainty
Range)
Median (95% Uncertainty
Range)
Median (95% Uncertainty
Range)
Total number of paediatric TB deaths 8 (3 to 22) 8 (3 to 21) 26 (10 to 69) 21 (8 to 57)
Total LYG 11 (0 to 47) 225 (9 to 943)
Total LYG discounted 5 (0 to 23) 109 (4 to 458)
Total number of paediatric TB hospital admissions 11 11 36 30
Total costs of TB hospital admissions 12,638 USD 12,314 USD 39,740 USD 33,218 USD
Total costs of TB hospital admissions discounted 11,589 USD 11,288 USD 36,506 USD 30,512 USD
Incremental costs of disregarding the restrictive vial-opening policy
(including vaccination costs, household costs and costs averted by TB
hospital admissions) 55,058 USD 128,618 USD
Incremental costs of disregarding the restrictive vial-opening policy -
discounted 55,081 USD 129,147 USD
BMJ Publishing Group Limited (BMJ) disclaims all liability and responsibility arising from any relianceSupplemental material placed on this supplemental material which has been supplied by the author(s) BMJ Global Health
doi: 10.1136/bmjgh-2021-006127:e006127. 6 2021;BMJ Global Health, et al. Thysen SM

18
ICER per LYG (USD) 2,473 (423 to 23,733) 252 (36 to 2,649)
ICER per LYG discounted (USD) 5,115 (876 to 49,049) 524 (77 to 5,455)
ICER per TB death averted (USD) 137,307 (23,493 to 1,317,677) 13,898 (2,002 to 146,002)
ICER per TB death averted discounted (USD) 147,732 (25,315 to 1,416,715) 15,272 (2,245 to 159,037)
All-cause effects
Total number of all-cause deaths 1,071 (897 to 1,302) 961 (795 to 1,180) 3,787 (3,303 to 4,386) 3,467 (2,992 to 4,048)
Total LYG by averted all-cause deaths 6,345 (2,704 to 9,810) 17,922 (7,005 to 29,622)
Total LYG by averted all-cause deaths - discounted 3,023 (1,288 to 4,674) 8,650 (3,360 to 14,230)
Total number of all-cause hospital admissions 1,806 1,816 4,004 4,012
Total costs of all-cause hospital admissions 167,510 USD 168,459 USD 371,471 USD 372,135 USD
Total costs of all-cause hospital admissions discounted 155,588 USD 156,468 USD 342,545 USD 343,138 USD
Incremental costs of disregarding the restrictive vial-opening policy
(including vaccination costs, household costs and costs averted by hospital
admissions) 56,331 USD 135,805 USD
Incremental costs of disregarding the restrictive vial-opening policy -
discounted 56,262 USD 135,734 USD
ICER per LYG (USD) 5 (3 to 11) 4 (2 to 10)
ICER per LYG discounted (USD) 10 (6 to 23) 8 (4 to 20)
ICER per all-cause death averted (USD) 273 (168 to 635) 210 (113 to 542)
ICER per all-cause death averted discounted (USD) 280 (173 to 653) 221 (120 to 567)
USD: US Dollar 2017 value, LYG: Life year gained, ICER: Incremental cost-effectiveness ratio
* The urban population constitutes 27% of the birth population, and the rural population constitutes 73% of the birth population.
BMJ Publishing Group Limited (BMJ) disclaims all liability and responsibility arising from any relianceSupplemental material placed on this supplemental material which has been supplied by the author(s) BMJ Global Health
doi: 10.1136/bmjgh-2021-006127:e006127. 6 2021;BMJ Global Health, et al. Thysen SM
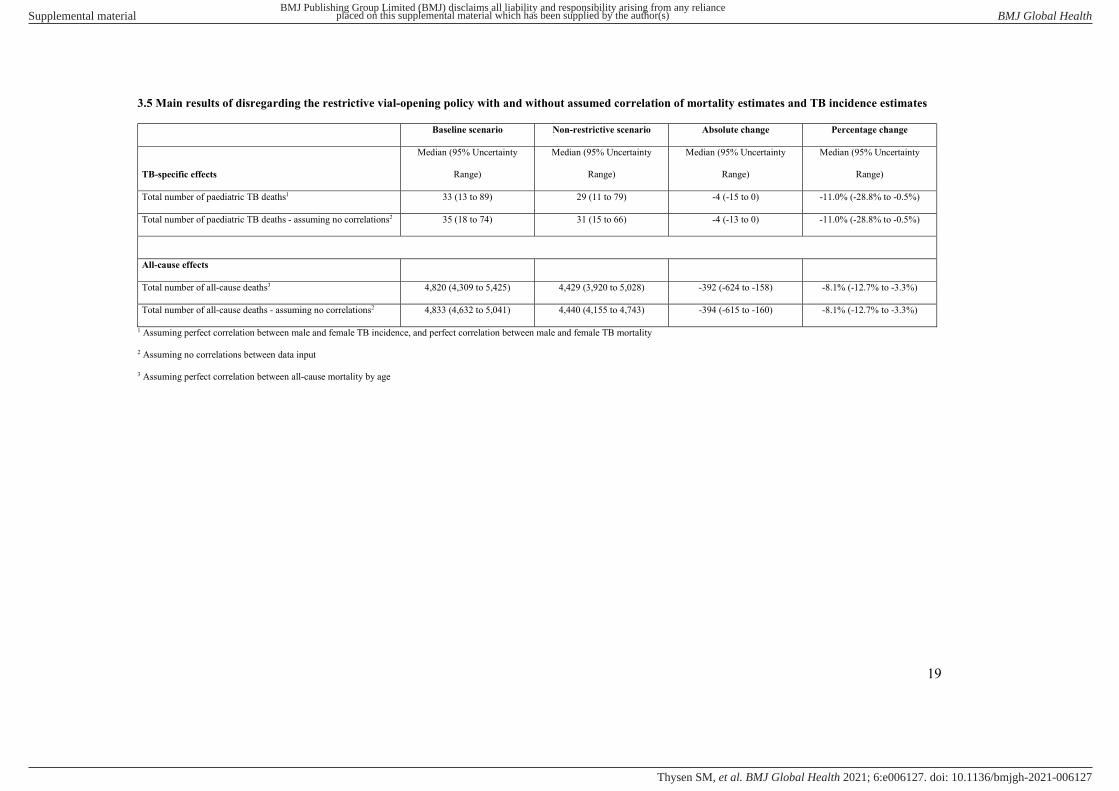
19
3.5 Main results of disregarding the restrictive vial-opening policy with and without assumed correlation of mortality estimates and TB incidence estimates
Baseline scenario Non-restrictive scenario Absolute change Percentage change
TB-specific effects
Median (95% Uncertainty
Range)
Median (95% Uncertainty
Range)
Median (95% Uncertainty
Range)
Median (95% Uncertainty
Range)
Total number of paediatric TB deaths1 33 (13 to 89) 29 (11 to 79) -4 (-15 to 0) -11.0% (-28.8% to -0.5%)
Total number of paediatric TB deaths - assuming no correlations2 35 (18 to 74) 31 (15 to 66) -4 (-13 to 0) -11.0% (-28.8% to -0.5%)
All-cause effects
Total number of all-cause deaths3 4,820 (4,309 to 5,425) 4,429 (3,920 to 5,028) -392 (-624 to -158) -8.1% (-12.7% to -3.3%)
Total number of all-cause deaths - assuming no correlations2 4,833 (4,632 to 5,041) 4,440 (4,155 to 4,743) -394 (-615 to -160) -8.1% (-12.7% to -3.3%)
1 Assuming perfect correlation between male and female TB incidence, and perfect correlation between male and female TB mortality
2 Assuming no correlations between data input
3 Assuming perfect correlation between all-cause mortality by age
BMJ Publishing Group Limited (BMJ) disclaims all liability and responsibility arising from any relianceSupplemental material placed on this supplemental material which has been supplied by the author(s) BMJ Global Health
doi: 10.1136/bmjgh-2021-006127:e006127. 6 2021;BMJ Global Health, et al. Thysen SM

20
3.6 Tables of base case incremental cost-effectiveness ratios (ICERs) in USD by varying vaccine wastage
assumptions
Table 3.6.1 ICERs in USD per discounted LYG by averted TB deaths
70% VW in
non-restrictive
scenario
75% VW in
non-restrictive
scenario
80% VW in
non-restrictive
scenario
85% VW in
non-restrictive
scenario
90% VW in
non-restrictive
scenario
95% VW in
non-restrictive
scenario
35% VW in restrictive scenario -448 -352 -209 30 507 1,938
40% VW in restrictive scenario -465 -369 -226 12 489 1,920
45% VW in restrictive scenario -485 -390 -247 -8 469 1,901
50% VW in restrictive scenario -509 -414 -271 -32 445 1,876
55% VW in restrictive scenario -539 -444 -301 -62 415 1,846
60% VW in restrictive scenario -577 -481 -338 -99 378 1,809
VW: Vaccine wastage assumption. Assumptions used for the main analysis are marked in grey colour.
Table 3.6.2 ICERs in USD per discounted TB death averted
70% VW in
non-restrictive
scenario
75% VW in
non-restrictive
scenario
80% VW in
non-restrictive
scenario
85% VW in
non-restrictive
scenario
90% VW in
non-restrictive
scenario
95% VW in
non-restrictive
scenario
35% VW in restrictive scenario -13,038 -10,259 -6,089 860 14,758 56,453
40% VW in restrictive scenario -13,539 -10,760 -6,590 359 14,257 55,952
45% VW in restrictive scenario -14,132 -11,352 -7,182 -233 13,665 55,359
50% VW in restrictive scenario -14,842 -12,062 -7,893 -944 12,954 54,649
55% VW in restrictive scenario -15,710 -12,931 -8,761 -1,812 12,086 53,781
60% VW in restrictive scenario -16,796 -14,016 -9,847 -2,898 11,000 52,695
VW: Vaccine wastage assumption. Assumptions used for the main analysis are marked in grey colour.
Table 3.6.3 ICERs in USD per discounted LYG by averted all-cause deaths
70% VW in
non-restrictive
scenario
75% VW in
non-restrictive
scenario
80% VW in
non-restrictive
scenario
85% VW in
non-restrictive
scenario
90% VW in
non-restrictive
scenario
95% VW in
non-restrictive
scenario
35% VW in restrictive scenario -4 -3 -1 1 5 19
40% VW in restrictive scenario -4 -3 -1 1 5 18
45% VW in restrictive scenario -4 -3 -2 1 5 18
50% VW in restrictive scenario -4 -3 -2 0 5 18
55% VW in restrictive scenario -4 -3 -2 0 4 18
BMJ Publishing Group Limited (BMJ) disclaims all liability and responsibility arising from any relianceSupplemental material placed on this supplemental material which has been supplied by the author(s) BMJ Global Health
doi: 10.1136/bmjgh-2021-006127:e006127. 6 2021;BMJ Global Health, et al. Thysen SM
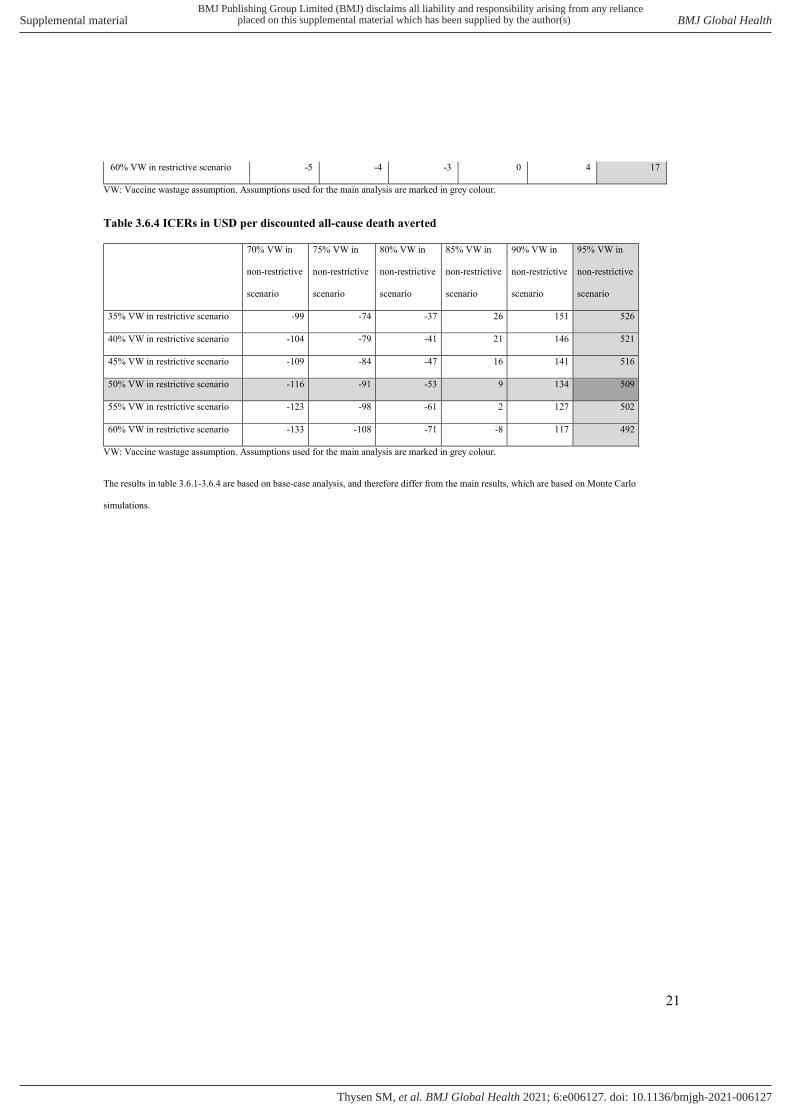
21
60% VW in restrictive scenario -5 -4 -3 0 4 17
VW: Vaccine wastage assumption. Assumptions used for the main analysis are marked in grey colour.
Table 3.6.4 ICERs in USD per discounted all-cause death averted
70% VW in
non-restrictive
scenario
75% VW in
non-restrictive
scenario
80% VW in
non-restrictive
scenario
85% VW in
non-restrictive
scenario
90% VW in
non-restrictive
scenario
95% VW in
non-restrictive
scenario
35% VW in restrictive scenario -99 -74 -37 26 151 526
40% VW in restrictive scenario -104 -79 -41 21 146 521
45% VW in restrictive scenario -109 -84 -47 16 141 516
50% VW in restrictive scenario -116 -91 -53 9 134 509
55% VW in restrictive scenario -123 -98 -61 2 127 502
60% VW in restrictive scenario -133 -108 -71 -8 117 492
VW: Vaccine wastage assumption. Assumptions used for the main analysis are marked in grey colour.
The results in table 3.6.1-3.6.4 are based on base-case analysis, and therefore differ from the main results, which are based on Monte Carlo
simulations.
BMJ Publishing Group Limited (BMJ) disclaims all liability and responsibility arising from any relianceSupplemental material placed on this supplemental material which has been supplied by the author(s) BMJ Global Health
doi: 10.1136/bmjgh-2021-006127:e006127. 6 2021;BMJ Global Health, et al. Thysen SM
22
References
1. Aaby P, Jensen H, Gomes J, et al. The introduction of diphtheria-tetanus-pertussis vaccine and child mortality in rural Guinea-Bissau: an observational study. Int J Epidemiol 2004;33(2):374-80. doi: 10.1093/ije/dyh005 [published Online First: 2004/04/15]
2. Roth A, Jensen H, Garly M-L, et al. Low Birth Weight Infants and Calmette-Guérin Bacillus Vaccination at Birth. Pediatr Infect Dis J 2004;23(6):544-50. doi: 10.1097/01.inf.0000129693.81082.a0
3. Kristensen I, Aaby P, Jensen H. Routine vaccinations and child survival: follow up study in Guinea-Bissau, West Africa. BMJ 2000;321(7274):1435-8. [published Online First: 2000/12/09]
4. Aaby P, Roth A, Ravn H, et al. Randomized trial of BCG vaccination at birth to low-birth-weight children: beneficial nonspecific effects in the neonatal period? J Infect Dis 2011;204(2):245-52. doi: 10.1093/infdis/jir240 [published Online First: 2011/06/16]
5. Biering-Sorensen S, Aaby P, Napirna BM, et al. Small Randomized Trial Among Low-birth-weight Children Receiving Bacillus Calmette-Gueerin Vaccination at First Health Center Contact. Pediatr Infect Dis J 2012;31(3):306-8. doi: 10.1097/INF.0b013e3182458289 [published Online First: 2011/12/23]
6. Biering-Sørensen S, Aaby P, Lund N, et al. Early BCG-Denmark and Neonatal Mortality Among Infants Weighing <2500 g: A Randomized Controlled Trial. Clinical Infectious Diseases 2017;65(7):1183-90. doi: 10.1093/cid/cix525
7. Thysen SM, Clipet-Jensen C, Byberg S, et al. Effect of early BCG vaccination on neonatal mortality and morbidity: a natural experiment. (manuscript) 2019
8. Thysen SM, Byberg S, Martins JSD, et al. Household costs of seeking BCG vaccination in rural Guinea-Bissau. Vaccine 2019;37(37):5505-08. doi: 10.1016/j.vaccine.2019.08.004 [published Online First: 2019/08/14]
9. World Bank. World Bank Data: Consumer Price Index (2010=100). In: World Bank, ed. https://data.worldbank.org/indicator/FP.CPI.TOTL, 2018.
10. Thysen SM, Fernandes M, Benn CS, et al. Cohort profile : Bandim Health Project's (BHP) rural Health and Demographic Surveillance System (HDSS)-a nationally representative HDSS in Guinea-Bissau. BMJ open 2019;9(6):e028775. doi: 10.1136/bmjopen-2018-028775 [published Online First: 2019/06/14]
11. Andersen A, Bjerregaard-Andersen M, Rodrigues A, et al. Sex-differential effects of diphtheria-tetanus-pertussis vaccine for the outcome of paediatric admissions? A hospital based observational study from Guinea-Bissau. Vaccine 2017;35(50):7018-25. doi: 10.1016/j.vaccine.2017.10.047
12. Enemark U, Byberg S, Thysen S, et al. Costs of hospital admissions and medical consultations in three African countries. (manuscript) 2020
13. Instituto Marqués de Valle Flör. PIMI – Integrated Programme to reduce Maternal and Child mortality – strengthening the availability and quality of Maternal and Child Care in the health administration https://www.imvf.org/en/project/pimi-integrated-programme-to-reduce-maternal-and-child-mortality/ [
14. Byberg S, Fisker AB, Thysen SM, et al. Cost-effectiveness of providing measles vaccination to all children in Guinea-Bissau. Global health action 2017;10(1):1329968. doi: 10.1080/16549716.2017.1329968
15. Knight GM, Griffiths UK, Sumner T, et al. Impact and cost-effectiveness of new tuberculosis vaccines in low- and middle-income countries. Proceedings of the National Academy of Sciences of the United States of America 2014;111(43):15520-5. doi: 10.1073/pnas.1404386111 [published Online First: 2014/10/08]
16. World Bank. Guinea-Bissau: Country profile. In: World Development Indicators database, ed., 2017. 17. World Health Organisation. Making Choices in Health: WHO Guide to Cost-Effectiveness Analysis.
http://apps.who.int/iris/bitstream/handle/10665/42699/9241546018.pdf;jsessionid=5C78EAE82E4903003536ABD711D43BC6?sequence=12003.
18. Roy P, Vekemans J, Clark A, et al. Potential effect of age of BCG vaccination on global paediatric tuberculosis mortality: a modelling study. The Lancet Global Health 2019;7(12):e1655-e63. doi: 10.1016/s2214-109x(19)30444-9
BMJ Publishing Group Limited (BMJ) disclaims all liability and responsibility arising from any relianceSupplemental material placed on this supplemental material which has been supplied by the author(s) BMJ Global Health
doi: 10.1136/bmjgh-2021-006127:e006127. 6 2021;BMJ Global Health, et al. Thysen SM

23
19. Institute for Health Metrics and Evaluation. Global Health Data Exchange. Global Burden of Disease. In: Institute for Health Metrics and Evaluation, ed. http://ghdx.healthdata.org/gbd-results-tool, 2018.
BMJ Publishing Group Limited (BMJ) disclaims all liability and responsibility arising from any relianceSupplemental material placed on this supplemental material which has been supplied by the author(s) BMJ Global Health
doi: 10.1136/bmjgh-2021-006127:e006127. 6 2021;BMJ Global Health, et al. Thysen SM
![GAMMAGARD S/D, 5 g/vial & 10 g/vial - shirecanada.com · GAMMAGARD S/D, 5 g/vial & 10 g/vial. Immune Globulin Intravenous (Human) [IGIV], Solvent/Detergent-Treated (Freeze-Dried Concentrate)](https://static.fdocuments.in/doc/165x107/5e1b68f3543f35080e668dcc/gammagard-sd-5-gvial-10-gvial-gammagard-sd-5-gvial-10-gvial.jpg)