Dispersion Modeling of NOx and SOx in Phase 9 and 10 of ...
12
1 AQM 2012- 1272- Dispersion Modeling of NO x and SO x in Phase 9 and 10 of South Pars Oilfield Maryam Rouhi 1 , Hossein Moradi 2 , Alireza Soffianian 3 , Alireza Dahaghin 4 1 Master student of Environmental Sciences E-mail: [email protected] 2 Assistant Professor of Environmental Sciences E-mail: [email protected] 3 Assistant Professor of Environmental Sciences E-mail: [email protected] 4 Air pollution Head of Oil Industry E-mail: [email protected] Department of Natural Resources, Isfahan University of Technology, 84156-83111, Isfahan, Iran Abstract The research presented here, represents a segment of a cumulative impact modeling of phases 9 and 10 of South Pars Gas and Petrochemical Complex. It considers point and flare source emissions of sulphur and nitrogen oxides (SO 2 and NO x respectively), over an about 410 km 2 area. AERMOD View TM is used to estimate the maximum potential concentration of these pollutants over 1-h, 3-h, 8-h, 24-h, month and annual averaging periods. Results were compared with Air Quality Standards to assess the potential cumulative effects of these pollutants. Lastly Comparison with nearby monitoring data will indicate reasonability of predicted concentrations and usefulness of AERMOD as a tool for approaching the potential cumulative impacts of air pollution from multiple sources. The effects of predicted threshold violations on fragile ecosystems will be discussed. Keywords: Sulphur and nitrogen oxides. AERMOD. Air quality standards. Cumulative impacts. South Pars 1 Introduction The importance of air pollution prevention has been increasing in recent years, due to increasing knowledge of pollution sources and their pollution levels. National air quality standards have been established by the United States Clean Air Act to protect man and the environment from damage by air pollutants [6]. Chronic exposure to air pollutants is a worldwide problem. The World Health Organization (WHO) announced that every year approximately 2.7 million deaths can be attributed through air pollution [8]. "Acid Rain," or more precisely acid precipitation, is the word used to describe rainfall that has a pH level of less than 5.6. This form of air pollution is currently a subject of great controversy because of its worldwide environmental damages. For the last ten years, this phenomenon has brought destruction to thousands of lakes and streams in the United States, Canada, and parts of Europe. Acid rain is formed when oxides of nitrogen and sulfite combine with moisture in the atmosphere to make nitric and sulfuric acids. These acids can be carried away far from its origin. The two primary sources of acid rain are sulfur dioxide (SO 2 ), and oxides of nitrogen (NO x ). Acid rain does not only affect organisms on land, but also affects organisms in aquatic biomes [11]. Possible health effects from Gas and Petrochemical Complexes and related emissions have been a long-standing community concern, particularly when such industrial activities are located near together in a small area such as Assaluyeh [7]. Dispersion is the process of air pollutants emitted from sources such as industrial plants and vehicular traffic dispersing in the ambient atmosphere [10]. An air quality dispersion model is a series of equations that mathematically describe the behavior of pollutants in the air. It provides a cause-effect link between the emissions into the air and the resulting air pollution concentrations. Dispersion models have been used in many different applications, but have traditionally
Transcript of Dispersion Modeling of NOx and SOx in Phase 9 and 10 of ...

1
IVHC 2012-XXXX AQM 2012- 1272-AQM2012-FULL
Dispersion Modeling of NOx and SOx in Phase 9 and 10 of South
Pars Oilfield
Maryam Rouhi1, Hossein Moradi
2, Alireza Soffianian
3, Alireza Dahaghin
4
1Master student of Environmental Sciences E-mail: [email protected]
2Assistant Professor of Environmental Sciences E-mail: [email protected]
3Assistant Professor of Environmental Sciences E-mail: [email protected]
4Air pollution Head of Oil Industry E-mail: [email protected]
Department of Natural Resources, Isfahan University of Technology, 84156-83111, Isfahan, Iran
Abstract The research presented here, represents a
segment of a cumulative impact modeling of
phases 9 and 10 of South Pars Gas and
Petrochemical Complex. It considers point and
flare source emissions of sulphur and nitrogen
oxides (SO2 and NOx respectively), over an
about 410 km2 area. AERMOD View
TM is
used to estimate the maximum potential
concentration of these pollutants over 1-h, 3-h,
8-h, 24-h, month and annual averaging periods.
Results were compared with Air Quality
Standards to assess the potential cumulative
effects of these pollutants. Lastly Comparison
with nearby monitoring data will indicate
reasonability of predicted concentrations and
usefulness of AERMOD as a tool for
approaching the potential cumulative impacts
of air pollution from multiple sources. The
effects of predicted threshold violations on
fragile ecosystems will be discussed.
Keywords: Sulphur and nitrogen oxides.
AERMOD. Air quality standards. Cumulative
impacts. South Pars
1 Introduction The importance of air pollution
prevention has been increasing in recent years,
due to increasing knowledge of pollution
sources and their pollution levels. National air
quality standards have been established by the
United States Clean Air Act to protect man and
the environment from damage by air pollutants
[6]. Chronic exposure to air pollutants is a
worldwide problem. The World Health
Organization (WHO) announced that every
year approximately 2.7 million deaths can be
attributed through air pollution [8].
"Acid Rain," or more precisely acid
precipitation, is the word used to describe
rainfall that has a pH level of less than 5.6.
This form of air pollution is currently a subject
of great controversy because of its worldwide
environmental damages. For the last ten years,
this phenomenon has brought destruction to
thousands of lakes and streams in the United
States, Canada, and parts of Europe. Acid rain
is formed when oxides of nitrogen and sulfite
combine with moisture in the atmosphere to
make nitric and sulfuric acids. These acids can
be carried away far from its origin. The two
primary sources of acid rain are sulfur dioxide
(SO2), and oxides of nitrogen (NOx). Acid rain
does not only affect organisms on land, but
also affects organisms in aquatic biomes [11].
Possible health effects from Gas and
Petrochemical Complexes and related
emissions have been a long-standing
community concern, particularly when such
industrial activities are located near together in
a small area such as Assaluyeh [7].
Dispersion is the process of air pollutants
emitted from sources such as industrial plants
and vehicular traffic dispersing in the ambient
atmosphere [10]. An air quality dispersion
model is a series of equations that
mathematically describe the behavior of
pollutants in the air. It provides a cause-effect
link between the emissions into the air and the
resulting air pollution concentrations.
Dispersion models have been used in many
different applications, but have traditionally

2
IVHC 2012-XXXX AQM 2012- 1272-AQM2012-FULL
been used for air quality assessments in
support of decisions regarding approvals and
permits for regulated sources [1]. Dispersion
models use a set of scientific equations to
describe and simulate the dispersion,
transformation and deposition of pollutants
emitted into the atmosphere. In addition to the
quantity and type of pollutants released into
the air, factors such as topography,
atmospheric conditions, and the pollutant
source location also have a significant effect
on air quality [10]. A dispersion model is
essentially a computational procedure for
predicting concentrations downwind of a
pollutant source, based on knowledge of the
emissions characteristics (stack exit velocity,
plume temperature, stack diameter, etc.),
terrain (surface roughness, local topography,
nearby buildings) and state of the atmosphere
(wind speed, stability, mixing height, etc.)
[10]. The model has to be able to predict rates
of diffusion based on measurable
meteorological variables such as wind speed,
atmospheric turbulence, and thermodynamic
effects. The algorithms at the core of air
pollution models are based upon mathematical
equations describing these various phenomena
which, when combined with empirical (field)
data, can be used to predict concentration
distributions downwind of a source [5].
The notion of “cumulative impacts” (or
cumulative effects) is gaining acceptance and
may eventually replace “traditional”
environmental impact assessments around the
globe. The US Council on Environmental
Quality defines cumulative effects as "the
impacts on the environment that result from
the incremental impact of the action when
added to other past, present, and reasonably
foreseeable future actions regardless of what
agency (federal or nonfederal) or person
undertakes such other actions" [2]. The
cumulative effects concept is, therefore, an
acknowledgement that the environmental and
socioeconomic effects of individual projects
may combine and interact, thereby resulting in
structural and functional changes to ecological
and social systems that would not necessarily
be identified should the assessment focus
solely on one project [9].
Currently used dispersion models, such as
the AMS/EPA Regulatory Model (AERMOD),
process routinely available meteorological
observations to construct model inputs. Thus,
model estimates of concentrations depend on
the availability and quality of meteorological
observations, as well as the specification of
surface characteristics at the observing site [3].
AERMOD requires steady and horizontally
homogeneous hourly surface and upper air
meteorological observations [4].
The research presented here, represents a
segment of a cumulative impact modeling of
phase 9 and 10 of South Pars Gas and
Petrochemical Complex. Many different
industries and activities are going on in this
complex where a huge amount of air pollutant
gases will be released to the atmosphere. The
common gases will result in cumulative effects
which will affect the natural and human
environment severely. This study aims to: 1)
model dispersion of NOx and SOx in phase 9
and 10 of South Pars oilfield; 2) compare the
outputs with Air Quality Standards to estimate
the share of these pollutants of the air pollution
of the ambient; 3) do the comparison with
nearby monitoring data will indicate
reasonability of predicted concentrations and
usefulness of AERMOD as a tool for
approaching the potential cumulative impacts
of air pollution from multiple sources; 4)
overlay the outputs with landuse map of the
study area to realize which populations are
affected and which concentrations they are
exposed by; 5) overlay the outputs with
ecosystems map of the study area to realize
which ecosystems are affected and which
concentrations they are exposed by. The
effects of predicted threshold violations on
fragile ecosystems will be discussed.
2 Methods
2-1 Study Area In this modeling a study area of 410 km2
of South Pars oilfield was chosen. South Pars

3
IVHC 2012-XXXX AQM 2012- 1272-AQM2012-FULL
oilfield was chosen because of (1) the high
density of emission sources, (2) community
concerns regarding poor air quality in this
region, and (3) the proximity to Nayband gulf
and national park as fragile ecosystems. . The
Iranian South Pars field is the largest
discovered offshore gas field in the world,
located 100 km offshore in the Persian Gulf.
Reservoir fluids are transported to shore via
two sea lines to the mainland (Assaluyeh) at a
distance of approximately 105 km for further
treatment. In this study SO2 and NOx sources
of 9 and 10 phases of South Pars field was
chosen for modeling (Fig. 1).
Fig. 1: location of 9 & 10 Phases of South Pars field with Google Earth, 2012
2-2 Dispersion Modeling
Lakes Environmental's AERMOD ViewTM
version 7.6.1 was chosen for modeling
dispersion of SO2 and NOx. Sulfur dioxide
(SO2) is the criteria pollutant that is the
indicator of sulfur oxide concentrations in the
ambient air. SO2 dissolves in water vapor to
form acid, and interacts with other gases and
particles in the air to form sulfates and other
products that can be harmful to people and
their environment [13]. SO2 was chosen as SOx
for modeling because of that. The AERMOD
atmospheric dispersion modeling system is an
integrated system that includes three modules:
[12]
A steady-state dispersion model designed
for short-range (up to 50 kilometers)
dispersion of air pollutant emissions from
stationary industrial sources.
A meteorological data preprocessor
(AERMET) that accepts surface
meteorological data, upper air soundings,
and optionally, data from on-site
instrument towers. It then calculates
atmospheric parameters needed by the
dispersion model, such as atmospheric
turbulence characteristics, mixing heights,
friction velocity, Monin-Obukov length
and surface heat flux.

4
IVHC 2012-XXXX AQM 2012- 1272-AQM2012-FULL
A terrain preprocessor (AERMAP) whose
main purpose is to provide a physical
relationship between terrain features and
the behavior of air pollution plumes. It
generates location and height data for each
receptor location. It also provides
information that allows the dispersion
model to simulate the effects of air flowing
over hills or splitting to flow around hills.
The dispersion of pollutants released to
the atmosphere is highly dependent on the
meteorological conditions into which it is
released. Meteorology was supplied by Lakes
Environmental in SAMSON format for the
Persian Gulf airport and Kangan- Jam station
prior to processing with AERMET. The data
for the years 2008 and 2009 was used for this
purpose. AERMOD is a Gaussian plume
model that uses a skewed bi-Gaussian
probability density function under convective
conditions when vertical plume dispersion is
non-Gaussian [16]. More information on
AERMOD and AERMOD View™ 7.6.1
including algorithms and background science
can be obtained from the US-EPA
(http://www.epa.gov/scram001/dispersion_pref
rec.htm) and from Lakes Environmental
(http://www.weblakes.com).
AERMAP is a terrain data preprocessor
that incorporates complex terrain using USGS
Digital Elevation Data
(http://gdex.cr.usgs.gov/gdex/).
In this study rural and elevated options
were chosen for the uniform 40×40 Cartesian
grid with 500m spacing and with a center
reference point (UTM Zone 39 WGS 1984,
North: 3042640 m & East: 661529 m).
The emissions to air consider SO2 and
NOX. As all the combustion units burn sweet
fuel gas with less than 2 ppm of sulphur
containing compounds, the primary source of
SO2 is from the sulphur recovery units during
normal operation. The major NOX emission
sources include gas turbines and steam boilers
during normal operation [15]. Stacks and flares
with emission rates over than 1g/s were chosen
for modeling. Therefore 4 sources (2 stacks
and 2 flares) were used for SO2 dispersion
modeling and 12 sources (12 stacks) were used
for NOX dispersion modeling. Stack and flare
parameters assigned to point and flare sources
used in AERMOD View are given in table 1.
Table 1: Stack and Flare parameters used in AERMOD View
Sources Stack
Height m
Flue Gas
Temp. °K
Flue Gas Velocity
M/s
SO2
G/s
NOX
G/s
Steam Boiler 43 458 12.24 - 7
Steam Boiler 43 458 12.24 - 7
Steam Boiler 43 458 12.24 - 7
Steam Boiler 43 458 12.24 - 7
Steam Boiler 43 458 12.24 - 7
Steam Boiler 43 458 12.24 - 7
Compressor gas turbine 30 776 10.99 - 22.67
Compressor gas turbine 30 776 10.99 - 22.67
Compressor gas turbine 30 776 10.99 - 22.67
Compressor gas turbine 30 776 10.99 - 22.67
SRU tail gas incinerator (SRU Trip
Case)
95 625 5.43 330.3 4.8
SRU tail gas incinerator (SRU Trip
Case)
95 625 5.43 330.3 4.8
LP Flare (Normal) 25 317 1.5 1.36 -
LP Flare (Normal) 25 317 1.5 1.36 -

5
IVHC 2012-XXXX AQM 2012- 1272-AQM2012-FULL
3 Results
3-1 Predicted Concentrations
This study considers point and flare
source emissions of sulphur and nitrogen
oxides (SO2 and NOx respectively), over an
about 410 km2 area. The time period from
11/1/2008 to 10/31/2009 was chosen for
modeling.
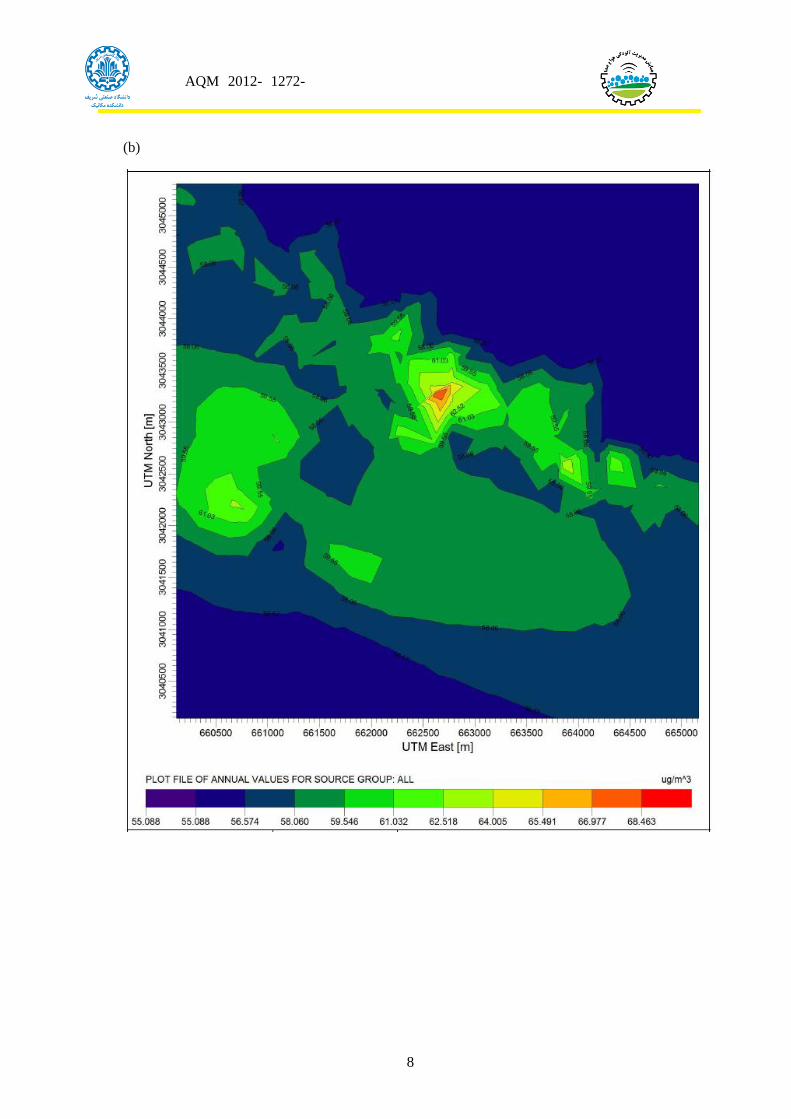
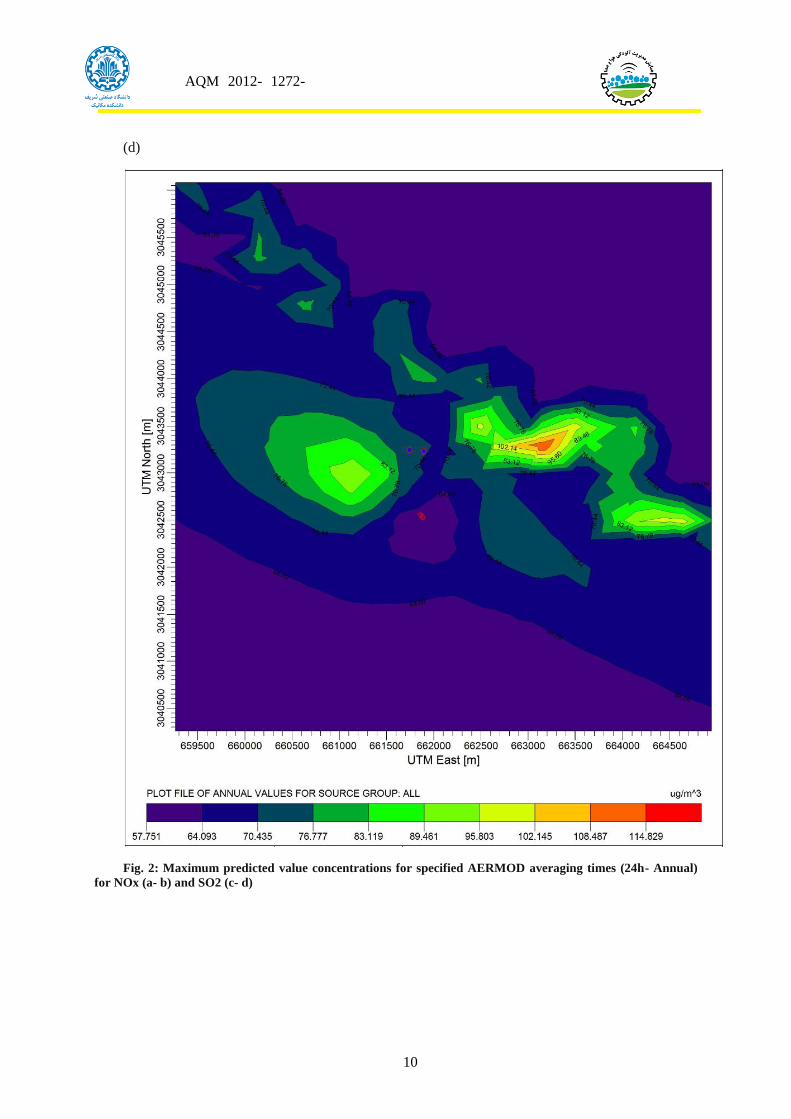
AERMOD output was averaged over 1-h,
3-h, 8-h, 24-h, monthly and annual periods for
both SO2 and NOx. Maximum predicted value
concentrations for specified AERMOD
averaging times occurred in mountains near
emission sources (Fig. 3). These values are
given in table 2 and Fig. 2a–d.
Table 2 AERMOD View predicted maximum concentrations over averaging times
Concentration (μg/ m3)
Pollutant 1 h 3 h 8 h 24 h Month Annual
SO2 9732.11 3878.45 1856.29 846.37 157.99 114.82
NOX 1789.32 826.89 408.97 194.24 82.02 68.43
Predicted maximum concentrations were
exceeded all the chosen SO2 limits (Table 3
and 4). Predicted maximum NOx
concentrations exceeded standards in 24-h
average time but it did not exceed in maximum
annual average time (Table 3 and 4).
Table 3 Project Air Quality Standards for South Pars [15] Standards during normal operation
Parameter Project
Standards
(µg/m³)
Iranian
Petroleum
Standards (1)
(µg/m³)
Averaging
period
Sulphur Dioxide
(SO2)
50 80 Annual Mean
125(3) 365(2) 24 hour average
Oxides of
Nitrogen NOx
(such as NO2)
40 100 Annual Mean
150 - 24 hour average
Remark: (1) Iranian Petroleum Standard IPS –E-
SF-860
(2) Not to be exceeded more than once a
year
(3) 98th percentile of all daily values
taken throughout the year; should not
be exceeded more than 7 days a year
Table 4 National and Wyoming Air Quality Standards for Criteria Pollutants [14]
Pollutant Averaging
Time
NAAQS
(mg/m3)
WAAQS
(mg/m3)
Nitrogen dioxide (NO2) Annual 100 100
Sulfur dioxide (SO2) 3 hour 1300 695
24 hour 365 260
Annual 80 60

6
IVHC 2012-XXXX AQM 2012- 1272-AQM2012-FULL
4 Discussion There are 28 phases South Pars Gas Field.
Although, we are sure that the general
concentrations of studied gases are the
commutation of all the emission sources in the
studied area, but we modeled the concentration
of the gases as a pilot study for two phases.
Background concentrations of SO2 and NOx
were taken for this purpose. Based on the
previous studies, background concentration
values used for SO2 and NOx were 22 and 55
ppb respectively.
However, the purpose of this study was to
apply AERMOD software as a tool for
approaching the potential cumulative impacts
of air pollution from multiple sources in phases
9 and 10 of South Pars Gas Field.
The results indicate that we have the most
dispersion of both gases in the Northwest of
the studied area on the mountains (As shown
in Fig. 3). So, we conclude that it might be as
the effect of the wind direction which is
coming from the southeast.
In short average times (1-h, 3-h, 8-h and
24-h) maximum predicted concentrations were
exceeded the standards by both SO2 and NOx.
It was represent the potential short term
impacts of these pollutants on human healthy
and fragile ecosystems. The maximum
predicted concentration in annual average time
of SO2 was exceeded standards and it can be
concluded the potential long term impacts of
SO2 maximum concentrations in the long
periods of time in this study area. But
maximum predicted concentration in annual
average time of NOx did not exceed the
standards, it can be concluded that maximum
NOx concentrations in long periods of time
cannot have considerable potential impacts.

7
IVHC 2012-XXXX AQM 2012- 1272-AQM2012-FULL
(a)
8
IVHC 2012-XXXX AQM 2012- 1272-AQM2012-FULL
(b)

9
IVHC 2012-XXXX AQM 2012- 1272-AQM2012-FULL
(c)
10
IVHC 2012-XXXX AQM 2012- 1272-AQM2012-FULL
(d)
Fig. 2: Maximum predicted value concentrations for specified AERMOD averaging times (24h- Annual)
for NOx (a- b) and SO2 (c- d)

11
IVHC 2012-XXXX AQM 2012- 1272-AQM2012-FULL
Fig. 3: Maximum concentration contours of SO2 over 24 h average time overlaid on Google Earth
5 Conclusions The isolation of facilities and events for
current atmospheric release permits (and
traditional environmental impacts assessments)
ignores the potential cumulative impacts of
multiple emission sources (or activities) in
shared space and time. While individual plants
and small emission sources may appear
benign, when considered cumulatively, even
over a relatively small study area, their plumes
have the potential to intersect and exceedances
of ambient air concentration standards for SO2
and NOx are likely to occur. Episodically high
concentrations occur under conditions of a
stable boundary layer with light winds and
little convective or turbulent mixing.
6 References [1] British Columbia:
http://www.env.gov.bc.ca/epd/bcairquality
/assessment/dispersion-modelling.html
[2] Council on Environmental Quality.
Considering cumulative effects under the
national environmental policy act; 1997
[3] Isakov. Vlad, et. al., “Evaluating the use of
outputs from comprehensive
meteorological models in air quality
modeling applications”, Atmospheric
Environment, 41, pp. 1689–1705, 2007
[4] Kesarkar. Amit P., M. Dalvi, A.
Kaginalkar, A. Ojha, “Coupling of the
Weather Research and Forecasting Model
with AERMOD for pollutant dispersion
modeling. A case study for PM10
dispersion over Pune, India”, Atmospheric
Environment, 41, 1976 – 1988, 2007
[5] Macdonald. Robert, “Theory and
Objectives of Air Dispersion Modeling”,
Modeling Air Emissions for Compliance,
MME 474A Wind Engineering, 2003
[6] Maynard. E.S., “Review of the attributes
and performance of 10 rural diffusion

12
IVHC 2012-XXXX AQM 2012- 1272-AQM2012-FULL
model”, American Meteorological Society,
65(6), pp. 554-558, 1984
[7] Nojoumi. Alireza, L. Zareh Haghighi, Z.
Navidinia, “Analytical analysis of
environmental air pollution In South Pars
with Passive Sampler method through
2003 till 2010 Via Recommendation for
pollution prevention towards Sustainable
Development”, 2010
[8] Seangkiatiyuth. K., V. Surapipith, K.
Tantrakarnapa, A. W. Lothongkum,
“Application of the AERMOD modeling
system for environmental impact
assessment of NO 2 emissions from a
cement complex”, Journal of
Environmental Sciences, 23(6), pp. 931–
940, 2011
[9] http://a100.gov.bc.ca/appsdata/epic/docum
ents/p320/d31481/1251907838038_ea70ec
3e345095d462ff9de33a745674068a18c78c
c400499ab50d10111c5754.pdf
[10] http://www.lifeintheheartland.com/
pdf/FAP_Sht5_AQDispersion_Sngl.pd
f
[11] https://sites.google.com/site/acidrain1p
roject/
[12] http://en.wikipedia.org/wiki/AERMO
D
[13] http://www.epa.gov/apti/course422/ap
5.html
[14] http://www.blm.gov/rmpweb/applicati
on/rmp_browse.cfm?rmpid=104&idref=30
064#30072
[15] Air Dispersion Modeling Report of
N.I.O.C (National Iranian Oil Company),
2008.
[16] Perry, S. G., Paine, R. F., Cimorelli, A.
J., Venkatram, A., Lee, R. J., & Weil, J. C.
(1994). AERMOD: A dispersion model for
industrial source applications. Air and
Water Management Association. 94-
TA23.04, For Presentation at the 87th
Annual Meeting and Exhibition,
Cincinnati, Ohio. June 19–24, 1994.