MEASUREMENTS, EMISSIONS and DISPERSION of NOx, HC, PM10.
76
MEASUREMENTS, EMISSIONS and DISPERSION of NOx, HC, PM10
Transcript of MEASUREMENTS, EMISSIONS and DISPERSION of NOx, HC, PM10.

MEASUREMENTS,EMISSIONS
andDISPERSION
ofNOx, HC, PM10


VÄSTRA GÖTALAND
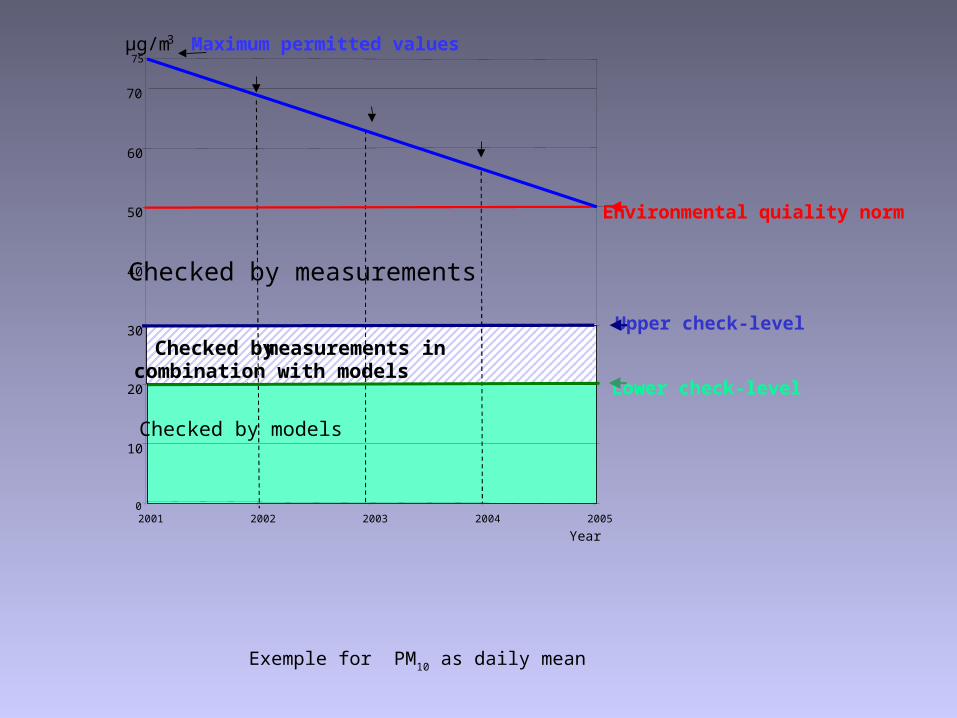
Exemple for PM10 as daily mean
Checked by measurements in combination with models
Year
µg/m3
0
10
20
30
40
50
60
2001 2002 2003 2004 2005
Maximum permitted values
Environmental quiality norm
Upper check-level
Lower check-level
Checked by measurements
Checked by models
70
75

• Measurements
• Emission calculations
• Dispersion calculations

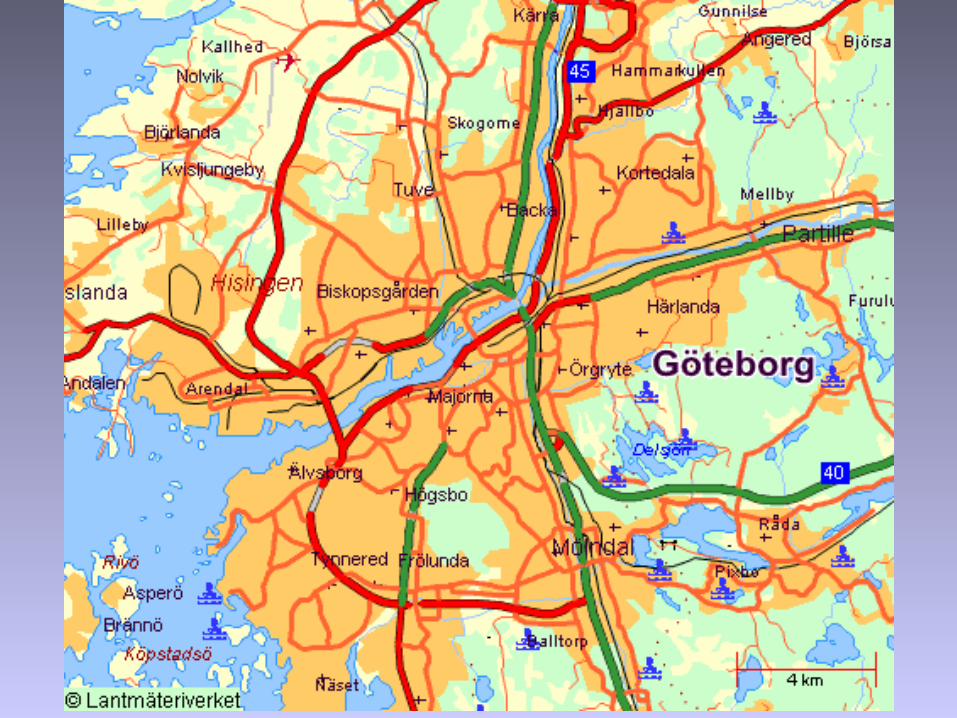
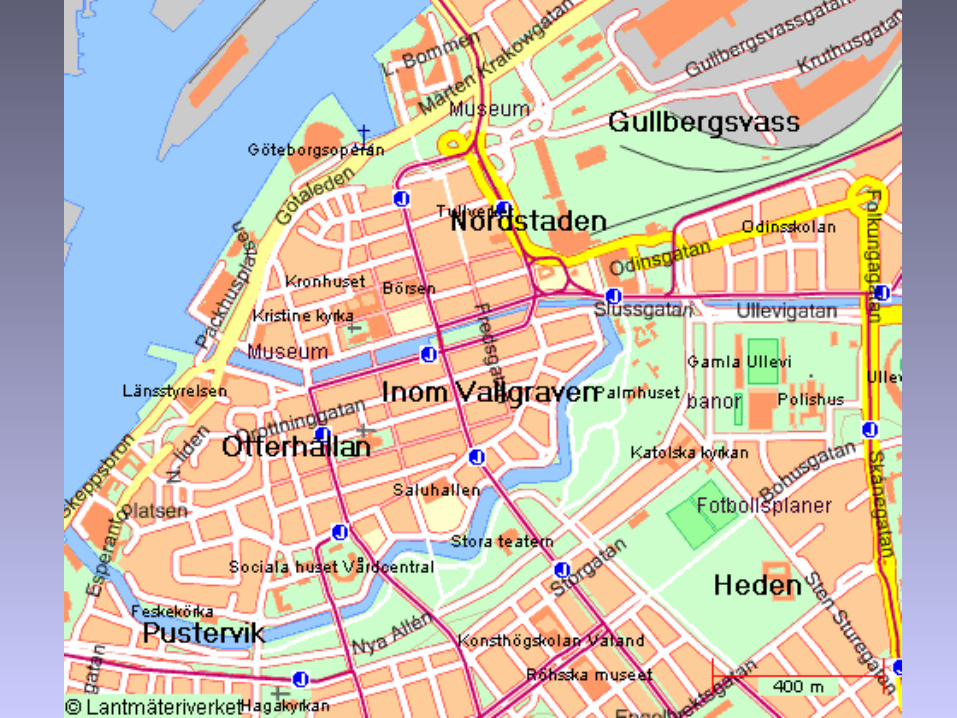
MEASURING SITES for PM10
Råö
Borås
Färgelanda
Gothenburg
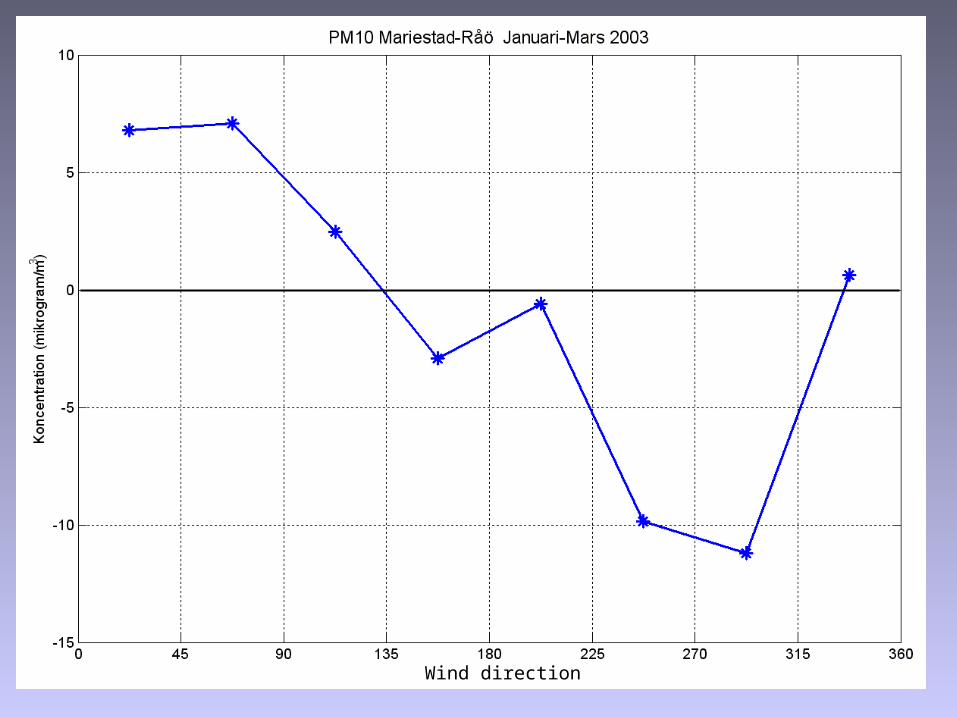
Mariestad
Aspvreten

Råö


BALTIC SEA
Aspvreten
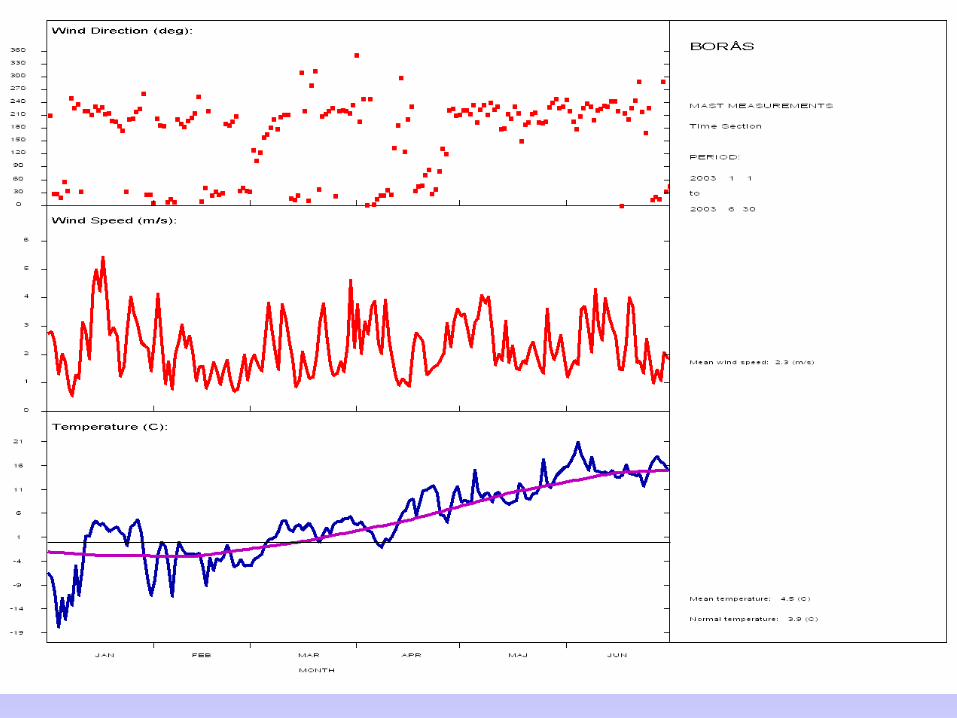
METEOROLOGICALMEASUREMENTS
INBORÅS
1/1 –30/6 2003

MEASUREMENTS
OF
PM10

Month mean of
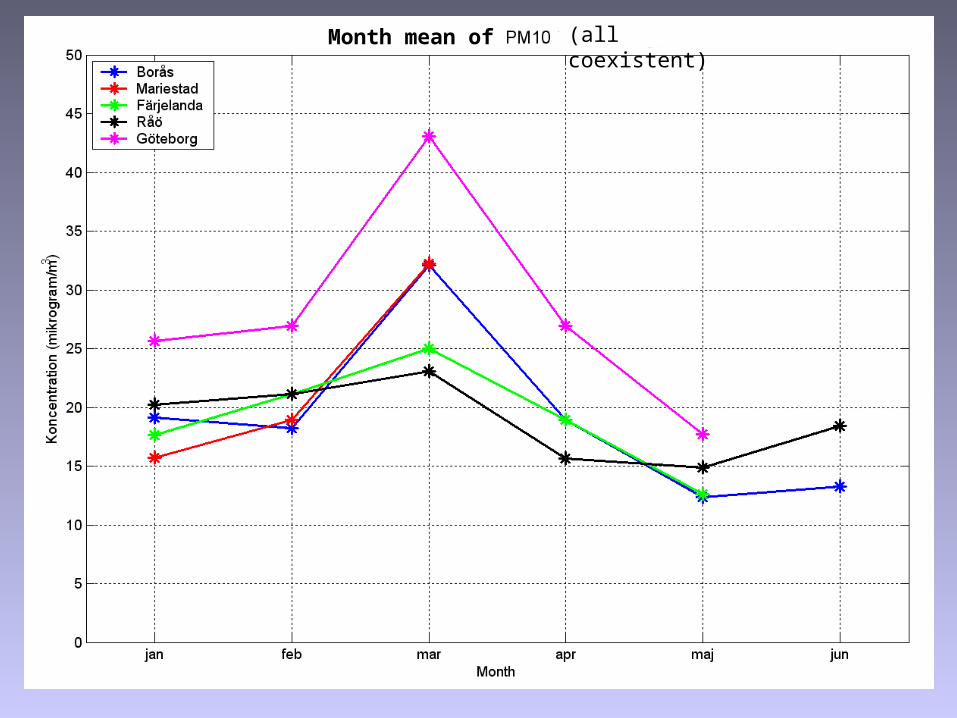
Month mean of (all coexistent)

(no precipitation)
Background
wed thuthuthu fri sat sun mon tue

(no precipitation)
Background
wed thu fri sat sun mon tue

(no precipitation)
Background
wed thu fri sat sun mon tue

Street - Background
(no precipitation)
wed thu fri sat sun mon tue

(with precipitation)
Street - Background
wed thu fri sat sun mon tue

wed thu fri sat sun mon tue
Gothenburg
Roof; city center

wed thu fri sat sun mon tue
Gothenburg
Roof; city center

Gothenburg
Roof; city center
Rat
io
wed thu fri sat sun mon tue

Wind direction
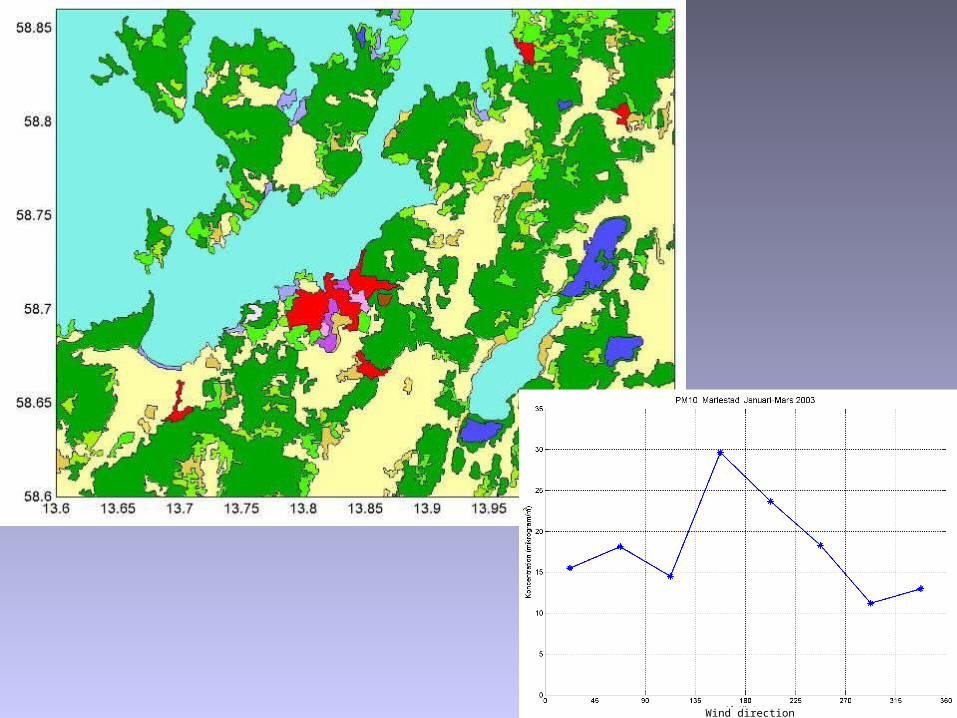
Wind direction
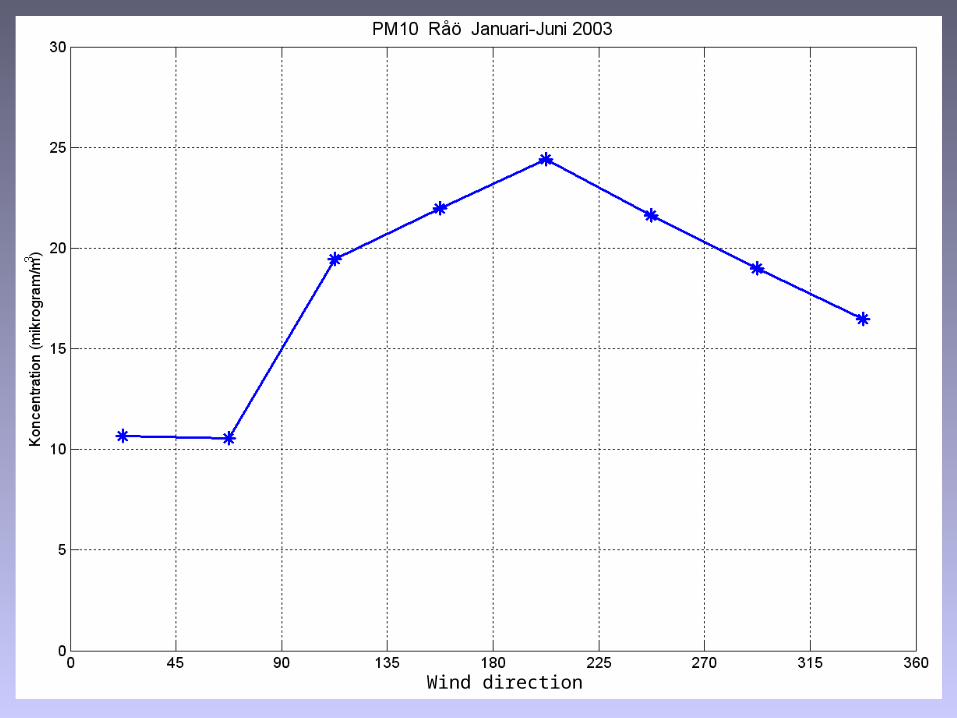
Wind direction

Wind direction

Wind direction
Wind direction

4-7/1 (NE-SE) 15-20/1 (S-NW) 25/2-2/3 (E-SE)
Borås PM10 19 26 30
Borås Na-marine 0.31 2.07 0.04
Borås Na-not marine 0.14 0.48 0.26
Borås Sea salt 1 7 0.1
Borås Seasalt/PM10 0.05 0.27 0.003
Råö PM10 11 36 30
Råö Na-marine 0.24 4.97 0.04
Råö Na-not marine 0.25 0.00 0.21
Råö Sea salt 0.8 16 0.1
Råö Seasalt/PM10 0.07 0.44 0.003
How much is sea salt?

0.000
0.100
0.200
0.300
0.400
0.500
0.600
0.700
0.800
0.900
1 2 3 4 5 6 7 8 9 10 11 12 13 14 15 16
Borås ratio seasalt/PM10 Mariestad ratio seasalt/PM10 Råö ratio seavsalt/PM10
4-7/1 (NE-SE)
15-20/1 (S-NW)
25/2-2/3 (E-SE)
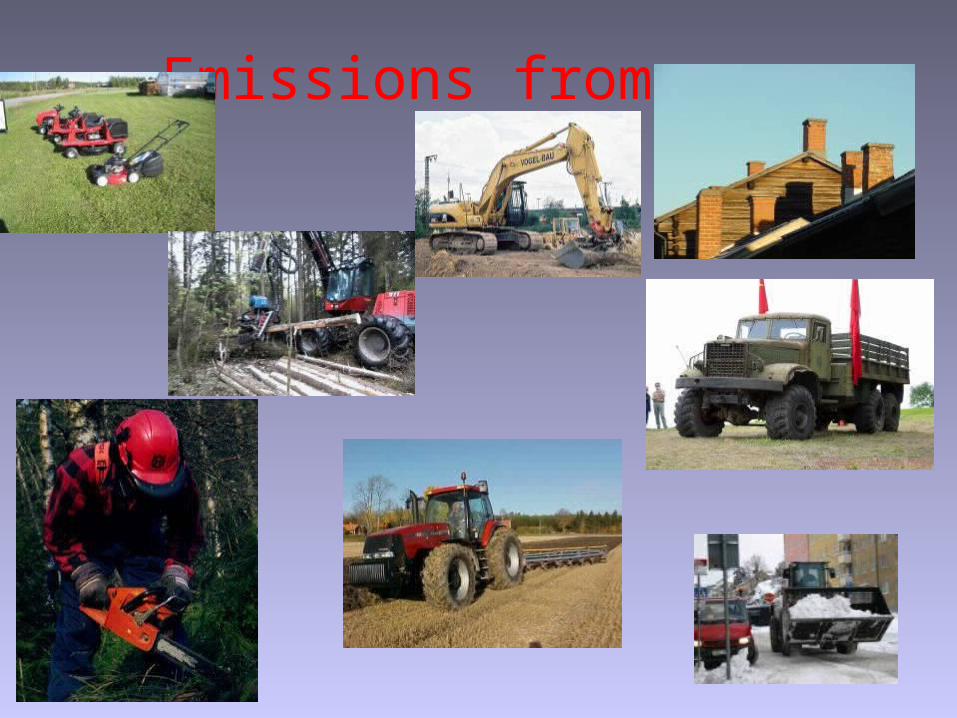
Emissions from

VOC (ton/year)421.8
442.4
707.2
928.4
70.5NOx (ton/Year)
2398.8
1206.4
803.4
3964.3
267.7
Particles (ton/year)
235.5
92.1
72.7
302.2
41.0
Agriculture
Forestry
Housholding
Industry
Other


Emissions from roads

Type of cars:
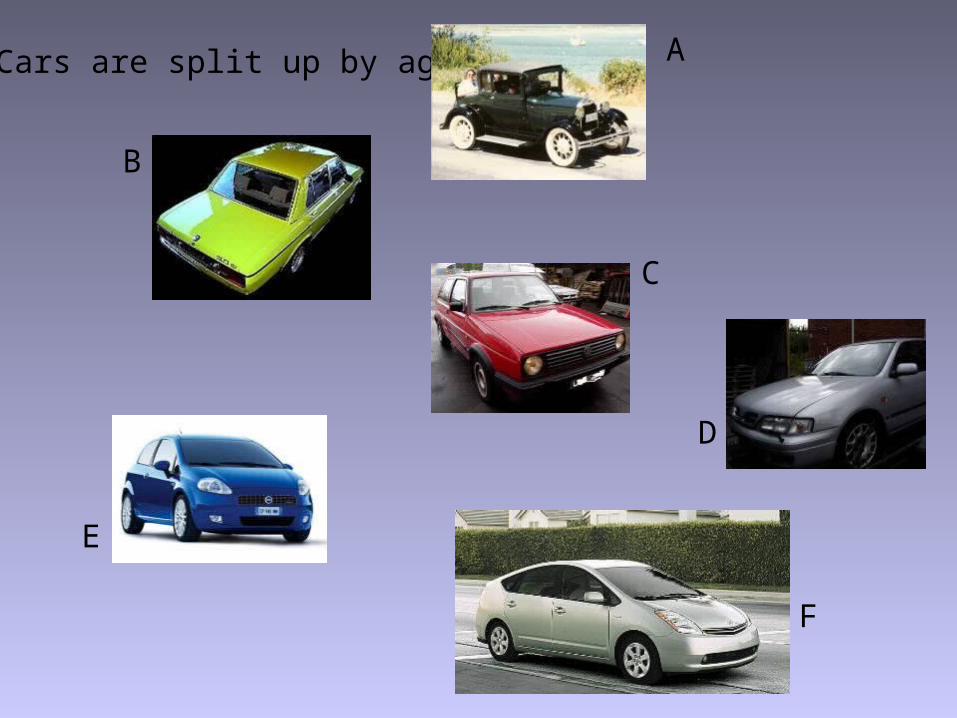
Cars are split up by age: A
B
C
D
E
F

Type of road:
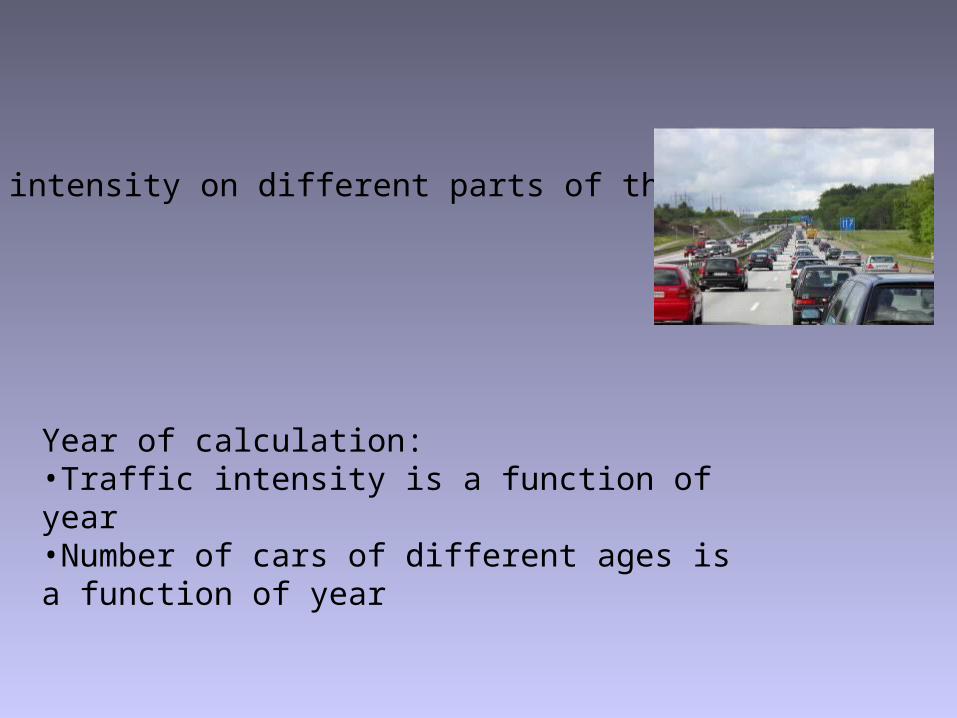
Year of calculation:•Traffic intensity is a function of year•Number of cars of different ages is a function of year
Traffic intensity on different parts of the roads:

Emissions (g/km) are functions of:
• Type of car
• Age of car
• Type of road
• Speed limit on road

Hot soak
Cold start

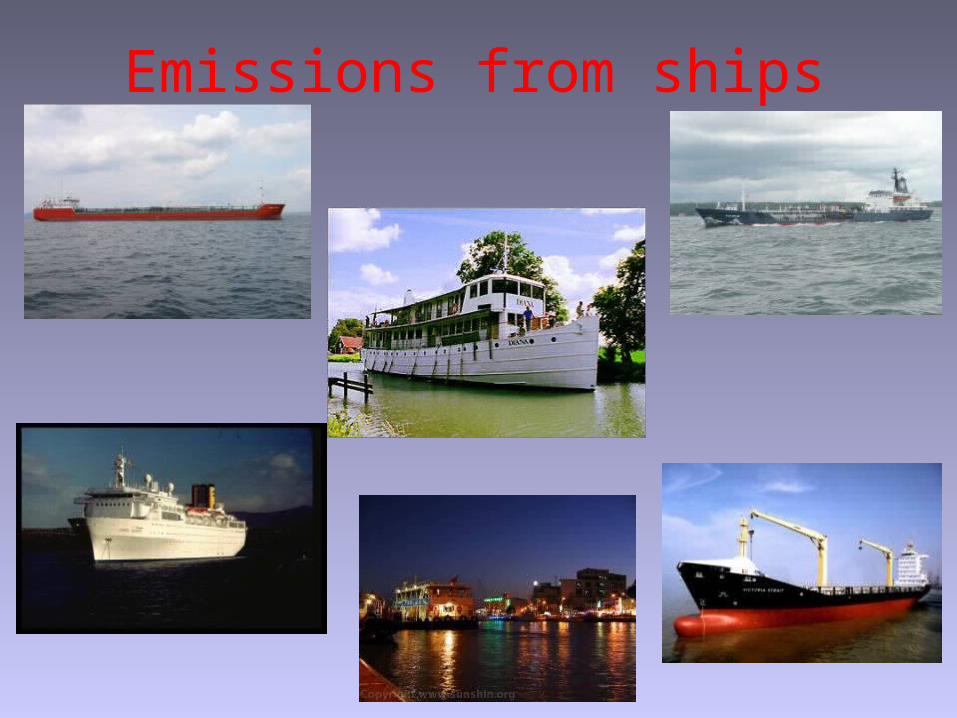
Emissions from ships


Emissions in cities

Emissions ton/year
Type of
source
Area Cars ShipsLine+Harbour
Total
NOx 8030 12200 17500 37730
HC 2200 6050 310 8660
PM10 700 180(from gas)
750 1630
ALARM-systemet
Leif Enger
Enger KM-konsult AB
Blixtgatan 9
Uppsala
Sweden
leif @ enger.se

ALARMALARM--systemsystem ==AAdvanced dvanced LLocal ocal AAnd nd RRegional egional MModeling odeling
systemsystem
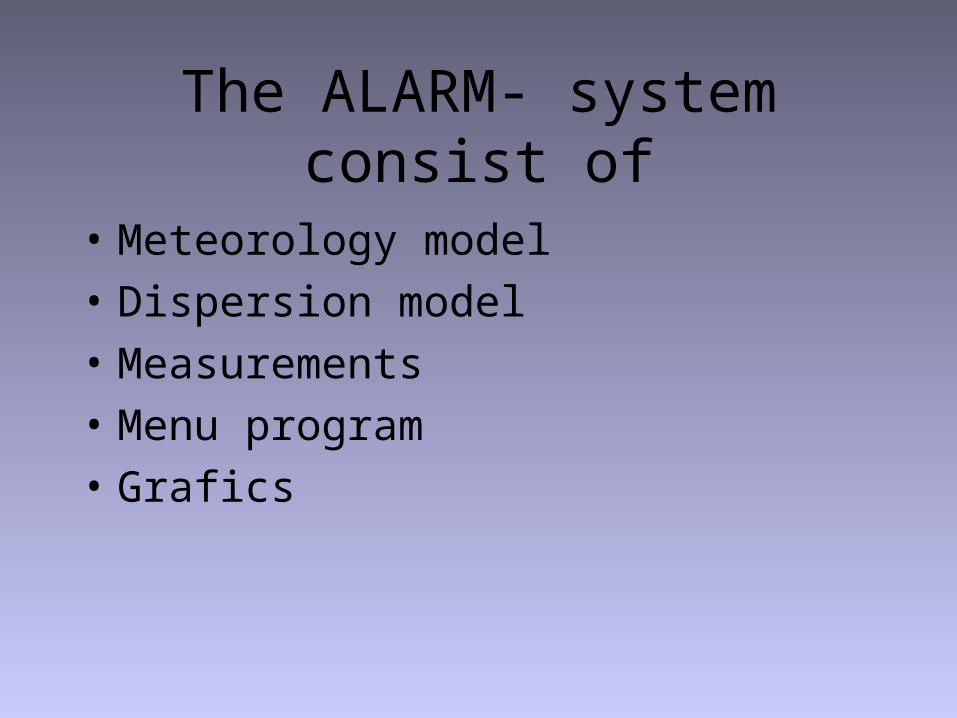
The ALARM- system consist of
• Meteorology model
• Dispersion model
• Measurements
• Menu program
• Grafics
Meteorology model:
The MIUU-modelDeveloped by Leif Enger and several others
at Meteorological Institute Uppsala University
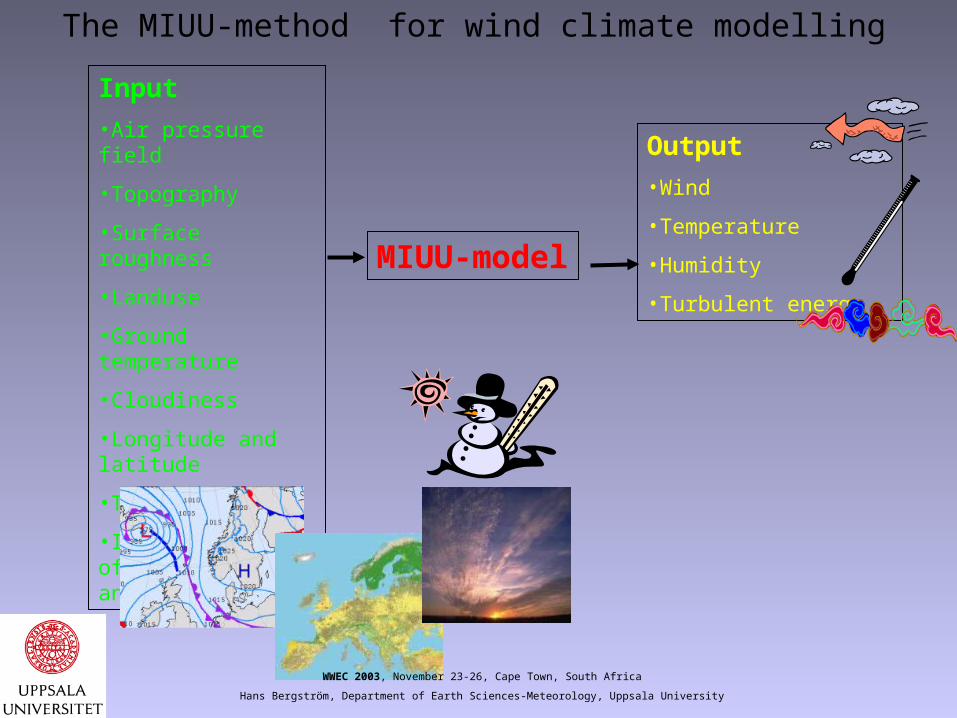
”The MIUU-method” for wind climate modelling
Input
•Air pressure field
•Topography
•Surface roughness
•Landuse
•Ground temperature
•Cloudiness
•Longitude and latitude
•Time of year
•Initial profiles of temperature and hunidity
MIUU-model
Output
•Wind
•Temperature
•Humidity
•Turbulent energy
WWEC 2003, November 23-26, Cape Town, South Africa
Hans Bergström, Department of Earth Sciences-Meteorology, Uppsala University

Metorological databaseThe MIUU-model simulates wind, temperature and turbulence over a day for a great number of cases:
• Three geostrophic wind speeds
• 36 different wind directions
• 4 different ”seasons”
Calculated wind, temperature and turbulence fields Calculated wind, temperature and turbulence fields are saved once per hour during the day.are saved once per hour during the day.This provides us with about 10 000 different This provides us with about 10 000 different meteorological cases.meteorological cases.

Database creation, phase 1:Wind, temperature and turbulence fields over Sweden and surrounding seas are simulated with the MIUU-model with 5 km resolution. This includes surrounding areas that is supposed to influence the wind climate over Sweden.
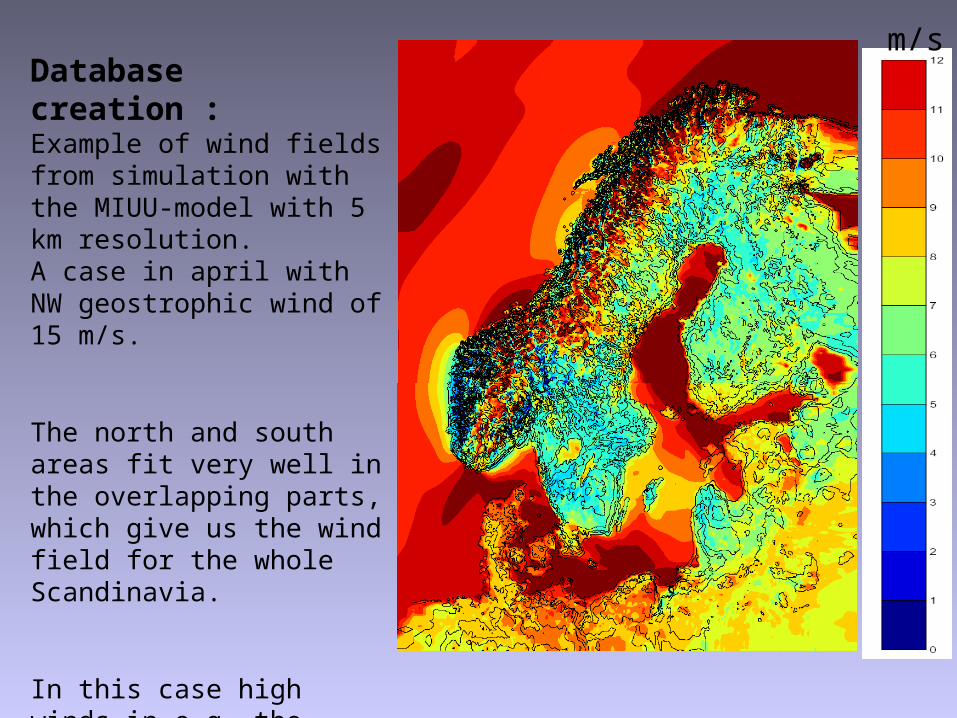
Database creation : Example of wind fields from simulation with the MIUU-model with 5 km resolution.A case in april with NW geostrophic wind of 15 m/s.
The north and south areas fit very well in the overlapping parts, which give us the wind field for the whole Scandinavia.
In this case high winds in e.g. the mountains, north and south Baltic Sea, as well as over Kattegatt and Skagerack.
m/s
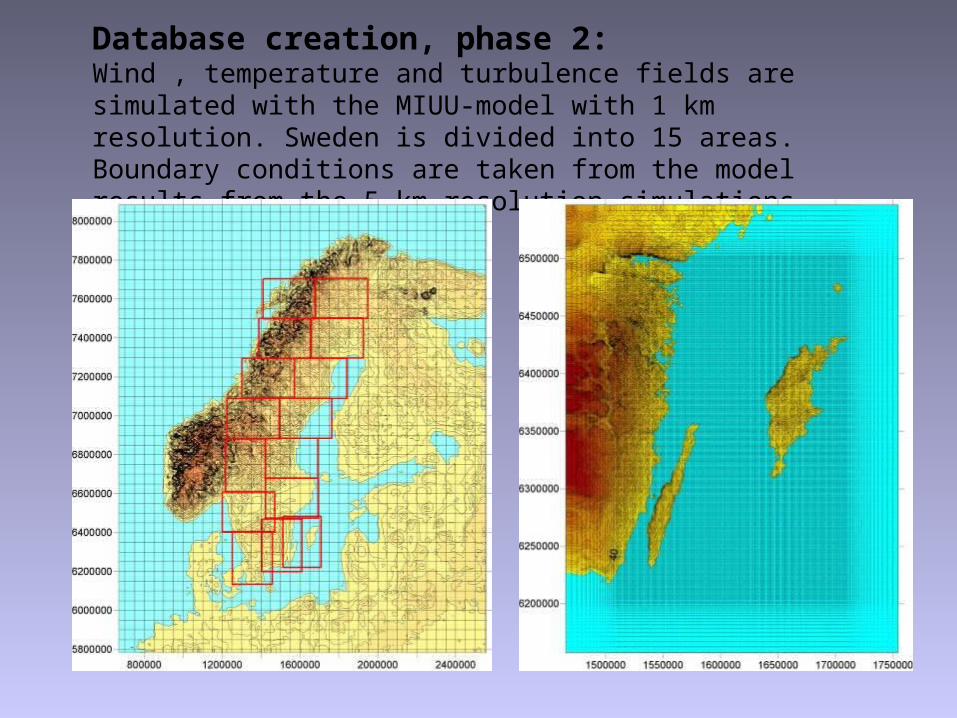
Database creation, phase 2:Wind , temperature and turbulence fields are simulated with the MIUU-model with 1 km resolution. Sweden is divided into 15 areas. Boundary conditions are taken from the model results from the 5 km resolution simulations.
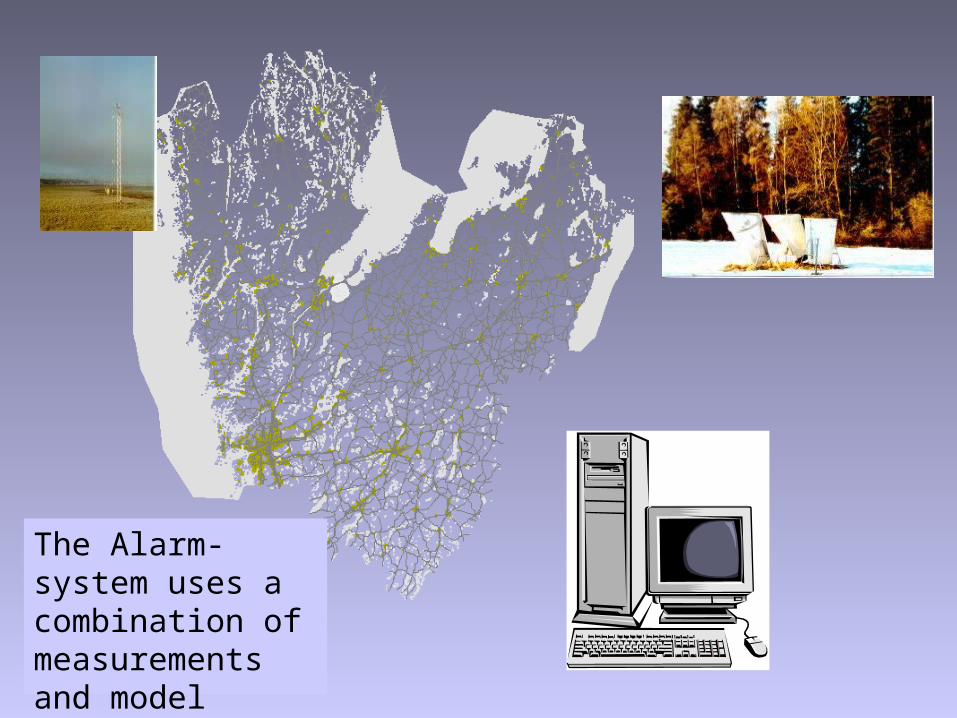
The Alarm-system uses a combination of measurements and model simulations
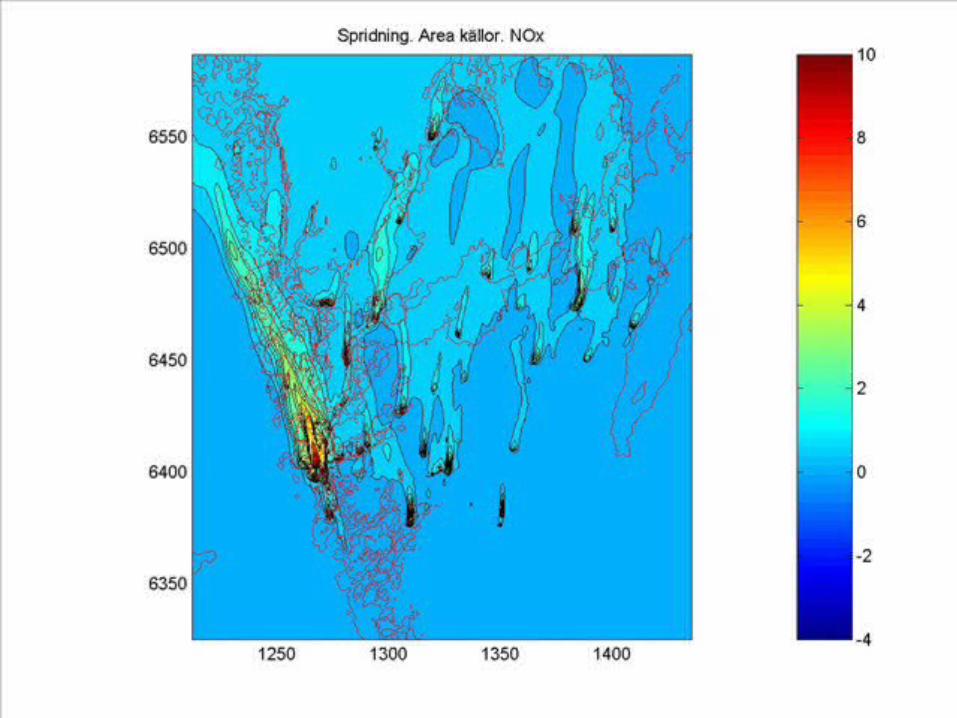
Exemple of dispersion from area sources
Movie: Dispersion of NOx during 4 days. One hour
between each picture.


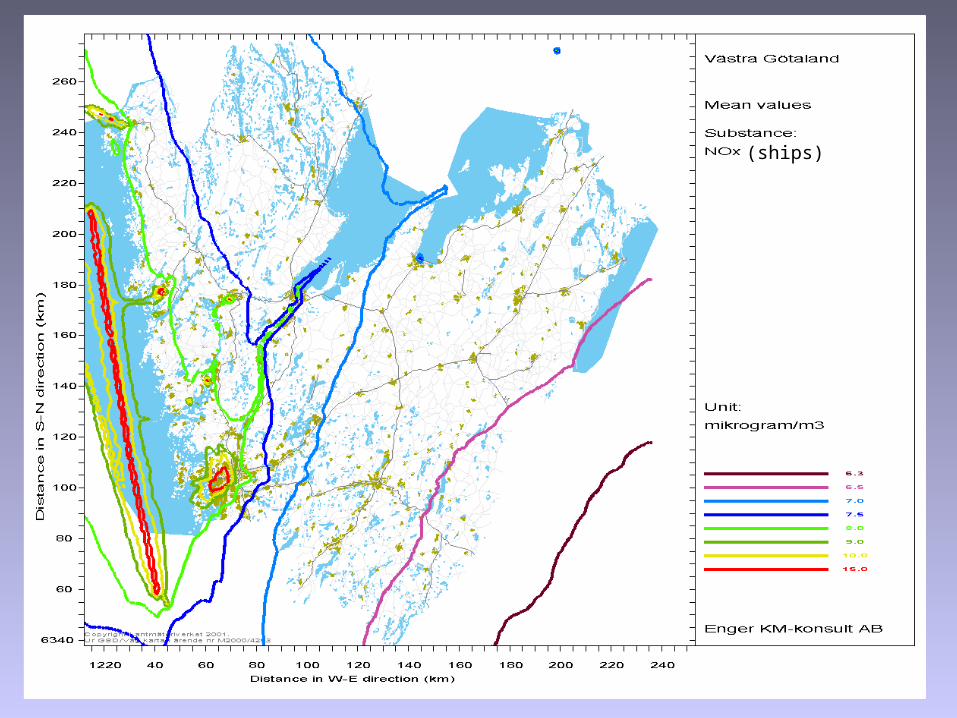
(ships)

Ships
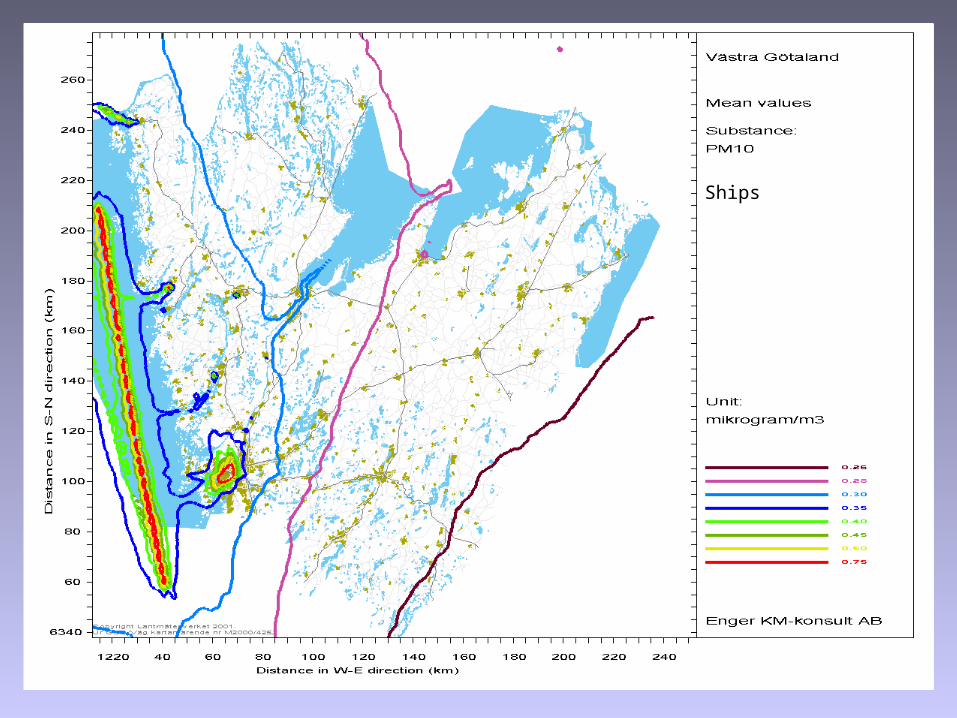
Ships
DISPERSIONFROM ALL SOURCES

shipsLine
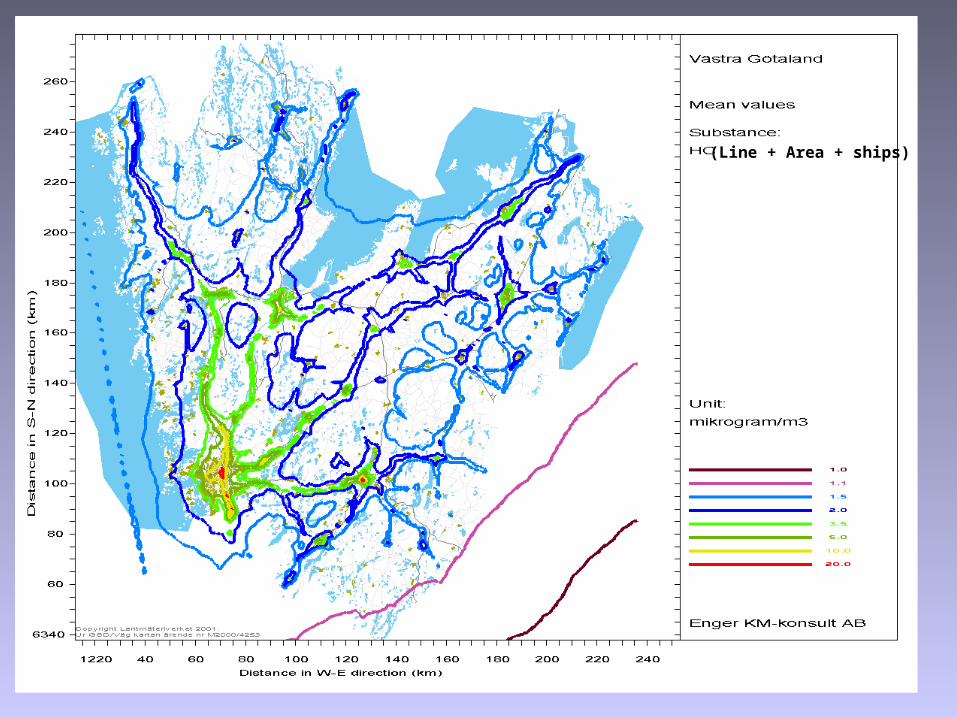
(Line + Area + ships)

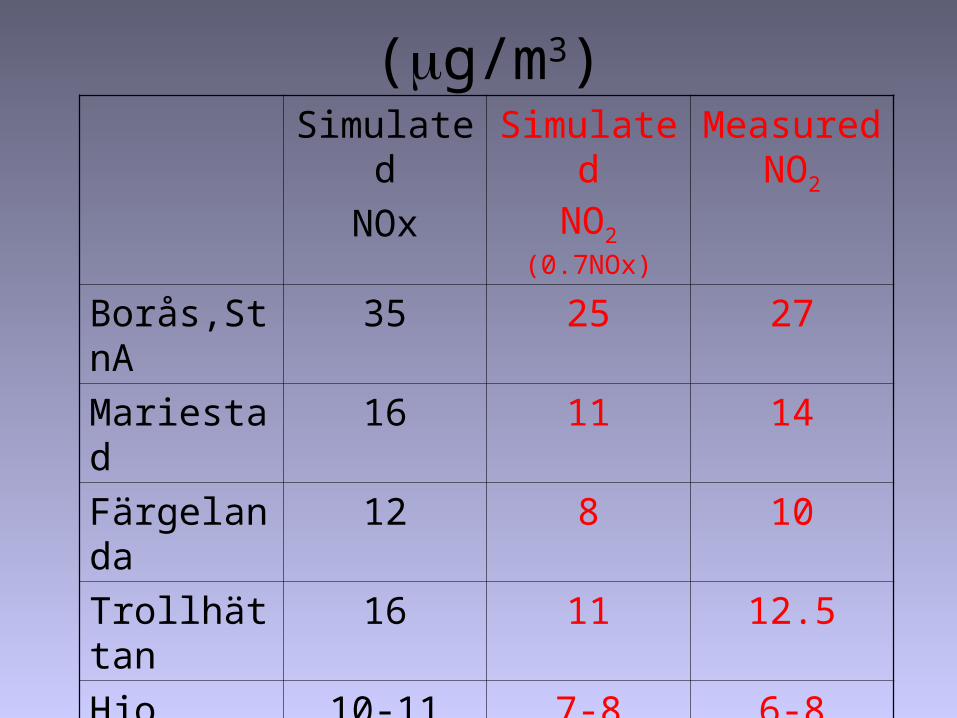
(g/m3)Simulated
NOx
SimulatedNO2 (0.7NOx)
Measured NO2
Borås,StnA 35 25 27
Mariestad 16 11 14
Färgelanda 12 8 10
Trollhättan 16 11 12.5
Hjo 10-11 7-8 6-8
Karlsborg 10-11 7-8 5-9
Åmål 11-16 8-12 12-16