Discussion Paper DP17-01 Tourism Impacts and the future of ...
19
STATE GRANTS COMMISSION Tourism Impacts and the future of the Tourism Cost Adjustor Discussion Paper – DP17-01 December 2016
Transcript of Discussion Paper DP17-01 Tourism Impacts and the future of ...

STATE GRANTS COMMISSION
Tourism Impacts and the future of the Tourism Cost Adjustor Discussion Paper – DP17-01
December 2016
DP17-01 Tourism Impacts and the future of the Tourism Cost Adjustor - STATE GRANTS COMMISSION 2
Contents
Review Background ...................................................................................... 3
Tourism Cost Adjustor Background ............................................................... 4
Tourism Impacts Review ............................................................................... 6
The Tourism Cost Adjustor: Conclusions and the future ................................. 9
Points for discussion ................................................................................... 12
Submissions and timeframes ........................................................................ 13
Appendices ................................................................................................ 14

DP17-01 Tourism Impacts and the future of the Tourism Cost Adjustor - STATE GRANTS COMMISSION 3
Review Background The State Grants Commission is an independent statutory body responsible for
recommending the distribution of Australian Government and State Government funds to
Tasmanian local government authorities. To ensure that the distribution of available funds is
as equitable and contemporary as possible, the Commission continually monitors council
practices and updates assessment methods and data where appropriate.
To provide some structure to updating the distribution methods of the Australian
Government Financial Assistance Grants (FAGs), the Commission operates a triennial review
policy whereby major method changes are introduced only every three years, with data
updates and minor changes applied every year.
Overview of Triennial Review Period (FAGs)
Distribution Action
2015-16 Method Changes + Data Updates
2016-17 Data Updates
2017-18 Data Updates
2018-19 Method Changes + Data Updates
As part of the Commission’s review process, the Commission is reviewing Tourism effects,
and the future of the Commission’s current Tourism Cost Adjustor in light of the loss of a
key data source, bed capacity data previously available from Tiger Tourism.
The Commission has undertaken an internal review of tourism effects and investigated
possible data sources. The Commission has considered these matters and formed a
preliminary view on this matter. However, the Commission wishes to discuss this matter
with councils prior to determining any changes, and the timing of making any future changes
to its Base Grant Model (BGM).

DP17-01 Tourism Impacts and the future of the Tourism Cost Adjustor - STATE GRANTS COMMISSION 4
Tourism Cost Adjustor Background
The State Grants Commission, (the Commission) uses several ‘cost adjustors’ in its Base Grant Model (BGM) to help it determine the appropriate distribution of Financial Assistance
Grants funding provided by the Australian Government amongst Tasmania’s 29 councils. The
Tourism Cost Adjustor is currently used by the Commission and aims to recognise the
relative impact of tourism on council expenditure across the following four expenditure
categories1:
Law, Order & Public Safety;
Planning & Community Amenities;
Waste Management & Environment; and
Recreation & Culture.
The assumption underpinning the Tourism Cost Adjustor is that:
“Councils generally incur additional costs due to tourism that are unrelated to the number of
residents through increased use of council resources and infrastructure”.
The Tourism Cost Adjustor is currently informed by Day-Tripper data sourced from Tourism
Research Australia and bed capacity sourced from Tiger Tourism (Tourism Tasmania)
Tigertour database, as measures of tourism activities. The Tourism Cost Adjustor currently weights these data components as 30% on Day-Tripper data and 70% on Bed Capacity.
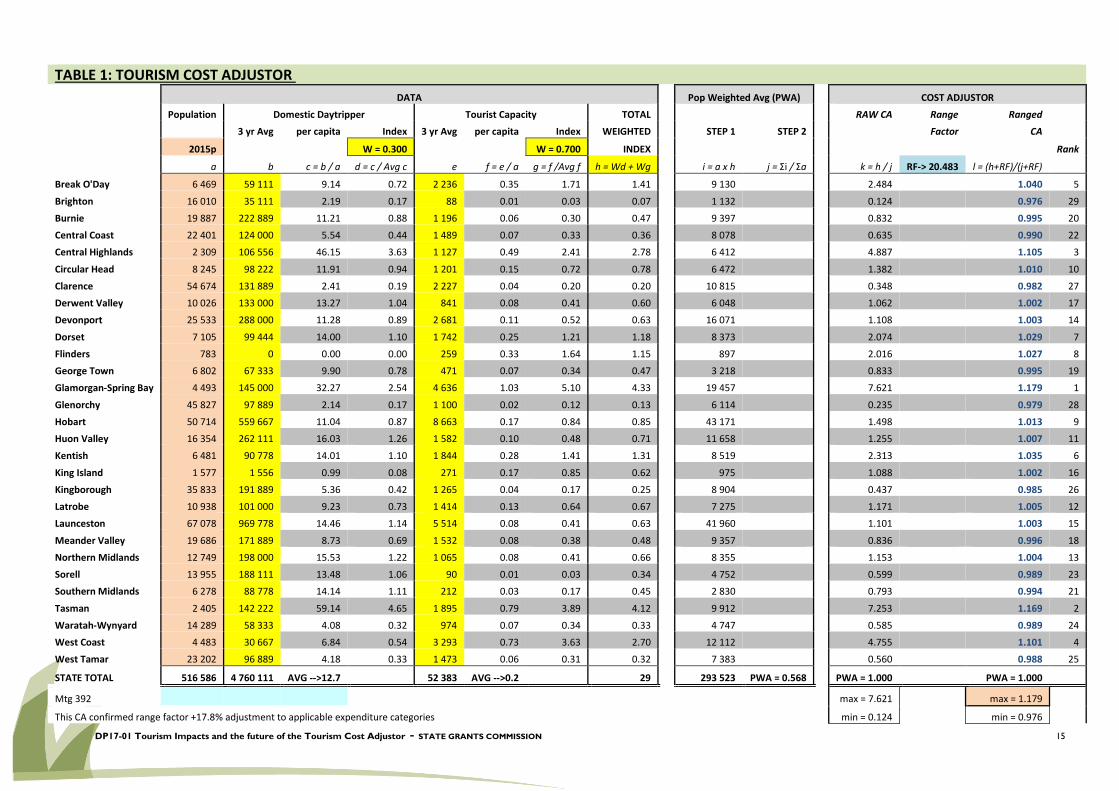
Current Tourism Cost Adjustor
The Tourism Cost Adjustor used for the most recent base grant recommendations
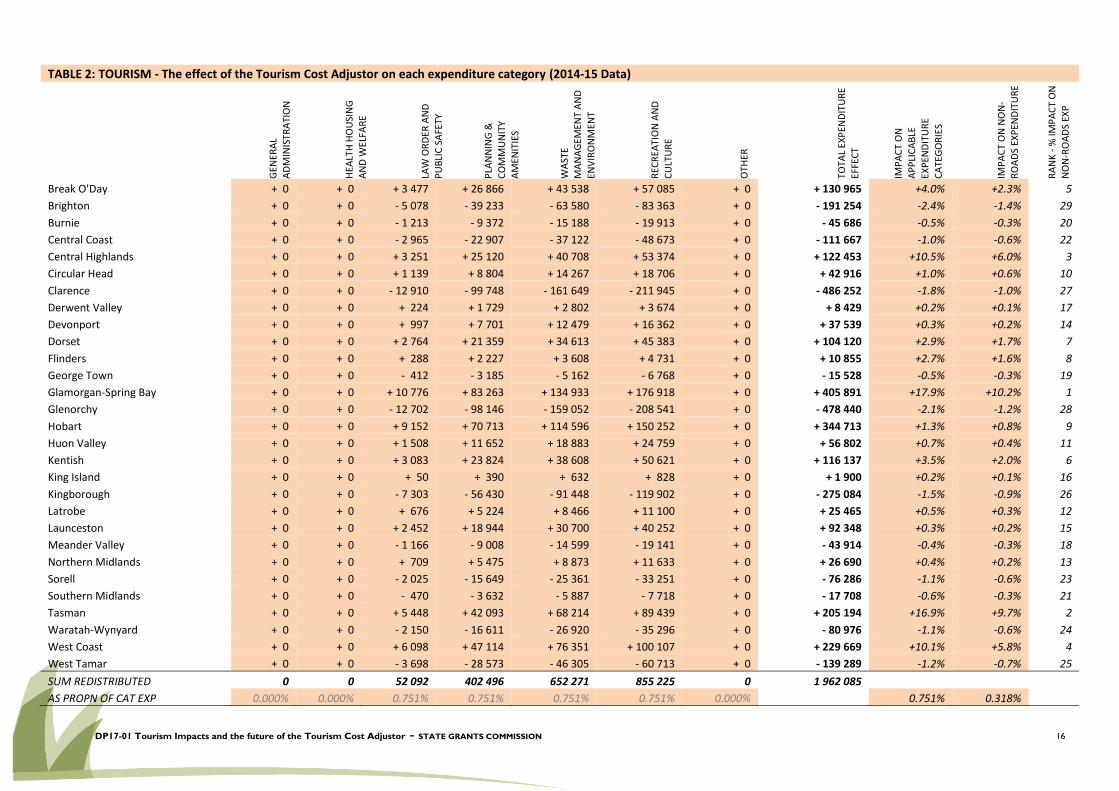
(2016-17 Recommendations) are shown in the Appendix (TABLE 1). The Tourism Cost
Adjustor redistributed $1.96 million in expenditure across all councils in the 2016-17 BGM as
shown in TABLE 2.
The total cumulative redistributive effect of the Commission’s cost adjustors was
$26.3 million in the 2016-17 BGM. That is, the Tourism Cost Adjustor currently accounts
for 7 per cent of the total of all cost adjustors.
1 The Commission uses a total of 11 cost adjustors.
DP17-01 Tourism Impacts and the future of the Tourism Cost Adjustor - STATE GRANTS COMMISSION 5
Glamorgan Spring Bay is currently the most advantaged council (ranked 1) from the Tourism
Cost Adjustor, and received approximately +$406 000 in expenditure, compared to Brighton
(ranked 29) who lost -$191 000 (2016-17 BGM effects).
Bed Capacity Data Issue
As highlighted in the Commission’s Information Paper IP16-02 issued in February 2016,
following the changeover to the National Tourism Online database system in February 2016,
Tiger Tourism has been unable to maintain bed capacity data in the National Tourism Online
system.
This has major ramifications for the future form of the Tourism Cost Adjustor used by the
Commission.
For the 2016-17 Base Grant funding recommendations, the Commission updated the
Daytripper data portion only of the cost adjustor, but froze the Bed Capacity statistics at that
used for the 2015-16 Recommendations (being as at 20 April 2015), as these were regarded
as the last relatively reliable data and which aligned most closely with the financial data
informing the BGM (the 2014-15 CDC data). The decision to freeze the bed capacity statistics
as at data sourced at 20 April 2015 was due to extreme volatility and gaps in bed capacity
data since the move by Tiger Tourism to the national tourism database system. The move
has resulted in the complete loss of confidence in any subsequent reporting of tourism
establishment listings and maintaining any semblance of bed capacity data.
The loss of accurate bed capacity reporting highlights the growing weakness in the current
Tourism Cost Adjustor as it also does not capture the sharing economy’s bed capacity now
being provided to tourists via websites and applications such as Airbnb and Stayz. (There are
no publically available statistics regarding this growing economy).
Day Tripper Data Issues
Statistical/survey data for day trippers across most regions of Tasmania are below the
minimum thresholds for robust analysis2 according to Tourism Research Australia (TRA).
TRA cautions against the use of below threshold statistics for data analysis. Low numbers
bring a higher degree of sensitivity and volatility to any data analysis.
Most annual day tripper data by LGA sourced from TRA contains records marked as having
insufficient information to have a suitable degree of reliability for statistical purposes (due to
data being below the minimum thresholds of 40 000).
To inform the Tourism Cost Adjustor, these warning flag formats are normally turned off to
enable viewing of the underlying statistics, notwithstanding the cautionary notice.
2 This has always been the case and is not a new issue.

DP17-01 Tourism Impacts and the future of the Tourism Cost Adjustor - STATE GRANTS COMMISSION 6
Tourism Impacts Review
In light of the loss of the bed capacity statistic, the Commission has undertaken a review of the Tourism Cost Adjustor.
The Review included analysis of both the existing relationships between current tourism statistics and also investigated other publically available data source options which could be
analysed at a municipal level for informing the Tourism Cost Adjustor. Public Toilets facilities
and Total nights stayed per municipality from the Tourism Visitors Survey database were
included in the analysis. The analysis looked for any linear correlations between the four
expenditure categories that the Tourism Cost Adjustor applies and the variables including:
Day-Tripper data;
Bed Capacity data;
Public toilet facilities per municipality (from http://toiletmap.gov.au);
‘Total nights stayed per municipality’ (from the Tourism Visitors Survey database: http://tvsanalyser.com.au); and
the Tourism Cost Adjustor.
The analysis also considered several other potential data sources but these were deemed not
viable alternatives due to limiting factors such as inability to quantify impact, inability to source by municipality, or data studies being only at a point of time and not ongoing data collection
sources. These were as follows:
The number of annual, monthly and weekly events (from
http://www.discovertasmania.com.au/what-to-do/events and other sources) per
municipality were considered as a tourism measure, but there was no way to quantify
the impact that each event had on municipalities such as crowd numbers, revenue
generated and accommodation;
Hotel occupancy (from http://australianhotels.asn.au/wp-content/uploads/Accommodation-Occupancy-Statistics-June-2016.pdf) was also
considered as a tourism measure, but the only relevant data was compiled on a North,
North-West and South regional basis; and
The tourism tracker created by UTAS Director of Tourism Research, Dr. Anne Hardy,
who tracked 470 tourists visiting Tasmania for different reasons such as food & wine,
history & heritage, and the Tasmanian Wilderness (from
http://www.themercury.com.au/lifestyle/visitor-tracker-project-reveals-tourism-
DP17-01 Tourism Impacts and the future of the Tourism Cost Adjustor - STATE GRANTS COMMISSION 7
myths/news-story/08ebe13a7cbd9ce168c959d074e3ed17). This was a one-off point in
time study, the data only covers one specific time of the year, is not an ongoing series
of data collection and could be biased towards a demographic who are more likely to
undergo this sort of experiment.
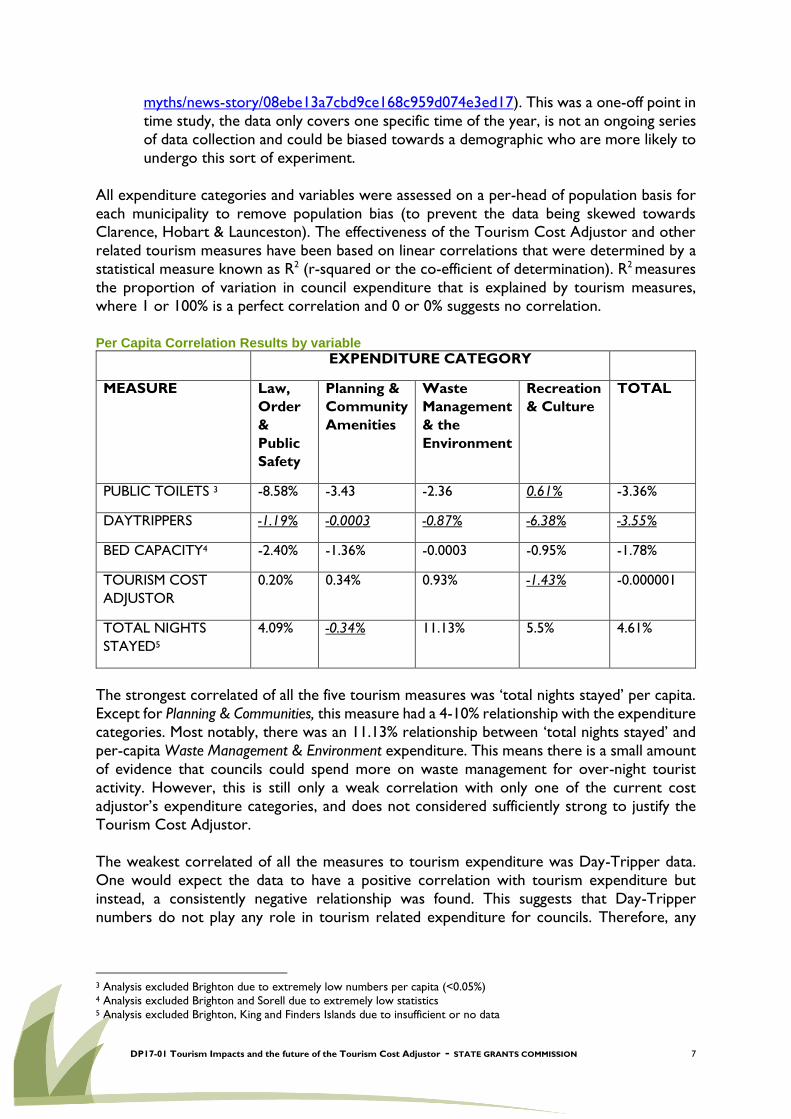
All expenditure categories and variables were assessed on a per-head of population basis for
each municipality to remove population bias (to prevent the data being skewed towards Clarence, Hobart & Launceston). The effectiveness of the Tourism Cost Adjustor and other
related tourism measures have been based on linear correlations that were determined by a
statistical measure known as R2 (r-squared or the co-efficient of determination). R2 measures
the proportion of variation in council expenditure that is explained by tourism measures,
where 1 or 100% is a perfect correlation and 0 or 0% suggests no correlation.
Per Capita Correlation Results by variable
EXPENDITURE CATEGORY
MEASURE Law,
Order
&
Public
Safety
Planning &
Community
Amenities
Waste
Management
& the
Environment
Recreation
& Culture
TOTAL
PUBLIC TOILETS 3 -8.58% -3.43 -2.36 0.61% -3.36%
DAYTRIPPERS -1.19% -0.0003 -0.87% -6.38% -3.55%
BED CAPACITY4 -2.40% -1.36% -0.0003 -0.95% -1.78%
TOURISM COST
ADJUSTOR
0.20% 0.34% 0.93% -1.43% -0.000001
TOTAL NIGHTS
STAYED5
4.09% -0.34% 11.13% 5.5% 4.61%
The strongest correlated of all the five tourism measures was ‘total nights stayed’ per capita.
Except for Planning & Communities, this measure had a 4-10% relationship with the expenditure
categories. Most notably, there was an 11.13% relationship between ‘total nights stayed’ and
per-capita Waste Management & Environment expenditure. This means there is a small amount
of evidence that councils could spend more on waste management for over-night tourist
activity. However, this is still only a weak correlation with only one of the current cost
adjustor’s expenditure categories, and does not considered sufficiently strong to justify the
Tourism Cost Adjustor.
The weakest correlated of all the measures to tourism expenditure was Day-Tripper data.
One would expect the data to have a positive correlation with tourism expenditure but
instead, a consistently negative relationship was found. This suggests that Day-Tripper
numbers do not play any role in tourism related expenditure for councils. Therefore, any
3 Analysis excluded Brighton due to extremely low numbers per capita (<0.05%) 4 Analysis excluded Brighton and Sorell due to extremely low statistics 5 Analysis excluded Brighton, King and Finders Islands due to insufficient or no data

DP17-01 Tourism Impacts and the future of the Tourism Cost Adjustor - STATE GRANTS COMMISSION 8
continuation of a Tourism Cost Adjustor based on Day Tripper data alone would represent
a backward move rather than a methodology improvement.
Tourism & Expenditure
The scatter plot above shows the correlation found between the total amount spent in the
tourism expenditure related categories of (Law, Order & Public Safety, Planning & Community
Amenities, Waste Management and the Environment, and Recreation & Culture per capita on
the horizontal axis and the Tourism Cost Adjustor for each municipality on the vertical axis.
The straight horizontal line indicating no relationship between the Tourism Cost Adjustor
ranking and the total of all four expenditure categories combined.
Councils with high cost adjustors only spend a fraction average more per capita on tourism
related categories than other councils. Indeed, some highly ranked councils were actually found to spend less per capita in these categories than lower Tourism Cost Adjustor ranked
councils.
The lack of correlation (listed as 0.000001 or 0.0001%) shows that no specific tourism
expenditure category does a good job at explaining the variation of tourism activity and that
the Tourism Cost Adjustor does not convincingly reflect per capita municipal costs.

DP17-01 Tourism Impacts and the future of the Tourism Cost Adjustor - STATE GRANTS COMMISSION 9
The Tourism Cost Adjustor: Conclusions and the future Based on the analysis done, the Review concluded as follows:
There is no significant evidence to suggest that tourism is such a
significant portion of municipality expenditure that it merits a cost
adjustor.
No positive correlation between day-tripper numbers per municipality
and municipal tourism expenditure was found.
The Tourism Cost Adjustor Review found that even with day-tripper data, Tiger Tourism bed
capacity data, public toilet data and total nights stayed data, which all link to, or could be
linked to, the Tourism Cost Adjustor as a barometer for tourist activity in Tasmania’s
municipalities, there was not significant evidence to suggest that tourism data is correlated
with municipality expenditure sufficiently to merit a cost adjustor.
The Review also found an inverse relationship between Day-Tripper statistics and all Tourism
Cost Adjustor expenditure categories, meaning that the more day trippers a municipality has,
the less per capita expenditure occurs. Regardless of the reasons for such an inverse
relationship, the conclusion is that Day-Tripper data would be a worse indicator for the
impact of tourists on council expenditure than having no Tourism Cost Adjustor.
Based on the findings of the Review, inverse relationship with Day Tripper data, the absence
of any viable alternative data sources for an alternative form of a tourism cost adjustor, and
lack of significant correlation between any measures and expenditure categories (with the
exception of waste management) the Commission needs to consider the ongoing use of the
Tourism Cost Adjustor in its Base Grant Model.

DP17-01 Tourism Impacts and the future of the Tourism Cost Adjustor - STATE GRANTS COMMISSION 10
Commission Preliminary Decision
Due to the loss of a primary data source (bed capacity data), the absence of viable data source
alternatives, and the weak correlations with the current expenditure categories, the
Commission has made a preliminary decision to cease the practice of having any form of a
Tourism Cost Adjustor at the conclusion of the 2018-19 Triennium.
Timing of Decision Implementation: Options
The Commission uses a Triennium approach, whereby major methodology changes are only
implemented at the end of the Triennium.
The current triennium is not due to finish until 2019 (i.e. have first application to the 2018-19
Grant recommendations).
Options for the operation of the Tourism Cost Adjustor over the remainder of the
2018-19 Triennium considered by the Commission were as follows:
1. freeze the existing Tourism Cost Adjustor data sources at their current dates for the
remainder of this Triennium i.e. Bed Capacity Data is frozen at the data as at 20 April
2015 and the DayTripper data is frozen as at the 2015 data for the remainder of the
triennium until the decision regarding the future of the Tourism Cost Adjustor can be
implemented (from the 2018-19 Grant Recommendations);
2. freeze the Bed Capacity Data at the data as at 20 April 2015 and continue to update
the DayTripper data for the remainder of the triennium until the decision regarding
the future of the Tourism Cost Adjustor can be implemented (from the 2018-19
Grant Recommendations).; or
3. Cease the use of the Tourism Cost Adjustor immediately i.e. from the 2017-18 grant
recommendations (during the current triennium).
In light of the data issues informing the current Tourism Cost Adjustor, the Commission has
made a preliminary determination on how it proposes to manage the Tourism Cost Adjustor
during the remainder of the triennium.
Commission Preliminary Decision
The Commission has decided to freeze the existing Tourism Cost Adjustor data sources at
their current dates for the remainder of this Triennium i.e. Bed Capacity Data is frozen at the
data as at 20 April 2015 and the DayTripper data is frozen as at the 2015 data for the
remainder of the triennium until the Tourism Cost Adjustor ceases to apply (from the
2018-19 Grant Recommendations) (Option 1).
The Commission rejected Option 2 as it results in updating the current cost adjustor with
data that has been shown to be inverse to the intention of the cost adjustor, and rejected
Option 3 as it is contrary to the Commission’s triennium principle for introducing
methodology changes and would not permit council input to the methodology change.
DP17-01 Tourism Impacts and the future of the Tourism Cost Adjustor - STATE GRANTS COMMISSION 11
The above Commission decisions are currently preliminary decisions. The Commission seeks
council’s views and comments on the proposal to cease the Tourism Cost Adjustor at the
conclusion of the current Triennium and proposed freezing of all input data for the remainder
of the 2018-19 Triennium.
The Commission seeks council views on this approach prior to the Commission making a final
decision regarding the Tourism Cost Adjustor.
DP17-01 Tourism Impacts and the future of the Tourism Cost Adjustor - STATE GRANTS COMMISSION 12
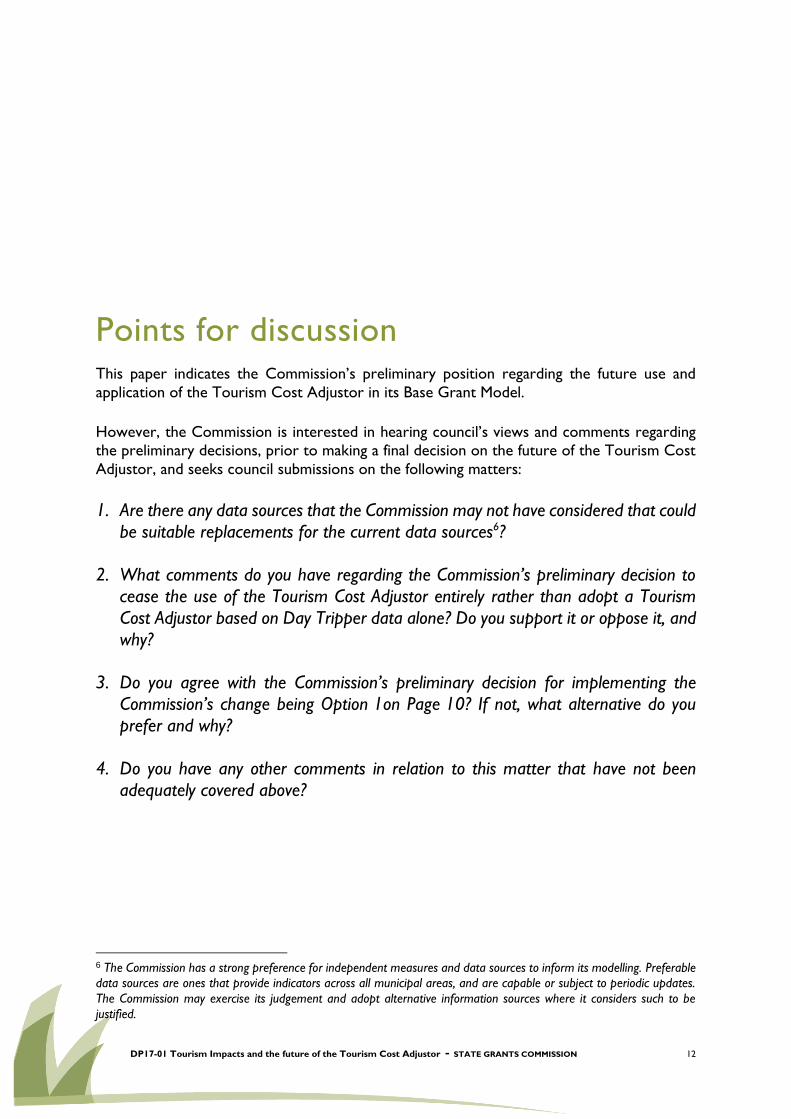
Points for discussion This paper indicates the Commission’s preliminary position regarding the future use and
application of the Tourism Cost Adjustor in its Base Grant Model.
However, the Commission is interested in hearing council’s views and comments regarding
the preliminary decisions, prior to making a final decision on the future of the Tourism Cost
Adjustor, and seeks council submissions on the following matters:
1. Are there any data sources that the Commission may not have considered that could
be suitable replacements for the current data sources6?
2. What comments do you have regarding the Commission’s preliminary decision to
cease the use of the Tourism Cost Adjustor entirely rather than adopt a Tourism
Cost Adjustor based on Day Tripper data alone? Do you support it or oppose it, and
why?
3. Do you agree with the Commission’s preliminary decision for implementing the
Commission’s change being Option 1on Page 10? If not, what alternative do you
prefer and why?
4. Do you have any other comments in relation to this matter that have not been
adequately covered above?
6 The Commission has a strong preference for independent measures and data sources to inform its modelling. Preferable
data sources are ones that provide indicators across all municipal areas, and are capable or subject to periodic updates. The Commission may exercise its judgement and adopt alternative information sources where it considers such to be
justified.

DP17-01 Tourism Impacts and the future of the Tourism Cost Adjustor - STATE GRANTS COMMISSION 13
Submissions and timeframes The Commission invites comments and input from councils on the issues raised within this discussion
paper. However, council input need not be confined to the issues identified. Councils should feel free
to provide comments on other pertinent issues regarding the Commission assessment methodologies.
Submissions should be forwarded to the Commission Secretary, Ms Pam Marriott as follows:
By post: Executive Officer
State Grants Commission
GPO Box 147
HOBART TAS 7001
By email: [email protected]
Further details regarding the annual assessments can be found in the 2015-16 Annual Report that is
available on the Commission website. Go to the Department of Treasury and Finance webpage
(www.treasury.tas.gov.au) and click the State Grants Commission ‘Quick Link’, then click Publications.
Submissions close on Friday 27 January 2017.
Any queries should be directed to the Executive Officer on (03) 6166 4274.
2017 Hearings and Visits
The Commission will provide councils with an opportunity to discuss this paper and any other
concerns during the 2017 Hearings and Visits program that will occur over February - March 2017.

DP17-01 Tourism Impacts and the future of the Tourism Cost Adjustor - STATE GRANTS COMMISSION 14
Appendices
DP17-01 Tourism Impacts and the future of the Tourism Cost Adjustor - STATE GRANTS COMMISSION 15
TABLE 1: TOURISM COST ADJUSTOR
DATA Pop Weighted Avg (PWA) COST ADJUSTOR
Population Domestic Daytripper Tourist Capacity TOTAL RAW CA Range Ranged
3 yr Avg per capita Index 3 yr Avg per capita Index WEIGHTED STEP 1 STEP 2 Factor CA
2015p W = 0.300 W = 0.700 INDEX Rank
a b c = b / a d = c / Avg c e f = e / a g = f /Avg f h = Wd + Wg i = a x h j = Σi / Σa k = h / j RF-> 20.483 l = (h+RF)/(j+RF)
Break O'Day 6 469 59 111 9.14 0.72 2 236 0.35 1.71 1.41 9 130 2.484 1.040 5
Brighton 16 010 35 111 2.19 0.17 88 0.01 0.03 0.07 1 132 0.124 0.976 29
Burnie 19 887 222 889 11.21 0.88 1 196 0.06 0.30 0.47 9 397 0.832 0.995 20
Central Coast 22 401 124 000 5.54 0.44 1 489 0.07 0.33 0.36 8 078 0.635 0.990 22
Central Highlands 2 309 106 556 46.15 3.63 1 127 0.49 2.41 2.78 6 412 4.887 1.105 3
Circular Head 8 245 98 222 11.91 0.94 1 201 0.15 0.72 0.78 6 472 1.382 1.010 10
Clarence 54 674 131 889 2.41 0.19 2 227 0.04 0.20 0.20 10 815 0.348 0.982 27
Derwent Valley 10 026 133 000 13.27 1.04 841 0.08 0.41 0.60 6 048 1.062 1.002 17
Devonport 25 533 288 000 11.28 0.89 2 681 0.11 0.52 0.63 16 071 1.108 1.003 14
Dorset 7 105 99 444 14.00 1.10 1 742 0.25 1.21 1.18 8 373 2.074 1.029 7
Flinders 783 0 0.00 0.00 259 0.33 1.64 1.15 897 2.016 1.027 8
George Town 6 802 67 333 9.90 0.78 471 0.07 0.34 0.47 3 218 0.833 0.995 19
Glamorgan-Spring Bay 4 493 145 000 32.27 2.54 4 636 1.03 5.10 4.33 19 457 7.621 1.179 1
Glenorchy 45 827 97 889 2.14 0.17 1 100 0.02 0.12 0.13 6 114 0.235 0.979 28
Hobart 50 714 559 667 11.04 0.87 8 663 0.17 0.84 0.85 43 171 1.498 1.013 9
Huon Valley 16 354 262 111 16.03 1.26 1 582 0.10 0.48 0.71 11 658 1.255 1.007 11
Kentish 6 481 90 778 14.01 1.10 1 844 0.28 1.41 1.31 8 519 2.313 1.035 6
King Island 1 577 1 556 0.99 0.08 271 0.17 0.85 0.62 975 1.088 1.002 16
Kingborough 35 833 191 889 5.36 0.42 1 265 0.04 0.17 0.25 8 904 0.437 0.985 26
Latrobe 10 938 101 000 9.23 0.73 1 414 0.13 0.64 0.67 7 275 1.171 1.005 12
Launceston 67 078 969 778 14.46 1.14 5 514 0.08 0.41 0.63 41 960 1.101 1.003 15
Meander Valley 19 686 171 889 8.73 0.69 1 532 0.08 0.38 0.48 9 357 0.836 0.996 18
Northern Midlands 12 749 198 000 15.53 1.22 1 065 0.08 0.41 0.66 8 355 1.153 1.004 13
Sorell 13 955 188 111 13.48 1.06 90 0.01 0.03 0.34 4 752 0.599 0.989 23
Southern Midlands 6 278 88 778 14.14 1.11 212 0.03 0.17 0.45 2 830 0.793 0.994 21
Tasman 2 405 142 222 59.14 4.65 1 895 0.79 3.89 4.12 9 912 7.253 1.169 2
Waratah-Wynyard 14 289 58 333 4.08 0.32 974 0.07 0.34 0.33 4 747 0.585 0.989 24
West Coast 4 483 30 667 6.84 0.54 3 293 0.73 3.63 2.70 12 112 4.755 1.101 4
West Tamar 23 202 96 889 4.18 0.33 1 473 0.06 0.31 0.32 7 383 0.560 0.988 25
STATE TOTAL 516 586 4 760 111 AVG -->12.7 52 383 AVG -->0.2 29 293 523 PWA = 0.568 PWA = 1.000 PWA = 1.000
Mtg 392 max = 7.621 max = 1.179
This CA confirmed range factor +17.8% adjustment to applicable expenditure categories min = 0.124 min = 0.976
DP17-01 Tourism Impacts and the future of the Tourism Cost Adjustor - STATE GRANTS COMMISSION 16
TABLE 2: TOURISM - The effect of the Tourism Cost Adjustor on each expenditure category (2014-15 Data)
GEN
ERA
L A
DM
INIS
TRA
TIO
N
HEA
LTH
HO
USI
NG
A
ND
WEL
FAR
E
LAW
OR
DER
AN
D
PU
BLI
C S
AFE
TY
PLA
NN
ING
&
CO
MM
UN
ITY
AM
ENIT
IES
WA
STE
MA
NA
GEM
ENT
AN
D
ENV
IRO
NM
ENT
REC
REA
TIO
N A
ND
C
ULT
UR
E
OTH
ER
TOTA
L EX
PEN
DIT
UR
E EF
FEC
T
IMP
AC
T O
N
AP
PLI
CA
BLE
EX
PEN
DIT
UR
E
CA
TEG
OR
IES
IMP
AC
T O
N N
ON
-R
OA
DS
EXP
END
ITU
RE
RA
NK
- %
IMP
AC
T O
N
NO
N-R
OA
DS
EXP
Break O'Day + 0 + 0 + 3 477 + 26 866 + 43 538 + 57 085 + 0 + 130 965 +4.0% +2.3% 5
Brighton + 0 + 0 - 5 078 - 39 233 - 63 580 - 83 363 + 0 - 191 254 -2.4% -1.4% 29
Burnie + 0 + 0 - 1 213 - 9 372 - 15 188 - 19 913 + 0 - 45 686 -0.5% -0.3% 20
Central Coast + 0 + 0 - 2 965 - 22 907 - 37 122 - 48 673 + 0 - 111 667 -1.0% -0.6% 22
Central Highlands + 0 + 0 + 3 251 + 25 120 + 40 708 + 53 374 + 0 + 122 453 +10.5% +6.0% 3
Circular Head + 0 + 0 + 1 139 + 8 804 + 14 267 + 18 706 + 0 + 42 916 +1.0% +0.6% 10
Clarence + 0 + 0 - 12 910 - 99 748 - 161 649 - 211 945 + 0 - 486 252 -1.8% -1.0% 27
Derwent Valley + 0 + 0 + 224 + 1 729 + 2 802 + 3 674 + 0 + 8 429 +0.2% +0.1% 17
Devonport + 0 + 0 + 997 + 7 701 + 12 479 + 16 362 + 0 + 37 539 +0.3% +0.2% 14
Dorset + 0 + 0 + 2 764 + 21 359 + 34 613 + 45 383 + 0 + 104 120 +2.9% +1.7% 7
Flinders + 0 + 0 + 288 + 2 227 + 3 608 + 4 731 + 0 + 10 855 +2.7% +1.6% 8
George Town + 0 + 0 - 412 - 3 185 - 5 162 - 6 768 + 0 - 15 528 -0.5% -0.3% 19
Glamorgan-Spring Bay + 0 + 0 + 10 776 + 83 263 + 134 933 + 176 918 + 0 + 405 891 +17.9% +10.2% 1
Glenorchy + 0 + 0 - 12 702 - 98 146 - 159 052 - 208 541 + 0 - 478 440 -2.1% -1.2% 28
Hobart + 0 + 0 + 9 152 + 70 713 + 114 596 + 150 252 + 0 + 344 713 +1.3% +0.8% 9
Huon Valley + 0 + 0 + 1 508 + 11 652 + 18 883 + 24 759 + 0 + 56 802 +0.7% +0.4% 11
Kentish + 0 + 0 + 3 083 + 23 824 + 38 608 + 50 621 + 0 + 116 137 +3.5% +2.0% 6
King Island + 0 + 0 + 50 + 390 + 632 + 828 + 0 + 1 900 +0.2% +0.1% 16
Kingborough + 0 + 0 - 7 303 - 56 430 - 91 448 - 119 902 + 0 - 275 084 -1.5% -0.9% 26
Latrobe + 0 + 0 + 676 + 5 224 + 8 466 + 11 100 + 0 + 25 465 +0.5% +0.3% 12
Launceston + 0 + 0 + 2 452 + 18 944 + 30 700 + 40 252 + 0 + 92 348 +0.3% +0.2% 15
Meander Valley + 0 + 0 - 1 166 - 9 008 - 14 599 - 19 141 + 0 - 43 914 -0.4% -0.3% 18
Northern Midlands + 0 + 0 + 709 + 5 475 + 8 873 + 11 633 + 0 + 26 690 +0.4% +0.2% 13
Sorell + 0 + 0 - 2 025 - 15 649 - 25 361 - 33 251 + 0 - 76 286 -1.1% -0.6% 23
Southern Midlands + 0 + 0 - 470 - 3 632 - 5 887 - 7 718 + 0 - 17 708 -0.6% -0.3% 21
Tasman + 0 + 0 + 5 448 + 42 093 + 68 214 + 89 439 + 0 + 205 194 +16.9% +9.7% 2
Waratah-Wynyard + 0 + 0 - 2 150 - 16 611 - 26 920 - 35 296 + 0 - 80 976 -1.1% -0.6% 24
West Coast + 0 + 0 + 6 098 + 47 114 + 76 351 + 100 107 + 0 + 229 669 +10.1% +5.8% 4
West Tamar + 0 + 0 - 3 698 - 28 573 - 46 305 - 60 713 + 0 - 139 289 -1.2% -0.7% 25
SUM REDISTRIBUTED 0 0 52 092 402 496 652 271 855 225 0 1 962 085
AS PROPN OF CAT EXP 0.000% 0.000% 0.751% 0.751% 0.751% 0.751% 0.000% 0.751% 0.318%
DP17-01 Tourism Impacts and the future of the Tourism Cost Adjustor - STATE GRANTS COMMISSION 17
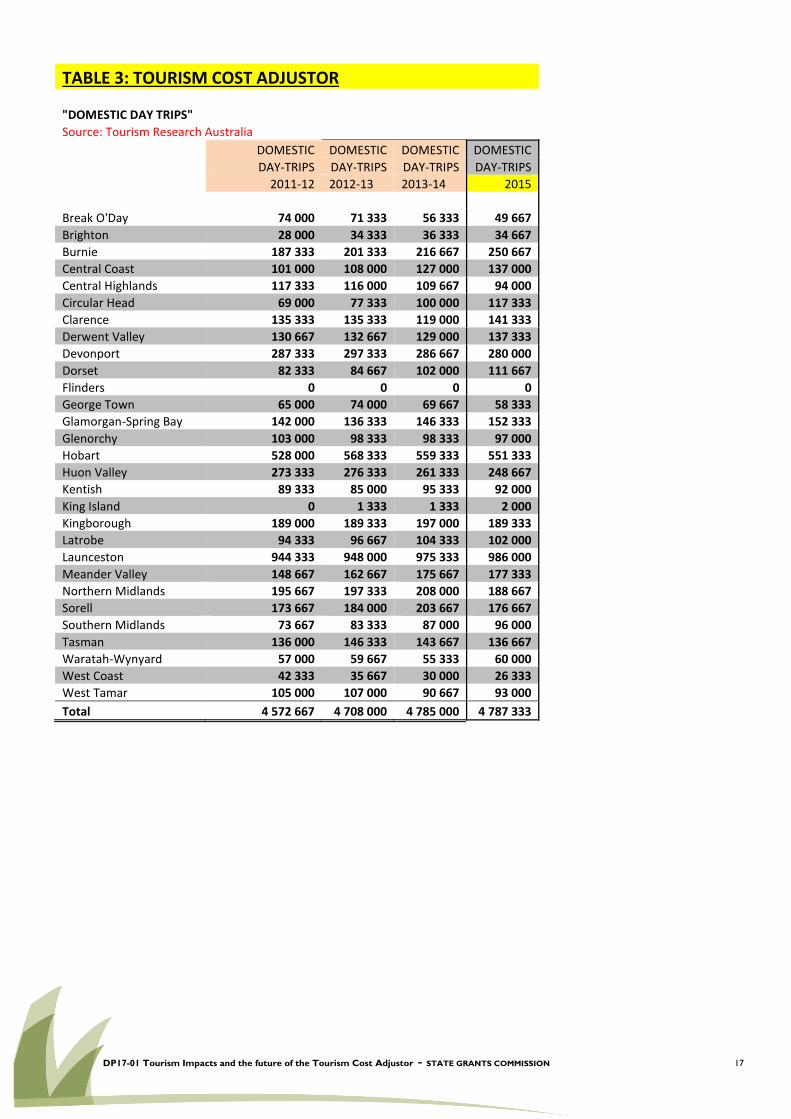
TABLE 3: TOURISM COST ADJUSTOR
"DOMESTIC DAY TRIPS"
Source: Tourism Research Australia
DOMESTIC DOMESTIC DOMESTIC DOMESTIC
DAY-TRIPS DAY-TRIPS DAY-TRIPS DAY-TRIPS
2011-12 2012-13 2013-14 2015
Break O'Day 74 000 71 333 56 333 49 667
Brighton 28 000 34 333 36 333 34 667
Burnie 187 333 201 333 216 667 250 667
Central Coast 101 000 108 000 127 000 137 000
Central Highlands 117 333 116 000 109 667 94 000
Circular Head 69 000 77 333 100 000 117 333
Clarence 135 333 135 333 119 000 141 333
Derwent Valley 130 667 132 667 129 000 137 333
Devonport 287 333 297 333 286 667 280 000
Dorset 82 333 84 667 102 000 111 667
Flinders 0 0 0 0
George Town 65 000 74 000 69 667 58 333
Glamorgan-Spring Bay 142 000 136 333 146 333 152 333
Glenorchy 103 000 98 333 98 333 97 000
Hobart 528 000 568 333 559 333 551 333
Huon Valley 273 333 276 333 261 333 248 667
Kentish 89 333 85 000 95 333 92 000
King Island 0 1 333 1 333 2 000
Kingborough 189 000 189 333 197 000 189 333
Latrobe 94 333 96 667 104 333 102 000
Launceston 944 333 948 000 975 333 986 000
Meander Valley 148 667 162 667 175 667 177 333
Northern Midlands 195 667 197 333 208 000 188 667
Sorell 173 667 184 000 203 667 176 667
Southern Midlands 73 667 83 333 87 000 96 000
Tasman 136 000 146 333 143 667 136 667
Waratah-Wynyard 57 000 59 667 55 333 60 000
West Coast 42 333 35 667 30 000 26 333
West Tamar 105 000 107 000 90 667 93 000
Total 4 572 667 4 708 000 4 785 000 4 787 333

DP17-01 Tourism Impacts and the future of the Tourism Cost Adjustor - STATE GRANTS COMMISSION 18
TABLE 4: TOURIST CAPACITY (Bed Spaces) by LGAs Tiger Tour Database (Real Time Database so no historical data, just a snapshot in time)
Includes 8 Categories: Backpacker/Hostels, Bed and Breakfast, Caravan/Camping, Hotel and Motel, Self Contained, Farm Stay, Residential College, Resort
2008-09 2009-10 2010-11 2011-12 2012-13 2013-14 2015 2016 2014 to 2015
As at 25/3/2009 As at 31/3/2010 As at 18/3/2011 As at 23/3/2012 As at
Mar '13 As at
9 Apr '14
as at
20-Apr-15
as at 15-Feb-16 Difference %
Break O'Day 2 142 2136 2109 2134 2246 2248 2215 2054 - 33 - 1.47%
Brighton 43 107 95 95 89 89 85 85 - 4 - 4.49%
Burnie 889 904 904 1306 1315 1327 946 815 - 381 - 28.71%
Central Coast 1 380 1335 1311 1059 1366 1550 1552 1037 + 2 + 0.13%
Central Highlands 1 217 1255 1242 1213 1106 1101 1173 1045 + 72 + 6.54%
Circular Head 1 591 1477 1506 1539 1159 1221 1223 1268 + 2 + 0.16%
Clarence 1 854 2250 2242 2311 2315 2182 2184 2131 + 2 + 0.09%
Derwent Valley 529 465 466 494 831 844 848 791 + 4 + 0.47%
Devonport 2 548 2478 2451 2697 2691 2681 2672 2662 - 9 - 0.34%
Dorset 1 803 1776 1861 1824 1724 1788 1715 1596 - 73 - 4.08%
Flinders 284 284 276 276 276 292 210 172 - 82 - 28.08%
George Town 485 489 513 471 467 473 473 349 + 0 + 0.00%
Glamorgan-Spring Bay 3 809 3840 3981 4015 4621 4658 4629 3911 - 29 - 0.62%
Glenorchy 1 039 1068 1134 1033 1057 1057 1185 343 + 128 + 12.11%
Hobart 8 079 8293 8443 8481 8639 8925 8425 7979 - 500 - 5.60%
Huon Valley 1 081 1223 1234 1275 1418 1654 1674 1605 + 20 + 1.21%
Kentish 1 675 1965 1972 1958 1836 1847 1848 1746 + 1 + 0.05%
King Island 272 278 258 258 266 272 276 274 + 4 + 1.47%
Kingborough 1 081 1121 1118 1106 1209 1271 1315 1156 + 44 + 3.46%
Latrobe 1 634 1630 1641 1476 1459 1397 1387 403 - 10 - 0.72%
Launceston 5 325 5336 5585 5604 5775 5748 5019 4316 - 729 - 12.68%
Meander Valley 1196 1259 1434 1383 1397 1364 1836 1389 + 472 + 34.60%
Northern Midlands 842 830 938 984 1077 1077 1040 830 - 37 - 3.44%
Sorell 191 127 114 130 100 90 81 33 - 9 - 10.00%
Southern Midlands 217 220 225 225 225 211 201 162 - 10 - 4.74%
Tasman 1761 1831 1901 1864 1858 1894 1934 1752 + 40 + 2.11%
Waratah-Wynyard 1336 1352 1349 964 866 856 1201 1097 + 345 + 40.30%
West Coast 3362 3370 3348 3421 3388 3277 3213 2403 - 64 - 1.95%
West Tamar 1701 1648 1668 1668 1469 1429 1522 1442 + 93 + 6.51%
49 366 50 347 51 319 51 264 52 245 52 823 52 082 44 846 - 741 - 1.40%

DP17-01 Tourism Impacts and the future of the Tourism Cost Adjustor - STATE GRANTS COMMISSION 19