
Discrete dynamic modeling of biological regulatory networks
27
Discrete dynamic modeling of biological regulatory networks Réka Albert Department of Physics, Department of Biology and Huck Institutes for the Life Sciences Pennsylvania State University
Transcript of Discrete dynamic modeling of biological regulatory networks

Discrete dynamic modeling of biological regulatory networks
Réka AlbertDepartment of Physics, Department of Biology and
Huck Institutes for the Life SciencesPennsylvania State University

Life at the cellular level
• Cellular functions rely on the coordinated action of interacting components.
• Proteins – provide structure to cells and tissues– work as molecular motors– sense chemicals in the environment– drive chemical reactions– regulate gene expression
• Interconnections between components are the essence of a living process. David Goodsell/ Science Photo Library
receptor proteins, enzymes, ribosomes, DNA

external signals
gene regulation
protein-protein interactions
GENOME
PROTEOME
Citrate Cycle
METABOLISM
Bio-chemical reactions
Many non-identical elements connected by diverse interactions
signal transduction
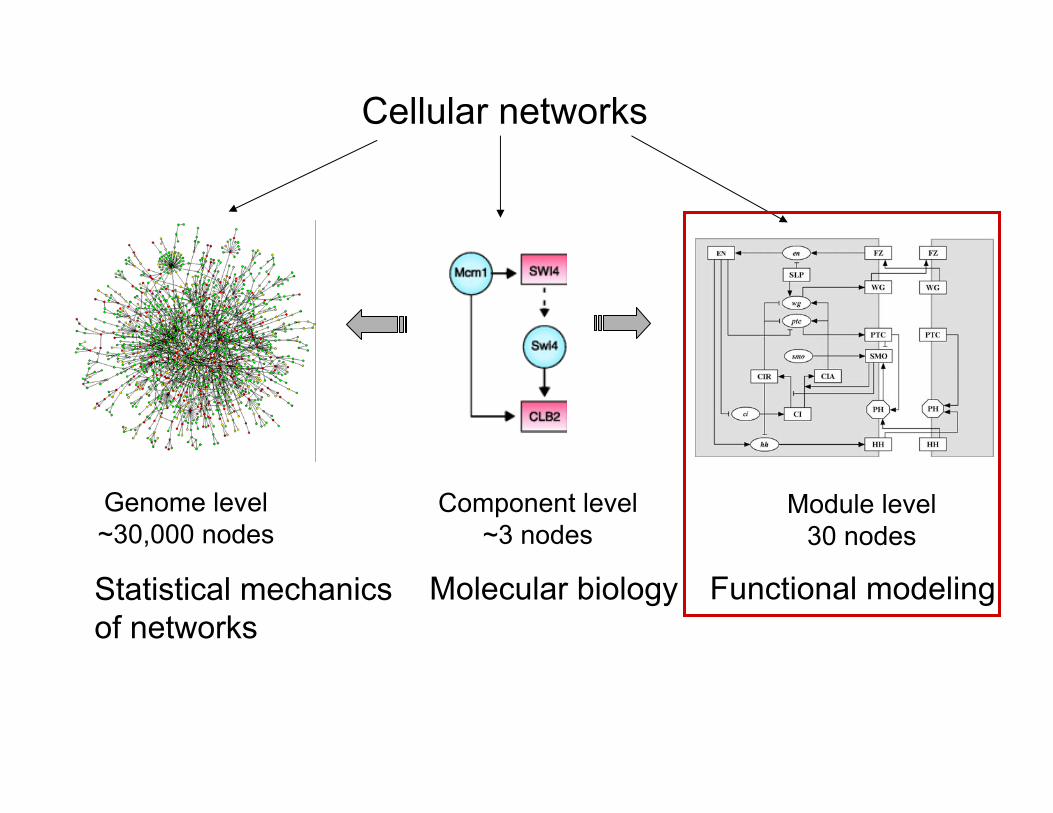
Cellular networks
Genome level~30,000 nodes
Module level30 nodes
Component level~3 nodes
Statistical mechanicsof networks
Functional modelingMolecular biology

Common features of biological systems • functionally diverse elements• time-varying abundances & activities for each element• diverse interactions that form networks• have functions that need to be performed
sensitive to some changes, insensitive/adaptable to othersevolvable, shaped by evolution and natural selection
Network = backbone of processNode states + transfer functions functional state of system
Hypothesis: the organization of the regulatory network is more importantthan the kinetic details of the individual interactions.

From dose-response curves to Boolean switches • X – mRNA
• Y – transcriptional activator
If ν is large, the dose-responsecurve becomes a switch
If Y>KY dX/dt>0 mRNA productionIf Y<KY dX/dt<0 mRNA decay
If activation is below threshold,mRNA can decay.
Boolean simplification:X* = YActivation: If Y=ON X*=ONDecay: If Y= OFF X*=OFF
* denotes the next state
Hill function

Implementing time in discrete models
1. Synchronous models• The state of each node is updated simultaneously at
multiples of a common time step.• Underlying assumption: the timescales of all synthesis and
decay processes are similar
2. Asynchronous modelsThe state of each node is updated individually
Implementation used here: • At each time step randomly select a permutation of the
nodes and update them in that order.
Synchronous models have deterministic state transitions,asynchronicity introduces stochasticity (update order dependence) in the dynamics.

Modeling drought signaling in plants
Phenomenon: abscisic acid induced closure of plant stomata
Hypotheses: network inference from indirect informationprotein activity is switch-like
Validation: reproduces known wild type and disrupted behavior.Explored: disruptions
changes in initial conditionschanges in timing
Insight: variability in timing and initial conditions does not matter65% of perturbations have no negative effectidentified critical perturbations
S. Li, S. Assmann and R. Albert, PLoS Biology 4, e312 (2006).
ABA

CO2 H2O
Stomatal sizes are determined by the turgor (fullness) of the guard cells.
During drought conditions plants synthesize a hormone called abscisic acid (ABA) that initiates a signal transduction network to close stomata.
How is this crucial process being orchestrated, and how is its sensitivity and reliability maintained?
The exchange of O2 and CO2 in plants occurs through stomata.
90% of the water taken up by a plant is lost in transpiration.
Stomata and guard cells

• Genetic & pharmacological perturbations of putative mediatorsCompare input - output (ABA- aperture change) relationships in normal and perturbed plants
• Scarce biochemical evidence for interaction
Experimental observations mainly indirect
ABA Closure
K+ effluxCa2+c
increase
membrane depolarizationNO, S1P, IP3
ABI1

Network construction from indirect evidence
– nodes: all proteins, molecules, ion channels implicated in the process– compress biological information into activation or inhibition– hypothesis: indirect causal relationships and processes correspond to
paths ABA ion flow, ABA Sph kinase activity
– activating or inhibiting effects on processes represented as intersection of two paths SphK (ABA closure)
Need to determine the closest regulator and target of each node
interaction Node/Process BNode A
Arabidopsispromotes SphKABA
Arabidopsispartially promotes ABA → AnionEMSphK
Commelinacommunispromotes ABA → closurePLC
species

Network reductionFind the most parsimonious (least redundant) network that incorporates allnodes and known processes. • Introduce intermediary nodes• Contract intermediary nodes• Review and revise
General algorithm: binary transitive reduction with critical edges, pseudo-vertex collapse, implemented as NET-SYNTHESIS
R. Albert, B. DasGupta et al, Journ. Comp Biology 14, 927 (2007).
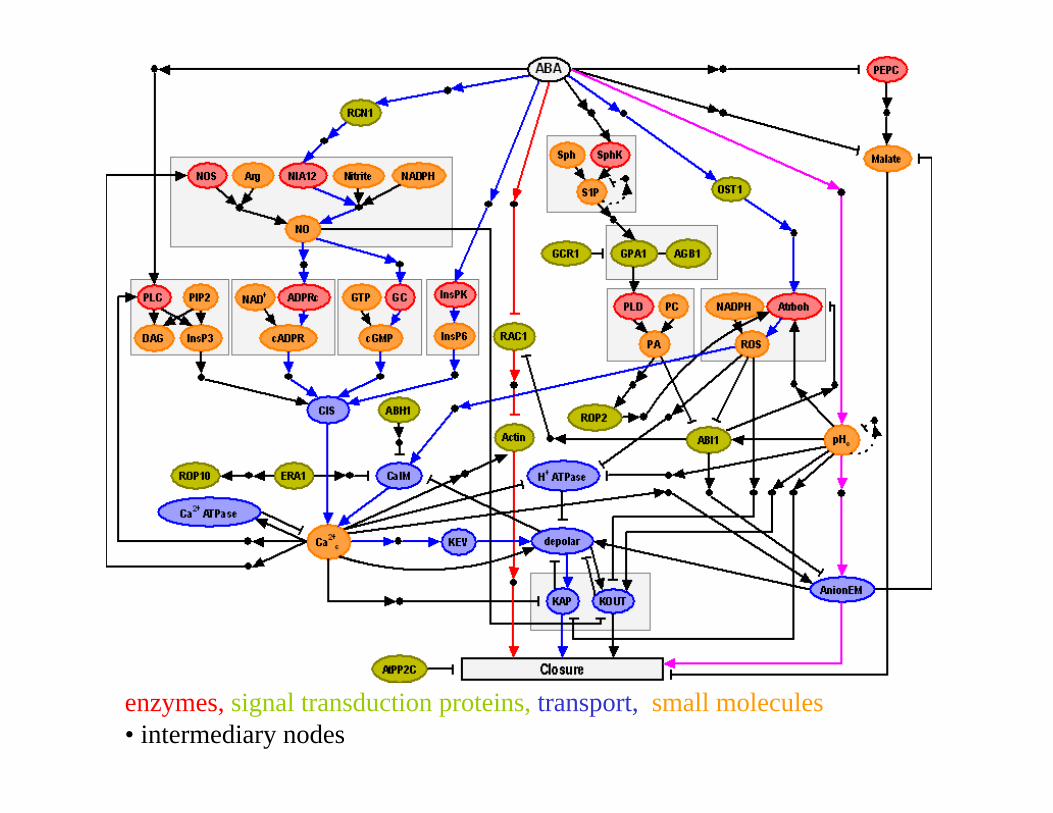
enzymes, signal transduction proteins, transport, small molecules• intermediary nodes

Asynchronous Boolean model
States: 1 = active/high/open,0 = inactive/low/closed
NOT (inhibitors), AND (conditional activation), OR (independent activation)
Ca2+c* = (CaIM or CIS) and not Ca2+ ATPase
Closure* = (KOUT or KAP) and AnionEM and Actin and not Malate
10,000 replicate simulations with randomly selected initial condition (except for ABA), random update order at each timestep.
Output: frequency of closure=1 state

Signal transduction is resilient to perturbations
Normal response to ABA stimulus.
ABI1 knockout mutantsrespond faster.
Perturbations in Ca2+ leadto slower response.
Perturbations in pH lead to decreased sensitivity.
Surprising prediction: Ca2+ disruption has less severe effects than pHc disruption.
0%
20%
40%
0 1 2 3 4 5 6 7 8
Time Steps
Perc
enta
0%
20%
40%
60%
80%
100%
0 1 2 3 4 5 6 7
Time Steps
Perc
enta
ge o
f Clo
sure

Experimental validation
Normal: “open” and“closed” statedistinguishable
pHc disrupted: “open”and “closed” stateindistinguishable
Ca2+ disrupted: “open”and “closed” state
distinguishable
Aperture in µm
Per
cent
age

Discrete model of T cell survivalPhenomenon: survival of cytotoxic T cells in T-LGL leukemiaConstructed: survival signaling network inside T- LGL cellsHypotheses: discrete states, switch-like state changesValidation: reproduces known deregulations and known key mediators
Predicts: minimal initial condition necessary for T-LGL statemanipulations that ensure apoptosis of T-LGL cells additional deregulations
Predictions were validated experimentally
Implications: identifying therapeutic targets for T-LGL leukemiatumor and cancer vaccine development
J. R. Zhang, M. V. Shah, J. Yang, S. B. Nyland, X. Liu, J. K. Yun, R. Albert, T. P.Loughran, PNAS 105, 16308 (2008).
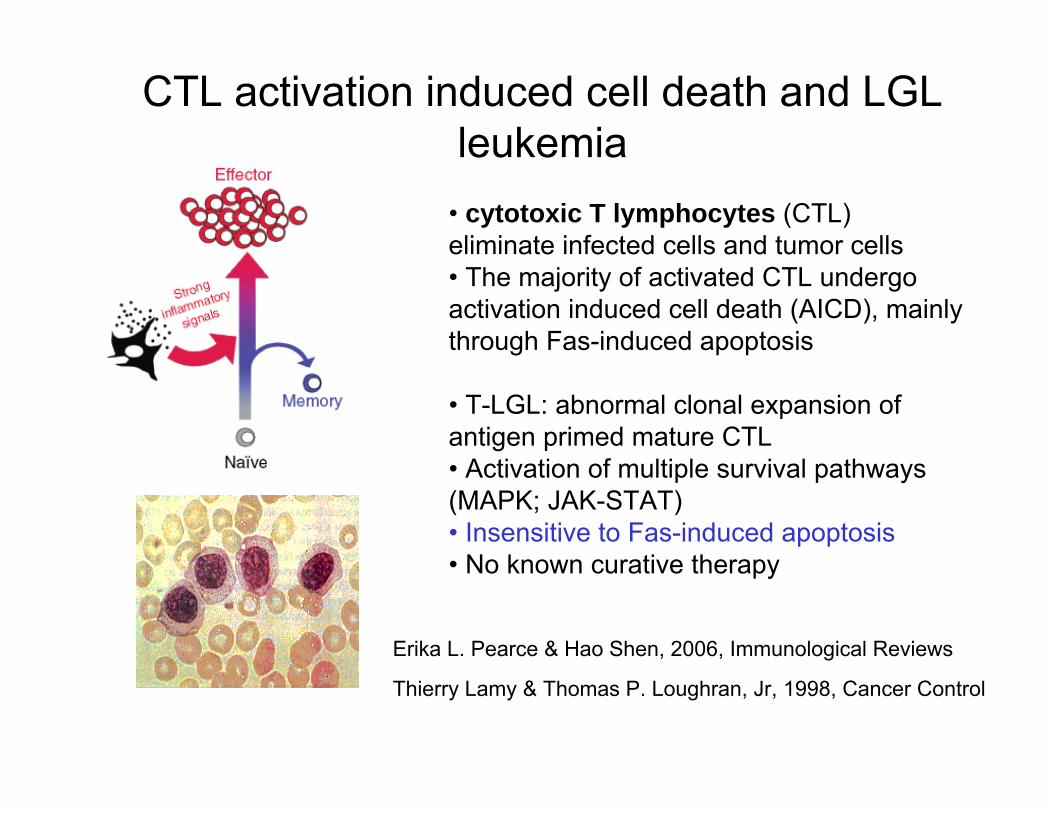
CTL activation induced cell death and LGL leukemia
• cytotoxic T lymphocytes (CTL) eliminate infected cells and tumor cells• The majority of activated CTL undergo activation induced cell death (AICD), mainly through Fas-induced apoptosis
• T-LGL: abnormal clonal expansion of antigen primed mature CTL• Activation of multiple survival pathways (MAPK; JAK-STAT)• Insensitive to Fas-induced apoptosis• No known curative therapy
Erika L. Pearce & Hao Shen, 2006, Immunological Reviews
Thierry Lamy & Thomas P. Loughran, Jr, 1998, Cancer Control

General CTL activation‐AICD
network (extracted from
literature)
General CTL activation‐AICD
network (extracted from
literature)
Augmented T‐LGL CTL survival network
Augmented T‐LGL CTL survival network
Known deregulated components in T‐LGL and related pathways
T‐LGL CTL survival network
T‐LGL CTL survival network
NET‐SYNTHESIS (a signaling network inference and simplification tool)
Discrete dynamic model
Discrete dynamic model
Reveal possible causes of the pathway abnormalities
Reveal possible causes of the pathway abnormalities
Identify key survival
mediators
Identify key survival
mediators
Strategy

T-LGL survival signaling network
Rectangle: intracellular; ellipse: extracellular; diamond: receptor.Upregulated, downregulated, deregulated node; Activation, inhibition edge
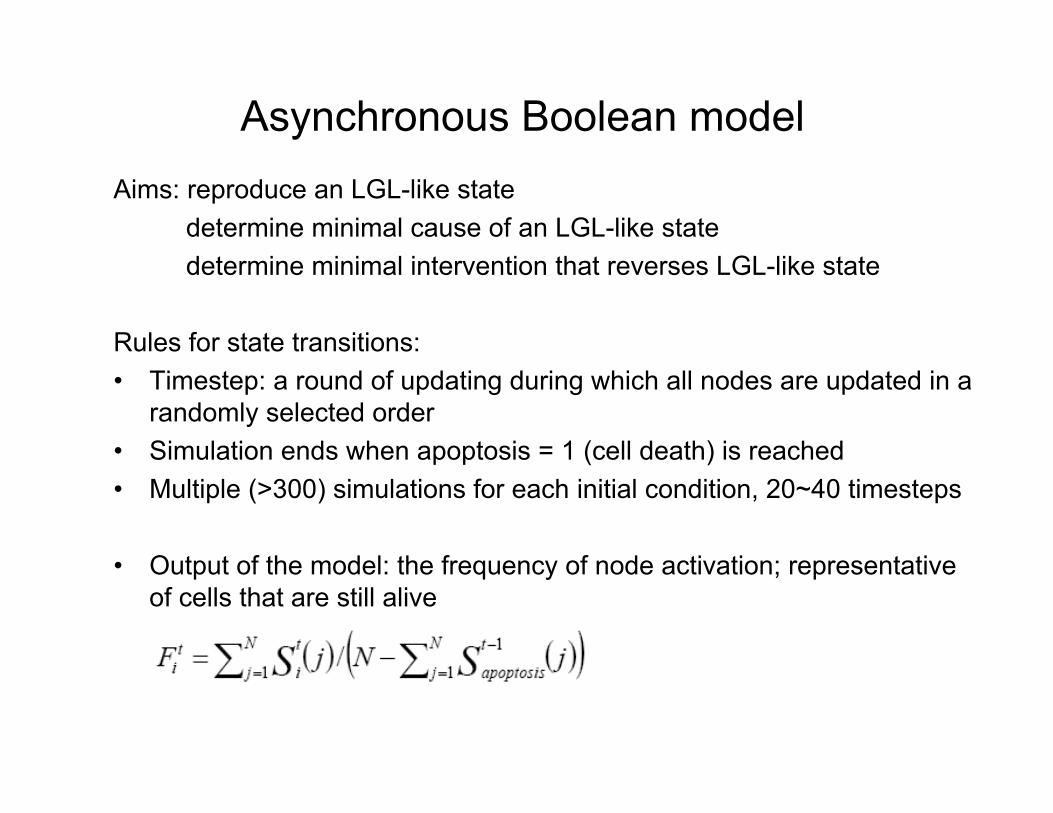
Asynchronous Boolean modelAims: reproduce an LGL-like state
determine minimal cause of an LGL-like statedetermine minimal intervention that reverses LGL-like state
Rules for state transitions: • Timestep: a round of updating during which all nodes are updated in a
randomly selected order• Simulation ends when apoptosis = 1 (cell death) is reached• Multiple (>300) simulations for each initial condition, 20~40 timesteps
• Output of the model: the frequency of node activation; representative of cells that are still alive

Determined the causal hierarchy within the known deregulations
Overexpression of IL15 and PDGF can cause all known deregulations.
Upregulated, downregulated in LGL Positive, negative causal effect

Reproduce a T-LGL-like state
Minimum condition: IL-15 constantly ON, PDGF intermittently ON, Stimuli initially ON.• Suggestive of inflammation during infection• Provision of IL-15 and PDGF may generate long-lived CTL for the virus and cancer vaccines.
C
Apoptosis stabilizes at OFF in a subsetof simulations, JAK upregulated, IL-2 and proliferation downregulated.

Identify key mediators of T-LGL survival• Identify nodes that stabilize when a T-LGL-like state is achieved• Alter the node state and track the change of apoptosis frequency• Key mediator: altering its state causes total apoptosis.• Identified: SPHK1, NFκB, S1P, SOCS, GAP, BID and IL2RB
Validation: NFκB constitutivelyactive in T-LGL
Validation: NFκB inhibition induces apoptosis in T-LGL
Model: NFκB stabilizes at ON,setting it OFF causes total apoptosis

Identify additional deregulations• Model: T-bet needs to be constitutively activated concurrently
with NFκB activation to reproduce the low IL-2 production phenotype in leukemic T-LGL
• Experimental validation: T-bet overexpressed and highly active in T-LGL

Lessons learned
• Network allows the logical organization of disparate information into a coherent whole
• Network-based discrete dynamic model • enables ranking of most important components and interactions• has predictive value - corrections to conventional wisdom • allows discovery of new strategies
• Methodology can be refined iteratively with experiments
• The topology of the network of interactions plays a determinant role in the system's behavior

Acknowledgements
Alfred P. Sloan FoundationNSF, NIHUS Dept. of Agriculture
Song LiRanran ZhangJuilee Thakar Assieh Saadatpour –MoghaddamColin CampbellZhongyao SunRuisheng WangSuann Yang
Collaborators:Sarah Assmann (PSU Biology)Eric Harvill (PSU Vet. Sci.) and his groupThomas Loughran (HMC) and his groupBhaskar DasGupta