Discovery of medicinal molecules based on similarity...
8
Discovery of medicinal molecules based on similarity networks and metrics ICS5200 - Dissertation Progress Report Joseph D’Emanuele Intelligent Computer Systems Faculty of ICT University of Malta [email protected] ABSTRACT Computer-aided drug design (CADD) projects start with a computational search for active molecules that form a com- plex with a protein to trigger a response or block its func- tion. This report presents the initial investigation being car- ried out to build a multi-level and scalable approach where multiple small-molecules and proteins similarity networks are bridged via known bindings. Through these networks, we envision a research to be able to discover new putative small-molecule binders for a given protein target, and to find other proteins which are likely to interact with a given small-molecule. Amongst other things, the latter is also im- portant for side-effect prediction. A software tool which aids visualization of these networks will also be built. Keywords AI; Big Data; Chemoinformatics; Similarity networks; Vir- tual Screening 1. INTRODUCTION We take medicines to cure diseases and to ease symptoms of an illness. In essence, medicines, or drugs, are compounds that interact with a biological system to produce a biolog- ical response. This interaction happens at the molecular level of living beings. It involves a ligand, typically a small- molecule, to bind with a targeted protein, a macromolecule that execute a particular cellular function. When this bind- ing occurs, it triggers (or blocks) a biological response. Drug discovery and development is a lengthy, laborious, and expensive process. For some disease areas, such as anti- bacterial agents [1], the total cost to market a new drug cannot be recuperated in sales. In recent years, the use of in silico chemistry and molecular modelling for computer-aided drug design (CADD), chemoinformatics, gained a significant momentum [2]. Medicinal clinics and laboratories are col- lecting more information about their findings and diagnos- tics, producing a large volume and valuable data for drug design. Large organisations such as the European Bioinfor- matics Institute (EBI) and National Center of Biotechnology Information (NCBI) in the US, formed with their mission to collect and publish freely public biological data to the sci- entific community. Drug design starts by identifying a valid target, such as a protein which has a link with the disease under scrutiny. Once this target is identified, scientists start to search for a compound that when it binds with it, a biological response is triggered or blocked. Considering the enormous chemical space of 10 60 compounds, finding a molecule that triggers the required biological response is not an easy task. Al- though only a portion of this space is appropriate to in- teract with biological targets, the number of valid com- pounds is still huge in the range of tens of millions of com- pounds. For example, ZINC database contains over 100 million purchasable compounds. An in silico drug design process that facilitates this search is virtual screening, the computational analogue of biological screening. Its aim is to filter a set of molecules from a larger set by scoring and ranking these structures using computational algorithms to help researchers take decisions on the tasks being carried out, such as deciding which compounds to purchase from external sources. It enables medicinal chemists to select a much smaller and manageable set to work with from the huge chemical space in the scale of millions, making it pop- ular and important in the drug discovery process as reported by Jorgensen [18]. Virtual screening approaches can be di- vided into two main techniques, namely, structure-based and ligand-based [22]. Both approaches bring their own chal- lenges. A major difficulty with structure-based approach is due to the many degrees of freedom involved in docking two irregular shapes in a 3D space. On the other hand, ligand- based techniques are indirect drug design methods that rely on the knowledge of other ligands that are known to bind with the target protein. Searching for similar ligands is espe- cially challenging due to the multi-parameter combinatorial explosion of possible ligand-to-ligand matching. The more molecular parameters one wants to match, such as weight, shape, and structure, the bigger are the computational task. Motivated by the importance of ligand-based virtual screen- ing in drug design and the challenges aforementioned, this research exploits the benefits of clustered computing and the use of different search algorithms to propose a novel ap- proach to discover new putative ligand binders for a given target protein. The progress report presented here is split into seven sec- tions. After this brief introduction to the subject, the aims and objectives of the study are presented. Next is the back- ground research and literature review followed by the pro- posed solution together with an overview of the dataset be- ing used and resources needed. Following these is an evalu- ation plan, a list of references, and a project timeline. 1
Transcript of Discovery of medicinal molecules based on similarity...

Discovery of medicinal molecules based on similaritynetworks and metrics
ICS5200 - Dissertation Progress Report
Joseph D’EmanueleIntelligent Computer Systems
Faculty of ICTUniversity of Malta
ABSTRACTComputer-aided drug design (CADD) projects start with acomputational search for active molecules that form a com-plex with a protein to trigger a response or block its func-tion. This report presents the initial investigation being car-ried out to build a multi-level and scalable approach wheremultiple small-molecules and proteins similarity networksare bridged via known bindings. Through these networks,we envision a research to be able to discover new putativesmall-molecule binders for a given protein target, and tofind other proteins which are likely to interact with a givensmall-molecule. Amongst other things, the latter is also im-portant for side-effect prediction. A software tool which aidsvisualization of these networks will also be built.
KeywordsAI; Big Data; Chemoinformatics; Similarity networks; Vir-tual Screening
1. INTRODUCTIONWe take medicines to cure diseases and to ease symptoms
of an illness. In essence, medicines, or drugs, are compoundsthat interact with a biological system to produce a biolog-ical response. This interaction happens at the molecularlevel of living beings. It involves a ligand, typically a small-molecule, to bind with a targeted protein, a macromoleculethat execute a particular cellular function. When this bind-ing occurs, it triggers (or blocks) a biological response.
Drug discovery and development is a lengthy, laborious,and expensive process. For some disease areas, such as anti-bacterial agents [1], the total cost to market a new drugcannot be recuperated in sales. In recent years, the use of insilico chemistry and molecular modelling for computer-aideddrug design (CADD), chemoinformatics, gained a significantmomentum [2]. Medicinal clinics and laboratories are col-lecting more information about their findings and diagnos-tics, producing a large volume and valuable data for drugdesign. Large organisations such as the European Bioinfor-matics Institute (EBI) and National Center of BiotechnologyInformation (NCBI) in the US, formed with their mission tocollect and publish freely public biological data to the sci-entific community.
Drug design starts by identifying a valid target, such asa protein which has a link with the disease under scrutiny.Once this target is identified, scientists start to search for a
compound that when it binds with it, a biological responseis triggered or blocked. Considering the enormous chemicalspace of 1060 compounds, finding a molecule that triggersthe required biological response is not an easy task. Al-though only a portion of this space is appropriate to in-teract with biological targets, the number of valid com-pounds is still huge in the range of tens of millions of com-pounds. For example, ZINC database contains over 100million purchasable compounds. An in silico drug designprocess that facilitates this search is virtual screening, thecomputational analogue of biological screening. Its aim isto filter a set of molecules from a larger set by scoring andranking these structures using computational algorithms tohelp researchers take decisions on the tasks being carriedout, such as deciding which compounds to purchase fromexternal sources. It enables medicinal chemists to select amuch smaller and manageable set to work with from thehuge chemical space in the scale of millions, making it pop-ular and important in the drug discovery process as reportedby Jorgensen [18]. Virtual screening approaches can be di-vided into two main techniques, namely, structure-based andligand-based [22]. Both approaches bring their own chal-lenges. A major difficulty with structure-based approach isdue to the many degrees of freedom involved in docking twoirregular shapes in a 3D space. On the other hand, ligand-based techniques are indirect drug design methods that relyon the knowledge of other ligands that are known to bindwith the target protein. Searching for similar ligands is espe-cially challenging due to the multi-parameter combinatorialexplosion of possible ligand-to-ligand matching. The moremolecular parameters one wants to match, such as weight,shape, and structure, the bigger are the computational task.
Motivated by the importance of ligand-based virtual screen-ing in drug design and the challenges aforementioned, thisresearch exploits the benefits of clustered computing andthe use of different search algorithms to propose a novel ap-proach to discover new putative ligand binders for a giventarget protein.
The progress report presented here is split into seven sec-tions. After this brief introduction to the subject, the aimsand objectives of the study are presented. Next is the back-ground research and literature review followed by the pro-posed solution together with an overview of the dataset be-ing used and resources needed. Following these is an evalu-ation plan, a list of references, and a project timeline.
1
2. AIMS AND OBJECTIVES
2.1 AimsExploiting the benefits of ligand-based virtual screening
and the large volume of public data available in variousmolecular chemistry databases, the aim of this study is toresearch a novel approach to discover new putative ligandbinders for a given target protein from multiple similaritysearch algorithms results.
2.2 ObjectivesThe aims above will be accomplished by fulfilling the fol-
lowing objectives:• Build a multi-level and scalable platform accessible via
a web application through which it will be possible todiscover new putative ligand binders for a given targetprotein.• Determine the significance of using multiple ligand sim-
ilarity algorithms to find a putative target.• Investigate the effectiveness of different protein simi-
larity algorithms to find new lead drug compounds.
3. BACKGROUND RESEARCH AND LITER-ATURE REVIEW
In 1998, Brown coined the term chemoinformatics to de-fine “the mixing of information resources to transform datainto information, and information into knowledge, for theintended purpose of making better decisions faster in thearena of drug lead identification and optimisation” [8]. To-day, chemoinformatics has a much broader sense, and is de-fined as “the application of informatics methods to solvechemical problems” [12].
At the heart of computational drug design and discov-ery is virtual screening. Data for virtual screening comesfrom several sources. Of particular interest to this researchis the ChEMBL Open Data database [13]. The data inthis database is regularly updated by manually abstractingbinding, functional, and ADMET (absorption, distribution,metabolism, excretion, and toxicity properties as assessedin in vivo reports) information from primary published lit-erature. This data is then further curated and standard-ized. Standardization allows data from different databasesto be compared and used together. Wilton et al have sug-gested that there are three classes under ligand-based virtualscreening methods (machine learning techniques, pharmacophore-based design, and similarity searching) and one class un-der structure-based methods (protein-ligand docking) [34].All these methods depend on the amount of structural andbioactivity data available.
Structure-based drug design is about identifying a com-pound for in vitro testing based on the knowledge of thedrug’s 3D structure. The process involves docking of can-didate ligands to a target and through scoring functions es-timate the likelihood that this binding trigger or block abiological response [19, 20].
Pharmacophore-based techniques involve the creation ofa model that contains the molecular features required forstructurally diverse ligands to likely bind to a common re-ceptor site on the target protein [29]. Chemical similaritysearching approach offers a complementary alternative topharmacophore-based technique. Here, a query compoundis used to search a database of compounds to find similar
ones [33]. The result is then sorted in decreasing similarityorder and the top compounds are said to be likely to exhibitthe same activity by Patterson’s neighbourhood behaviourprinciple [25]. Machine learning techniques’ objective is toconstruct a model that can identify relationships betweenthe chemical structure and the observed activity. Leach andGillet [22] presents a survey how these algorithms are usedin chemoinformatics applications. In these techniques, datafrom High-Throughput Screening (a mass automated sys-tem for in vitro screening) is often classified as ‘active’ or‘inactive’. The aim is to derive a mathematical model thatpredicts the activity class of new structures. Additionally,methods for non-specific targets have been developed. Anexample of such a technique is the prediction of the like-lihood that a molecule has “drug-like” characteristics andpossesses desired physiochemical properties. Amongst thesemethods are substructure filters to eliminate molecules thatare known to be inappropriate starting points for drug dis-covery and Lipinski’s rule of five which describe the molec-ular properties important to drug like compounds [23]. Sev-eral efforts have been made to combine ligand and structurebased virtual screening in order to exploit the benefits ofboth techniques, example [11, 30].
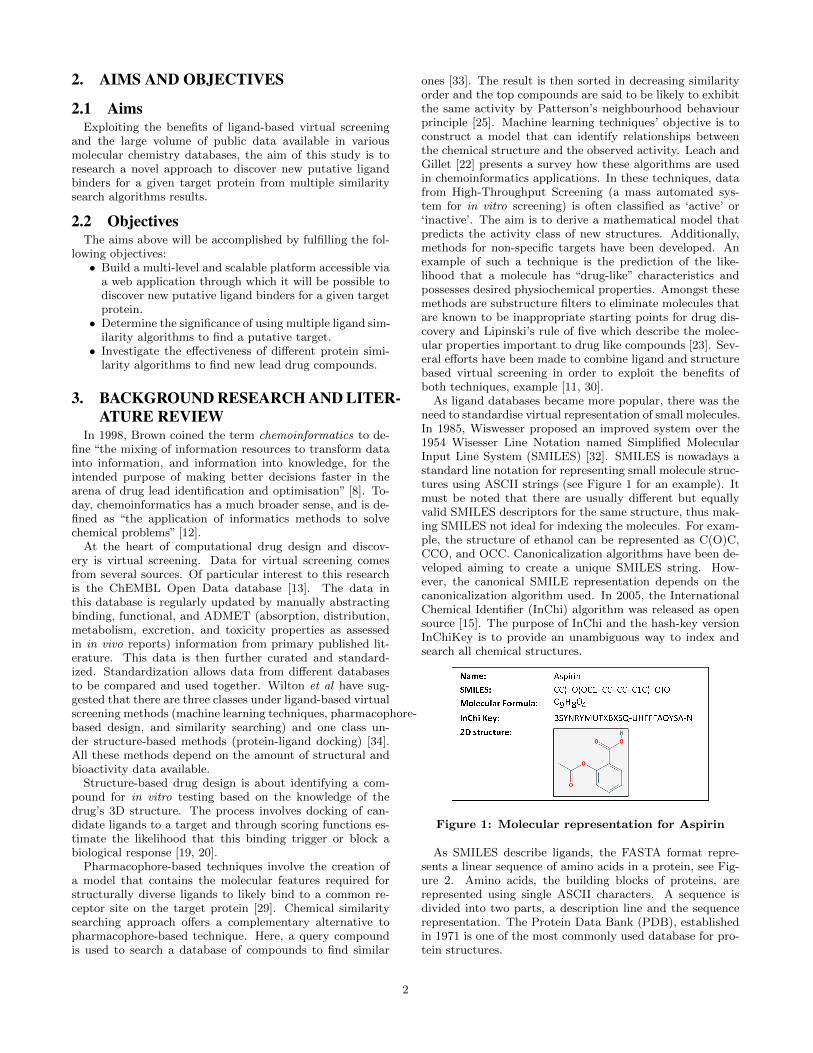
As ligand databases became more popular, there was theneed to standardise virtual representation of small molecules.In 1985, Wiswesser proposed an improved system over the1954 Wisesser Line Notation named Simplified MolecularInput Line System (SMILES) [32]. SMILES is nowadays astandard line notation for representing small molecule struc-tures using ASCII strings (see Figure 1 for an example). Itmust be noted that there are usually different but equallyvalid SMILES descriptors for the same structure, thus mak-ing SMILES not ideal for indexing the molecules. For exam-ple, the structure of ethanol can be represented as C(O)C,CCO, and OCC. Canonicalization algorithms have been de-veloped aiming to create a unique SMILES string. How-ever, the canonical SMILE representation depends on thecanonicalization algorithm used. In 2005, the InternationalChemical Identifier (InChi) algorithm was released as opensource [15]. The purpose of InChi and the hash-key versionInChiKey is to provide an unambiguous way to index andsearch all chemical structures.
Figure 1: Molecular representation for Aspirin
As SMILES describe ligands, the FASTA format repre-sents a linear sequence of amino acids in a protein, see Fig-ure 2. Amino acids, the building blocks of proteins, arerepresented using single ASCII characters. A sequence isdivided into two parts, a description line and the sequencerepresentation. The Protein Data Bank (PDB), establishedin 1971 is one of the most commonly used database for pro-tein structures.
2

Figure 2: (a) FASTA and (b) Amino Acid sequence
Similarity searching is central to medicinal chemistry [24],and as in almost any other field, it is very subjective. Assuch, many computational similarity methods have been in-troduced. Maggiora et al. point out that there are threebasic components required for a suitable molecular similar-ity measure: molecular or chemical feature representation, apotential weighing of features, and a similarity function [24].Further, in their perspective paper, Maggiora and his teamidentify seven views of similarity: chemical, molecular, 2D,3D, biological, global, and local similarities. They discussat length the difference in similarity perspective betweena trained medicinal chemist and that obtained by compu-tational means. Kutchukian et al. argue that medicinalchemists intuition is critical for the success of modern drugdiscovery as interpreting in chemical terms the result of a“black-box approach” of many machine learning techniquesis many-a-times impossible to do [21]. To address the sub-jectivity issue, algorithms that yield a numerical readoutthat can quantify similarity are used. One popular, simple,and fast function is the Tanimoto coefficient (Tc) [31]. Itcompares the features of two molecules and returns a scorebetween 0 (no similarity) and 1 (similar). A Tc value of 0.85is a commonly used threshold that reflects a high probabil-ity that two molecules share the same activity [24]. Otherfunctions, such as torsion fingerprint deviation compares themolecular shape [27]. Molecular fingerprints are used as aninput to similarity functions. A fingerprint is usually a bit-vector, sometimes as large as 4kbits, that represent the pres-ence or absence of particular features in a molecule. Forexample, if 1011012 is the molecular fingerprint for m1 and0011112 of m2, where each bit represents the presence (1) orabsence (0) of a specific molecular feature, using equation 1produces a Tanimoto coefficient of 2
3.
Tc(X,Y ) =
∑i(Xi ∧ Yi)∑i(Xi ∨ Yi)
(1)
Proteins in FASTA format, represented by a long stringof ASCII characters are matched using sequence alignmentalgorithms, such as the Basic Local Alignment Search Tool(BLAST) [3]. At the core of a sequence alignment algorithmis the scoring system. A simple and basic approach is to in-crease the score when two sequence parts match and deductthe score when a mismatch or a gap in sequence is encoun-tered. Figure 3 demonstrates a simple alignment. Scoresare typically stored in a scoring matrix and can be calcu-lated both heuristically and probabilistically. Substitutionmatrices, such as point acceptance mutation (PAM) [10] andblocks substitution matrix (BLOSUM) series [16], are nor-mally used to add weights to matching score in terms of gene
mutation.
Figure 3: Simple sequence alignment
The next section discusses the work carried out so far andthe proposed solution.
4. PROPOSED SOLUTIONThis section discusses the practical part of the study. It
outlines the tests and evaluations done so far, the proposedsolution, the dataset, and the hardware and software needed.A plan to complete the research is given in Appendix A.
4.1 Practical research carried outAfter researching the main topics discussed in the “Back-
ground Research and Literature Review” section, severalpractical tasks and evaluations were carried out.
The first practical task was to create a ligand similaritygraph. For this task, one hundred random compounds inSMILES format from the ZINC database were downloadedand a Morgan fingerprint for each was computed. Then, anupper triangular similarity matrix using Tanimoto functionwas created and was used to build a graph in Neo4j, a highlyscalable native graph database. Similarly, a sample of pro-tein FASTA files were used to create a protein similaritymatrix using BLAST algorithm and imported into Neo4j tograph the relationship between proteins.
Next, the ChEMBL database was used to extract ligand-protein bindings. This allowed the bridging between the lig-ands and the proteins graphs. Figure 4 shows these compo-nents and their expected similarity matrix dimensions usingChEMBL data. A simple web interface, similar to Figure 8,was created using D3 javascript library to represent graphs.
Figure 4: Ligands and Protein Graphs
The large volume of data, for example 24GB of com-pressed ASCII sequences of non-redundant protein sequencedataset, and the massive amount of similarity computationtasks requires a scalable solution. Apache Spark proved tobe a good fit for this purpose. An environment with twoSpark worker nodes and one master node was created. Eachnode ran a number of similarity functions written as PyS-park jobs and the result was consolidated at the master node.The prototype cluster ran on a local machine and no bench-marks were taken; the purpose of this test was of a proof ofconcept nature. At this point, GraphFrames, a graph API
3

that runs on top of Apache Spark was evaluated. A test sim-ilar to the one done using Neo4j was carried out and provedto be a satisfactory alternative with the benefit that thereis no need for the data to be duplicated on two systems; oneon Neo4j for graph processing and analysis, and another onApache Hadoop’s HFDS for use by Spark jobs.
4.2 Solution outlineThe proposed solution evolves around the known ligand-
protein bindings and the similarity concept; the more fea-tures that one can match, the higher the probability thatthe query ligand can bind with the target protein.
Two datasets, one for ligands L and another for proteinsP are prepared. For set L, a number of similarity matri-ces M with dimension |L| × |L| are created. Each matrixm ∈ M represents the similarity coefficients of each lig-and l ∈ L with all other ligands in L − l for a partic-ular feature f . For example, a matrix m1 can representthe similarity coefficients of all ligands in the dataset usingMorgan fingerprints and Tanimoto function, while anothermatrix, m2 can represent the 3D-shape similarities usingtorsion fingerprint deviation. Given a query ligand q anda threshold ξ, one can find similar ligands in mf such thatsimq = {∀ l, (q ∼ l) ≤ ξ}, where ‘∼’ can be any similarityfunction of choice. A typical process to create a similaritymatrix is outlined next:
1. For n: 1 to |L| do:1.1. fln = fingerprint(ln)
2. For m: 1 to |L| do:2.1. For n: 1 to |L| do:
2.1.1. sim(m,n) = flm ∼ fln
Figure 5: Simple similarity matrix algorithm
In Figure 5, fl is a Morgan or other molecular fingerprintand sim is a similarity function such as Tversky. If sim isa symmetrical function such as Tanimoto, the inner loop atstep 2.1. can be optimised to start from m+1 and create anupper triangular matrix instead a full one.
Graph G is a weighted bipartite graph joining sets L andP , where the weights represent the binding affinity betweenligands and proteins. Given that simq ⊂ L, using G, onecan walk from ligands in set simq to P , see Figure 6. Us-ing the similarity knowledge about simq and the links inG, one can suggest that the missing links in G can possiblybe putative bindings. For example, in Figure 6, given thatq is similar to l1, l2, l3, and l4, using Petterson’s similarityprinciple [25] one can say that there is a possibility that qbinds to p1, p2, and p3. Further, doing the above test usingdifferent similarity functions, one can say that the more fre-quent a particular edge is present across different runs, thehigher the probability that this binding can be successful inin vitro testing. Likewise, this hypothesis is valid to startfrom looking for similar p ∈ P using similarity algorithmssuch as BLAST and walk back to L to find possible ligandbinders.
Using Figure 6 and the above description, the proposedsearch solution can algorithmically be listed as in Figure 7.
The final solution shall provide a web application to allowsimilarity algorithms parameter configuration, user input forquerying data, and result visualisation. The main featuresof this user interface are summarised in Table 1 and a sampleUI mock is shown in Figure 8.
Figure 6: Putative Ligands-Protein binding
1. Let q be the query ligand.2. Find all ligands similar to q in L using a particular simi-
larity algorithm and threshold ξ.3. Let {simq} be the resultant set from step 2.4. Using the neighbourhood similarity principle, one can say
that q can potentially binds with all proteins that ligandsin {simq} bind to.
5. Repeat steps 2. to 4. for different similarity algorithms.The more frequent a binding edge appears in different sim-ilarity algorithms, the higher the probability that thebinding is successful in in vitro testing.
Figure 7: Search algorithm
4.3 DatasetThroughout this research, ChEMBL data (version 22) is
used [13]. First, data related to Homo Sapiens (identified bytaxonomy id 9606) was extracted and categorised into twosets, namely the ligands set L and the proteins set P . Thenumber of samples extracted and cleaned from ChEMBL aredescribed in Table 2. These two sets form the disjoint sets ofa bipartite graph G, whose edges correspond to the ligand-protein binding, each weighted by the complex formationaffinity recorded in ChEMBL. The edges are represented byset E in Table 2.
With the ligands and proteins datasets at hand differentsimilarity matrices will be created. This is a long processthat creates a lot of data and requires a lot of resources. Thedata structures are estimated to be a 710, 767×710, 767 ma-trix for each ligand similarity matrix, a little less than 3 mil-lion weighted edge bipartite graph, and a directed weightedgraph of 2,888 nodes per protein similarity graph.
4.4 Hardware and SoftwareThe prototypes can be carried out on normal i7 desktop
machines. However, to handle the full dataset, a larger in-frastructure is required. The plan is to run the full solutionon an Apache Hadoop cluster [5] and the similarity func-tions, see Figure 5 step 2.1.1., run as Apache Spark jobs[6]. The latter is chosen over MapReduce for the followingreasons:• Spark does more processing in memory and uses less
disk IO, making it faster. An interesting function ofSpark is that it does lazy evaluation. That is, Sparkonly loads the data when it is asked to be returnedfrom a function. Thus, Spark is able to optimise mul-tiple map transformations and reduce operations byanalysing if it can skip or merge certain tasks.• Spark’s real-time characteristic facilitates the similar-
4

Table 1: Visual tool featuresLigands Bindings Target Proteins
Similarity matrices for ligands:• Different similarity measures,such as, Tanimoto, Dice, andTvesky.
Graph Visualisation:• Node size = node degree• Node shape = circle• Filter by similarity factor, e.g.Tc >0.85• Group by ligand’s compoundproperties• On node hover show moleculedata, such as structure andproperties
Ligands-Proteins binding is aweighted bipartite graph built fromChEMBL data.
Visualisation tool features:• Filter by binding strength• Filter by node (ligand orprotein) degree
Graph:• Edge width = binding strength
Similarity matrix for proteins usingBLAST+ and/or other algorithms
Visualisation:• Group by protein classification• Filter by protein classification
Graph:• Node size = node degree• Node shape = square• Node color = protein classifi-cation• On node hover show proteindata
Figure 8: Visualization mock
Table 2: ChEMBL data (Homo Sapiens)
Set Number of items in set
Ligands L 710,767
Proteins P 2,888
Bindings E 2,930,127
ity matrix creation jobs execution.• A big advantage of Spark is that it unifies a lot of in-
terfaces like SQL and Graph frameworks into a singleabstraction of Resilient Distributed Data. Thus it re-moves the need of multiple independent solutions andthe overhead to integrate the results.
All machines will run Ubuntu open source operating sys-tem. Cluster automation scripts will be written in Bash,the visual tool in HTML5 and leveraging D3 potential todisplay interactive graphs, back-end programming will becarried out in Python, and documentation in LATEX. Otherpackages that will be used during the research include:• Spark’s package GraphFrames [4] will be used to pro-
cess graph data on Hadoop.• RDKit library [26] to create ligand fingerprints and
run similarity functions.• BIOPython [9] is used to process FASTA files and run
BLAST queries.
5. EVALUATION PLANEvaluation of the proposed solution is not straight for-
ward. The aim of the research is to help medicinal chemiststo discover new possible ligand-protein bindings, and mea-suring novelty is very difficult [7]. This is because the re-search is recommending a binding that the user does notknow about.
At this juncture, it is important to note that the absenceof a binding between a ligand and a protein in ChEMBLdatabase does not mean that the pair do not bind, but itcan mean that this binding was never recorded. This isanalogous to the challenge imposed by offline recommendersystems prediction evaluation [14]. To assume that the ab-sence of a ligand-protein link in ChEMBL means that thepair do not form a complex inflate the number of false posi-tives. Thus, evaluation metrics that are based on false posi-tive outcome do not fully apply to this type of solution [14].
The evaluation is to be done by filtering out known bind-ings from the dataset and confirm that the solution returnsthese bindings in the top recommended results. The metricwill be to count the number of putative bindings discoveredout of the total number of bindings in the testing dataset.For this, the k -fold cross validation technique will be used.For each k experiments, k-1 folds will be used as the knownligand-protein binding set and the remaining fold will beused for testing.
Two types of experiments will be carried out with theaim to estimate the accuracy of recommending moleculesthat are likely to bind with a given target and vice-versa.The first type tests the proposed solution’s putative targetprotein recommendation accuracy. Here, the ligands set willbe k -folded and the unseen set will be fed to the system(as described in Figure 7) and confirm the recommendedbindings. A successful recommendation is considered to beone that there is a known binding in ChEMBL database.The second type of experiments is a mirror image of thefirst. That is, the proteins set will be k -folded. As in thefirst type of experiments, a successful recommendation isconsidered to be one for which a binding exist in the fulldataset.
The ultimate evaluation can be the testing of a newlyunseen small-molecule and find putative targets and con-firm the result via a competitive assay binding experiment[17]. This latter set of experiments requires wet laboratoryresources which are not available at this time. If the pos-
5

sibility arises, a great evaluation will be to ask a group ofmedicinal researchers to use the software tool being devel-oped and pass their feedback about the tool as a whole, itsperformance, and if it helped them in their research.
6. REFERENCES[1] Session 3 (R & D): industry perspective on PPPs and
the link between new business models and theregulatory framework.
[2] W. A, A. N, S. L, A. A, H. H, and S. S. In-silico drugdesign: An approach which revolutionarised the drugdiscovery process. OA Drug Design and Delivery, Sep2013.
[3] S. F. Altschul, W. Gish, W. Miller, E. W. Myers, andD. J. Lipman. Basic local alignment search tool.Journal of Molecular Biology, 215(3):403–410, Oct1990.
[4] Apache Software Foundation. GraphFrames, Nov 2016.
[5] Apache Software Foundation. Hadoop, Aug 2016.
[6] Apache Software Foundation. Spark, Nov 2016.
[7] I. Avazpour, T. Pitakrat, L. Grunske, and J. Grundy.Dimensions and Metrics for EvaluatingRecommendation Systems, pages 245–273. SpringerBerlin Heidelberg, Berlin, Heidelberg, 2014.
[8] F. K. Brown. Chapter 35 - chemoinformatics: What isit and how does it impact drug discovery. volume 33 ofAnnual Reports in Medicinal Chemistry, pages 375 –384. Academic Press, 1998.
[9] P. J. A. Cock, T. Antao, J. T. Chang, B. A.Chapman, C. J. Cox, A. Dalke, I. Friedberg,T. Hamelryck, F. Kauff, B. Wilczynski, and M. J. L.de Hoon. Biopython: freely available python tools forcomputational molecular biology and bioinformatics.Bioinformatics, 25(11):1422–1423, Mar 2009.
[10] M. O. Dayhoff and R. M. Schwartz. Chapter 22: Amodel of evolutionary change in proteins. In in Atlasof Protein Sequence and Structure, 1978.
[11] M. N. Drwal and R. Griffith. Combination of ligand-and structure-based methods in virtual screening.Drug Discovery Today: Technologies, 10(3):e395–e401,Sep 2013.
[12] J. Gasteiger. Chemoinformatics: a new field with along tradition. Analytical and Bioanalytical Chemistry,384(1):57–64, 2006.
[13] A. Gaulton, L. J. Bellis, A. P. Bento, J. Chambers,M. Davies, A. Hersey, Y. Light, S. McGlinchey,D. Michalovich, B. Al-Lazikani, and J. P. Overington.ChEMBL: a large-scale bioactivity database for drugdiscovery. Nucleic Acids Research,40(D1):D1100–D1107, Sep 2011.
[14] A. G. Guy Shani. Evaluating recommender systems.Technical report, Nov 2009.
[15] S. R. Heller, A. McNaught, I. Pletnev, S. Stein, andD. Tchekhovskoi. Inchi, the iupac internationalchemical identifier. Journal of Cheminformatics,7(1):23, 2015.
[16] S. Henikoff and J. G. Henikoff. Amino acidsubstitution matrices from protein blocks. Proc. Natl.Acad. Sci. U.S.A., 89(22):10915–10919, Nov 1992.
[17] J. Hughes, S. Rees, S. Kalindjian, and K. Philpott.Principles of early drug discovery. British Journal ofPharmacology, 162(6):1239–1249, Feb 2011.
[18] W. L. Jorgensen. The many roles of computation indrug discovery. Science, 303(5665):1813–1818, 2004.
[19] A. J. Kooistra, H. F. Vischer, D. McNaught-Flores,R. Leurs, I. J. P. de Esch, and C. de Graaf.Function-specific virtual screening for GPCR ligandsusing a combined scoring method. Scientific Reports,6:28288, Jun 2016.
[20] B. S. P. R. T. Kroemer. Structure-based drug design:Docking and scoring. Current Protein & PeptideScience, 8(4):312–328, Aug 2007.
[21] P. S. Kutchukian, N. Y. Vasilyeva, J. Xu, M. K.Lindvall, M. P. Dillon, M. Glick, J. D. Coley, andN. Brooijmans. Inside the mind of a medicinalchemist: The role of human bias in compoundprioritization during drug discovery. PLoS ONE,7(11):e48476, Nov 2012.
[22] A. R. Leach and V. Gillet. An Introduction toChemoinformatics. Springer, 2010.
[23] C. A. Lipinski, F. Lombardo, B. W. Dominy, and P. J.Feeney. Experimental and computational approachesto estimate solubility and permeability in drugdiscovery and development settings. Adv. Drug Deliv.Rev., 46(1-3):3–26, Mar 2001.
[24] G. Maggiora, M. Vogt, D. Stumpfe, and J. Bajorath.Molecular similarity in medicinal chemistry. Journal ofMedicinal Chemistry, 57(8):3186–3204, 2014. PMID:24151987.
[25] D. E. Patterson, R. D. Cramer, A. M. Ferguson, R. D.Clark, and L. E. Weinberger. Neighborhoodbehavior: a useful concept for validation of“molecular diversity” descriptors. Journal of MedicinalChemistry, 39(16):3049–3059, Jan 1996.
[26] RDKit. Open-Source Cheminformatics and MachineLearning, Apr 2016.
[27] T. Schulz-Gasch, C. Scharfer, W. Guba, andM. Rarey. TFD: Torsion fingerprints as a new measureto compare small molecule conformations. Journal ofChemical Information and Modeling, 52(6):1499–1512,Jun 2012.
[28] K. Schwaber. Agile project management with Scrum.Microsoft press, 2004.
[29] H. Sun. Pharmacophore-based virtual screening.Current Medicinal Chemistry, 15(10):1018–1024, Apr2008.
[30] F. Svensson, A. Karlen, and C. Skold. Virtualscreening data fusion using both structure- andligand-based methods. Journal of ChemicalInformation and Modeling, 52(1):225–232, 2012.
[31] T. T. Tanimoto. IBM internal report. Technicalreport, IBM Corporation, Armonk, NY, Nov 1957.
[32] D. Weininger. SMILES, a chemical language andinformation system. Journal of Chemical Informationand Computer Sciences, 28(1):31–36, 1988.
[33] P. Willett, J. M. Barnard, and G. M. Downs. Chemicalsimilarity searching. Journal of Chemical Informationand Computer Sciences, 38(6):983–996, Nov 1998.
[34] D. Wilton, P. Willett, K. Lawson, and G. Mullier.Comparison of ranking methods for virtual screeningin lead-discovery programs. Journal of ChemicalInformation and Computer Sciences, 43(2):469–474,Mar 2003.
6

APPENDIXA. PROJECT PLAN
This research is being carried out on part-time basis over a period of 1 year. The final research will be presented as thedissertation for a masters level in Artificial Intelligence. The methodology framework of choice is Scrum with a two weekSprint and a Velocity of four points, confer [28]. Table 3 outlines the User Stories (main tasks) identified, their respectiveScrum Points, and Sprint Number when these tasks are going to be carried out. The purpose of using Scrum is to have adeliverable by the end of each Sprint, thus effort can be measured and the Supervisor and Co-Supervisor are kept up-to-date.
The plan proposed has some contingency to compensate impediments that may hinder the completion of a particular UserStory in time. This contingency is added in two forms, (a) all tasks are to be completed a couple of weeks prior the deadline,and (b) some repetitive User Story may take less time as the framework needed will be already implemented in previous ones.
7

Table 3: Project Plan
Start End Sprint Number Story Number Story Points Description
20-06-2016 03-07-2016 1 0 Done Discussion and research about proposal
04-07-2016 17-07-2016 2 10 Done Reading about Chemoinformatics, virtualscreening, and molecule fingerprinting
11 Done Researching and creating a similarity matrixfor 100 random molecules (ligands)
18-07-2016 31-07-2016 3 20 Done Introduction to proteins, Protein Data Bank,and reading of related literature
01-08-2016 14-08-2016 4 21 Done Introduction to BLAST and exeperimentingwith local BLAST
15-08-2016 28-08-2016 5 22 Done Implementation of protein similarity matrixfor random 100 proteins
29-08-2016 11-09-2016 - - - -
12-09-2016 25-09-2016 6 23 Done Continue protein similarity matrix and upload-ing data to Neo4j
26-09-2016 09-10-2016 7 30 Done Introduction to D3
10-10-2016 23-10-2016 8 40 Done Introduction to ChEMBL and create a D3graph showing molecule and ligand bindings
24-10-2016 06-11-2016 9 50 Done Introduction and building a Spark cluster
07-11-2016 20-11-2016 10 51 Done Researching GraphFrames on Spark
21-11-2016 04-12-2016 11 60 Done Implement distributed BLAST and Tanimotosimilarity using PySpark
05-12-2016 11-12-2016 12 61 Done Working on progress report
12-12-2016 25-12-2016 13 100 1 Dataset preparation
200 3 Automate Apache Hadoop and SPARK clusterinstallation
26-12-2016 08-01-2017 14 300 4 Implementation and documentation of ligandsgraph creation and analysis framework
09-01-2017 22-01-2017 15 400 4 Design, implement, and document ligands sim-ilarity matrices creation
23-01-2017 05-02-2017 16 500 4 Design and setup of web application frame-work
06-02-2017 19-02-2017 17 501 3 Documentation of web application framework
600 1 Design search for similar ligands
20-02-2017 05-03-2017 - - - -
06-03-2017 19-03-2017 18 601 4 Implement and document search for similarligands
20-03-2017 02-04-2017 19 700 4 Design, implement, and document Proteinsimilarity matrices creation
03-04-2017 16-04-2017 20 800 4 Design and implement search for similar pro-teins
17-04-2017 30-04-2017 21 801 2 Document search for similar proteins
01-05-2017 14-05-2017 22 900 4 Design, implement, and document bipartitegraph
15-05-2017 28-05-2017 23 1000 4 Implement highlight of graph walks from queryligand to target protein (Part I)
29-05-2017 11-06-2017 24 1001 1 Implement highlight of graph walks from queryligand to target protein (Part II)
1002 3 Document highlight of graph walks from queryligand to target protein
12-06-2017 25-06-2017 25 1100 4 Implement highlight of graph walks from queryprotein to ligand (Part I)
26-06-2017 09-07-2017 26 1101 1 Implement highlight of graph walks from queryprotein to ligand (Part II)
1102 1 Document highlight of graph walks from queryprotein to ligand
10-07-2017 23-07-2017 27 1200 4 Evaluation and analysis
24-07-2017 06-08-2017 28 1201 4 Documentation related to User Story 1200
07-08-2017 20-08-2017 29 1300 4 Review write-up
21-08-2017 03-09-2017 30 1301 4 Finalize write-up
8