Combined Sewer Overflow and Sanitary Sewer Overflow Monitoring
Surrey, UK July 2015
Department of Chemical Engineering
Direct gas emissions in urban sewer networks
Case study of two climatic regions
Elena Eijo-Ríoa,b, Gara Villalbaa,b, María Eugenia Suárez-Ojedac, Desirée Marínd, Maria José Amoresd, Xavier Gabarrella,b
aSostenipra (ICTA-IRTA-Inèdit) 2014 SGR 1412 Institute of Environmental Science and Technology (ICTA), Universitat Autònoma de Barcelona (UAB), Edifici ICTA-ICP, Carrer de les Columnes, 08193 Bellaterra, Barcelona, Spain.
bDepartment of Chemical Engineering, Xarxa de Referència en Biotecnologia (XRB). School of Engineering (ETSE), Universitat Autònoma de Barcelona (UAB), Campus of the UAB, Bellaterra (Cerdanyola del Vallès), 08193 Barcelona, Catalonia, Spain.
cGENOCOV research group, Department of Chemical Engineering. School of Engineering, Universitat Autònoma de Barcelona, Bellaterra, 08193 Barcelona, Spain.
dCETaqua, Water Technology Centre, Carretera d’Esplugues 75, 08940 Cornellà de Llobregat, Barcelona, Spain
INDEX
1. INTRODUCTION
2. CASE STUDIES
3. CONCLUSIONS
4. FUTURE WORK
2/14
1. INTRODUCTION
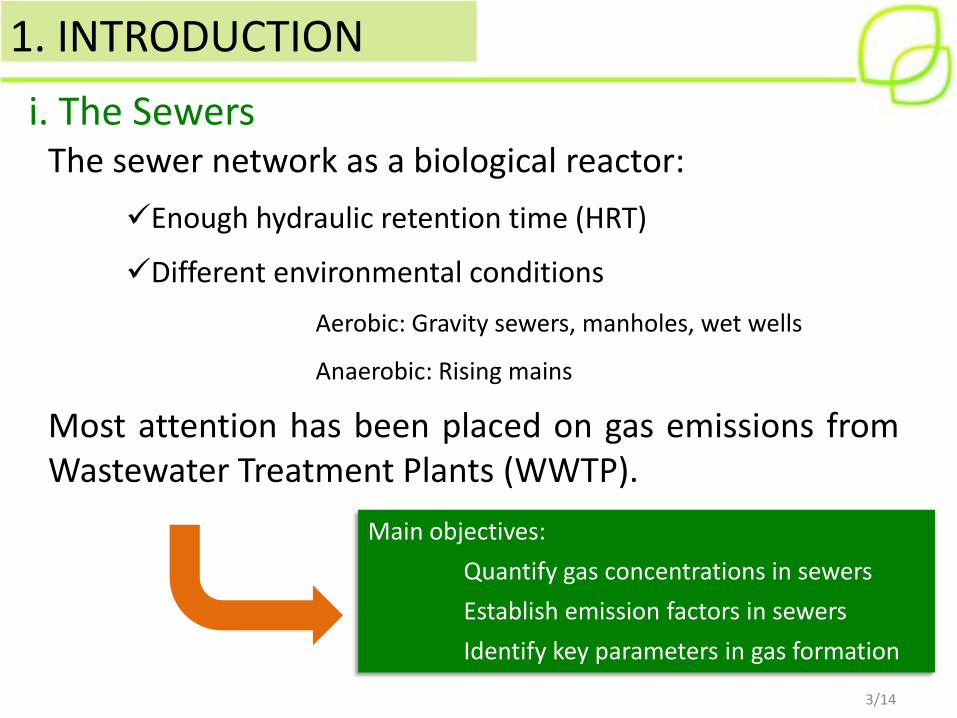
i. The Sewers The sewer network as a biological reactor:
Enough hydraulic retention time (HRT)
Different environmental conditions
Aerobic: Gravity sewers, manholes, wet wells
Anaerobic: Rising mains
Most attention has been placed on gas emissions from Wastewater Treatment Plants (WWTP).
Main objectives:
Quantify gas concentrations in sewers
Establish emission factors in sewers
Identify key parameters in gas formation
3/14
iii. Literature review: Main Findings
High temperatures favour gas emissions
Raising pH reduces H2S and CH4 formation
Longer HRT increases CH4 production
High dissolved oxygen levels prevent H2S and CH4 generation
High nitrite and nitrate concentration inhibit H2S and CH4 formation but increase N2O concentration
The bigger the headspace in a gravity sewer, the higher amount of N2O
1. INTRODUCTION
Image source: http://iraos.org/EN/img/research-icon.jpg
4/14

iii. Literature review: Research Gaps
None include all three gases
Focus on rising sewers, little attention to gravity sewers and combined sewer networks
Most results based on the dissolved gas concentration in the liquid phase
Emission factor calculation methodology not standardized: liquid phase or gas phase results presented
Differences in sampling methodology (in terms of duration and frequency)
Authors infrequently report other parameters such as dissolved oxygen
Little data about climate region or the season of the sampling campaign
Most of the studies performed in Australia
1. INTRODUCTION
Image source: http://iraos.org/EN/img/research-icon.jpg
5/14

i. Project framework and Selected Cities
2
1
AQUAENVEC LIFE10 ENV/ES/000520
Life+ financial instrument of the European Commission
Project Title:
“Assessment and Improvement of the Urban Water Cycle Eco-Efficiency using LCA and LCC”
Ga
Betanzos, Galicia
• Oceanic climate, few dry periods
• Average rainfall: 1890 mm/year
• Population density: 94 inhab/km2
• Mostly rain-fed agriculture
• Household water consumption: 146L/cap/day
1
Ga
• Mediterranean climate, water stress
• Average rainfall: 640 mm/year
• Population density: 234 inhab/km2
• Mostly irrigated agriculture
• Household water consumption: 139 L/cap/day
Calafell, Catalonia 2
2. CASE STUDIES
6/14
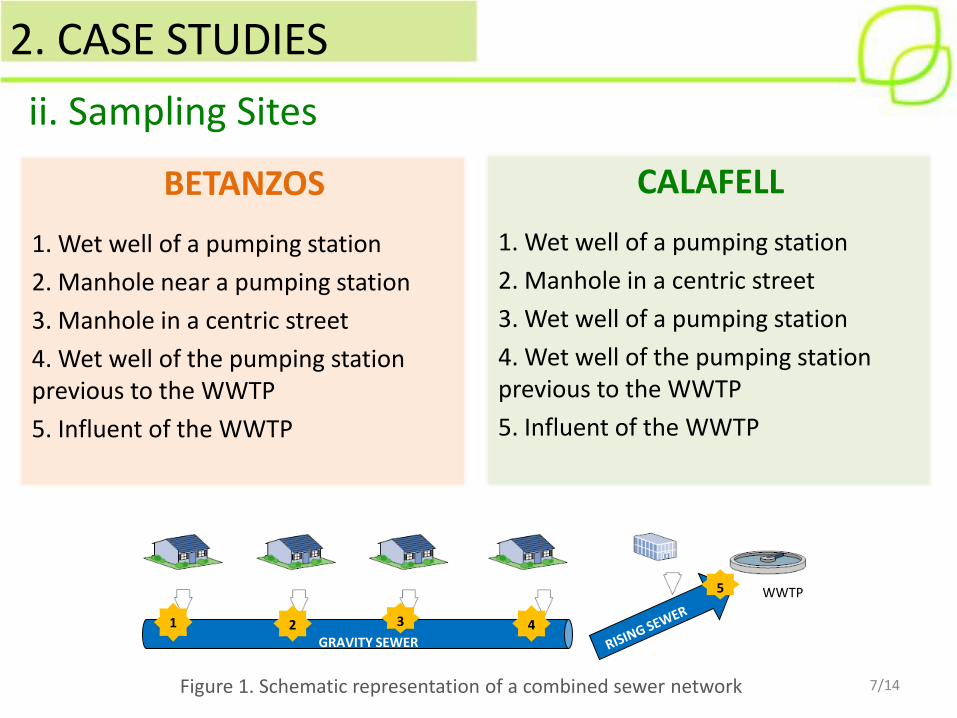
CALAFELL
1. Wet well of a pumping station
2. Manhole in a centric street
3. Wet well of a pumping station
4. Wet well of the pumping station previous to the WWTP
5. Influent of the WWTP
BETANZOS
1. Wet well of a pumping station
2. Manhole near a pumping station
3. Manhole in a centric street
4. Wet well of the pumping station previous to the WWTP
5. Influent of the WWTP
2. CASE STUDIES
ii. Sampling Sites
GRAVITY SEWER
1 2 3 4
5 WWTP
Figure 1. Schematic representation of a combined sewer network 7/14

Continuous field sampling (1 hour) in five points of the network: CH4 and N2O gas concentration
Discontinuous H2S gas concentration by colorimetry
Discontinuous water sampling for water quality
Summer campaign in July 2013
Winter campaign in January and February 2014
2. CASE STUDIES
iii. Methodology
8/14 Figure 2. a) Hydrogen sulphide measurement. b) GHG analyzer
SERVOMEX 4900
Gas conditioner JCT model
JCC-P114111
Videoregistrator EUROTHERM
6100E
2. CASE STUDIES
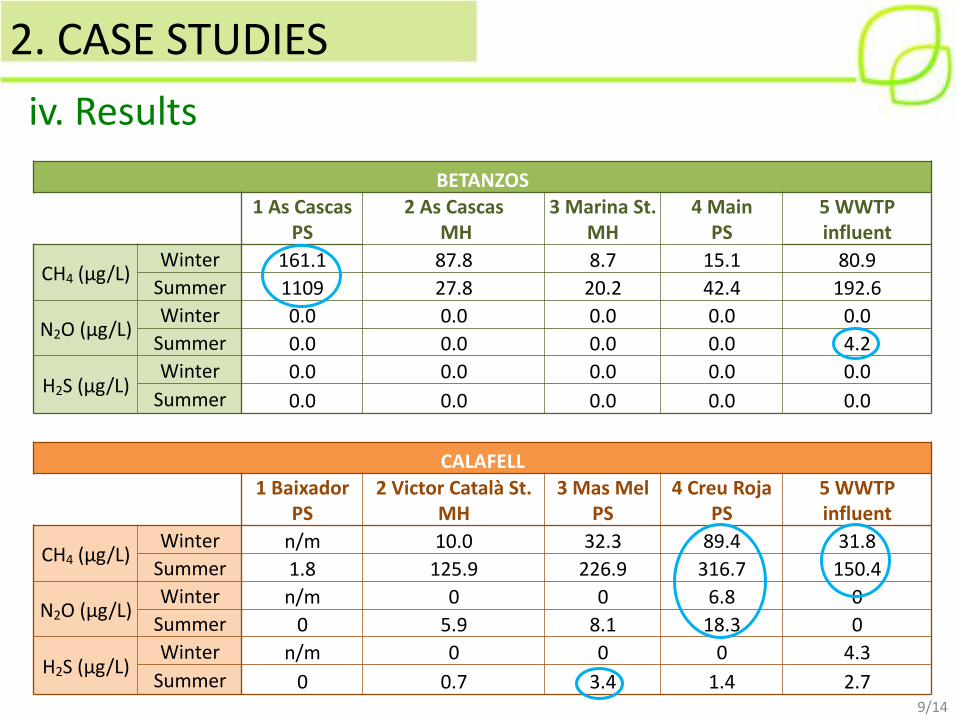
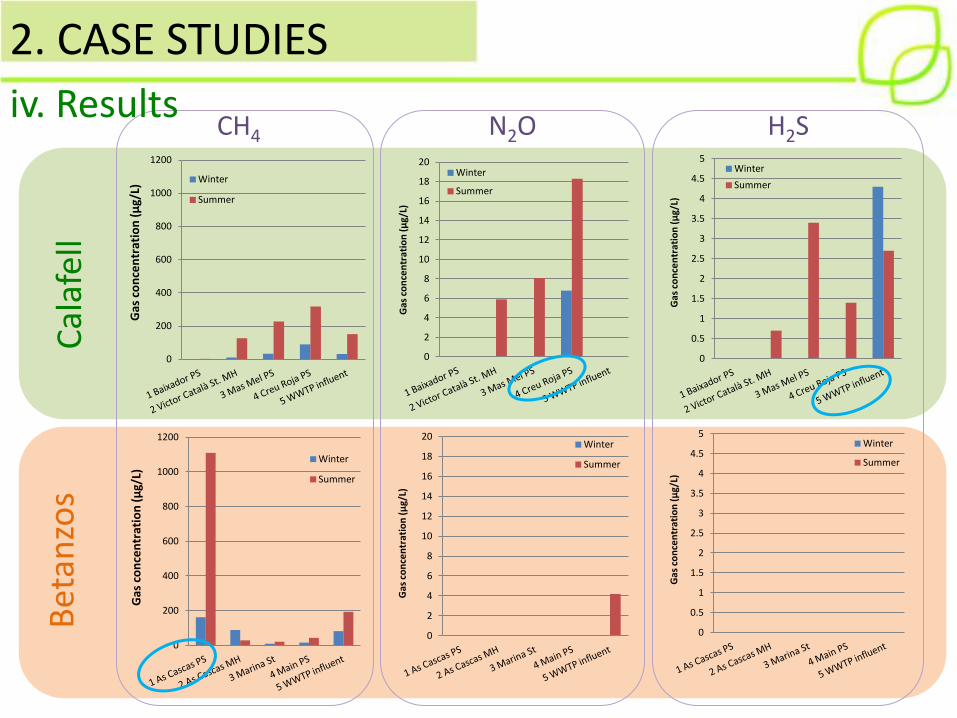
iv. Results
BETANZOS
1 As Cascas
PS 2 As Cascas
MH 3 Marina St.
MH 4 Main
PS 5 WWTP influent
CH4 (µg/L) Winter 161.1 87.8 8.7 15.1 80.9
Summer 1109 27.8 20.2 42.4 192.6
N2O (µg/L) Winter 0.0 0.0 0.0 0.0 0.0
Summer 0.0 0.0 0.0 0.0 4.2
H2S (µg/L) Winter 0.0 0.0 0.0 0.0 0.0
Summer 0.0 0.0 0.0 0.0 0.0
CALAFELL
1 Baixador
PS 2 Victor Català St.
MH 3 Mas Mel
PS 4 Creu Roja
PS 5 WWTP influent
CH4 (µg/L) Winter n/m 10.0 32.3 89.4 31.8
Summer 1.8 125.9 226.9 316.7 150.4
N2O (µg/L) Winter n/m 0 0 6.8 0
Summer 0 5.9 8.1 18.3 0
H2S (µg/L) Winter n/m 0 0 0 4.3
Summer 0 0.7 3.4 1.4 2.7 9/14

2. CASE STUDIES
iv. Results
1109
30000
3100
CH4
18.3
298.3
9.8
N2O
Gas concentrations (mg/m3) compared to other studies
4.3
200
1.5
H2S

2. CASE STUDIES
Emission factors in Calafell and Betanzos with different calculation approaches:
iv. Results
11/14
Emission factor - air
(kg CO2 /year)
Emission factor - water
(kg CO2 /year)
Calafell Summer 18.6 494
Winter 3.84 66.5
Betanzos Summer 24.6 263
Winter 10.0 71.2
Contribution of the direct emissions to the total emissions of sewers in the operation stage:
Related to a volume of wastewater ≤ 30%
Related to a volume of air ≤ 4%

3. CONCLUSIONS
In general, higher gas concentrations were found in summer
Higher concentrations of CH4 than other gases were detected
Higher gas concentrations in Calafell than in Betanzos
Higher gas concentrations in wet wells than other appurtenances
Direct emissions of only one point of the network can represent up to 30%
Temperature is a key parameter favoring gas production
Turbulence contributes to a higher gas release The entire sewer network may represent a higher contribution to the total emissions
Gas emissions in sewers
are not irrelevant 12/14

4. FUTURE WORK
The sampling was carried out for one hour, and does not represent the fluctuations during the entire day
Other parameters such as redox potential, dissolved oxygen and water temperature should be measured in order to account cause-effect relationships between gas formation and water species
The entire network should be considered and characterized
13/14
Thank you
for your attention!
Surrey, UK July 2015
Department of Chemical Engineering
1. INTRODUCTION
i. The Sewers
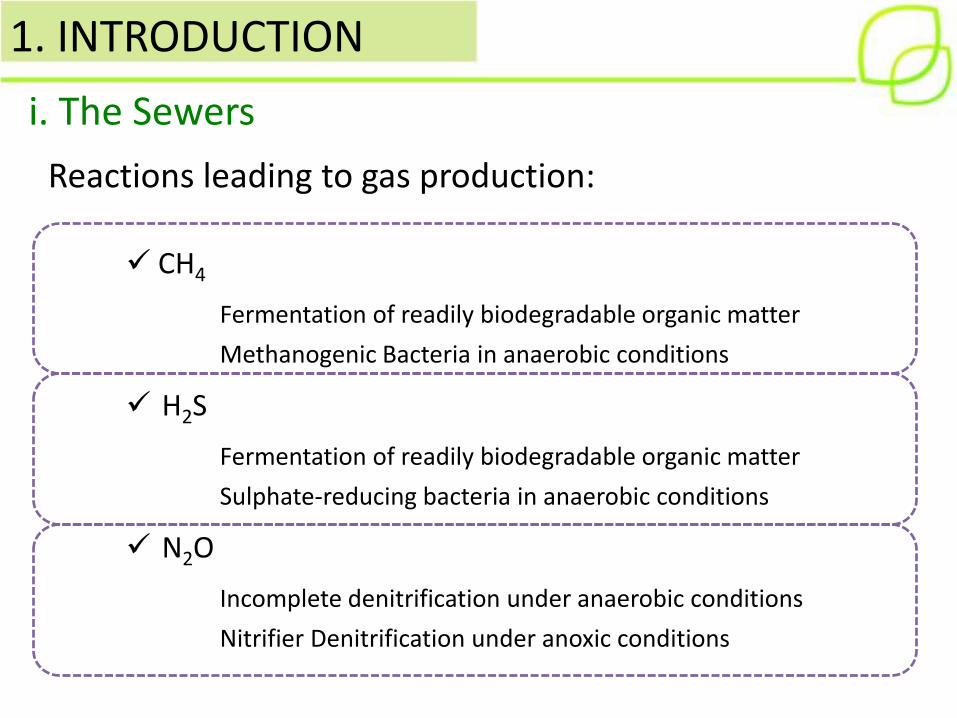
Reactions leading to gas production:
CH4
Fermentation of readily biodegradable organic matter
Methanogenic Bacteria in anaerobic conditions
H2S
Fermentation of readily biodegradable organic matter
Sulphate-reducing bacteria in anaerobic conditions
N2O
Incomplete denitrification under anaerobic conditions
Nitrifier Denitrification under anoxic conditions
1. INTRODUCTION
DQO fermentable
CH4
WASTEWATER
AIR
N2O
H2S
N2O
H2S
CH4
Sulfuric Acid
Production
Meth
an
e
Pro
du
cti
on
H2SO4
H2S
Hy
dro
gen
Su
lph
ide
Pro
du
cti
on
SO42-
HS-
NO2-
NO
N2O
NO3-
NH4+
NH2OH
NH4+
NH2OH
ANAEROBIC
AEROBIC/
ANOXIC
AEROBIC/
ANOXIC
Den
itrif
icati
on
HD
N
MB SRB
SOB
N2O
N2O H2S
CH4
N2O
VFAs
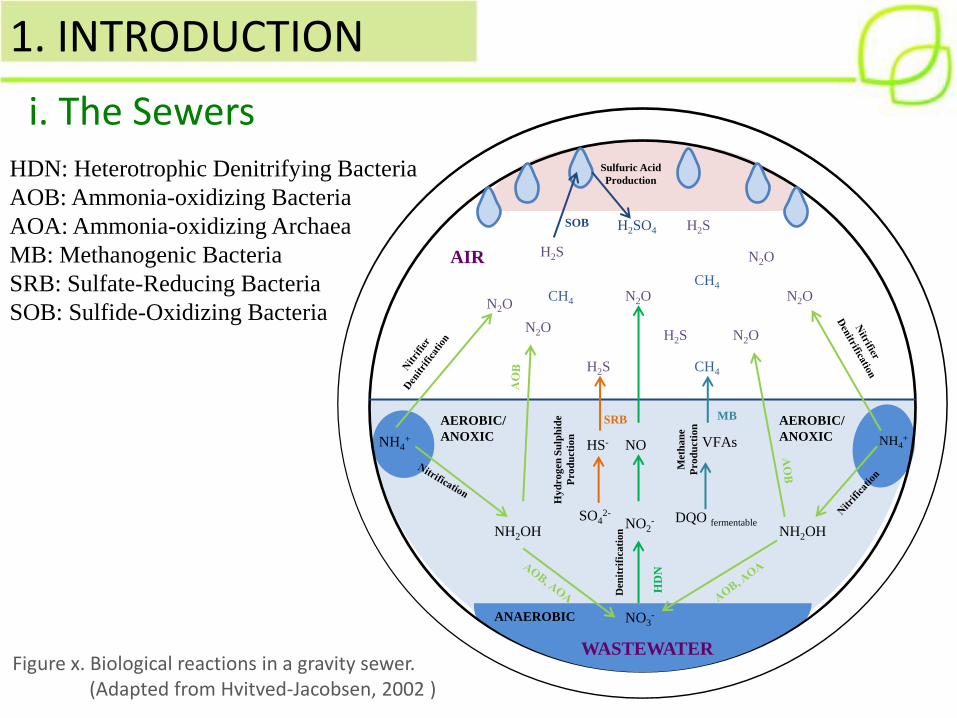
HDN: Heterotrophic Denitrifying Bacteria
AOB: Ammonia-oxidizing Bacteria
AOA: Ammonia-oxidizing Archaea
MB: Methanogenic Bacteria
SRB: Sulfate-Reducing Bacteria
SOB: Sulfide-Oxidizing Bacteria
i. The Sewers
Figure x. Biological reactions in a gravity sewer. (Adapted from Hvitved-Jacobsen, 2002 )
CH4 N2O H2S
Cal
afel
l B
etan
zos
0
200
400
600
800
1000
1200
Gas
co
nce
ntr
atio
n (
µg/
L)
Winter
Summer
0
2
4
6
8
10
12
14
16
18
20
Gas
co
nce
ntr
atio
n (
µg/
L)
Winter
Summer
0
0.5
1
1.5
2
2.5
3
3.5
4
4.5
5
Gas
co
nce
ntr
atio
n (
µg/
L)
Winter
Summer
0
200
400
600
800
1000
1200
Gas
co
nce
ntr
atio
n (
µg/
L) Winter
Summer
0
2
4
6
8
10
12
14
16
18
20
Gas
co
nce
ntr
atio
n (
µg/
L)
Winter
Summer
0
0.5
1
1.5
2
2.5
3
3.5
4
4.5
5
Gas
co
nce
ntr
atio
n (
µg/
L)
Winter
Summer
iv. Results
2. CASE STUDIES