Direct comparison of deposit from aerial and ground ULV
97
REMSpC www.REMSpC.com Direct comparison of deposit from aerial and ground ULV applications of malathion with AGDISP predictions
Transcript of Direct comparison of deposit from aerial and ground ULV
REMSpC
www.REMSpC.com
Direct comparison of deposit from aerial and ground ULV applications of malathion with AGDISP predictions


REMSpC Report 2005-02 February 10, 2005
Direct comparison of deposit from aerial and ground ULV applications of malathion
with AGDISP predictions
Report to: Institut national de santé publique du Québec (INSPQ)
945, avenue Wolfe Sainte-Foy (Québec)
G1V 5B3
prepared by:
R.E Mickle REMSpC Consulting
12 Welsh Dr, RR3 Ayr, ON Canada
N0B 1E0
Onil Samuel Ghislain Rousseau Louis St-Laurent 1780, rue Semple Pierre Dumas SOPFIM Centre de toxicologie/INSPQ Québec (Québec) 945, avenue Wolfe G1N 4B8 Sainte-Foy (Québec) G1V 5B3
REMSpC www.REMSpC.com

REMSpC Report 2005-02 i
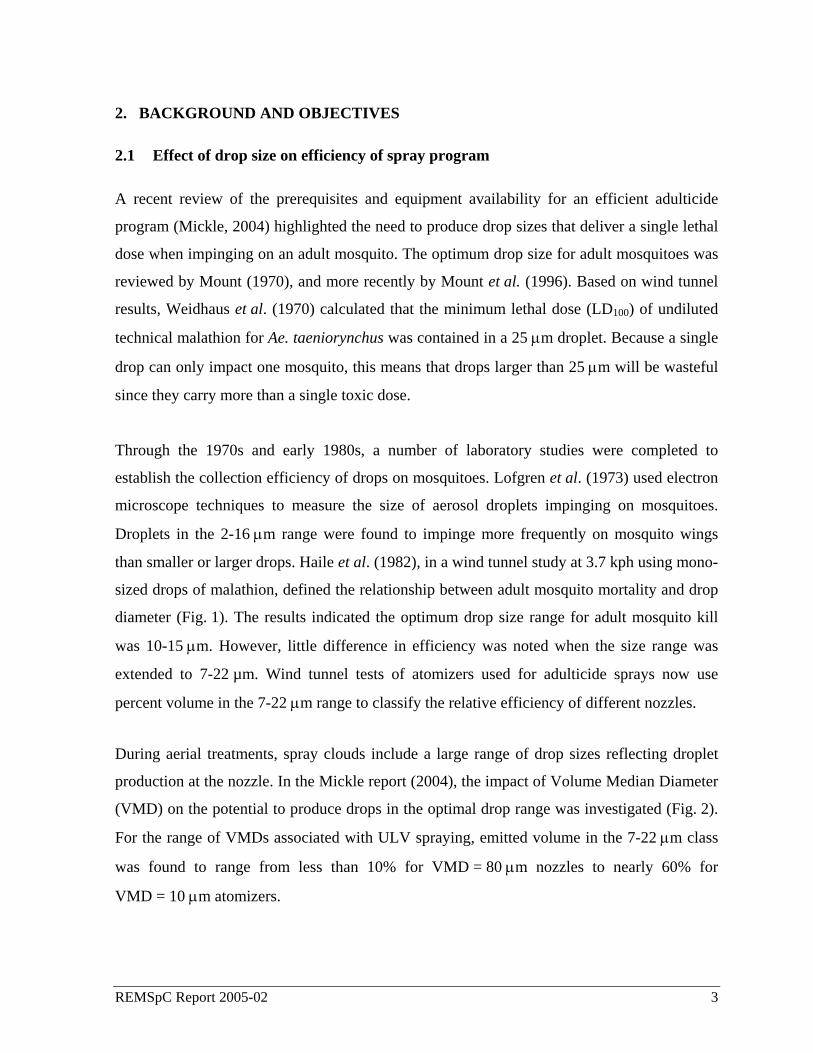
EXECUTIVE SUMMARY
A series of field trials were completed to inter-compare ground deposition from ground and
aerial sprays of Fyfanon® ULV adulticide and to compare these results with others predicted
by AGDISP. A ground cold-aerosol generator (Clarke GRIZZLY) was used in wind
conditions ranging from 3.6 to 12.4 kph. Deposit samples (fiberglass filters) were taken at 10
m intervals to 500 m downwind. Collocated at alternate sites, the spray cloud at 1.4 m height
was characterized using rotating 3 mm rods to measure drop density and size within the cloud.
Aerial trials using PJ20 high-pressure nozzles were completed in winds of 17-25 kph at spray
height (60 m). Ground deposit was measured at 100 m intervals to 5 km while the spray cloud
was characterized at 200 m intervals.
Under the meteorological conditions during the field trials, peak deposition from ground
(11 μm VMD) and aerial (32 μm VMD, 60 m height) were equivalent despite the 4-fold
application rate increase for aerial spraying. However, drop densities from the ground
application were 4-fold greater than for the aerial application. At spray heights of 60 m, peak
deposit was observed 800 m downwind of the flight line while drop density peaked nearly
1 km further down range. For ground application, average deposit peaked nearly 150 m from
the spray line and drop density about 100 m further down range. Wind speed had a significant
impact on deposit level from ground sprays. Malathion recovery to 500 m indicated between
10-50% of the spray was deposited depending on wind speed. For aerial sprays, 35-50% of
emitted malathion deposited within 5 km as winds at spray height ranged from 17-25 kph.
Integrated deposition to the end of the sampling grid was accurately predicted by AGDISP.
This model also predicted maximum deposits that were equivalent to those that were
measured in the field. For ground trials in high winds, the AGDISP peak deposit was beyond
the location of field measurement while in light winds it was closer. For aerial trials, the
predicted peak was beyond the location measured in the field. Predicted peak 1-hr average air
concentrations from aerial trials were significantly lower than for ground sprays being less
than 2 ng/L (1-hr average) compared with 5 ng/L for high wind ground sprays and 20 ng/L for
low wind ground sprays.

ii REMSpC Report 2005-02
ACKNOWLEDGMENTS
We are grateful for the financial support provided by the Ministry of Health and Social
Services of Québec and by the Institut national de santé publique du Québec. Appreciation is
warmly expressed to the many people who contributed to this study. We especially wish to
thank:
Pasco County Mosquito Control District
Dennis Moore
Wayne Daniels Fred Boston
Kim Feagley Kevin Hill
Manatee County Mosquito Control District
Mark Latham
Lloyd Watts Andrew Tornello
Jessica Christianson Stephanie Anderson
Lee County Mosquito Control District
Jonathan Hornby
SOPFIM
Julie Béliveau Yves Garant
INSPQ
Nathalie Morissette Guy Gingras
Forest Protection Limited
Kevin Dorcas

REMSpC Report 2005-02 iii
TABLE OF CONTENTS
EXECUTIVE SUMMARY....................................................................................................... I ACKNOWLEDGMENTS ...................................................................................................... II TABLE OF CONTENTS.......................................................................................................III LIST OF FIGURES .................................................................................................................V LIST OF TABLES ................................................................................................................. VI 1. INTRODUCTION ...........................................................................................................1 2. BACKGROUND AND OBJECTIVES..........................................................................3
2.1 Effect of drop size on efficiency of spray program ..................................................3 2.2 Objectives of the study .............................................................................................8
3. MATERIAL AND METHOD ........................................................................................9 3.1 Field Trials................................................................................................................9 3.2 Application Equipment.............................................................................................9
3.2.1 Ground..........................................................................................................9 3.2.2 Aerial ..........................................................................................................12
3.3 Field Site.................................................................................................................13 3.3.1 Ground........................................................................................................13 3.3.2 Aerial ..........................................................................................................15
3.4 Sampling Devices and Analyses Protocol ..............................................................18 3.4.1 Ground Samplers........................................................................................18 3.4.2 Sampling protocol ......................................................................................19 3.4.3 Spray cloud samplers..................................................................................21
4. RESULTS AND DISCUSSION....................................................................................25 4.1 Conservation and contamination ............................................................................25 4.2 Field Results ...........................................................................................................25 4.3 Model Predictions...................................................................................................35
4.3.1 Ground Trials .............................................................................................36 4.3.2 Aerial Trials................................................................................................39
5. CONCLUSIONS............................................................................................................43 6. RÉFÉRENCES ..............................................................................................................45

iv REMSpC Report 2005-02
APPENDIX 1 ASSESSMENT OF MALATHION STABILITY ON INERT MATERIALS ................................................ 47 APPENDIX 2 ANALYTICAL METHOD FOR THE DETERMINATION OF MALATHION ON FIBER GLASS FILTER BY GC-MS (E-437) .................................................................................................................. 51 APPENDIX 3 RESULTS OF GROUND TRIALS .................................................................................................... 55 APPENDIX 4 RESULTS OF AERIAL TRIALS ...................................................................................................... 63 APPENDIX 5 FIELD PARAMETERS FOR INPUT TO AGDISP ............................................................................. 75 APPENDIX 6 AGDISP 8.13 INPUT PARAMETERS FOR GROUND MODEL RUN .................................................. 79 APPENDIX 7 AGDISP 8.13 INPUT PARAMETERS FOR AERIAL MODEL RUN .................................................... 83

REMSpC Report 2005-02 v
LIST OF FIGURES
Figure 1. Relationship between LD50 and drop size for malathion. (Haile et al. 1982)....................................................................................................................4
Figure 2. Efficiency (7-22 μm) for reference nozzles ........................................................4 Figure 3. VMD for new high pressure and rotary atomizers. The 8001 at 80 psi is
included as a reference ........................................................................................5 Figure 4. Ground application equipment with close-up of Clarke Grizzly nozzle ...........10 Figure 5. Holding tank and flow controller linked to speedometer to adjust flow
to match truck speed..........................................................................................11 Figure 6. PCMCD Aztec with nozzle array mounted on starboard wing tip. Insert
shows close-up of the 6-PJ20 HP nozzles .........................................................12 Figure 7. Aerial view of grass farm where ground trials took place. Dashed line
shows sample line location................................................................................14 Figure 8. Fetch upwind and sample line downwind of spray line along gravel road
in sod farm.........................................................................................................14 Figure 9. Locations of experimental sites in Manatee County, FL...................................15 Figure 10. Aerial photo showing sampling regime for easterly wind. Kitoon
location is also noted .........................................................................................16 Figure 11. Aerial view of test area from 5000 m sample site looking East........................16 Figure 12. Meteorological support for the aerial trials included a surface tower,
Kitoon and AIMMS-20 .....................................................................................17 Figure 13. Sampler used to ground deposit ........................................................................19 Figure 14. Rotating impinger collocated with deposit sampler ..........................................22 Figure 15. Collection efficiency of 3 mm rods used during field trials (Specific
gravity = 1.23) ...................................................................................................23 Figure 16. Integrated ground deposit to 500 m as a percentage of emitted
malathion ...........................................................................................................26 Figure 17. Malathion recovered to 500 m as a function of wind speed..............................26 Figure 18. Integrated ground deposit to 5 km as a percentage of emitted malathion .........28 Figure 19. Malathion recovered to 5 km as a function of wind speed at spray height
(60 m) ................................................................................................................28 Figure 20. Summary of measured deposit from aerial and ground trials............................30 Figure 21. Average deposit normalized by LSS for ground and aerial applications. .........31 Figure 22. Comparison on average drop density on slides for aerial and ground
sprays.................................................................................................................32 Figure 23. Variation of average deposit and slide drop density downwind of the
flight line ...........................................................................................................34 Figure 24. Variation of ground deposit and slide drop density for ground sprays .............34

vi REMSpC Report 2005-02
Figure 25. Comparison of integrated deposit to 500 m for AGDISP predictions and field data............................................................................................................36
Figure 26. Comparison of AGDISP deposit and field measurements for high and low wind cases during ground trials..................................................................37
Figure 27. AGDISP predicted air concentrations during ground spraying in low and high winds ..................................................................................................38
Figure 28. Comparison of average slide drop density (#/cm2) during high and low-wind ground sprays ...........................................................................................39
Figure 29. Comparison of integrated deposit to 5 km for AGDISP and field aerial trials...................................................................................................................39
Figure 30. Comparison of measured and AGDISP predicted deposit for aerial sprays in winds from 17.5-25 kph.....................................................................40
Figure 31. Comparison of deposit fall-off in far field. AGDISP data have been shifted 400 m to match peak location of field data ...........................................41
Figure 32. Predicted average air concentration at 1.5 m height for aerial sprays in 17.5 and 25.5 kph winds....................................................................................41
LIST OF TABLES
Table 1. Parameters for wind tunnel tests .........................................................................5 Table 2. Specifications for Ground Aerosol Generators ...................................................7 Table 3. Wind tunnel results for 6-PJ20 nozzles used on Aztec. Drop diameters
(μm) corresponding to 10%, 50% and 90% of emitted volume are listed ........13

REMSpC Report 2005-02 1
1. INTRODUCTION
Adulticide spraying is one of the available methods to control West Nile Virus during the
emergence of an important epidemic situation. However, it is necessary to estimate the
toxicological and environmental risk for these pesticide use strategies. While mathematical
spray-dispersion models (Wallace et al., 1995; Bilanain et al., 1989) can provide a less
expensive method than individual field trials to estimate ground deposition and air
concentrations from pesticide spraying, field trials in realistic operational conditions are
necessary to validate model predictions.
AGDISP, a spray-fate model, is presently being used to evaluate drift from aerial treatments.
However, no specific field trials have been conducted to assess the model’s capabilities when
applied to mosquito adulticide programs. Recently, a module has been added to AGDISP for
ground application simulation. With the development of new spray equipment (high pressure
system), the validation of model predictions for ground deposit and air concentration is
warranted. In the context of risk analysis for the Province of Québec, model validation for the
aerial and ground application of malathion is necessary before utilization of the model for
impact assessment.
This report documents a series of field trials that were completed in Florida to inter-compare
ground deposition from ground ULV and aerial adulticide sprays of Fyfanon® ULV and to
compare these results with AGDISP predictions.

REMSpC Report 2005-02 3
2. BACKGROUND AND OBJECTIVES
2.1 Effect of drop size on efficiency of spray program
A recent review of the prerequisites and equipment availability for an efficient adulticide
program (Mickle, 2004) highlighted the need to produce drop sizes that deliver a single lethal
dose when impinging on an adult mosquito. The optimum drop size for adult mosquitoes was
reviewed by Mount (1970), and more recently by Mount et al. (1996). Based on wind tunnel
results, Weidhaus et al. (1970) calculated that the minimum lethal dose (LD100) of undiluted
technical malathion for Ae. taeniorynchus was contained in a 25 μm droplet. Because a single
drop can only impact one mosquito, this means that drops larger than 25 μm will be wasteful
since they carry more than a single toxic dose.
Through the 1970s and early 1980s, a number of laboratory studies were completed to
establish the collection efficiency of drops on mosquitoes. Lofgren et al. (1973) used electron
microscope techniques to measure the size of aerosol droplets impinging on mosquitoes.
Droplets in the 2-16 μm range were found to impinge more frequently on mosquito wings
than smaller or larger drops. Haile et al. (1982), in a wind tunnel study at 3.7 kph using mono-
sized drops of malathion, defined the relationship between adult mosquito mortality and drop
diameter (Fig. 1). The results indicated the optimum drop size range for adult mosquito kill
was 10-15 μm. However, little difference in efficiency was noted when the size range was
extended to 7-22 µm. Wind tunnel tests of atomizers used for adulticide sprays now use
percent volume in the 7-22 μm range to classify the relative efficiency of different nozzles.
During aerial treatments, spray clouds include a large range of drop sizes reflecting droplet
production at the nozzle. In the Mickle report (2004), the impact of Volume Median Diameter
(VMD) on the potential to produce drops in the optimal drop range was investigated (Fig. 2).
For the range of VMDs associated with ULV spraying, emitted volume in the 7-22 μm class
was found to range from less than 10% for VMD = 80 μm nozzles to nearly 60% for
VMD = 10 μm atomizers.

4 REMSpC Report 2005-02
0%
10%
20%
30%
40%
50%
60%
70%
80 40 20 10Volume Median Diameter (µm)
Volu
me
in 7
-22µ
m R
ange
Figure 1. Relationship between LD50 and drop size for malathion. (Haile et al. 1982)
Figure 2. Efficiency (7-22 μm) for reference nozzles
0 10 20 30 40Drop Diameter (μm)
0
4
8
12LD
50 (A
rbitr
ary
Uni
ts)

REMSpC Report 2005-02 5
Atomizers that have been wind-tunnel tested and exhibit sub-30 μm VMDs fall into two
categories; high pressure and rotary. Ag/forestry nozzles even at 80 psi do not provide
adequate atomization for adulticide sprays. Figure 3 shows the VMD for new high pressure
and rotary atomizers. Details of the wind tunnel tests are tabulated in Table 1.
Figure 3. VMD for new high pressure and rotary atomizers. The 8001 at 80 psi is included as a reference
Table 1. Parameters for wind tunnel tests
Manufacturer Atomizer VMDRPM
Speed (kph)/Angle
Pressure (psi)
Flow (L/min)
Efficiency % Volume (7-22um)
AU4000 27 9500 1 <35AU5000 27 9000 0.3 <27
16 15100 0.5 4427 13600 3.5 30
Clarke Mosquito Control www.cmosquito.com
Beecomist 25 17500 0.6 <44
Spraying Systems Co www.teejet.com 8001 57 224/135 80 0.6 11
15 128 1500 0.4 5514 224 1500 0.4 5318 192 1500 0.9 4413 192 3000 1.3 55
Curtis Dyna-Fog www.dynafog.com ASC-A20 25 25000 0.8 No Data
Micron 6600
Bete Fog Nozzle, Inc www.bete.com
PJ10
PJ20
Micron UK www.micron.co.uk
0
10
20
30
40
50
60
AU4000/9500
AU5000/ 9000
8001/ 80psi
Beecomist 4
0µm mesh/ 1
7500
micron 6600
/ 15100/ 0
.5L/m
micron 6600
/ 13650/ 3
.5L/m
ASC-A20/
25000
bete pj10/ 1500psi/ 2
24kph
bete pj20/ 1500psi
bete pj10/ 1500psi/1
28 kph
bete pj20/ 3000psi
VMD
(µm
)

6 REMSpC Report 2005-02
Wind tunnel data were supplied by Jonathan Hornby (Lee County Mosquito Control) and
Andrew Hewitt (CPAC, University of Queensland). All data sets were generated using
Malvern laser systems. Malathion was not used in any of the tests. Of the nozzles evaluated,
flat fan nozzles, even when pointed forward 45o, still only produced around 10 % of emitted
volume in the desirable range. With VMDs approaching 30 μm, rotary atomizers produce
nearly 30% of emitted volume in the optimized drop range. Sub-30 μm VMD with rotary
atomizers has been achieved by resizing the basket screen and increasing the rpm. Both the
Clarke Beecomist and Micron 6600 are electric atomizers that can achieve VMDs ~25 μm
independent of air speed. Rotational speeds exceeding 13000 rpm are required for the small
drop atomization. Small VMDs were achieved at low flow rates (0.5 L/min). Reducing the
VMD by using High Pressure (>1000 psi) nozzles increased the emitted volume to greater
than 40% of emitted volume in the desirable range. HP nozzles (PJ10, PJ20) operating at
pressures of 1500-3000 psi were capable of providing sub-20 μm VMDs (using Orchex oil) at
flows ranging from 0.4-1.3 L/min. The Mickle report (2004) concluded that atomizer VMD
should be maintained below 30 μm for aerial adulticide programs.
For ground application in the United States, the mosquito industry has moved away from sub-
10 μm thermal foggers and is now using cold-aerosol generators for ground fogging
treatments. In Canada, the malathion label specifically states that the VMD should not exceed
17 μm with less than 3% of the spray drops exceeding 32 μm and no drops exceeding 48 μm.
The 48 μm statement is a precaution against paint damage on cars.
Aerosol generators for ground treatment of mosquitoes are listed in Table 2. All equipment is
stated by the manufacturer to meet or exceed label requirements, i.e. VMD is less than 17 μm.
No recent wind tunnel studies have been made to characterize drop sizes due to the physical
size of the equipment. Limited field studies using slide impingers or AIMS hot wire systems
are available. Results are listed in the table. Hand waving a Teflon-coated slide near the outlet
is generally used to calibrate equipment to ensure that the VMD remains less than 17 μm.

REMSpC Report 2005-02 7
Table 2. Specifications for Ground Aerosol Generators
From the literature review, a few basic facts were clear:
1. Droplet sizes around the LD100 diameter are preferred for aerial sprays. For
malathion, this drop size is 25 μm.
2. Reducing the VMD of aerial operations to near 25 μm will significantly reduce
deposition and can significantly increase mosquito mortality over extended
distances.
3. High mosquito population reduction is possible with small drop (VMD 20-
25 μm) sprays as long as aircraft offsets and spray-line patterns reflect local
meteorology during the treatment program.
Manufacturers Equipment Max Flow (L/min)
Horse Power
Label Language
Field Study VMD (um)
Notes
18-20 0.59 18 16-18XKE 0.53 8
500LD 0.59 5.5800MD 1.0 81800HD 1.0 18
Typhoon I 9Typhoon II 0.53 11
Typhoon IIP 9,11Maxi-Pro 1-45 0.6 18
Maxi-Pro 4 0.6 18 15-17Maxi-Pro 4P 4-nozzlesMaxi-Pro 2P 1.18 18
Maxi-Pro 2D 3.8 18 at high flows 40um drops
Maxi-Pro 1800 0.6 18Cougar 0.53 8
Fox0.18
siphon 8Grizzly 0.53 18 14-16
Curtis Dyna-Fog, Ltd www.dynafog.com 3
London Foggers, Inc www.Londonfoggers.com 1
2Phoenix Fogger
www.phoenixfogger.com
Clarke Mosquito Control www.cmosquito.com 4
4. Meets all label requirements for ground ULV chemicals including Malathion
1 produces the correct particle size to meet all insecticide label requirements at vehicle speeds up to 20 miles/hr2 Meets or exceeds all label requirements for ground ULV products, including malathion3 90% of spray droplets below 20 microns
Label Language
8 REMSpC Report 2005-02
Deposition of the mosquito adulticide contributes to efficacy loss as well as a potential
environmental or human health impact. In the Mickle (2004) report, existing field trials were
reviewed to evaluate the potential for deposit from operational ground and aerial mosquito
adulticide equipment. No field trials were found that directly compared deposit from aerial
and ground-based sprays using optimal spray equipment for adult-mosquito control. Based on
wind tunnel studies and operational parameters for optimal ground and aerial programs,
potential deposition levels were compared using the spray-fate model, AGDISP.
Initial model runs indicated:
1. Positions of peak deposit can be predicted relatively accurately when input
data reflect actual spray conditions. Field verification of modeled deposit
levels needs to be continued.
2. Peak deposit from ground applications may exceed those from aerial
applications even when aerial rates are 4-fold greater. No field studies have
directly compared deposit from aerial (VMD < 30 μm) and ground
applications. Field studies to document differences need to be completed.
3. Aerial applications can be optimized to minimize pesticide usage and reduce
environmental contamination. Close contacts should be maintained with the
American Mosquito Control Association to monitor advances in this area.
4. Field studies are needed to document the accuracy of AGDISP to predict
ground deposit when using new optimal spray equipment for adult mosquito
control.
2.2 Objectives of the study
The main objective of the present study was to assess the accuracy of the AGDISP model to
predict ground deposit and aerial concentrations for ground ULV and aerial sprays. Specific
objectives were:
1. Obtain accurate field data to intercompare deposit and drift from ground ULV
and aerial adulticide sprays of Fyfanon® ULV under open field conditions.
2. Compare these data sets with AGDISP predictions.

REMSpC Report 2005-02 9
3. MATERIAL AND METHOD
3.1 Field Trials
With the assistance of the Pasco County Mosquito Control District (PCMCD) and the
Manatee Mosquito Control District (MMCD), a series of field trials were conducted in Florida
to compare deposition from ground and aerial applications of Fyfanon® ULV (96.5%
malathion). Application equipment, provided by PCMCD, represented atomizers that
maximized droplet size in the range relevant to adult mosquito control.
3.2 Application Equipment
3.2.1 Ground
Ground application utilized a Clarke Grizzly nozzle (Fig. 4) mounted 1.85 m above ground
and angled up at 45o. Fyfanon® ULV was injected into the nozzle at 6 psi and dispersed using
a Roots blower. Flow was controlled (Fig. 5) to provide 0.127 L/min at 16 kph and adjusted
as truck speed changed. At a label rate of 60.8 g a.i. malathion/ha, this provided pesticide for
an equivalent swath of 93 m (Appendix 5). Using the waved-slide technique, the emitted
drop-size distribution was found to have a VMD near 11 μm.

10 REMSpC Report 2005-02
Figure 4. Ground application equipment with close-up of Clarke Grizzly nozzle

REMSpC Report 2005-02 11
Figure 5. Holding tank and flow controller linked to speedometer to adjust flow to match truck speed

12 REMSpC Report 2005-02
3.2.2 Aerial
The PCMCD Piper Aztec (Fig. 6) was equipped with 6-PJ20 nozzles mounted at the tip of the
starboard wing. Flow through the nozzles was fixed at 8.18 L/min. Boom pressure was
maintained at 1520 psi. Wind tunnel tests (Jonathan Hornby, Lee County Mosquito Control)
of the 6-PJ20 nozzles used on the Aztec spraying Fyfanon® produced sprays with VMDs
(Dv0.5) around 32 μm (Table 3). Comparison of these same nozzles spraying oil (Table 2)
showed a significant shift to larger VMD when Fyfanon® was used. For a ground speed of
240 kph, a swath of only 93.3 m (similar to ground application) could be realized for a label
rate of 260 g a.i. malathion/ha (i.e. 4x the application rate). Spray height was maintained at
60 m above ground level (AGL).
Figure 6. PCMCD Aztec with nozzle array mounted on starboard wing tip. Insert shows close-up of the 6-PJ20 HP nozzles
REMSpC Report 2005-02 13
Nozzle ID Dv0.1 Dv0.5 Dv0.9
1 15 32 85 2 16 32 79 3 15 32 80 4 16 33 88 5 16 34 93 6 15 32 84
Table 3. Wind tunnel results for 6-PJ20 nozzles used on Aztec. Drop diameters (μm) corresponding to 10%, 50% and 90% of emitted volume are listed
3.3 Field Site
3.3.1 Ground
For the ground trials, a vacated sod farm in Manatee County, FL was chosen (Fig. 7). The site
afforded nearly 500 m of low grass upwind fetch for the predominate easterlies that occurred
during the early evening trials (Fig. 8). Ground samplers were located at 10 m intervals from
the spray line (gravel road) to 500 m downwind. Collocated at every second sample station, a
rotating 3 mm-slide impinger was mounted on a 1.4 m pole to provide measurements of drop
density and size in the drifting cloud. The first sampler was placed 10 m downwind of the
spray line. A 3 m tower located at the side of the spray line provided meteorology at the time
of the sprays.
Each trial consisted of a single pass along the 700 m spray line. Truck speed was maintained
at 15 kph maximum. Flow rate was adjusted automatically as speed varied away from the
15 kph. Sample collection commenced 20-30 min after the spray was completed, leaving
sufficient time for the spray cloud to pass the furthest downwind sampler.

14 REMSpC Report 2005-02
Figure 7. Aerial view of grass farm where ground trials took place. Dashed line shows sample line location
Figure 8. Fetch upwind and sample line downwind of spray line along gravel road in sod farm
REMSpC Report 2005-02 15
3.3.2 Aerial
Aerial trials took place in a rural area of Manatee County, south and east of the grass farm site
(Fig. 9). Local paved roads provided easy access for establishing a sampling grid to
accommodate all wind directions. Deposit-sampling sites were established at 100 m intervals
at the edge of the roadway (Fig. 10, 11) out to a distance of 5000 m from the flight line.
Limited traffic occurred during the trials. Vegetation around each sampler site was cut to
eliminate potential spray removal before depositing on the ground samplers. Cloud
characterization sites (rotating impingers) were established at 200 m intervals starting at the
flight line.
Figure 9. Locations of experimental sites in Manatee County, FL

16 REMSpC Report 2005-02
Figure 10. Aerial photo showing sampling regime for easterly wind. Kitoon location is also noted
Figure 11. Aerial view of test area from 5000 m sample site looking East

REMSpC Report 2005-02 17
Each trial consisted of 4 passes in opposite directions along the same 10 km flight line. The
flight-line length was set to ensure a representative deposition along the sample line despite a
possible wind shift. The multiple-pass scenario was used to ensure differential vortex
behavior due to mounting of nozzles on one side of the aircraft would be eliminated. Also the
multi passes provided additional deposit out to downwind distances of 5 km thereby ensuring
sufficient analysis sensitivity. Samples were retrieved 45-60 min after spraying was
completed depending of the surface wind speed.
All aerial trials were supported with meteorology at the ground (tower), at aircraft height
(Kitoon) and above spray height using the AIMMS-20 (Fig. 12) mounted on a separate
aircraft. The AIMMS-20 and aircraft were supplied by Forest Protection Limited, Fredericton,
New Brunswick. An evaluation of the AIMMS-20 (Mickle, 2005) indicated a 2 kph and 5o
accuracy could be expected.
Figure 12. Meteorological support for the aerial trials included a surface tower, Kitoon and AIMMS-20

18 REMSpC Report 2005-02
Temperature, relative humidity, wind direction and wind speed were collected by each
sampling device.
3.4 Sampling Devices and Analyses Protocol
3.4.1 Ground Samplers
Selection of sampling materials In order to measure optimal deposit values in an actual environment, malathion concentrations
were measured on inert receptive components (fiberglass filters). The use of these filters
enables maximum recovery of deposit in realistic operational conditions, as the medium does
not have any characteristics that contribute to furthering product degradation. Tests conducted
in Murdochville, during the summer of 2003, by the Direction de la toxicologie humaine de
l’Institut national de santé publique du Québec (INSPQ) and the Société de protection des
forêts contre les insectes et les maladies (SOPFIM) showed that malathion deposited on soil
could be very unstable depending on soil pH. These results were consistent with reported
variability in data found in scientific literature on persistence of malathion in this matrix. For
these reasons, using inert substrates was justified.
Many researchers have used filters or simply paper to evaluate residual pesticide deposits
(Dukes et al., 2004; Knepper et al., 2003; Hester et al., 2001; Tietze et al., 1996 et 1994;
Moore et al., 1993; CDFA, 1991). This technique has also been used for the evaluation of
deposits in studies on cutaneous exposure (Samuel et al., 1996; Marty et al., 1994; Brouwer
et al., 1992; Fenske, 1989; Turnbull, 1985). Most authors note the importance of respecting
certain characteristics of the medium that should be used. It should be absorbent enough to
retain the deposited product as well as being sufficiently inert as to not further the degradation
of the pesticide. Moreover, the pesticide should be easily extracted without breaking the filter
or the paper used. Some authors have used alpha cellulose filters, fiberglass filters or simple
paper towels. In the summer of 2003, fiberglass filters were successfully used to measure
malathion deposits in the course of the Murdochville project. Stability tests conducted by the
toxicology laboratory of the INSPQ showed that malathion was slightly more stable on

REMSpC Report 2005-02 19
fiberglass filters that on alpha cellulose filters. However, fiberglass filters are slightly more
fragile and must be manipulated with care.
3.4.2 Sampling protocol
The following protocol was followed for both ground and aerial trials: 1. Nine-centimeter (diameter) fiberglass filters were set on supports allowing samples
to be taken directly at ground level. The filters were fastened with 2 paperclips on a circular
piece of previously numbered metal (electrical junction box cover) approximately 10 cm in
diameter (Fig. 13). For each test, sampling devices were set on a rigid piece of paper
15 X 15 cm with a metallic finish backing. This paper was placed directly on the ground and
changed for every trial in order to avoid filter and support contamination. At selected
locations, blank filters were placed on the ground and recovered prior to a spray in order to
assess potential contamination from handling.
Figure 13. Sampler used to ground deposit
20 REMSpC Report 2005-02
2. After each trial, sampler recovery was delayed until the pesticide cloud had cleared
the sampling area. Surface winds were used to estimate residency time of the cloud. Filters
and their supports were collected using fine long-nose tongs and put into a Petri dish (150 mm
diameter X 15 mm) and identified with the same number as the sampling device. Samplers
were handled only at the rim of the metal support in order to avoid filter contamination.
Samples were immediately put into a container providing a cold temperature and absence of
light in order to minimize sample degradation.
3. Each filter paper was transferred into a pre-washed 22 ml (Supelco cat. 27343) glass
tube at the end of the sampling period. Paperclips were removed with micro-tongs and the
filter was folded in two while ensuring that only the non-exposed surface touched the work
surface. At this stage, the tongs were only in contact with a minuscule part of the filters’ rim.
Once folded, the filter was rolled lengthwise, then put in the glass bottle previously labelled
with the same number as the sample. During the overall transfer operation, the exposed part of
the filter was never touched and the non-exposed part was always manipulated while wearing
latex gloves. The tongs were cleaned with solvent after each filter change.
4. In preparation for the field trials, stability tests were conducted to develop protocols
for storage and transport of the samples. Pieces of cloth and cotton gloves spiked with
malathion indicated that the pesticide should be stable for at least a few months if the samples
were kept in the dark at 4°C. These results suggested that stability should be similar for the
filters (Castro Cano et al., 2001). The INSPQ toxicology laboratory conducted persistency
tests in order to verify different parameters that could affect the stability of the samples. The
results of these tests served to finalize the conservation and transportation strategy for the
samples. The protocol and the results from the stability tests are presented in Appendix 1.
Also, during the field tests, reference filters were spiked with deuterated malathion and high
purity malathion in order to ensure the absence of degradation during storage and
transportation.

REMSpC Report 2005-02 21
5. The filters were kept under optimal conditions until their arrival at the INSPQ
laboratory. In Florida, the samples were kept at -20°C in a freezer. During transport between
Florida and Québec, the samples were kept in the same freezer in which an appreciable
amount of hermetic plastic containers containing ice, were added. Over the whole trip, the
refrigeration content was verified and ensured.
6. At the laboratory, the filters were washed according to a recognized extraction
procedure that had been validated by the toxicology laboratory in the summer of 2003.
Finally, the extracts were analyzed according to the E-437 method developed in the same
laboratory (Appendix 2).
7. Malathion extractions were divided by the sampling area (63.6 cm2) with results
presented as gm/ha in order to compare to application rate.
3.4.3 Spray cloud samplers
At alternate sampler sites, a rotating impinger, mounted atop a 1.4 m post (Fig. 14), was
collocated with a ground sampler to provide a measure of drop density and drop sizes in the
spray cloud. A 3 mm square rod was secured 8.9 cm from the axis of rotation and rotated at
640 rpm. Teflon tape applied to the leading surface of the rotating rod provided a stable
surface to which the swept droplets could adhere. Previous studies in Florida had documented
considerable aerosol background of droplets that were of similar size to those used during
adulticide sprays. For this reason a fluorescent tracer (150 gm Uvitex OB) was dissolved in
3 L of toluene and added to 113 L of Fyfanon® tank mix. Earlier tests had been conducted to
determine the optimal amount of tracer to use and to ensure no interference during malathion
analysis.

22 REMSpC Report 2005-02
Figure 14. Rotating impinger collocated with deposit sampler
Drops on rods were scanned by microscope under ultraviolet light to distinguish spray drops
from background. Drop sizes and area scanned were documented in order to establish drop
size and drop density variations along the sample line. Droplet counts on the sample rods
were corrected for collection efficiency following May and Clifford’s (1967) work using
ribbons. Utilizing 3 mm rods spinning at 640 rpm, collection efficiencies varied from less
than 10% for sub-6 μm drops to greater than 80% for drops greater than 25 μm (Fig. 15).
VMD and drop density at each sample site were calculated using Slide Analysis, a freeware
program from REMSpC Consulting.
REMSpC Report 2005-02 23
Figure 15. Collection efficiency of 3 mm rods used during field trials (Specific gravity = 1.23)
0%
20%
40%
60%
80%
100%
0 20 40 60 80 100
Drop Diameter (um)
Col
lect
ion
Effic
ienc
y
sg=1.23


REMSpC Report 2005-02 25
4. RESULTS AND DISCUSSION
4.1 Conservation and contamination
Analysis of samples containing deuterated malathion indicated no degradation during
transport between field and laboratory. For the two tests made, the recovery was 100 ± 2 %.
Moreover, analysis of blank samples for all the field trials indicated no contamination.
4.2 Field Results
Details from individual trials can be found in Appendices 3 and 4. Meteorological conditions
during each trial as well as the resultant deposit and spray cloud characteristics are graphed.
Ground trials took place in significantly different wind regimes, winds that were around
12 kph and winds that were less than 6 kph. Generally, peak deposit levels in the higher wind
sprays were lower than in the sub-6 kph sprays where deposit levels reached 20 gm/ha. Drop
densities on the rotating slides maximized at locations ranging from 50-150 m further down
range than the location of peak deposit. Maximum drop density ranged from 300-
500 drops/cm2. VMD of the drifting cloud was typically around 10 μm with a small but
perceptible shift to smaller drops with distance away from the spray line. Number median
diameter (NMD = 50% of drops measured had smaller diameters) was less than 4 μm
highlighting the fact that the majority of measured drops were very small. Characterization of
the spray cloud at the exit of the Grizzly nozzle produced a VMD near 11 μm, consistent with
the rotating impinger results.
Integrated deposit to 500 m resulted in Malathion recoveries ranging from less than 10% to
nearly 50% (Fig. 16) of the emitted spray. Integrated malathion to 500 m downwind
decreased as wind speed increased (Fig. 17). Typically, evening ground ULV applications
will occur in very light winds. Field results suggest that 30-50% of the spray would be lost to
deposition within 500 m downwind.

26 REMSpC Report 2005-02
Figure 16. Integrated ground deposit to 500 m as a percentage of emitted malathion
Figure 17. Malathion recovered to 500 m as a function of wind speed
Ground
0%
20%
40%
60%
80%
100%
20:20 21:40 19:25 20:27 21:24
Mas
s D
epos
ited
(500
m)
Oct 06 Oct 09
0%
10%
20%
30%
40%
50%
60%
0 5 10 15
Wind Speed (kph)
Mal
athi
on R
ecov
ered

REMSpC Report 2005-02 27
Results from individual aerial trials can be found in Appendix 4. All data have been
normalized to a single spray line. At the spray height (60 m), winds were relatively uniform
ranging from 18-24 kph while surface winds were generally less than 4 kph. Meteorological
profiles obtained from the tower-Kitoon -AIMMS20 combination showed a strong increase in
winds with height within the nocturnal inversion. Over the layer, wind direction remained
relatively uniform. Deviations noted in the surface layer were due to local topography that
acted to channel the light winds. Peak malathion deposit ranged from 6-20 gm/ha similar to
that for the ground application despite the fact that the application rate was 4 times greater
(260 g a.i./ha vs 60.8 g a.i./ha for ground application). Maximum deposit was found 500-
1000 m downwind of the flight line. Peak slide drop densities were 10-20% of those measured
from ground applications. Generally peak drop density was found 1 km further downwind
from the deposit peak. Measured drops produced VMDs that were 10-15 μm while NMD was
around 5 μm. The winnowing effect of drop size with distance was especially noticeable on a
couple of trials where the VMD and to a lesser extent NMD decreased with distance away
from the flight line.
Integration of deposit to 5 km resulted in 30-55% of the emitted Malathion being recovered
(Fig. 18). Recovered malathion decreased as wind speed at aircraft height increased (Fig. 19).
When using meteorology to target small-drop adulticide sprays, winds at the height of the
aircraft, being significantly different in speed and possibly direction than at the surface, are
the most relevant to use.

28 REMSpC Report 2005-02
Figure 18. Integrated ground deposit to 5 km as a percentage of emitted malathion
Figure 19. Malathion recovered to 5 km as a function of wind speed at spray height (60 m)
0%
10%
20%
30%
40%
50%
60%
0 5 10 15 20 25 30Wind Speed (kph)
Mal
athi
on R
ecov
ered
(5
km)
Aerial
0%
20%
40%
60%
80%
100%
20:13 22:54 1:03 20:04 21:42
Mas
s D
epos
ited
(5km
)
Oct 08 Oct 09 Oct 12

REMSpC Report 2005-02 29
In figure 20, deposit (gm malathion/ha) has been summarized for the five ground and aerial
sprays. Maximum, minimum and average deposit at each downwind sampling location has
been graphed. For the ground ULV trials, peak average deposit occured approximately 150 m
downwind of the spray truck. Over the first 93 m (swath) average deposit is less than 40% of
peak deposit. Since the spray cloud is blasted up at 45o from the nozzle at 1.85 m, negligible
deposit was found over the first 10-30 m downwind of the truck. For the aerial sprays, peak
malathion deposit was found nearly 800 m down range from the flight line beyond which
deposit decay was typically Gaussian with distance. Negligible deposit was found within the
immediate 93 m swath. Little difference in peak malathion deposit from the different
application techniques was found despite the 4-fold increase in application rate during the
aerial trials. Deposit variability was significantly higher for the ground trials than for the
aerial trials.
Line source strength (LSS) is a measure of malathion released per unit length of spray line
and takes into account not only the speed of the vehicle but also the flow rate. For the aerial
spray, flow was limited by the capacity of the high pressure pump; the resultant operational
swath being identical to the ground application at 4.3 times the label rate. This resulted in an
aerial LSS that was 4.3 times that for ground application. Normalizing deposit by LSS
removes differences associated with application rate so that the influence of application
parameters (spray height, drop size distribution and meteorology) can be investigated
(Fig. 21). Viewing normalized deposit from the two application strategies shows that in fact
the peak average deposit from the ground applications was 3-4 fold greater than from an aerial
application having the same LSS. Much of this difference can be related to differences in
spray height. Drop densities on rotating slides indicated a significantly denser cloud from
ground sprays (Fig. 22). While drop density peaked near 70 drops/cm2 for aerial sprays,
ground sprays produced drop densities that were nearly 4-fold greater. To achieve spray cloud
densities equivalent to ground sprays, 3-4 passes would be required to build the cloud density
to the same level. However, having built the cloud, the slide data suggest that the cloud
densities would be maintained over distances of at least 2 km. Peak drop density from the
aerial spray was nearly 2 km downwind of the flight line while it was 230 m for the ground
spray. Swath offsets for aerial sprays approaching 2 km would be needed to target the small-

30 REMSpC Report 2005-02
drop adulticide cloud. Interestingly, the swath for ground spraying is 93 m while maximum
drop density (mosquito kill) was 2 times further downwind
Figure 20. Summary of measured deposit from aerial and ground trials
0
5
10
15
0 1000 2000 3000 4000 5000
Distance from Flight line (m)
Dep
osit
(g/h
a)
Aerial
0
5
10
15
0 100 200 300 400 500
Distance from Truck (m)
Dep
osit
(g/h
a)
Ground

REMSpC Report 2005-02 31
Figure 21. Average deposit normalized by LSS for ground and aerial applications.
0
1
2
3
4
0 1000 2000 3000 4000 5000
Distance from Spray Line (m)
Dep
osit
(g/h
a)/L
SS (g
/km
)Aerial
0
5
10
15
0 100 200 300 400 500
Distance from Truck (m)
Dep
osit
(g/h
a)/ L
SS (g
/km
)
Ground

32 REMSpC Report 2005-02
Figure 22. Comparison on average drop density on slides for aerial and ground sprays
0
20
40
60
80
100
120
0 1000 2000 3000 4000 5000
Distance from Flight line (m)
Slid
e D
rop
Den
sity
/pas
s (#
/cm
2 )
Aerial
0
100
200
300
400
500
600
700
10 110 210 310 410
Distance from Truck (m)
Slid
e D
rop
Den
sity
(#
/cm
2 )
Ground

REMSpC Report 2005-02 33
While average deposit tended to maximize near 800 m during aerial sprays, drop density
peaked nearly 1 km further down wind (Fig. 23). Drop sizes tended to decrease with sampling
distance (Appendix 4) due to winnowing that led to deposition of the larger drops closer to the
spray line. Typically, the VMD of the airborne cloud was sub-15 μm at distances beyond
800 m, the small drops being capable of sustained drift over long distances. A similar effect
was also seen in the data set from the ground-based applications (Fig. 24). Although not as
pronounced, peak drop densities were still displaced 100 m further down wind.
A swath analysis of measured drop density (Fig. 22) indicates a swath of 3.6 km could be
sustained and provide a coefficient of variation (COV) of 0.3. However, pumping rates for the
high-pressure system resulted in an operational swath of only 93 m in order to maintain a
label rate of 260 g a.i. malathion/ha. Utilizing the maximum flow rates and a track space of
1 km could result in a uniform cloud peaking at 260 drops/cm2 at 4 km downwind of the
upwind line and having a COV of only 0.1. Predicted peak deposit would be 14 g a.i.
malathion/ha near the same location as the peak cloud density. Over the same area
maintaining an operational swath of 100 m would result in peak deposit levels closer to 100 g
a.i./ha while drop densities would exceed 1100 drops/cm2, i.e. resulting in a cloud far denser
than from ground applications. Utilizing the field deposit and drift data, optimization schemes
can be designed that would minimize environmental loading and still result in efficacious
cloud densities.

34 REMSpC Report 2005-02
Figure 23. Variation of average deposit and slide drop density downwind of the flight line
Figure 24. Variation of ground deposit and slide drop density for ground sprays
0
5
10
15
0 1000 2000 3000 4000 5000
Distance from Flight line (m)
Dep
osit
(g/h
a)
Aerial
0
20
40
60
80
100
120
Slid
e D
rop
Den
sity
/pas
s (#
/cm
2)
0
100
200
300
400
500
600
700
Slid
e D
rop
Den
sity
/pas
s (#
/cm
2)
0
5
10
15
0 100 200 300 400 500
Distance from Truck (m)
Dep
osit
(g/h
a)
Ground

REMSpC Report 2005-02 35
4.3 Model Predictions
The USDA Forest Service AGDISP model has been accepted both within the scientific and
regulatory communities as one of the best spray-fate models available for aerial spraying. In
the early 1990s, the AGDISP model was compared extensively to a series of field trials
carried out by the Spray Drift Task Force (SDTF). Principally tested against agricultural
spraying, the model utilizes operational parameters such as release height, drop size
distribution and meteorology to calculate drop motion from the aircraft until deposit occurs.
Although running the model for high spray heights and very small drop sizes is feasible, no
comprehensive data set is available to test the model under these extreme conditions. The
public version of AGDISP allows calculations to downwind distances of only 1500 m, far
short of distances used during these aerial trials. A special version made available to
REMSpC Consulting relaxed this restriction to 5 km.
With the recent release of Version 8.13 (used in this report), a ground module has been added
to AGDISP. The ground model was specifically designed for agricultural row-crop spraying
where nozzles are pointed down towards the crop and air entrainment assists movement of the
very small drops into the canopy. For the ground-based adulticide simulations, pressure at the
nozzle was reduced in order to ‘turn-off’ the entrainment model.
Inputs to AGDISP v8.13 for both aerial and ground simulations are listed in Appendices 6 and
7. For the aerial trials, nozzles were placed at the ends of both wings (only the starboard wing
had nozzles on the Aztec) in order to alleviate vortex differences from the upwind and
downwind wings. For the field trials, the Aztec was flown in both directions in order to
resolve differences. Wind tunnel characterization of the PJ20 nozzles was used to initialize
drop size distributions at the aircraft. Meteorological conditions at spray height (Kitoon) were
used to evaluate the impacts of winds on spray cloud motion and ground deposit. Aircraft
height remained fixed at 60 m. For ground trials, the height of the Grizzly nozzle was used as
the release point of the spray. In-field drop-size distributions taken directly behind the truck
using the ‘waved-slide’ technique established the initial cloud. Meteorology from the 3 m
tower was used to evaluate deposit differences.

36 REMSpC Report 2005-02
4.3.1 Ground Trials
Model runs were completed for field winds that ranged from 3.6 to 12.2 kph. Integration to
500 m of AGDISP-predicted deposit compared favorably to field measurements (Fig. 25).
During higher wind sprays, most of the emitted spray (> 80%) was airborne beyond 500 m.
During light-wind adult mosquito treatments (characteristic of operational programs within
urban areas) nearly 50% of emitted spray would deposit within 500 m (5 swaths) downwind
of the spray truck.
Figure 25. Comparison of integrated deposit to 500 m for AGDISP predictions and field data
Field trials were grouped into low wind (< 6 kph) and high wind (> 11 kph) conditions.
Average winds (4.8 kph, 11.7 kph) were used in the AGDISP runs. Deposit during high wind
conditions was significantly lower (2-3 fold) both in the field data and in the model runs
(Fig. 26). In high winds, AGDISP predicted a shift in deposit further downwind than was
actually observed although peak values were very similar to those measured in the field.
Under low wind conditions, AGDISP predicted peak deposit near 100 m while field
measurements placed the peak close to 180 m. As before, predicted maximum deposit was
close to the observed average deposit peak. Beyond the peak deposit, AGDISP predictions fell
within the deposit variation observed in the field.
0%
10%
20%
30%
40%
50%
60%
0 5 10 15
Wind Speed (kph)
Mal
athi
on R
ecov
ered
(5
00m
) AGDISPField

REMSpC Report 2005-02 37
Figure 26. Comparison of AGDISP deposit and field measurements for high and low wind cases during ground trials
0
5
10
15
0 100 200 300 400 500
Distance from Truck (m)
Dep
osit
(g/h
a)
Ground
0
5
10
15
0 100 200 300 400 500
Distance from Truck (m)
Dep
osit
(g/h
a)
Ground
AGDISP
AGDISP
Low Wind
High Wind

38 REMSpC Report 2005-02
AGDISP predicted air concentrations (1 hr average) at 1.5 m show a pattern (Fig. 27) similar
to deposit differences for high and low wind cases. Differences of 4-fold are predicted in the
two wind regimes. While air concentrations in high winds remain nearly constant beyond
200 m, air concentrations in low winds tend to drop off nearly 25% over the same distance
due to deposition.
Figure 27. AGDISP predicted air concentrations during ground spraying in low and high winds
Comparing measured slide drop densities (Fig. 28) for high and low wind cases shows
differences of only 60-70%, not 4-fold. Wind speed had little impact on the position of
maximum drop density. At higher winds, drop densities beyond 200 m, were consistently
lower than for the low-wind trials.
0
5
10
15
20
25
0 100 200 300 400 500
Distance from Truck (m)
1hr A
vera
ge A
ir C
once
ntra
tion
(ng/
L) 4.8kph11.7kph

REMSpC Report 2005-02 39
Figure 28. Comparison of average slide drop density (#/cm2) during high and low-wind ground sprays
4.3.2 Aerial Trials
For the aerial trials, integrated deposit to 5 km was very similar between AGDISP predictions
and field measurement (Fig. 29). Winds at spray height ranged from 17.5 to 25.5 kph
resulting in a 16% decrease in integrated deposit (57% to 41%).
Figure 29. Comparison of integrated deposit to 5 km for AGDISP and field aerial trials
050
100150200250300350400
0 100 200 300 400 500Distance from Truck (m)
Slid
e D
rop
Den
sity
(#
/cm
2)Low WindHigh Wind
0%10%20%30%40%50%60%70%
10 15 20 25 30Wind Speed (kph)
Mal
athi
on R
ecov
ered
(5
km)
AGDISPField

40 REMSpC Report 2005-02
Although integrated deposits were similar, AGDISP tended to predict a deposit peak shifted
300-400 m further downwind (Fig. 30). Predicted maximum deposit in lighter winds was
equivalent to average field deposit. Beyond the maxima the rate and shape of deposit fall-off
were very similar (Fig. 31). Offsetting the AGDISP data by 400 m to match peak-deposit
locations produces near identical results to 3.5 km beyond which the data sets begin to
diverge.
Figure 30. Comparison of measured and AGDISP predicted deposit for aerial sprays in winds from 17.5-25 kph
Average air concentration (Fig. 32) is significantly lower than for ground spraying due largely
to the increased distance away from the spray aircraft. With time and distance, the spray cloud
disperses vertically leaving low air concentrations near the surface. Peak air concentrations
(AGDISP) are significantly further downwind than peak deposit (Fig. 30) similar to the
differences measured between deposit and slide drop density (Fig. 23). Air concentration is
predicted to fall off much slower with distance than deposit reflecting the long distances that
the small drops travel before depositing. Beyond 4 km downwind, the impacts of wind speed
at aircraft height are negligible.
0
5
10
15
0 1000 2000 3000 4000 5000
Distance from Flight line (m)
Dep
osit
(g/h
a)
Aerial
17.5kph25kph
AGDIS

REMSpC Report 2005-02 41
Figure 31. Comparison of deposit fall-off in far field. AGDISP data have been shifted 400 m to match peak location of field data
Figure 32. Predicted average air concentration at 1.5 m height for aerial sprays in 17.5 and 25.5 kph winds
0.1
1
10
100
0 1000 2000 3000 4000 5000
Distance from Flight line (m)
Dep
osit
(g/h
a)
Aerial
17.5kph25kph
AGDIS
0
0.5
1
1.5
2
2.5
0 1000 2000 3000 4000 5000
Distance from Flight Line (m)
1hr A
vera
ge A
ir C
once
ntra
tion
(ng/
L) 17.5kph25.5kph

REMSpC Report 2005-02 43
5. CONCLUSIONS
This is the first complete study comparing aerial and ground deposit of malathion when new
optimal ULV spray techniques were used. Of the 10 aerial and ground spray tests (5 of each),
all were completed under conditions that were typical of operational conditions. Experiments
were conducted in open field conditions.
Analysis of samples containing deuterated malathion indicated no degradation during
transport between field and laboratory. Earlier tests to determine the optimal conditions for
the conservation of malathion deposits on inert components revealed good stability of the
pesticide when kept at -20 or 4 oC. These conditions were always maintained during the
study. Moreover, analysis of field blank samples indicated insignificant contamination.
Under the meteorological conditions during the field trials, peak deposition from ground
(11 μm VMD) and aerial (32 μm VMD, 60 m height) were equivalent despite the 4-fold
application rate increase for aerial spraying. However, drop densities from the ground
application were 4-fold greater than for the aerial application. At spray heights of 60 m, peak
deposit was observed 800 m downwind of the flight line while drop density peaked nearly
1 km further down range. For ground application, average deposit peaked nearly 150 m from
the spray line and drop density about 100 m further down range. Wind speed had a significant
impact on deposit level from ground sprays. Malathion recovery to 500 m indicated between
10-50% of the spray was deposited depending on wind speed. For aerial sprays, 35-50% of
emitted malathion deposited within 5 km as winds at spray height ranged from 17-25 kph.
Integrated deposition to the end of the sampling grid was accurately predicted by AGDISP.
AGDISP also predicted maximum deposits that were equivalent to those that were measured
in the field. For ground trials in high winds, the AGDISP peak deposit was beyond the
location of field measurement while in light winds it was closer. For aerial trials, the predicted
peak was beyond the location measured in the field. Predicted peak 1-hr average air
concentrations from aerial trials were significantly lower than for ground sprays being less
than 2 ng/L (1-hr average) compared with 5 ng/L for high wind ground sprays and 20 ng/L for
low wind ground sprays.


REMSpC Report 2005-02 45
6. REFERENCES
Bilanin, A.J., Teske, M.E., Barry, J.W. et R.B. Ekblad. 1989. AGDISP: The Aircraft Spray Dispersion Model, Code Development and Experimental Validation. Transactions of the ASAE 32: 327-334. Brouwer, R., Brouwer, D.H., Tijssen, S. Cha. et J.J. Van Hemmen, 1992. Pesticides in the Cultivation of Carnation in Greenhouse: Part II- Relationship Between Foliar Residues and Exposure. Am. Ind. Hyg. Assoc.J. Vol. 53. no. 9, p. 582- 587. California Department of Food and Agriculture (CFDA). 1991, Environmental monitoring of malathion aerial applications used to eradicate Mediterranean fruit flies in southern California. 1990. Environment hazards assessment program. EH 91-3. Castro Cano, M.L., Martínez, Vidal J.L., Egea González, F.J. et M. Martínez Galera. 2001. Gas chromatographic method for assessing the dermal exposure of greenhouse applicators to dimethoate and malathion. J Chromatographic Science. Vol. 39, no. 8, p. 345-350. Dukes, J., Zhong, H., Greer, M., Hester, P., Hogan, D. et J. A. S. Barber. 2004. A comparison of two spray nozzle systems used to aerially apply the ultra low-volume adulticide fenthion. J. Am. Mosq. Control Assoc. Vol. 20, no. 1, p. 27-35. Fenske, R.A. 1989. Validation of environmental monitoring by biological monitoring: fluorescent tracer technique and patch technique, In Biological monitoring for pesticides exposure: measurement, estimation and risk reduction, Eds. Wang G.M., Franklin C.A., Honeycutt R.C. and Reinert J.C., Washington, D.C. American Chemical Society. p. 70-84. Haile, D.G., Mount, G.A., et N.W. Pierce. 1982. Effect of droplet size of malathion aerosols on kill of caged adult mosquitoes. Mosquito News. Vol. 42, no. 4, p. 576-583. Hester, P.G., Shaffer, K.R., Tietze, N.S., Zhong, H. et N.L. Griggs Jr. 2001. Efficacy of ground-applied ultra-low-volume malathion on honey bee survival and productivity in open and forest areas. J Am. Mosq. Control Assoc. Vol. 17, no. 1, p. 2-7. Knepper, R.G., Walker, E.D., Kamrin, M.A., et C.A. Vandervoort. 2003. ULV studies of permethrin in Sagina, Michigan. Wing Beats of the Florida Mosquito Control Association. Vol. 14, no. 4, p. 22-33. Lofgren, C.S., Anthony, D.W., et G.A. Mount. 1973. Size of Aerosol Droplets Impinging on Mosquitoes as Determined with a Scanning Electron Microscope. J Economic Entomology. Vol. 66, no. 5, p. 1085-1088.

46 REMSpC Report 2005-02
Marty, M.A., Dawson, S.V., Bradman, M.A., Harnly, M.E., et M.J. Dibartolomeis. 1994. Assessment of exposure to malathion and malaoxon due to aerial application over urban areas of southern california, Journal of Exposure Analysis and Environmental Epidemiology. Vol. 4, no. 1, p. 65-81. May, K.R. et R. Clifford. 1966. The impaction of aerosol particles on cylinders, spheres, ribbons and discs. Ann. Occup. Hyg., Vol. 10, p. 83-93. Mickle, R.E. 2005. Evaluation of the AIMMS-20 Airborne Meteorological Package. REMSpC Report 2005-01. 21 pp. Mickle, R.E. 2004. Prerequisites and Equipment Availability for an Efficient Adulticide Treatment Program for Mosquito Control. REMSpC Report 2004-03, 32 pp. Moore, J.C., Dukes, J.C., Clark, J.R., Malone, J., Hallmon, C.F. et P.G. Hester. 1993. Downwin drift and deposition of malathion on human target from ground ultra-low volume mosquito sprays. J Am Mosq Control Assoc. (1993). Vol. 9, no. 2, p. 138-142. Mount, G.A. 1970. Optimum droplet size for adult mosquito control with space sprays or aerosols of insecticides. Mosquito News. Vol. 30, no. 1, p 70-75. Mount, G.A., Biery, T.L. et D.G. Haile. 1996. A review of ultralow-volume aerial sprays of insecticide for mosquito control. J. Am. Mosq. Control Assoc.12(4):601-618. Samuel, O., Ferron, L. et L. St-Laurent. 1996. Évaluation de l'exposition cutanée et estimation d'un coefficient de transfert des résidus foliaires délogeables pour la population exposée au glyphosate. Sainte-Foy, Centre de toxicologie du Québec pour le ministère des Ressources naturelles du Québec, Direction de l'environnement forestier. 56 pages, annexes. Tietze, N.S., Hester, P.G., Shaffer, K.R. et F.T. Wakefield. 1996. Peridomestic deposition of ultra-low volume malathion applied as a mosquito adulticide. Bull Environ Contam Toxicol. Vol. 56, no. 2, p. 210-18. Tietze, N.S., Hester, P.G. et K.R. Shaffer. 1994. Mass recovery of malathion in simulated open field mosquito adulticides tests. Arch Environ Contam Toxicol. Vol. 26, p. 473-477. Turnbull, G.J. 1985. Word Health Organisation Field Surveys of Exposure to Pesticides: Standard Protocol. In Occupational Hazard of Pesticides Use. Ed. Taylor and Francis Inc. London and Philadelphia. Appendix 2. p. 169-179. Wallace, D.J., Picot, J.J.C., Chapman, T.J. 1995. A numerical model for forestry aerial spraying. Agric. For. Meteorol., 76, p. 19-40.
Weidhaas, DE., Bowman, M.C., Mount, G.A., Lofgren, C.S. et H.R. Ford. 1970. Relationship of minimal lethal dose to the optimum size of droplets of insecticides for mosquito control. Mosquito News. Vol. 30, no. 2, p. 195-200.

REMSpC Report 2005-02 47
APPENDIX 1
Assessment of malathion stability on inert materials


REMSpC Report 2005-02 49
Assessment of malathion stability on inert materials Goal: In order to determine the best conditions for the conservation of malathion deposits on inert components, assessment of malathion stability will be performed on 9 cm diameter Whatman 934AH fiberglass filters (cat. no. 1827090) for various parameters such as time of conservation, temperature and exposure to light. One additional set will be made on 9 cm diameter Whatman No. 1 alpha cellulose filter (cat. no. 1001090) to compare the efficiency of the different type of filter at 4°C condition. Filter preparation: The study will be carried out on fiberglass filters spiked with 200 ng of malathion, enrichment being done with a 1 mg/L solution of malathion in hexane. Of this solution, 200 µL will be applied on each of the 40 filters suspended in the air to allow the solvent to evaporate quickly. Filter analysis: Once prepared, filters will be introduced into Sarstedt 50 ml test tubes and will be preserved according to the parameters showed in the table below until to be analysed. Filter analysis will be achieved using the E437A laboratory method.
1 Exposure to light will be done by placing filters on the counter of the laboratory close to the unshaded windows.
2 The filters will be protected from light by wrapping the tubes with aluminium foil and
storing in a drawer. FG = Fiberglass filter AC = Alpha cellulose Filter
Preservation time (hour) Filter type Preservation
temperature 0 12 24 48 72 168 336 504 FG-Standard -20°C --- * * * * * * * AC-Standard -20°C --- * * * * * * * FG-Standard 4°C * * * * * * * * FG-Light exposure1 23°C * * * * * * --- --- FG-Unexposed to light2 23°C --- * * * * * * --- FG-Standard 37°C --- * * * --- --- --- ---

50 REMSpC Report 2005-02
Malathion Stability on Inert Filter
0
20
40
60
80
100
120
0 100 200 300 400 500 600
Conservation Time (hour)
Mal
athi
on %
Rec
over
y fr
om in
itial
con
cent
ratio
n
FG -20°CAC -20°CFG- 4°C FG-LE-23°CFG-LU- 23 °CFG-37°C

REMSpC Report 2005-02 51
APPENDIX 2
Analytical method for the determination of malathion on fiber glass filter by GC-MS (E-437)


REMSpC Report 2005-02 53
ANALYTICAL METHOD FOR THE DETERMINATION OF MALATHION ON
FIBER GLASS FILTER BY GC-MS (E-437) -Condensed version-
1. Type of method Gas chromatography coupled with mass spectrometry (GC-MS)
2. Application range 1 ng/filter to 2000 ng/filter
Higher concentration may be quantified with appropriated dilution of the filter extract.
3. Instrument Chromatograph 5890 from Agilent with mass detector 5989B (Engine).
4. Description The filter is first spiked with 100 ng of deuterated malathion analogue and extracted with ethyl acetate. The extract is centrifuged to separate the remaining filter fibres before evaporation near dryness and finally reconstituted of 1 ml in isooctane-dichloromethane mixture. The malathion is quantified on gas chromatography coupled with mass spectrometry (GC-MS) operating in electron capture negative ionisation (ECNI) where concentration are corrected according to the recovery of the deuterated malathion in each sample.
5. Analytical performance The method gave the following performance during the validation process.
Analyte(s) Detection
limit (ng/filter)
Quantitation limit
(ng/filter) Linearity (ng/filter)
Biais (%)
Same day reproducibility
(%)
Day to day reproducibility
(%) Recovery
(%)
Malathion 1 3 1 – 2000 N.A. 3.5 (n=10)
5.1 (n=10)
80 (n=3)
Routine checks of accuracy and precision are accomplished by including in each analytical series a spiked filter containing 100 ng of malathion from a different source than the one used for calibration.
Approved by Date Date of first revision Page 2005/01/20 53 de 97

54 REMSpC Report 2005-02
ANALYTICAL METHOD FOR THE DETERMINATION OF MALATHION ON
FIBER GLASS FILTER BY GC-MS (E-437) -Condensed version-
6. Reference range and occupational exposure levels
Not available
7. Interlaboratory comparison programs Not available
8. References 1. Beeson MD, Driskell WJ, Barr DB. Isotope Dilution High-Performance Liquid Chromatography/Tandem
Mass Spectrometry Method for quantifying Urinary Metabolites of Atrazine, Malathion, and 2,4-Dichlorophenoxyacetic acid. 1999; Anal. Chem. 71:3526-3530.
2. Lioy PJ, Edwards RD, Freeman N, Gurunathan S, Pellizzari E, Adgate JL, Quackenboss J, Sexton K. House dust levels of selected insecticides and an herbicide measured by the EL and LWW samplers and comparisons to hand rinses and urine metabolites. J. Exposure Anal. And Env. Epidemiology. 2000;10 :327-340.
3. AOAC Official Method 979.05 Malathion in Pesticide Formulations. Gas Chromatographic Method.
Approved by Date Date of first revision Page 2005/01/20 54 de 97

REMSpC Report 2005-02 55
APPENDIX 3
Results of Ground Trials


REMSpC Report 2005-02 57
0 100 200 300 400 500Distance from Spray Line (m)
0
5
10
15
(um
)
0
400
800
Dro
p D
ensi
ty(#
/cm
2 )
0
1
2
3
Dep
osit
(gm
/ha)
October 06, 200420:20
Ground
VMD
NMD
Winds 12.2kph 86o Ta 25.7C RH 79% Spray Line 90o

58 REMSpC Report 2005-02
0 100 200 300 400 500Distance from Spray Line (m)
0
5
10
15
(um
)
0
200
400
Dro
p D
ensi
ty(#
/cm
2 )
012345
Dep
osit
(gm
/ha)
October 06, 200421:40
Ground Trial
VMD
NMD
Winds 11.2kph 73o Ta 24.4C RH 85% Spray Line 90o

REMSpC Report 2005-02 59
0 100 200 300 400 500Distance from Spray Line (m)
0
5
10
15
(um
)
0
400
800
Dro
p D
ensi
ty(#
/cm
2 )
0
5
10
15
20
Dep
osit
(gm
/ha)
October 09, 200419:25
Ground Trial
VMD
NMD
Winds 3.6kph 86o Ta 25.2C RH 79% Spray Line 90o
60 REMSpC Report 2005-02
0 100 200 300 400 500Distance from Spray Line (m)
0
5
10
15
(um
)
0
200
400
Dro
p D
ensi
ty(#
/cm
2 )
0
5
10
Dep
osit
(gm
/ha)
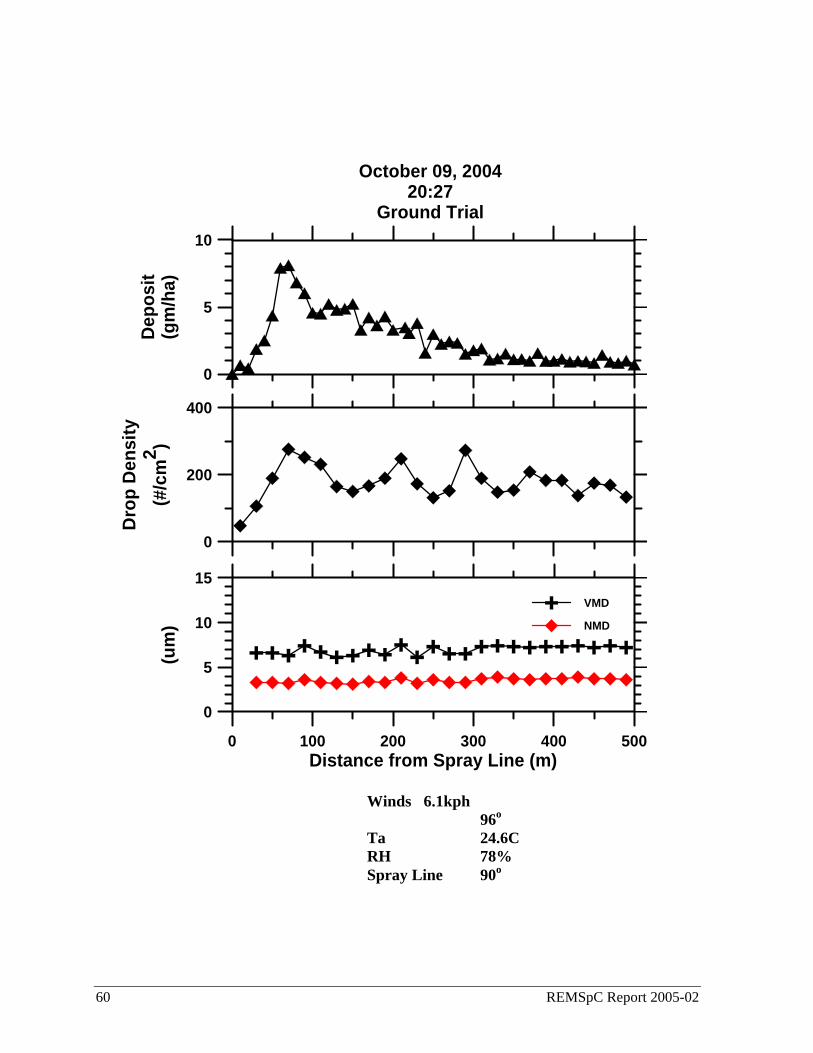
October 09, 200420:27
Ground Trial
VMD
NMD
Winds 6.1kph 96o Ta 24.6C RH 78% Spray Line 90o

REMSpC Report 2005-02 61
100 200 300 400 500Distance from Spray Line (m)
0
5
10
15
(um
)
0
400
800
Dro
p D
ensi
ty(#
/cm
2 )
0
5
10
Dep
osit
(gm
/ha)
October 09, 200421:24
Ground Trial
VMD
NMD
Winds 4.7kph 86o Ta 23.6C RH 83% Spray Line 90o


REMSpC Report 2005-02 63
APPENDIX 4
Results of Aerial Trials


REMSpC Report 2005-02 65
18 20 22 24 26Temperature (C)
0
50
100
150
200
250
300
Hei
ght (
m)
0 50 100Relative Humidity (%)
0 5 10 15 20 25 30 35 40 45Wind Speed ( kph )
0 90 180 270 360Direction ( Mag)
October 08, 200420:10 - 20:40

66 REMSpC Report 2005-02
0 1000 2000 3000 4000 5000Distance from Flight Line (m)
0
5
10
15
VMD
(um
)
0
50
100
Dro
p D
ensi
ty(#
/cm
2 )
0
5
10
15
Dep
osit
(gm
/ha)
October 08, 200420:13 - 20:24
Aerial

REMSpC Report 2005-02 67
18 20 22 24 26Temperature (C)
0
50
100
150
200
250
300
Hei
ght (
m)
0 50 100Relative Humidity (%)
0 5 10 15 20 25 30 35 40 45Wind Speed ( kph )
0 90 180 270 360Direction ( Mag)
October 08, 200422:50 - 23:20

68 REMSpC Report 2005-02
0 1000 2000 3000 4000 5000Distance from Flight Line (m)
0
5
10
15
VMD
(um
)
0
50
100
Dro
p D
ensi
ty(#
/cm
2 )
0
5
10
Dep
osit
(gm
/ha)
October 08, 200422:54 - 23:05
Aerial

REMSpC Report 2005-02 69
18 20 22 24 26Temperature (C)
0
50
100
150
200
250
300
Hei
ght (
m)
0 50 100Relative Humidity (%)
0 5 10 15 20 25 30 35 40 45Wind Speed ( kph )
0 90 180 270 360Direction ( Mag)
October 09, 200401:00 - 01:24

70 REMSpC Report 2005-02
0 1000 2000 3000 4000 5000Distance from Flight Line (m)
01020304050
VMD
(um
)
0
50
100
Dro
p D
ensi
ty(#
/cm
2 )
0
5
10
Dep
osit
(gm
/ha)
October 09, 200401:03 - 01:12
Aerial

REMSpC Report 2005-02 71
18 20 22 24 26Temperature (C)
0
50
100
150
200
250
300
Hei
ght (
m)
0 50 100Relative Humidity (%)
0 5 10 15 20 25 30 35 40 45Wind Speed ( kph )
0 90 180 270 360Direction ( Mag)
October 12, 200420:00 - 20:40

72 REMSpC Report 2005-02
0 1000 2000 3000 4000 5000Distance from Flight Line (m)
0
5
10
15
VMD
(um
)
0
50
100
Dro
p D
ensi
ty(#
/cm
2 )
0
5
10
Dep
osit
(gm
/ha)
October 12, 200420:04 - 20:13
Aerial

REMSpC Report 2005-02 73
18 20 22 24 26Temperature (C)
0
50
100
150
200
250
300
Hei
ght (
m)
0 50 100Relative Humidity (%)
0 5 10 15 20 25 30 35 40 45Wind Speed ( kph )
0 90 180 270 360Direction ( Mag)
October 12, 200421:450 - 22:20
74 REMSpC Report 2005-02
0 1000 2000 3000 4000 5000Distance from Flight Line (m)
0
10
20
30
VMD
(um
)
0
50
100
Dro
p D
ensi
ty(#
/cm
2 )
0
5
10
15
20
Dep
osit
(gm
/ha)
October 12, 200421:42 - 21:54
Aerial

REMSpC Report 2005-02 75
APPENDIX 5
Field parameters for Input to AGDISP

REMSpC Report 2005-02 77
Reference Document: PMRA Re-evaluation of Malathion (PARC2003-10)
Regulatory Conclusions: Maximum rates
Ground ULV application 60.8 g a.i./ha
Aerial application 260 g a.i./ha
Aztec Max Cdn Label Rate = 260gai/ha
Product
Field experiment used US Fyfanon which contained
9.9 lb malathion/gal = 1.18627 Kg/L at 96.5% (US Fyfanon label )
therefore, Spray Volume Rate 0.2191L/ha (US Fyfanon)
Specific gravity (sg) of malathion 1.23
Flight parameters:
AC speed 150mph = 240kph
Flow 2.16 gal/min=276.48 oz/min = 8.1756 L/min
Line Source Strength (LSS) = 2.0439L/km
Swath = 93.3m (required to provide Spray Volume Rate)
Ground ULV Sprayer Max Cdn Label 60.8gai/ha
therefore, Spray Volume Rate = 0.05125L/ha (US Fyfanon)
Ground Speed = 15kph
Ground ULV Parameters
Flow set to 4.3oz/min at 10mph=16kph (flow regulated based on speed)
Flow=4.3oz/min = 0.12715 L/min (1US oz=0.02957L)
LSS (L/km) = 0.4768 L/km
Swath = 93.0m (Required to provide Spray Volume Rate)
Notes:
LSS Aztec = 4.28 x LSS Ground


REMSpC Report 2005-02 79
APPENDIX 6
AGDISP 8.13 Input Parameters for Ground Model Run


REMSpC Report 2005-02 81
AGDISP Input Data Summary --General-- Title: PCMCD Ground Trials Notes: Calculations Done: Yes Run ID: AGDISP PCMCD Grnd.ag 8.13 02-19-2005 20:51:26 --Aircraft-- ---------------------------- Name Clarke Grizzly Type Library Boom Height (m) 0 Spray Lines 1 Optimize Spray Lines No Spray Line Reps # Reps 1 1 --Ground Application Type-- ---------------------------- Ground Application Type Liquid --Drop Size Distribution-- ---------------------------- Name PCMCD Waved Slide Type User-defined Drop Categories
# Diam (um) Frac
1 1.01 0.0181 2 1.30 0.0061 3 1.61 0.0078 4 1.97 0.0099 5 2.37 0.0125 6 2.82 0.0157 7 3.32 0.0197 8 3.89 0.0244 9 4.52 0.0298 10 5.24 0.0362 11 6.04 0.0433 12 6.94 0.0510 13 7.94 0.0592 14 9.08 0.0672 15 10.35 0.0738 16 11.77 0.0779 17 13.37 0.0806 18 15.17 0.0787 19 17.19 0.0729 20 19.45 0.0638 21 21.99 0.0524 22 24.84 0.0396 23 28.04 0.0271 24 31.64 0.0165 25 35.67 0.0089 26 40.20 0.0042 27 45.28 0.0018 28 50.99 0.0010
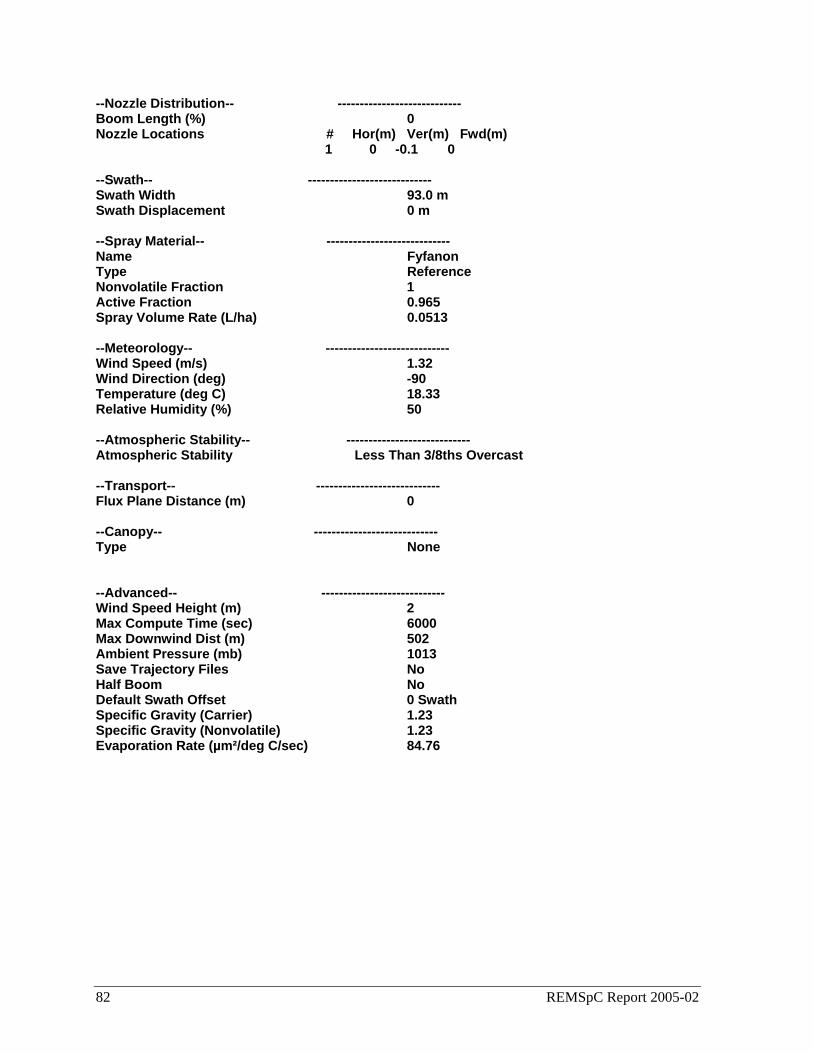
82 REMSpC Report 2005-02
--Nozzle Distribution-- ---------------------------- Boom Length (%) 0 Nozzle Locations # Hor(m) Ver(m) Fwd(m) 1 0 -0.1 0 --Swath-- ---------------------------- Swath Width 93.0 m Swath Displacement 0 m --Spray Material-- ---------------------------- Name Fyfanon Type Reference Nonvolatile Fraction 1 Active Fraction 0.965 Spray Volume Rate (L/ha) 0.0513 --Meteorology-- ---------------------------- Wind Speed (m/s) 1.32 Wind Direction (deg) -90 Temperature (deg C) 18.33 Relative Humidity (%) 50 --Atmospheric Stability-- ---------------------------- Atmospheric Stability Less Than 3/8ths Overcast --Transport-- ---------------------------- Flux Plane Distance (m) 0 --Canopy-- ---------------------------- Type None --Advanced-- ---------------------------- Wind Speed Height (m) 2 Max Compute Time (sec) 6000 Max Downwind Dist (m) 502 Ambient Pressure (mb) 1013 Save Trajectory Files No Half Boom No Default Swath Offset 0 Swath Specific Gravity (Carrier) 1.23 Specific Gravity (Nonvolatile) 1.23 Evaporation Rate (µm²/deg C/sec) 84.76

REMSpC Report 2005-02 83
APPENDIX 7
AGDISP 8.13 Input Parameters for Aerial Model Run


REMSpC Report 2005-02 85
AGDISP Input Data Summary --General-- Title: PCMCD Aztec with PJ20 Nozzles Notes: Calculations Done: No Run ID: AGDISP PCMCD Aztec.ag 8.13 00-00-0000 00:00:00 --Aircraft-- ---------------------------- Name Piper Aztec E Type Library Boom Height (m) 60 Spray Lines 1 Optimize Spray Lines No Spray Line Reps # Reps 1 1 Wing Type Fixed-Wing Semispan (m) 5.67 Typical Speed (m/s) 66.7 Biplane Separation (m) 0 Weight (kg) 1912.02 Planform Area (m²) 32.89 Propeller RPM 2575 Propeller Radius (m) 1.1 Engine Vert Distance (m) 0 Engine Fwd Distance (m) 3.6 --Aerial Application Type-- ---------------------------- Aerial Application Type Liquid --Drop Size Distribution-- ---------------------------- Name LCMCD Wind Tunnel Type User-defined Drop Categories # Diam (um) Frac 1 1.11 0.0250 2 1.61 0.0057 3 2.17 0.0066 4 2.82 0.0078 5 3.58 0.0093 6 4.44 0.0111 7 5.44 0.0132 8 6.60 0.0159 9 7.93 0.0190 10 9.46 0.0228 11 11.23 0.0272 12 13.27 0.0324 13 15.63 0.0383 14 18.34 0.0450 15 21.47 0.0522 16 25.08 0.0598 17 29.24 0.0668 18 34.04 0.0719 19 39.57 0.0764 20 45.95 0.0774 21 53.31 0.0743

86 REMSpC Report 2005-02
22 61.80 0.0676 23 71.58 0.0577 24 82.86 0.0454 25 95.88 0.0322 26 110.88 0.0201 27 128.18 0.0109 28 148.14 0.0050 29 171.15 0.0020 30 197.68 0.0010 --Nozzle Distribution-- ---------------------------- Boom Length (%) 98.59 Nozzle Locations # Hor(m) Ver(m) Fwd(m) 1 -5.59 0.0035 0 2 -5.39 0.0035 0 3 -5.19 0.0035 0 4 -4.99 0.0035 0 5 -4.79 0.0035 0 6 -4.59 0.0035 0 7 4.59 0.0035 0 8 4.79 0.0035 0 9 4.99 0.0035 0 10 5.19 0.0035 0 11 5.39 0.0035 0 12 5.59 0.0035 0 --Swath-- ---------------------------- Swath Width 93.3 m Swath Displacement 0 m --Spray Material-- ---------------------------- Name Fyfanon Type Reference Nonvolatile Fraction 1 Active Fraction 0.965 Spray Volume Rate (L/ha) 0.2191 --Meteorology-- ---------------------------- Wind Speed (m/s) 4.85 Wind Direction (deg) -90 Temperature (deg C) 18.33 Relative Humidity (%) 90 --Atmospheric Stability-- ---------------------------- Atmospheric Stability Less Than 3/8ths Overcast --Transport-- ---------------------------- Flux Plane Distance (m) 1000 --Canopy-- ---------------------------- Type None --Terrain-- ---------------------------- Surface Roughness (m) 0.0075 Upslope Angle (deg) 0 Sideslope Angle (deg) 0

REMSpC Report 2005-02 87
--Advanced-- ---------------------------- Wind Speed Height (m) 60 Max Compute Time (sec) 60000 Max Downwind Dist (m) 5000 Vortex Decay Rate (IGE) (m/s) 0.56 Vortex Decay Rate (OGE) (m/s) 0.15 Aircraft Drag Coeff 0.1 Propeller Efficiency 0.8 Ambient Pressure (mb) 1013 Save Trajectory Files No Half Boom No Default Swath Offset 0 Swath Specific Gravity (Carrier) 1.23 Specific Gravity (Nonvolatile) 1.23 Evaporation Rate (µm²/deg C/sec) 84.76