DIMES Distributed Internet MEasurement and Simulation Yuval Shavitt [email protected] DIMES.
42
DIMES Distributed Internet MEasurement and Simulation Yuval Shavitt [email protected] http://www.netdimes.org DIMES
-
Upload
shanna-rich -
Category
Documents
-
view
218 -
download
0
Transcript of DIMES Distributed Internet MEasurement and Simulation Yuval Shavitt [email protected] DIMES.

DIMESDistributed Internet MEasurement and Simulation
Yuval Shavitt
http://www.netdimes.org
DIMES

The Internet Structure
routers
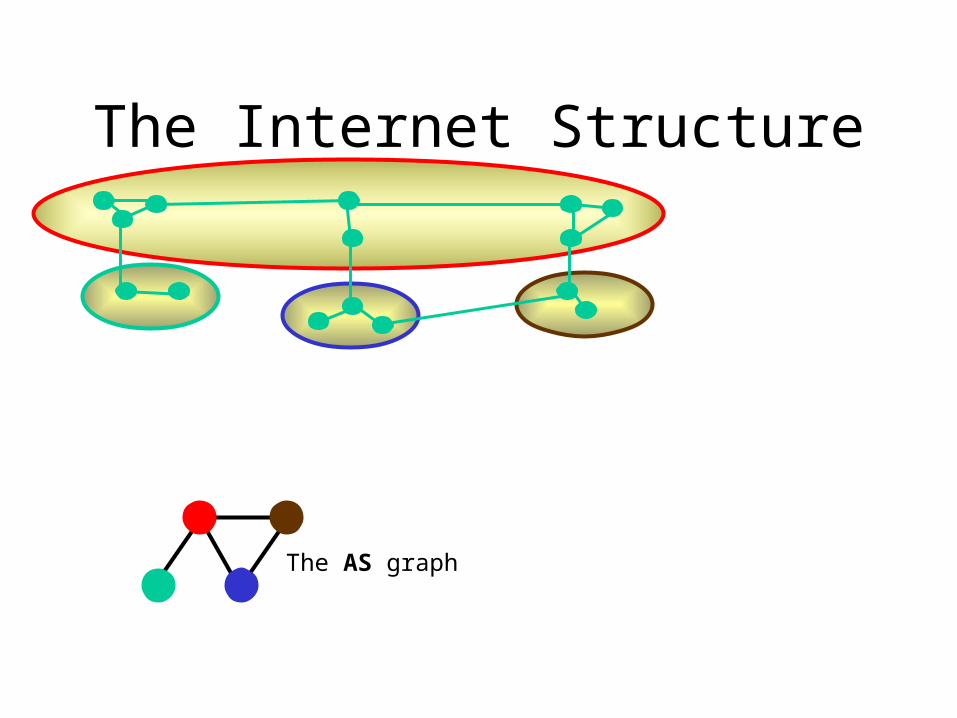
The Internet Structure
The AS graph

The Internet Structure
The AS graph The PoP level graph
Metropology

Revealing the Internet Structure

Revealing the Internet Structure

Revealing the Internet Structure

Revealing the Internet Structure
30 new links
7 new links
NO new links
Diminishing return!Diminishing return!
Deploying more boxes does not
pay-off

Revealing the Internet StructureTo obtain the ‘horizontal’ links we need strong presence in the edge

Diminishing Return?
• [Chen et al 02], [Bradford et al 01]: when you combine more and more points of view the return diminishes very fast
• What have they missed?– The mass of the tail is significant
No. of views

Diminishing Return?
• [Chen et al 02], [Bradford et al 01]: when you combine more and more points of view the return diminishes very fast
• What have they missed?– The mass of the tail is significant
No. of views
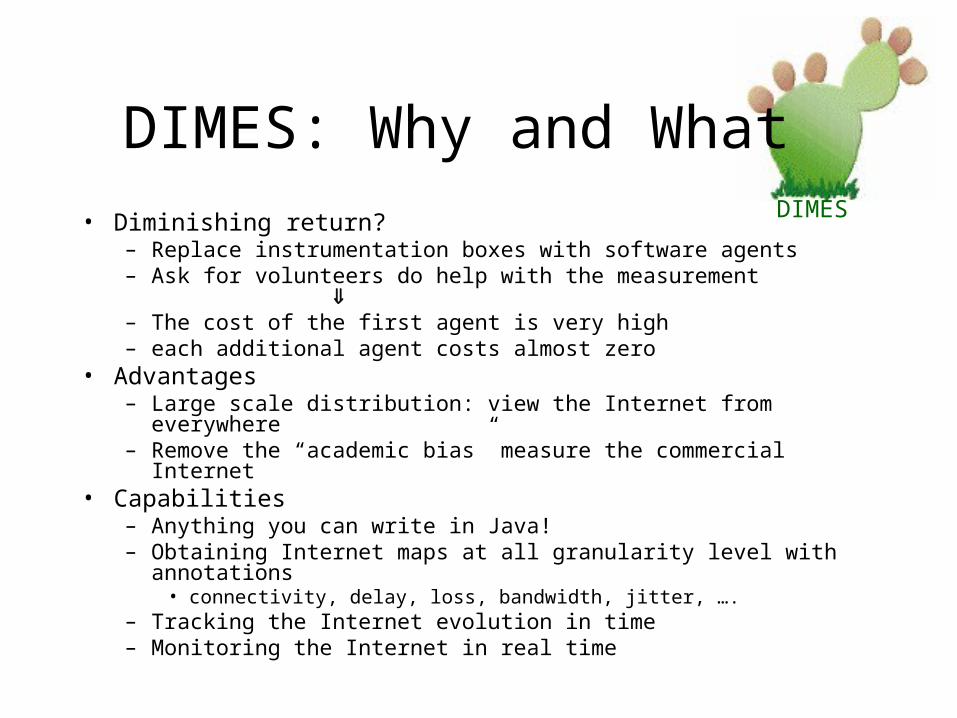
• Diminishing return?– Replace instrumentation boxes with software agents– Ask for volunteers do help with the measurement
– The cost of the first agent is very high– each additional agent costs almost zero
• Advantages– Large scale distribution: view the Internet from everywhere– Remove the “academic bias” measure the commercial Internet
• Capabilities – Anything you can write in Java!– Obtaining Internet maps at all granularity level with annotations
• connectivity, delay, loss, bandwidth, jitter, ….– Tracking the Internet evolution in time– Monitoring the Internet in real time
DIMES
DIMES: Why and What
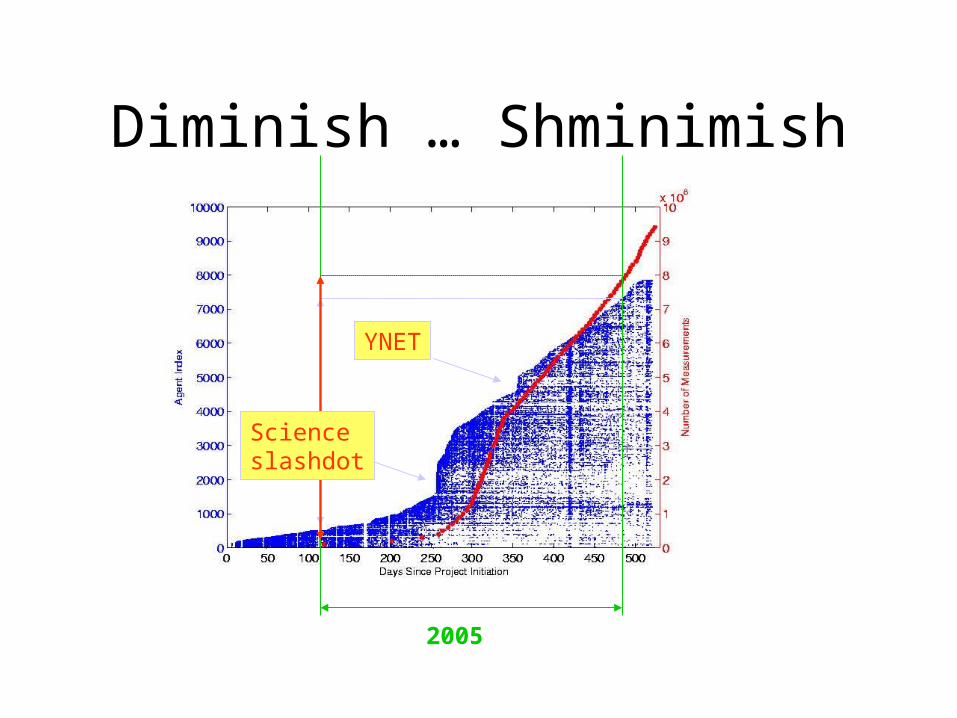
Diminish … Shminimish
2005
65000.8 bScience
slashdot
YNET

How many ASes see an edge?~9000/6000
are seen only by one

DIMES
Distributed System Design:Obtaining the Internet Structure
The Internet as a complex system:static and dynamic analysis
Correlating the Internet with the World:Geography, Economics, Social Sciences

Challenges
• It’s a distributed systems:– Measurement traffic looks malicious
• Flying under the NOC radar screens
(Agents cannot measure too much)
– Optimize the architecture:• Minimize the number of measurements
• Expedite the discovery rate
• BUT agents are– Unreliable
– Some move around
Distributed Systemcomplex system
real world

Agents• To be able to use agents
wisely we need agents profiles:– Reliablility
• Daily (seen in 7 of the last 10 days)
• Weekly (seen in 3 of the last 4 weeks)
– Location:• Static• Bi-homed: where mostly?• Mobile: identify home
base– Abilities: what type of
measurements can it perform?
Distributed Systemcomplex system
real world
• Many new agents vanish within days
• Surprise: those who stay tend to be very reliable– Almost 24/7
• Mobile agents– New vantage points– Challenge for dynamic
analysis• Current agent count
– Daily: 1200-1400– Weekly: over 1800

• Degree distribution [Faloutsos99,Lakhina03,Barford01,Chen02]
• Clustering coefficient [Bar04]
• Disassortativity [Vespignani]
• Network motifs (ala Uri Alon)
Distributed Systemcomplex system
real world
Static Internet Graph Analysis

Degree Distribution
k
Pr(k)
<k>
0 2 4 6 8 10 120
2
4
6
8
10
12
14
log(degree)
log
(Pr(
de
gre
e))
DIMES+BGP (Feb 05)
0 2 4 6 8 10 12 14 160
2
4
6
8
10
12
log(rank)
log
(de
gre
e)
DIMES+BGP (Feb 05)
Zipf plot
+
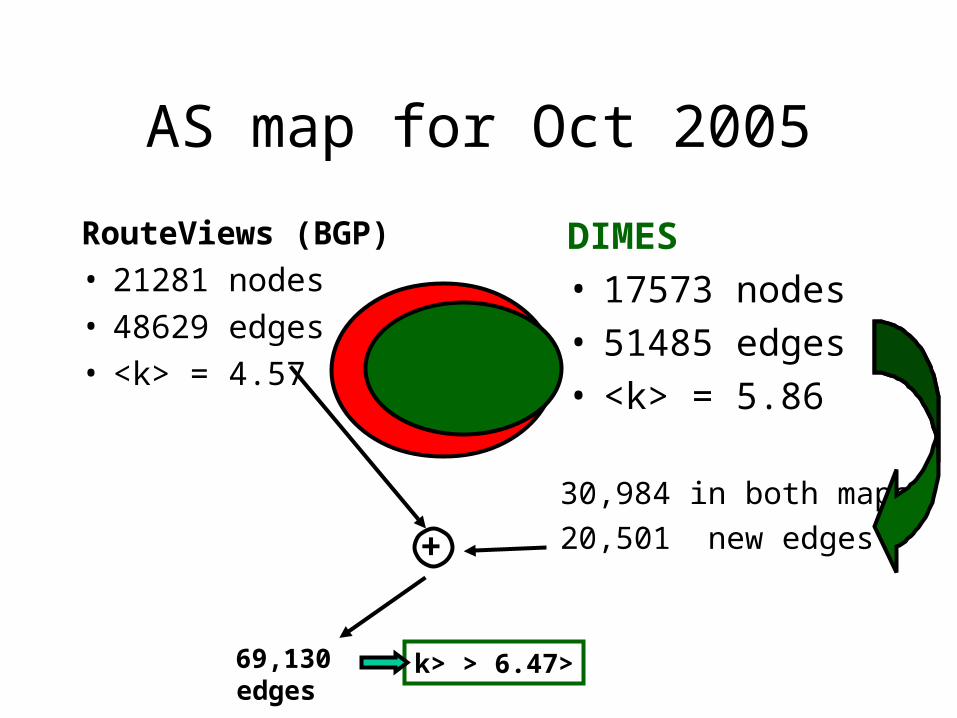
AS map for Oct 2005
RouteViews (BGP)• 21281 nodes• 48629 edges• <k> = 4.57
DIMES• 17573 nodes• 51485 edges• <k> = 5.86
30,984 in both maps
20,501 new edges
69,130 edges <k> > 6.47

Current Status
• Over 4400 users, over 9700 agents– 87 countries– All continents– Over 650 ASes– More than 1200 are active daily
• Over 5,000,000 measurements a day

Agents by countryAlbania
Argentina
Australia
Austria
Belarus
Belgium
Bermuda
Bosnia and Herzegovina
Brazil
Bulgaria
Canada
Chile
China
Colombia
Costa Rica
Croatia
Cyprus
Czech Republic
Denmark
Egypt
Estonia
Finland
France
Ru
Aus
Ger
May 2006

Vision
• A Network that optimizes itself: – every device with a measurement module.
– How to concert the measurements?
– How to aggregate them?
– How to analyze them is a hierarchical fashion?

The DIMES Architecture
• Client-server
• Pull model– All communication is originated by agent – Future: agent-agent communication
• Data is kept in a rational database (MySQL)
• Hard bound on network usage– Negligible CPU usage

Agent Join Process
1. User download the DIMES agent• User id, join group, agent id
2. An entry is created in the database agent table
3. Agent gets random script
4. Every hour: keep alive (query for new scripts)
5. Send results:1. When result file crosses a threshold
2. When agent wakes up

Measurements
Current• Ping• Traceroute• Packettrain (in debug)
Future• IPv6 (initial trials)

Target Set
• Initial set of 300,000,000 web sites– Using DNS we got 3,000,000 IP addresses
• Collected IP addresses from measurements
• Scan APs without known addresses– Space scans to same AP from an agent
We have over 5,000,000 IP addresses

The Experiment Life-Cycle
• Planning
• Deploying
• Executing
• Result aggregation & filtering
• Default result analysis– Topology inference– AS path analysis
Topology Discovery
• Discovery– Random probing– Motifs
• Triangles
– Geographic location• Same country
• Validation– Greedy set cover

Router Alias Resolution
• Ping, ping, ping ,…
• No DNS
• No Rocketfuel tricks (and potholes)

Experiments
• Currently three priorities– Urgent
• Timed experiments• Time synchronized
– Normal• Most planned experiments
– Background• Random topology discovery• Router alias resolution
• Easy to add more

Data Filtering
• IP level loops– But not in the last hop– Disregard for topology
• AS level loops– But not in the last hop– Disregard for topology
• Destination appears early– Disregard for topology
Agent Black List• Too many discoveries• Close to too many
destinations (ping)

Database Structure
• Every measurement has a unique id and is placed in a raw result table (insert time, agent, id, source IP, dest IP, experiment id, run id)
• The unique id is used to access the measurement details in other tables (traceroute/ping/packettrain tables)

Main Database Tables
Main Meas Tab.raw_res_main
Traceroute Tab.raw_res_traceroute
Ping Tab.raw_res_ping
AS topology Router topology
Alt. Traceroute Tab.raw_res_traceroute_alt
AS Traceroute Tab.AStraceroute

AS Level TopologyAS node:• AS Number• AS name• Discovering time• Validation time• In Degree• Out Degree• Max Radius
AS edge:• Source AS• Dest AS• Discovering time• Validation time• Discovering Agent• Measurement number• Min Delay & Max Delay• Betweeness• Visit Count• Validating Agent• Validating IP

IP Traceroute Tables
• A traceroute measurement is comprised of 4 traceroutes.
• Traceroutes are done vertically:1,2,3,4,…,1,2,3,...,1,2,3,…,1,2,3,…
• Each hop has an entry that is connected to a measurement via the unique id and hop number.
• The most commom IP per hop is kept in the main traceroute table– Additional IP addresses are kept in alternative tables

Planner
• A web interface to easy – Design expr.
– Deploy expr.
– Get results
• Support XML feed• Support Java API
Agent groups Destination groups

Measurements Software
• Agents perform scripts• A new agent s/w
design: – just write it in Java
– use macro at the script level thin C++ dll
deliver a packet to the interface
Java wrapper
traceroute pingPackettrain
yourmodule

DIMES Future• DIMES as a leading research tool (6-8M measurements/day)
– Data is available to all
– Easy to run distributed experiments• Fast deployment cycle
– Easy to add new capabilities
• Plug-ins to improve applications– P2P communication
– Web downloads (FireFox plug-in is available)

Who
• PI: Yuval Shavitt• Ph.D. students: Eran Shir, Tomer Tankel• Master’s student: Dima Feldman, Udi, Elad,
Anat..• Programmers: Anat Halpern, Ohad
Serfati, Yoav Freund, Ela M.• Undergrads: Roni Ilani, ….• Collaborators: HUJI, ColBud

http://www.netdimes.org