Digitalization in Shipping - TraFi · NAPA Solutions for Safe and Efficient Ship Operations 2 NAPA...
24
www.napa.fi Digitalization in Shipping VP Products, NAPA Tom Sundell
Transcript of Digitalization in Shipping - TraFi · NAPA Solutions for Safe and Efficient Ship Operations 2 NAPA...

www.napa.fi
Digitalization in Shipping
VP Products, NAPA
Tom Sundell

NAPA Solutions for Safe and Efficient Ship Operations
2
NAPA•A very short introduction to NAPA•NAPA for safety and efficiency of the industry
The Shipping Ecosystem and Data Transparency•Multiple actors and complex contractual arrangement hides inefficiencies•Increase transparency would benefit the whole logistics value chain –the Data Exists!
Data Driven Insight to Ship Operation for Better Performance•Monitoring and optimizing voyage executions with help of IT and Data•Utilizing operational data to get ships that fit their trade
Digitalization and Safety•Increased safety, predictability and traceability through data logging and sharing•Integrates IT solutions onboard supporting status awareness

© NAPA© NAPA
NAPA Software, Services and Data Analysis
for the Maritime Industry
3

© NAPA4
INSTALLATIONSONBOARD
2000+VESSELS
95%OF SHIPS BUILT
ANNUALLYDESIGNED BY NAPA USERS
12COUNTRY OFFICES
WORLDWIDE
180 EMPLOYEES
€21 MILLION REVENUE
IN 2015
UP TO
20%SAVINGS IN
FLEET OPERATIONS AND MAINTENANCE
WITH NAPA
2500+NAVAL ARCHITECTS
USE NAPA DAILY IN THEIR
DESIGN WORK
NAPA in Numbers
26 YEARS

© NAPA
Shipping Ecosystem and Data Transparency
5

© NAPA
Exhibit A: Charter-Party ContractOrigin: charta partita
A contract between the:• Owner of the ship• Charterer for the use of the ship• Most central contract type in the
industry still today
Charter-Party Contract from 1727
6

© NAPA
Shipping in the 1700’s
7
Shipping in the 2000’s
10 000 000 000 tons of goods / year

© NAPA
Inefficient Ecosystem
The current state of Marine and Shipping Ecosystem is very• complex• fragmented• has parties with conflicting interest • hides inefficiencies
8
Source: Positioning ReportAnalysis of the current marine industry structure and a vision for a renewed marine industry ecosystemÅbo Akademi University 2015 – REBUS Program

© NAPA
Conflict of Interests leads to Sub Optimization
9
Classification society
Flag state authorities
Insurance providers
Cargo owners Brokers
Ports & agentsStevedores
Ship ownersService suppliers
Customs
Traffic controlBorder control
Environmental authorities
Weather servicesData analysts
Universities
Communication providers
Fuel suppliers
Ship designer
Shipyards
Railway and truck operators
Equipment manufacturers
Ship operators
Charterers
© NAPA
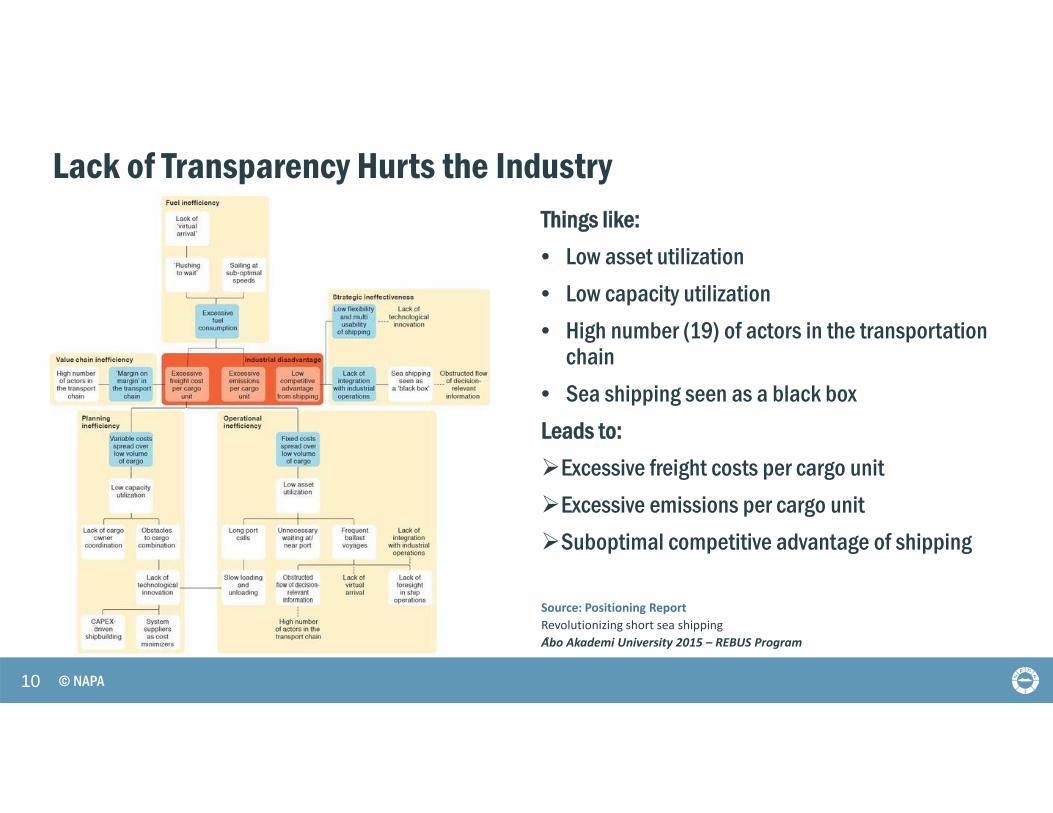
Lack of Transparency Hurts the Industry Things like:• Low asset utilization• Low capacity utilization• High number (19) of actors in the transportation
chain• Sea shipping seen as a black boxLeads to:Excessive freight costs per cargo unitExcessive emissions per cargo unitSuboptimal competitive advantage of shipping
10
Source: Positioning ReportRevolutionizing short sea shippingA ̊bo Akademi University 2015 – REBUS Program

© NAPA
Example: Inefficiencies in Baltic short sea shipping Based on AIS and PortPlus notification data from 2013 & 2014
40 % 36 %40 %Ships spend 40 % of their time in port! Vessels rush to port because of ”first come – first served” slot allocation system
Ships sails 40 % of their time at sea in ballast because of lack of suitable cargo.
As a result ships in Baltic use only 36 % of their time creating value to their customers!
11

© NAPA
Data Driven Insight to Ship Operation
for Better Performance
12

© NAPA
• E.g. port slot allocation system incentives ship to rush to que
• Monitoring ship performance makes this visible to stakeholders
Example: Rush to Wait System Inefficiencies
13

© NAPA
• E.g. port slot allocation system incentives ship to rush to que
• Monitoring ship performance makes this visible to stakeholders
• Delaying the arrival and optimizing the speed profile resulted for this case in:
• 13 % reduction in bunker costs• 13 % reduction in CO2 emissions
Example: Rush to Wait System Inefficiencies
Optimized speeds and later arrival
14

© NAPA
Example: Monitoring Hull & Propeller Performance
15
Ship owner: Pays for hull
maintenance Pays performance
penalty
Cargo owner: Pays for fuel Does not have
access to accurate reporting system

© NAPA16
Mean draft Mean draft8.00 9.00 10.00 11.00 12.00 13.00 14.00 15.00 8.00 9.00 10.00 11.00 12.00 13.00 14.00 15.00
Speed
1.00 0.00 0.00 0.00 0.00 0.00 0.00 0.00 0.00
Speed
1.00 0.0 0.0 0.0 0.0 0.0 0.0 0.0 0.02.00 0.00 0.00 0.00 0.00 0.00 0.00 0.00 0.00 2.00 0.0 0.0 0.0 0.0 0.0 0.0 0.0 0.03.00 28672.69 0.00 19899.13 13651.33 0.00 0.00 0.00 0.00 3.00 1.0 0.0 1.0 2.0 0.0 0.0 0.0 0.04.00 0.00 14069.64 1899.00 24483.91 12553.02 0.00 0.00 0.00 4.00 0.0 1.0 2.0 1.0 1.0 0.0 0.0 0.05.00 0.00 0.00 10018.17 0.00 24909.73 0.00 0.00 0.00 5.00 0.0 0.0 1.0 0.0 1.0 0.0 0.0 0.06.00 0.00 0.00 0.00 16682.97 0.00 18434.28 0.00 0.00 6.00 0.0 0.0 0.0 4.0 0.0 1.0 0.0 0.07.00 0.00 0.00 26593.77 28325.67 26139.87 12101.68 0.00 0.00 7.00 0.0 0.0 1.0 1.0 1.0 1.0 0.0 0.08.00 0.00 0.00 15325.51 11747.83 0.00 0.00 0.00 0.00 8.00 0.0 0.0 2.0 3.0 0.0 0.0 0.0 0.09.00 0.00 0.00 0.00 0.00 51126.67 0.00 0.00 0.00 9.00 0.0 0.0 0.0 0.0 1.0 0.0 0.0 0.0
10.00 0.00 16434.52 0.00 14831.01 28642.94 0.00 0.00 0.00 10.00 0.0 1.0 0.0 1.0 2.0 0.0 0.0 0.011.00 0.00 0.00 0.00 0.00 0.00 17914.81 0.00 0.00 11.00 0.0 0.0 0.0 0.0 0.0 1.0 0.0 0.012.00 0.00 0.00 26807.41 13897.74 18639.33 0.00 0.00 0.00 12.00 0.0 0.0 3.0 1.0 1.0 0.0 0.0 0.013.00 0.00 0.00 0.00 0.00 0.00 6530.38 1268.63 0.00 13.00 0.0 0.0 0.0 0.0 0.0 1.0 1.0 0.014.00 0.00 0.00 23509.59 17289.93 18860.09 21282.28 0.00 0.00 14.00 0.0 0.0 1.0 2.0 4.0 2.0 0.0 0.015.00 0.00 0.00 0.00 22900.95 22105.65 13595.68 0.00 0.00 15.00 0.0 0.0 0.0 4.0 2.0 1.0 0.0 0.016.00 0.00 0.00 0.00 26088.27 19494.71 22570.21 0.00 0.00 16.00 0.0 0.0 0.0 7.0 4.0 1.0 0.0 0.017.00 0.00 0.00 0.00 12446.99 32928.30 12317.75 0.00 0.00 17.00 0.0 0.0 0.0 1.0 8.9 9.9 0.0 0.018.00 0.00 0.00 23429.03 18269.73 29165.12 18399.72 5971.02 0.00 18.00 0.0 0.0 1.0 6.0 7.0 13.9 1.0 0.019.00 0.00 0.00 19748.09 22336.54 22595.81 22946.50 3289.11 0.00 19.00 0.0 0.0 1.0 9.9 11.9 3.0 1.0 0.020.00 0.00 0.00 28839.57 18170.27 29706.97 19255.23 14051.07 0.00 20.00 0.0 0.0 1.0 8.0 5.0 6.0 2.0 0.021.00 0.00 0.00 0.00 19837.84 17020.94 0.00 0.00 0.00 21.00 0.0 0.0 0.0 4.0 1.0 0.0 0.0 0.022.00 0.00 0.00 0.00 16184.30 0.00 0.00 0.00 0.00 22.00 0.0 0.0 0.0 2.0 0.0 0.0 0.0 0.023.00 0.00 0.00 0.00 0.00 0.00 0.00 0.00 0.00 23.00 0.0 0.0 0.0 0.0 0.0 0.0 0.0 0.024.00 0.00 0.00 0.00 0.00 0.00 0.00 0.00 0.00 24.00 0.0 0.0 0.0 0.0 0.0 0.0 0.0 0.025.00 0.00 0.00 0.00 0.00 0.00 0.00 0.00 0.00 25.00 0.0 0.0 0.0 0.0 0.0 0.0 0.0 0.0
Monitoring Gives Insight to Real Conditions
Propulsion Power [kW] Time sailed
Design Point

© NAPA
Using Data for Feedback for Optimal Design
ShipbuildingDesign• Real environment• Real operation• Hull form • Performance
estimation
Voyage Reporting• Monitoring• Data analysis• Performance in real
conditions
Feedback
17

© NAPA
Does IT and the “Digital Revolution” Increase
Safety?
18

© NAPA
• Increasing amount of data available from the ships:• Loading condition data• Logbook data• Automation/machinery data• Weather data• Position Data
• If shared and made available this can be used to:• New applications and services• Communicate safety status to other stakeholders• Developing new rules and regulations• Increase Safety
Digital Revolution: Improving Safety?
19

© NAPA
Safer Shipping – General Concept
LEARN & MEASURE VULNERABILITY
DETECT & ANALYZE SEVERITY
TIMESCALE & ESTIMATE SURVIVABILITY
EVACUATE orSTAY ONBOARD
VULNERABILITY & STABILITY
DAMAGE CONTROL &INCREASE STABILITY
Proactive safety
increase
Reactive and Predictive Decision Support in an emergency
EMERGENCY SITUATIONWithin minutes 15-30minutes > 2 hours

© NAPA
Status Awareness for the Crew and other Stakeholder
LEARN & MEASURE VULNERABILITY
DETECT & ANALYZE SEVERITY
TIMESCALE & ESTIMATE SURVIVABILITY
EVACUATE orSTAY ONBOARD
VULNERABILITY & STABILITY
DAMAGE CONTROL &INCREASE STABILITY
Proactive safety
increase
Reactive and Predictive Decision Support in an emergency
EMERGENCY SITUATIONWithin minutes 15-30minutes > 2 hours

© NAPA
Emergency room in action – already today!
22

© NAPA© NAPA
Summary
23
• Monumental possibilities for increased efficiency exists• Scattered reporting and paper-based logs still mainstream• Conflict of interest and sub optimization increases inertia in the ecosystem• IT and Data enablers for Safety and Efficiency in Shipping• Open and transparent information will be the game changer (bringing shipping
closer to a Perfect Market)!
How to disrupt world’s biggest business?

© NAPA
www.napa.fi
Thank You
Credits: FIMECC REBUS “Towards Rational Business Practices”Sub Project P2 “Logistics Networks”