ISO 9000 and ISO 14000 standards: an international diffusion model
Diffusion of ISO 9000 Standards
and International Trade
Michal Grajek∗
Wissenschaftszentrum Berlin für Sozialforschung (WZB)
and Humboldt-University of Berlin
Abstract
A debate exists as to how ISO 9000 impacts trade. On the one hand, it is argued that ISO 9000
is a “common language” that lowers information asymmetries between firms, thus allowing
more efficient organization of inter-firm trade. On the other hand, ISO 9000 is criticized as a
means of introducing market-entry barriers and a tariff on international trade. The empirical
results we present support the common-language hypothesis. ISO 9000 generally benefits
international trade, but also adds to its concentration. The likely reason for this is that ISO
9000 certified firms, which are overrepresented in developed countries, tend to trade with
each other more than with uncertified firms.
THIS PAPER COMPETES FOR THE YOUNG ECONOMISTS AWARD
Keywords: Trade, ISO 9000, Standardization, Network Effects
JEL Classification: C51, C52, F15
∗ Wissenschaftszentrum Berlin für Sozialforschung (WZB), Reichpietschufer 50, 10785 Berlin, Germany, tel.:
+49 30 25 491 419, fax: +49 30 25 491 444, e-mail: [email protected]. Financial support from the German
Federal Ministry of Education and Research is gratefully acknowledged (project 01AK702A). I would also like
to thank Joe Clougherty, Susanne Prantl, Lars-Hendrik Röller, Oz Shy, and Christian Wey for helpful comments
and discussions. All remaining errors are my own.
1. Introduction
The main goal of the International Organization for Standardization (ISO) is to
harmonize standards around the world, which, as it is widely claimed, promotes trade and
therefore global welfare. Examples of the work done by ISO include technical, environmental,
and management standards. ISO 9000 family of standards – often referred to as generic
quality management standards – is one of them. The vision of the developers is that
(…) through its worldwide acceptance and use, the ISO 9000 family of standards will provide an effective
means for improving the performance of individual organizations and providing confidence to people and
organizations that products (goods and services) will meet their expectations thereby enhancing trade,
global prosperity and individual well-being.1
Critics of ISO 9000 claim, however, that it is merely a barrier to market entry and a
tariff on international trade. There are valid arguments on both sides. On the one hand, ISO
9000 might be used as a common language, which lowers informational asymmetry between
firms and allows them to organize trade more efficiently. Indeed, the standards emphasize
clear and open communication with customers, as well as with suppliers.2 Furthermore, they
provide a tool facilitating screening and performance evaluation. Consequently, learning this
common language offers an alternative for establishing vertical relations based on long-term
relationship and trust reputation. On the other hand, ISO 9000 has been used as a standard
against which to assess performance in government procurements and in setting of minimum
quality requirements for imports. This raises a concern that the standard is mainly a tool for
protecting domestic markets.
This paper empirically investigates the impact of ISO 9000 on international trade. We
estimate a gravity equation for bilateral trade incorporating ISO 9000 adoptions in each
1 http://www.tc176.org/About176.asp
2 See ISO (2001).
1

country as factors affecting bilateral trade barriers. As it has been pointed out in the literature,
the causality might go both ways. International trade might benefit (suffer) from standards’
harmonization, as trade barriers decrease (increase); and standardization process might in turn
be determined by intensity of foreign trade, which indicates openness of an economy ( see e.g.
Casella, 1996; Moenius, 2000). As a consequence, empirical models of international trade
using standardization as an explanatory variable may suffer from endogeneity bias. We
carefully address this issue in the paper. Statistical tests do not reject exogeneity of ISO 9000
adoptions in our gravity equation. As we discuss later, however, there are reasons to believe
that this result does not hold for other – e.g. technical – standards. Although, we do not need
to endogenize ISO 9000 adoptions for consistency of our gravity equation results, we estimate
its international diffusion equation to obtain additional insights.
The empirical literature investigating the impact of common standards on trade is
scarce. In particular, we are not aware of any study that investigates the performance of ISO
9000 in this context. Few existing empirical analyses of ISO 9000 focus on managers’
motivation to seek the certification and on market reaction to it. Examples include Anderson
et. al. (1999), who find that after controlling for regulatory and customer pressures, providing
credible signals of quality assurance to external parties motivates the adoption decision.
Further, Docking and Dowen (1999) examine the reaction of the firms’ stock price to the
announcement of ISO 9000 registration. They find that, for smaller firms, investors react
positively to the announcement and that there was no significant reaction for larger firms.
The work by Moenius (2000), looking at the impact of country-specific and bilaterally
shared product and process standards on international trade, is probably closest to our work.
He finds that both country-specific and shared standards are favorable to trade. Similarly,
Swann et al. (1996) report that both international and country-specific product standards
promote imports into the U.K. Further, Blind (2001) analyses Switzerland’s trade of
2
measurement and testing products with Germany, France, and the U.K. He finds that the stock
of both national and international standards in this sector has a positive impact on the trade
flows. In turn, Blind (2002) investigates factors responsible for intensity of standardization in
20 industrial sectors of seven countries. He reports empirical evidence of the positive relation
between the stock of national and international standards in a sector and the ratio of exports to
total production in that sector.
More generally, our work also relates to the strand of literature considering the role of
networks in reducing information costs associated with international trade (e.g. Rauch, 1999;
Rauch and Trindade, 2002). In our view, the role of ISO 9000 for international trade very
much overlaps with the role of ethnic Chinese networks for trade studied by Rauch and
Trindade (2002). To the extent that ISO 9000 lowers information and search costs, it also
relates to the role of Internet for trade studied by Freund and Weinhold (2004). Neither of
these studies, however, discusses the potential endogeneity of networks’ formation.
The rest of the paper is organized as follows. Section 2 describes the ISO 9000 family
of standards and its role in international trade more in detail. Section 3 provides theoretical
models of bilateral trade flows and standard diffusion, which guide our empirical analysis.
Data, empirical implementation of the theoretical models, and discussion of the results are
presented in section 4. Section 5 concludes.
2. ISO 9000 and its role in international trade
The ISO 9000 family of standards is often referred to as generic quality management
standards – generic in the sense that they can be implemented by any organization regardless
of its size, activity sector, and managerial or national culture. Quality management reflects
what the organization does to enhance customer satisfaction by meeting his/her requirements
3

and expectations.3 Compliance with ISO 9000 indicates consistent use of documents and
standardized procedures to produce a good or service, for which the customer contracts. In
other words, ISO 9000 certifies that the firm’s products conform to specification.
The history of ISO 9000 started in 1987 with publication of the ISO 9000 Quality
Assurance Standards by a Technical Committee (TC 176) of the International Organization
for Standardization (ISO). By the end of 2001, the number of ISO 9000 certificates exceeded
half a million in 161 countries around the world, contributing to its reputation as an
international reference for quality requirements in business-to-business dealings.4 We treat
ISO 9000 as a uniform standard although it consists of a series of nested standards, which
evolved over time. The core members of the original family with which firms could actually
be certified were ISO 9001, ISO 9002, and ISO 9003. They differed in terms of the quality
system elements they covered. The nested nature of these standards allowed firms to
accommodate differences in the scope of their operations.5 The 2000 edition of the ISO 9000
family replaced these three standards with a single one labeled ISO 9001: 2000. As
supplementary standards, the 2000 edition included ISO 9000: 2000, which describes
fundamentals and specifies vocabulary for a quality management system, and ISO 9004:
2000, which provides guidelines for performance improvements. Both of them were
developed on the basis of previous standards, which they replaced. Given that the core
members of the ISO 9000 family were finally replaced by a single one, our simplifying
assumption treating ISO 9000 as a uniform standard seems justified.
ISO 9000 adoption is a sovereign decision of each firm; however, they can seek
certification only in their home countries. Each country has one government-designed
3 See ISO (2002).
4 Ibid.
5 See Anderson et al. (1995, 1999) for details.
4
accrediting agency that certifies the competence of third party registrars to conduct ISO 9000
quality audits. The registrars are also charged with the issuing of certificates.6 In general,
motivations behind the implementation of ISO 9000 could be divided into three main
categories: i) compliance with government regulations, ii) ability to enter new forms of
vertical relations due to use of a common language, and iii) internal efficiency gains. In fact,
all the factors influencing managers to seek ISO 9000 certification identified by Anderson et
al. (1999) in a comprehensive review of practitioners journals fall into one of the three
categories.
The first category stems from the fact that ISO 9000 has been used as a standard
against which to assess performance in government procurements and in setting of minimum
quality requirements for products that affect public safety. The Single Market Initiative of
1992 initiated by the European Community involves the most noticeable example of such
regulations. The public safety argument obliged firms to attain a uniquely designed EC Mark
in order to get access to certain markets.7 ISO 9000 was selected as a means to attain the mark
in most of the cases. This raises the concern that ISO 9000 can be a barrier to market entry
and a tariff on international trade. We relate our empirical findings to potential effects of the
regulations.
The second category of motivations is the focus of this study. As noted by Bénézech et
al. (2001, p. 1396), “the ISO 9000 series can be viewed as a code, a language used by firms to
extend their industrial relationship”. Thanks to standardized documentation flow and
organizational procedures within certified firm, ISO 9000 provides a screening device that
allows other firms to observe and to evaluate its performance. This naturally lowers
informational asymmetries between firms. Consequently, ISO 9000 proxies for conformance
6 Ibid.
7 Ibid; depending on the product category, the EC Mark must have been attained till 1992-1995.
5
of the firm’s product to the specification, for which the customer contracts. This leads to
lower transaction and search costs in vertical relations between firms. To realize the benefits
of ISO 9000, however, both contracting parties should have adopted (i.e. learned) it in the first
place. This is why the common-language analogy is appropriate.8 Learning this common
language could be viewed as an alternative for establishing vertical relations based on long-
term relationship and trust reputation. This explains the potential of ISO 9000 for reducing
barriers to market entry and non-tariff barriers to trade.
Finally, firms seek ISO 9000 certification to realize efficiency gains. The discipline of
documentation and organizational procedures could reduce waste, lower costs, and improve
productivity. For example, relying on a survey of ISO 9000 certified firms in the U.S. (sales
from $100 million to $500 million), Anderson et al. (1999) report average annual savings of
$200,000 due to the certification.
The same authors further report that obtaining ISO 9000 certification at a
manufacturing site in the U.S. takes from 9 to 28 months and approximately 35-40% of all
sites fail the first audit. Beyond time, the actual costs of the standard adoption and
certification are also substantial. A medium size manufacturing facility employing 100 people
can expect to spend $50,000. For larger firms (sales from $100 million to $500 million), the
average cost that the authors report is $300,000. The above discussed potential costs and gains
will guide our ISO 9000 diffusion model developed in section 3.2.
8 We give the common language hypothesis a slightly different spin than Bénézech et al. (2001). They
concentrate rather on the role of ISO 9000 as a means to codify the knowledge within a firm.
6

3. Theoretical model
3.1 International trade flows
The standard empirical framework used to predict international trade flows is the
gravity equation. In a simple form, which explains its name, the equation reads
ij
jiij D
YYAV = , (1)
where Vij is value of exports from country i to country j, Yi and Yj are their economic masses
often measured by GDP or GNP, Dij is a measure of the distance between them, and A is a
constant of proportionality.9 Attractiveness of the gravity equation originally stems from its
empirical explanatory power. Recent developments, however, show that the equation can also
be theoretically motivated, in particular, in the context of classical Heckscher-Ohlin
framework, as presented by Deardorff (1998). He shows that in a frictionless world – i.e.
without transport costs and other impediments to trade – under some mild assumptions,
bilateral exports are given on average by (1) with constant of proportionality A = 1/Yw, where
Yw stands for world income. He argues also that the tendency of high-income consumers to
consume larger budget share of capital-intensive goods will lead high-income/capital-
abundant countries to trade more than average with each other and less than average with low-
income/labor-abundant countries. This would motivate inclusion of per capita income in the
gravity equation, as is often the case in empirical literature.
In the real world however, trade is impeded due to transportation costs, tariffs and
other non-tariff barriers to trade. Anderson and Wincoop (2003) derive a particularly elegant
gravity equation for bilateral exports with trade barriers. Their work falls under the stream of
9 Some empirical studies, in which gravity equation for trade is not theoretically motivated, often define Vij as
bilateral trade flows rather than exports alone.
7

research that – in contrast to the classical Heckscher-Ohlin framework – assumes product
differentiation by the place of origin. The key result of Anderson and Wincoop (2003) is that
the distance between countries in (1) Dij is determined by relative trade barriers. That is, it
directly depends on bilateral trade barriers between i and j and indirectly on bilateral trade
barriers between every other pair of countries. Unfortunately, empirical implementation of the
model is troublesome, as the closed-form solution for Dij in terms of all bilateral trade barriers
does not exist. Moreover, the authors show uniqueness of the implicit solution only for
symmetric trade barriers.10
As we have already argued, ISO 9000 might be used as a common language, adoption
of which allows firms to lower the transaction and search costs. We will assume that, by
affecting these costs, adoptions of the standard in both country i and country j will influence
their bilateral trade barriers. Section 4.2 on empirical implementation of the model presents
that more in detail.
3.2 ISO 9000 diffusion
Our modeling of the ISO 9000 adoption process is driven by the common-language
hypothesis, as explained before. This hypothesis naturally leads to network effects in the
adoption process, meaning that the value of certification for a firm depends on the total
number of certified firms. Intuitively, the more ISO 9000 certified firms the bigger the pool of
potentially more efficient business contacts, hence the higher value of the standard for each
certified firm. Since we are interested in the link between ISO 9000 and international trade,
the relevance of foreign adoptions of the standard for the home country adopters is of crucial
importance. We want to test whether economic distance between countries in terms of trade
10 I.e. barriers to exports form i to j are equal barriers to exports from j to i.
8

related factors matters for the foreign adoptions’ relevance. Finding such relationship would
give us additional insight about the role of ISO 9000 in international trade.
To facilitate the analysis we apply the model developed by Grajek (2002, 2003). It
allows us to derive structural country-specific diffusion equations from adoption decisions of
individual firms in each country. We assume that in each country i = 1, 2, …, I there is an
infinite number of heterogeneous firms, which instantaneously decide whether to adopt ISO
9000 or not. The adoption decision is influenced by the firm-specific intrinsic valuation of the
standard, denoted by vi, which corresponds to the net efficiency gains that the firm realizes
after the adoption. Another factor influencing the adoption decision is the network size of
certified firms at time t denoted by xi(t). Network effects arise in the adoption of ISO 9000
due to potentially more efficient contracting among the certified firms. The efficiency gains
and network effects together shape the net instantaneous benefits of ISO 9000 adoption,
which for simplicity takes the following functional form
u(vi,xi(t)) = vi + cxi(t) + dxi2(t), (2)
where c and d are parameters that capture the extent of network effects. The squared network
size term in (2) accounts for diminishing marginal network effect, as is usually assumed in the
theoretical literature. The costs of ISO 9000 adoption consist of a sunk investment in the
reorganization of the firm qi and an instantaneous audit fee pi, both of which are assumed to
be constant over time. The outside option is not to adopt and brings no benefits.
Firms maximize the net benefits adopting ISO 9000 when the present value of the
stream of future benefits exceeds the present value of the costs. As shown in appendix 6.1, we
can calculate the net-of-cost intrinsic valuation of indifferent firm in country i at time t,
denoted as *,
~tiv , from the following first order condition
0)()(~ 2*, =−+−+ δδ tdxtcxv iiti . (3)
The lag of network size δ in (3) is crucial for the dynamic properties of the model. It can be
9

motivated by excessive optimism of the firms regarding time needed to implement the
standard in their own sites. In fact, as we point out in section 2, the adoption process takes
time and large share of firms fails the first audit.
Assume that the net-of-cost intrinsic valuations in each country – tiv ,~ – are uniformly
distributed over an interval (-∞, ai] with some density bi. Integrating over all firms with
intrinsic valuation higher than *,
~tiv , we obtain the equilibrium number of adopters in each
country
iiiii btdxtcxaty ))()(()( 2+−+= δ . (4)
The final step in setting up the model is to define the relevant network for ISO 9000 adopters
in each country. We are not going to differentiate the firms in a given country in terms of their
cooperation prospects with each other. Instead, we want to emphasize the difference between
the foreign and the domestic firms. Therefore, we define the network size of ISO 9000
adopters as
∑≠
+=ij
jijii tywtytx )()()( , (5)
where wij reflects the relative importance of country j adopters for country i adopters. Since
we expect that foreign markets are relevant for the adoption decisions of domestic firms, we
are going to relate wij to bilateral trade between i and j in the next section. The general idea is
that the intensity of trade indicates closeness of the economies, hence the relevance of foreign
firms as business partners for the domestic firms.
Finally, substituting (5) in (4), we arrive at the following adoption equation
2
)()()()()( ⎟⎟⎠
⎞⎜⎜⎝
⎛−+−+⎟⎟
⎠
⎞⎜⎜⎝
⎛−+−+= ∑∑
≠≠ ijjijii
ijjijiiiii tywtydbtywtycbbaty δδδδ , (6)
which guides the empirical analysis in section 4.
10

4. Empirical model
4.1 Data
Data on ISO 9000 adoptions comes from ISO (2002). Bilateral exports are taken from
the UN Commodity Trade Statistics Database (Comtrade), and GDP and population figures
come from the IMF’s International Financial Statistics. The data ranges over 1995-2001 and
covers 101 countries. The sample is restricted to this period, because the main variable of
interest – ISO 9000 adoptions – is not available prior to 1995. Table 1 lists the countries
included in this study together with the number of firms that adopted ISO 9000 standard till
the end of 2001 in each of the countries. Summary statistics of the variables used in the
estimations are given in table 2.
A distinctive feature of this study is its particularly wide coverage of countries. In fact,
our sample covers approximately 80% of the world trade and 99% of the world ISO 9000
adoptions. A primary reason for this is that the adoptions of ISO 9000 in each country depend
on the world diffusion of the standard, as predicted by equation (6). Therefore, the smaller the
coverage of the sample, the more sever is the concern about omitted variable bias in the
estimates. Additionally, inclusion of the less developed countries, for which the trade barriers
aspect of ISO 9000 is potentially more severe, is important for the generality of our results. In
the context of gravity equation for trade, the wide coverage of countries might seem
problematic. The theories of trade in imperfect substitutes, which were the first to justify the
gravity model, were thought to apply only to the industrialized countries. However, as found
by Hummels and Levinsohn (1995), the model works equally well for the larger set of
countries.11
11 See the discussion in Frankel et.al. (1997), p. 55.
11
4.2 Implementation of gravity equation for trade
In our empirical implementation of gravity equation, we apply panel data techniques,
which have the advantage over cross-section estimations that they can capture all time
invariant trade determinants by means of country-pair specific effects. This is very useful,
since the trade barriers in gravity models are usually difficult to quantify, as they might
consist of tariff barriers, transportation costs, information costs, etc., some of which are not
even observable. Among many variables proposed by researchers to approximate the trade
barriers, there are geographical distance, linguistic and colonial ties, membership in trade
agreements and monetary unions, and common borders. To the extent that these variables are
time invariant, which is very likely given the relatively short time span of our data, the
country-pair specific effects will account for them. A particular ingredient of the trade barriers
we consider are search and transaction costs. According to the main hypothesis of this paper,
they can be lowered for firms that invested in learning of the common language – ISO 9000.
As it is commonly assumed, the trade barriers are approximated by a log-linear function.
Then, our specification of the trade barriers in (1) reads12
. (7)
According to (7) the lack of ISO 9000 awarded firms in both countries i and j simplifies the
measure of the bilateral trade barriers to a function of country-pair specific effect. Since, we
do not impose symmetry on the trade barriers, η
( ) ( 21 111 δδηjtitijt ISOISOeD ij ++=− )
ij is in fact importer-exporter specific. This
asymmetry is going to be important later on, because it allows us to distinguish the distance to
foreign customer (importer) from the distance to foreign supplier (exporter) from the domestic
firm viewpoint. Unilateral adoptions of ISO 9000 affect average trade barriers only
12 As discussed in previous section, the measure of distance between two countries Dij could be broadly
interpreted as the measure of trade barriers between them.
12
marginally.13 Bilateral adoptions multiply this effect, as follows from our interpretation of
ISO 9000 as a common language. For the sake of generality, we do not restrict the parameters
δ1 and δ2 to be equal, although this would fit our common-language hypothesis.
Then, after substituting the measures of economic masses and the constant of
proportionality in (1) with specific functions of the observables, the gravity equation that we
estimate becomes
( ) ( ) ijtijtjtit
jtitjtitijt
ISOISO
POPPOPGDPGDPX
εηλδδ
γγββα
+++++++
+++++=
1ln1ln
lnlnlnlnln
21
2121 , (8)
where Xijt denotes exports from country i to country j in year t.14 We do not restrict the
parameters on countries’ GDP – β1 and β2 – to be equal. We also include POP variable, which
measures the countries’ population in millions. The reason for that is to capture the tendency
that rich countries trade more than average with each other, as explained in section 3.1.15
Finally, λt stands for time effects, which are meant to capture changes in the world income,
and εijt is a usual i.i.d. error term.
4.3 Implementation of ISO 9000 diffusion equation
Now, we turn to the empirical implementation of the ISO 9000 adoption equation (6).
As already mentioned, we are mainly interested in the relevance of international markets for
the adoption decisions of domestic firms. Our assumption, which follows from the
13 We would like to stress that specification (7) describes average bilateral trade barriers, since the trade barriers
faced by ISO 9000 certified firms and non certified firms differ.
14 In equation (8), a small technical difficulty arises, because of zero-valued entries in bilateral exports Xijt.
Following Frankel et al. (1997), we treat these observations as missing.
15 Actually the inclusion of lnPOP or ln(GDP/POP) in (8) is mathematically equivalent. What changes is only
the interpretation of the parameters. See Frankel at al. (1997) for a simple exposition of this point.
13
common-language hypothesis, is that ISO adoptions in close economies reinforce each other
relatively more than ISO adoptions in distant economies. There are two natural candidates for
measuring this economic closeness/distance; intensity of bilateral trade and bilateral trade
barriers. In the context of gravity equation (8), the difference between the two is that intensity
of bilateral trade depends on the countries’ economic masses and some unobserved factors
captured by the error term on top of the bilateral trade barriers.
These two measures of economic distance differ also in terms of the econometric
treatment of the models they imply. The trade intensity measure obviously leads to
endogeneity of ISO 9000 variables in the gravity equation (8), whereas trade barriers measure
does not. Testing for the endogeneity of ISO 9000 in the gravity equation yields then a way to
discriminate between them.
Here, we proceed assuming that bilateral trade barriers are the relevant measure of
economic distance in the context of ISO 9000 adoptions. In other words, we assume that the
relevance of a foreign ISO adoption for domestic firms does not depend on the size of foreign
economy in which the adoption occurs. This is justified by the fact the ISO 9000 adoptions
take place at the individual firm level, as opposed to other – e.g. technical – standards, which
are usually adopted at the industry or nation level. Clearly, the size of the economy is more
relevant in the latter than in the former case. Our specification of the economic closeness then
reads
jiij ewewwijηη
21 += , (9)
where w1 and w2 are some constant weights and {ηij} are the importer-exporter specific effects
in (8). Since ηij (ηji) reflects the barriers to exports from i to j (from j to i) specification (9)
distinguishes the distance to foreign customers – weighted by w1 – from the distance to
foreign suppliers – weighted by w2. In fact, estimation of the parameters w1 and w2 drives our
interest in the ISO 9000 adoption equation. Positive values of w1 and/or w2 would suggest that
14
the firms’ adoption decisions are indeed affected by the number of potential foreign customers
and/or suppliers certified with ISO 9000.
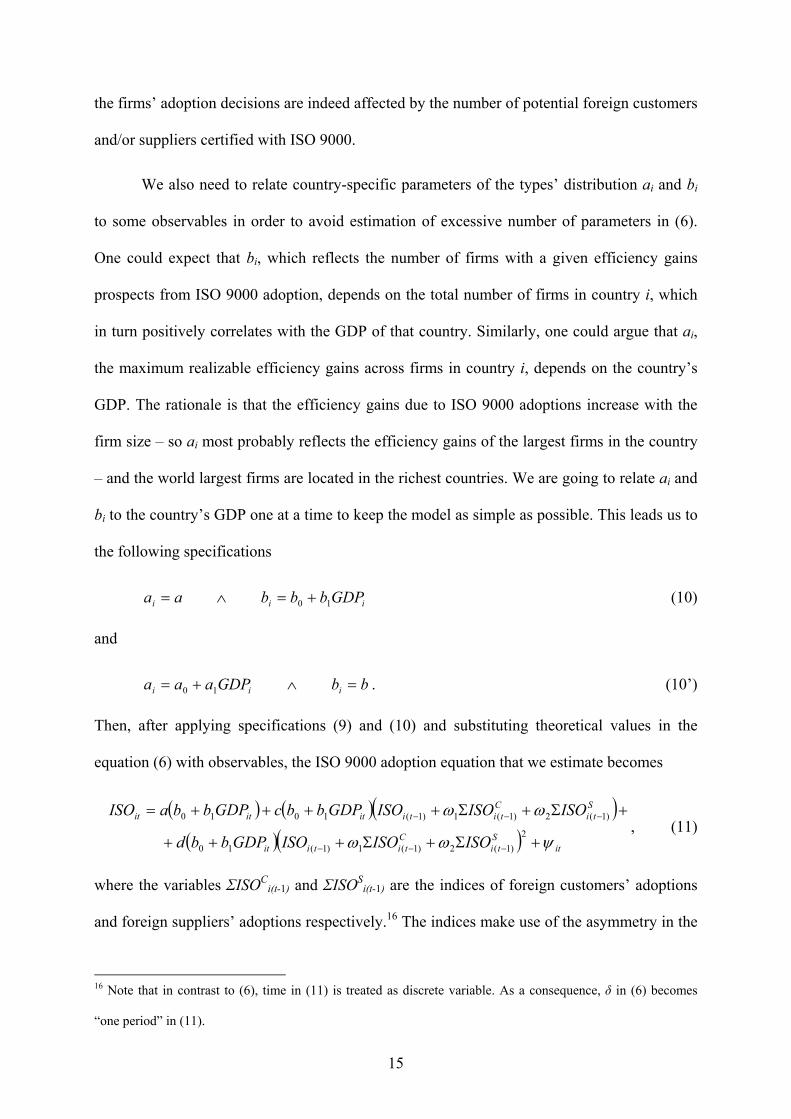
We also need to relate country-specific parameters of the types’ distribution ai and bi
to some observables in order to avoid estimation of excessive number of parameters in (6).
One could expect that bi, which reflects the number of firms with a given efficiency gains
prospects from ISO 9000 adoption, depends on the total number of firms in country i, which
in turn positively correlates with the GDP of that country. Similarly, one could argue that ai,
the maximum realizable efficiency gains across firms in country i, depends on the country’s
GDP. The rationale is that the efficiency gains due to ISO 9000 adoptions increase with the
firm size – so ai most probably reflects the efficiency gains of the largest firms in the country
– and the world largest firms are located in the richest countries. We are going to relate ai and
bi to the country’s GDP one at a time to keep the model as simple as possible. This leads us to
the following specifications
(10)
and
iii GDPbbbaa 10 +=∧=
bbGDPaaa iii =∧+= 10 . (10’)
Then, after applying specifications (9) and (10) and substituting theoretical values in the
equation (6) with observables, the ISO 9000 adoption equation that we estimate becomes
( ) ( )( )( )( ) it
Sti
Ctitiit
Sti
Ctitiititit
ISOISOISOGDPbbd
ISOISOISOGDPbbcGDPbbaISO
ψωω
ωω
+Σ+Σ+++
+Σ+Σ++++=
−−−
−−−
2)1(2)1(1)1(10
)1(2)1(1)1(1010, (11)
where the variables ΣISOCi(t-1) and ΣISOS
i(t-1) are the indices of foreign customers’ adoptions
and foreign suppliers’ adoptions respectively.16 The indices make use of the asymmetry in the
16 Note that in contrast to (6), time in (11) is treated as discrete variable. As a consequence, δ in (6) becomes
“one period” in (11).
15
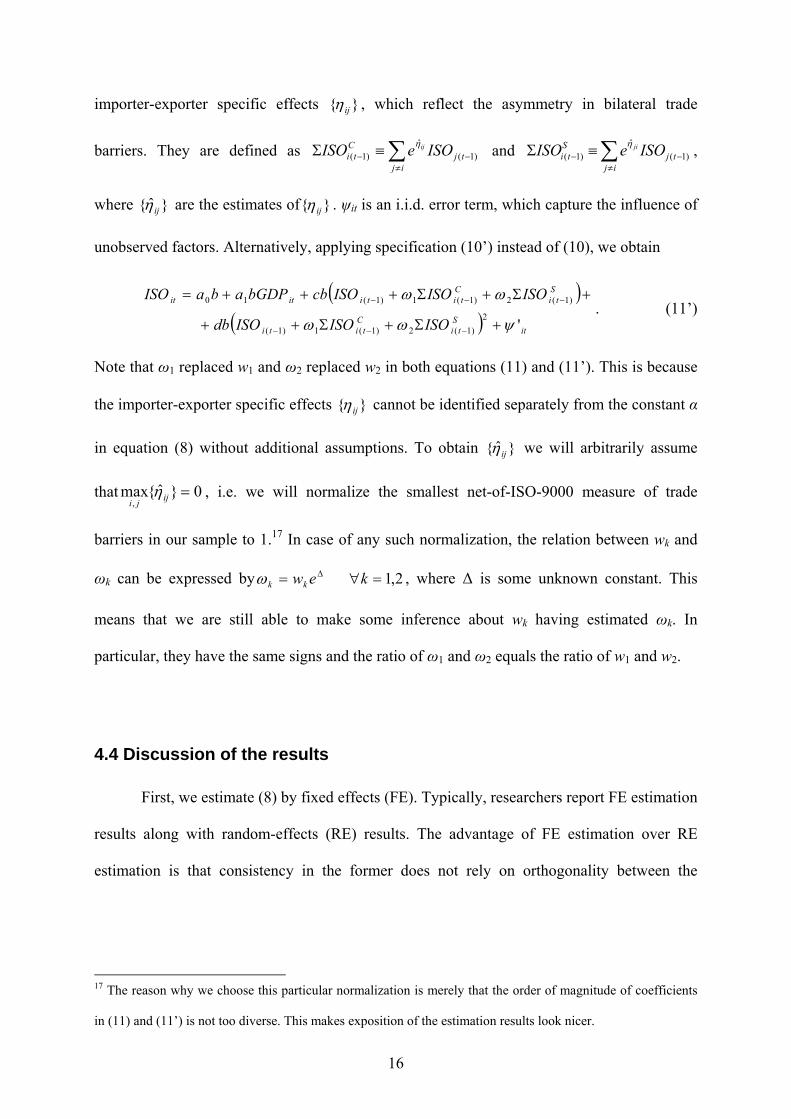
importer-exporter specific effects }{ ijη , which reflect the asymmetry in bilateral trade
barriers. They are defined as ∑≠
−− ≡Σij
tjC
ti ISOeISO ij)1(
ˆ)1(
η and ,
where
∑≠
−− ≡Σij
tjS
ti ISOeISO ji)1(
ˆ)1(
η
}ˆ{ ijη are the estimates of }{ ijη . ψit is an i.i.d. error term, which capture the influence of
unobserved factors. Alternatively, applying specification (10’) instead of (10), we obtain
( )
( ) itS
tiC
titi
Sti
Ctitiitit
ISOISOISOdb
ISOISOISOcbbGDPabaISO
'2)1(2)1(1)1(
)1(2)1(1)1(10
ψωω
ωω
+Σ+Σ++
+Σ+Σ+++=
−−−
−−−. (11’)
Note that ω1 replaced w1 and ω2 replaced w2 in both equations (11) and (11’). This is because
the importer-exporter specific effects }{ ijη cannot be identified separately from the constant α
in equation (8) without additional assumptions. To obtain }ˆ{ ijη we will arbitrarily assume
that 0}ˆ{max,
=ijjiη , i.e. we will normalize the smallest net-of-ISO-9000 measure of trade
barriers in our sample to 1.17 In case of any such normalization, the relation between wk and
ωk can be expressed by , where ∆ is some unknown constant. This
means that we are still able to make some inference about w
2,1=∀= ∆ kewkkω
k having estimated ωk. In
particular, they have the same signs and the ratio of ω1 and ω2 equals the ratio of w1 and w2.
4.4 Discussion of the results
First, we estimate (8) by fixed effects (FE). Typically, researchers report FE estimation
results along with random-effects (RE) results. The advantage of FE estimation over RE
estimation is that consistency in the former does not rely on orthogonality between the
17 The reason why we choose this particular normalization is merely that the order of magnitude of coefficients
in (11) and (11’) is not too diverse. This makes exposition of the estimation results look nicer.
16

country-pair specific effects ηij and all the other explanatory variables.18 We skip the RE
estimation, since we expect the adoptions of ISO in country i to depend on the economic
distance to each trade partner indicated by ηij. The FE estimation results are presented in
table 3.
The first three columns (1) – (3) contain results of the regressions, in which we
exclude some of the explanatory variables and column (4) corresponds to the regression with
the full set of covariates. We see that estimated coefficients vary only marginally across these
different specifications. In general, we find the coefficient on countries’ own income β1 and
the coefficient on partner’s income β2 to lie about 0,3 and 0,7 respectively. Moreover, the
coefficients on population γ1 and γ2 tend to be of the same magnitude with reversed sign as
income coefficients. These estimates imply that, in contrast to theoretical prediction and the
results from cross-sectional studies (see e.g. Frankel et al., 1997, table 4.2 and table B6.6),
trade is almost entirely driven by countries’ income per capita. Glick and Rose (2002), who
also apply FE estimation, report findings, which are similar to ours (see table 4 in there).
The next four regressions (5) – (8) in table 3 augment the first four regressions by
inclusion of the leading explanatory variables in order to test the strict exogeneity assumption,
as suggested by Wooldridge (2002, p. 285). The null hypothesis of the Wald test reported in
table 3 is that coefficients on the leading explanatory variables equal zero. We see that the
Wald test rejects the null – and thereby strict exogeneity of the explanatory variables – in all
four cases at very high significance. Without strict exogeneity, the FE estimators become
inconsistent, so the estimates of the gravity equation coefficients in table 3 can be misleading.
18 We follow the approach in Wooldridge (2002, p. 251–252), that FE and RE correspond to the assumptions we
are willing to impose on unobserved effects ηij in order to estimate the model rather than to their deterministic or
stochastic nature.
17

We believe that the reason why strict exogeneity failed in the FE estimations is that
macroeconomic indicators like exports and GDP tend to be trending variables. This is also
true for population and ISO adoptions variables. As is well known from the time series
literature, simple OLS is likely to deliver spurious correlations between trending variables.
The most straightforward remedy for that is to use first differencing (FD) estimation.
Table 4 reports the results of the same exercise, as in table 3, using FD estimation.
Again, we see that the estimated coefficients of the gravity equation are stable across different
specifications. However, the estimates changed in comparison to the FE results. The most
noticeable change concerns population variables. The coefficient on country’s own population
γ1 changed sign to positive and the coefficient on partner’s population γ2 decreased in
magnitude. Both coefficients are now statistically insignificant, which is in contrast to the
findings of cross-sectional studies. The reason for this discrepancy might be that the intended
effect of countries’ income per capita on trade is already captured by the country-pair specific
effects ηij. This is in line with the Anderson and Marcouiller’s (2002) alternative explanation
of why capital-abundant countries trade disproportionately with each other. They argue that
strong institutions support trade security, which can be plausibly treated as constant in our
data.
Given the interpretation, that country-specific effects absorb the impact of per capita
income, the coefficient on partner’s GDP in table 4, which equals roughly 0,77, corresponds
well to the findings of cross-sectional studies. The coefficient on own GDP is however about
10 times smaller and only marginally significant.19 The most important indicator, which gives
us some confidence about plausibility of our results, is the Wald test. It does not reject strict
19 Freund and Weinhold (2004) also report insignificant FD estimate of own GDP coefficient in their gravity
equation for exports. Moreover they find the coefficient on partner’s GDP to lie just slightly above 0,10 (see
table 3 in there).
18
exogeneity of the covariates in first differences in the regressions without population variables
(column 13 and 15 in table 4).
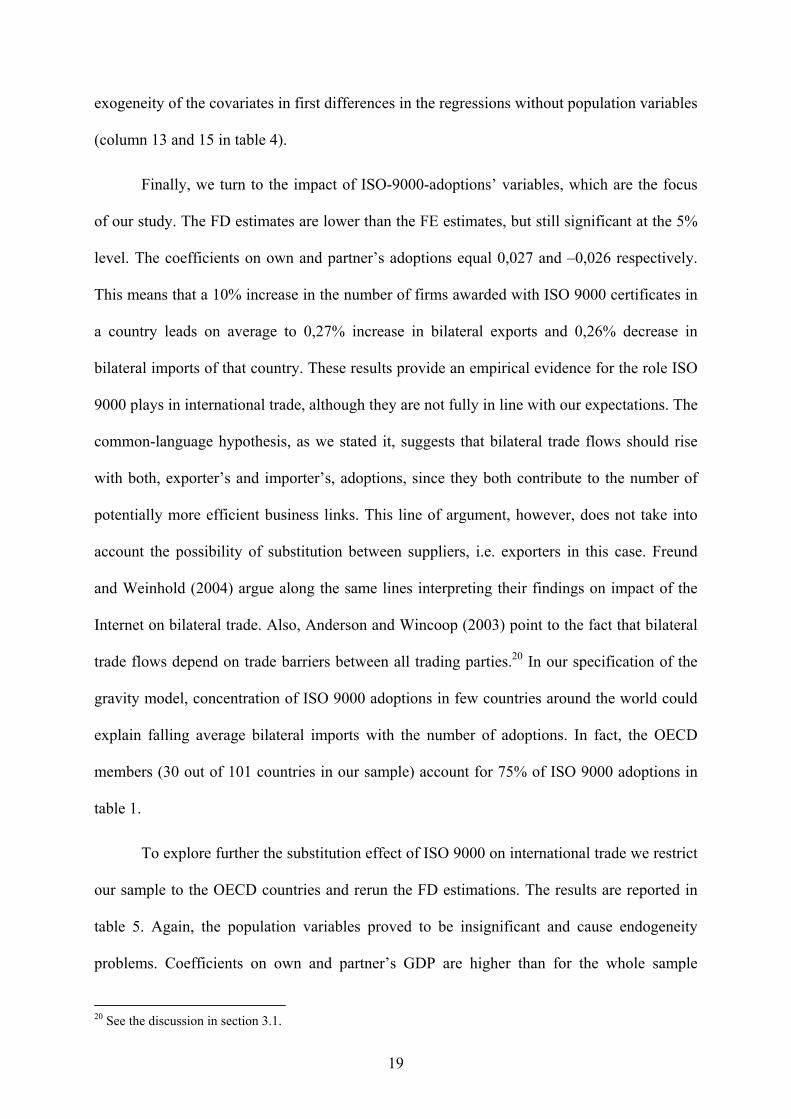
Finally, we turn to the impact of ISO-9000-adoptions’ variables, which are the focus
of our study. The FD estimates are lower than the FE estimates, but still significant at the 5%
level. The coefficients on own and partner’s adoptions equal 0,027 and –0,026 respectively.
This means that a 10% increase in the number of firms awarded with ISO 9000 certificates in
a country leads on average to 0,27% increase in bilateral exports and 0,26% decrease in
bilateral imports of that country. These results provide an empirical evidence for the role ISO
9000 plays in international trade, although they are not fully in line with our expectations. The
common-language hypothesis, as we stated it, suggests that bilateral trade flows should rise
with both, exporter’s and importer’s, adoptions, since they both contribute to the number of
potentially more efficient business links. This line of argument, however, does not take into
account the possibility of substitution between suppliers, i.e. exporters in this case. Freund
and Weinhold (2004) argue along the same lines interpreting their findings on impact of the
Internet on bilateral trade. Also, Anderson and Wincoop (2003) point to the fact that bilateral
trade flows depend on trade barriers between all trading parties.20 In our specification of the
gravity model, concentration of ISO 9000 adoptions in few countries around the world could
explain falling average bilateral imports with the number of adoptions. In fact, the OECD
members (30 out of 101 countries in our sample) account for 75% of ISO 9000 adoptions in
table 1.
To explore further the substitution effect of ISO 9000 on international trade we restrict
our sample to the OECD countries and rerun the FD estimations. The results are reported in
table 5. Again, the population variables proved to be insignificant and cause endogeneity
problems. Coefficients on own and partner’s GDP are higher than for the whole sample
20 See the discussion in section 3.1.
19
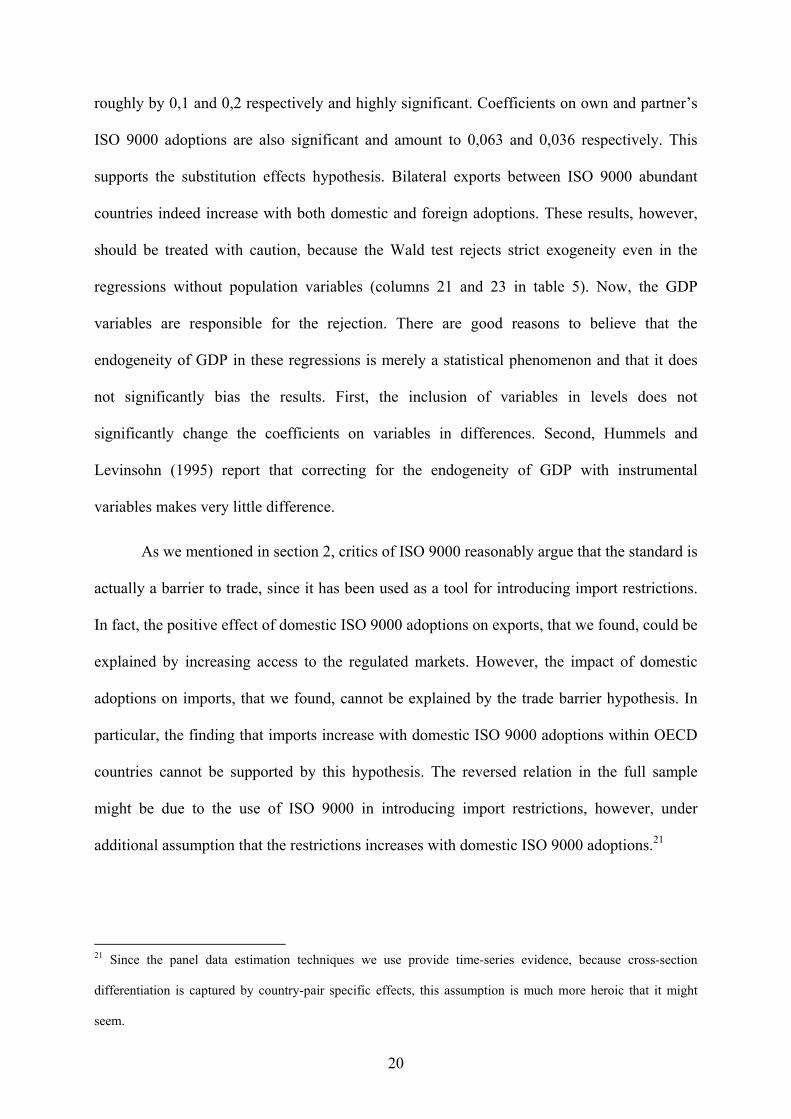
roughly by 0,1 and 0,2 respectively and highly significant. Coefficients on own and partner’s
ISO 9000 adoptions are also significant and amount to 0,063 and 0,036 respectively. This
supports the substitution effects hypothesis. Bilateral exports between ISO 9000 abundant
countries indeed increase with both domestic and foreign adoptions. These results, however,
should be treated with caution, because the Wald test rejects strict exogeneity even in the
regressions without population variables (columns 21 and 23 in table 5). Now, the GDP
variables are responsible for the rejection. There are good reasons to believe that the
endogeneity of GDP in these regressions is merely a statistical phenomenon and that it does
not significantly bias the results. First, the inclusion of variables in levels does not
significantly change the coefficients on variables in differences. Second, Hummels and
Levinsohn (1995) report that correcting for the endogeneity of GDP with instrumental
variables makes very little difference.
As we mentioned in section 2, critics of ISO 9000 reasonably argue that the standard is
actually a barrier to trade, since it has been used as a tool for introducing import restrictions.
In fact, the positive effect of domestic ISO 9000 adoptions on exports, that we found, could be
explained by increasing access to the regulated markets. However, the impact of domestic
adoptions on imports, that we found, cannot be explained by the trade barrier hypothesis. In
particular, the finding that imports increase with domestic ISO 9000 adoptions within OECD
countries cannot be supported by this hypothesis. The reversed relation in the full sample
might be due to the use of ISO 9000 in introducing import restrictions, however, under
additional assumption that the restrictions increases with domestic ISO 9000 adoptions.21
21 Since the panel data estimation techniques we use provide time-series evidence, because cross-section
differentiation is captured by country-pair specific effects, this assumption is much more heroic that it might
seem.
20
Estimation results of the ISO 9000 diffusion equation provide additional insights about
the link between the standards and international trade. To estimate (11) and (11’) we follow
the GMM-based estimation method for linear dynamic panel data models proposed by
Arellano and Bond (1991). By doing so, we allow for additional unobserved heterogeneity on
top of (11) and (11’). This unobserved heterogeneity accounts for institutional factors, like the
national accrediting agencies, which could either spur or hamper the diffusion process.
To obtain linear models we multiply out the terms in the structural equations (11) and
(11’). By multiplying out the terms, the parameters ω1 and ω2 – the transformed weights in
our measure of economic closeness (9) – become overidentified. This allows us to test the
underlying structure of the empirical diffusion equations. The estimated coefficients of the
linearized equations (11) and (11’) are reported in table 6, in columns (25) and (25’)
respectively.22 Except for the lagged dependent variable, all the regressors are treated as
strictly exogenous. We see that both regressions perform reasonably well in statistical sense,
as indicated by the Sargan and the Arellano-Bond test statistics at the bottom of the table. The
underlying economic structure of both regressions (25) and (25’) is, however, rejected by the
data. According to the structural equation (11), the ratio of coefficients on ΣISOSi(t-1) and
ISOi(t-1) in the regression (25) should be equal to the ratio of coefficients on GDPitΣISOSi(t-1)
and GDPitISOi(t-1), because both ratios identify the same parameter ω2. Yet, the ratios have
opposite signs. Similarly, the equation (11’) predicts that the ratio of coefficients on
(ΣISOCi(t-1))2 and ISO2
i(t-1) in the regression (25’) should be equal to the squared ratio of
coefficients on ΣISOCi(t-1) and ISOi(t-1), since they identify (ω2)2. But, the first ratio is
22 In the regression (25) we additionally restrict d to be equal 0 in (11). Without this assumption the main
coefficients of the model turned out to be insignificant and the Arellano-Bond test indicated second-order
autocorrelation in the residuals. The likely reason for this is the multi-collinearity of the explanatory variables.
21
negative.23 Therefore, we are going to treat the results as coming from a reduced form
approach and limit the discussion to pointing out major correlation patterns.
The results of the regressions (25) and (25’) suggest in general that ISO 9000
adoptions in each country are positively related to the market size measured by the country’s
GDP. The adoptions also exhibit significant inertia, as indicated by the coefficients on the
lagged dependent variable. Since we are mostly interested in the foreign trade considerations
in the adoption decisions of firms, the crucial result in table 6 are the coefficients on the
indices of foreign customers’ adoptions and foreign suppliers’ adoptions. We find that
domestic ISO 9000 adoptions are positively related to foreign customers’ adoptions, as
expected. In contrast, foreign suppliers’ adoptions are not or weakly negatively correlated
with domestic adoptions depending on the specification. In other words, the diffusion of ISO
9000 seems to proceed from customers to suppliers and not the other way around, at least in
the international context. This asymmetry does not necessarily contradict our
common-language hypothesis. It might reflect the fact that business customers are able to
benefit from ISO 9000 without actually being certified, as someone, who understands a
language without having passed exams that certify that. At the same time, certified suppliers
might not care about certification of the customers, if their relations are already established.
To check the robustness of these findings, we perform additional two regressions (26)
and (26’), in which the indices of foreign ISO 9000 adoptions in (25) and (25’) are replaced
with simple unweighted sum of foreign adoptions. The coefficients on the unweighted foreign
adoptions are much less significant than those on the indices of foreign adoptions in the
previous regressions. In other words, our indices are much better predictors of domestic
adoptions than is the unweighted sum. This gives us some confidence in the effects of foreign
trade considerations on domestic adoptions we found in (25) and (25’).
23 We also carried out formal Wald-type tests, which confirm this intuitive argumentation.
22
5. Conclusions
In this paper, we empirically assess the link between the ISO 9000 family of standards
and international trade. According to the vision of its developers, ISO 9000 should provide
confidence to people and organizations that products will meet their expectations, thereby
enhancing trade and global welfare. In contrast, its critics claim that it is merely a barrier to
market entry and a tariff on international trade.
Our modeling strategy is to look at the impact of ISO 9000 adoptions on bilateral trade
flows between countries. We estimate a gravity equation for bilateral exports using data on
101 countries over 1995-2001. To obtain additional evidence, we estimate an international
ISO 9000 diffusion equation and test whether the number of certified foreign trade partners
plays a role in the domestic firms’ adoption decisions.
Using the full sample, we find that domestic ISO 9000 adoptions spur bilateral exports
and hamper bilateral imports. In the sample restricted to the OECD countries, however, the
domestic adoptions are positively related to both bilateral exports and imports. Additionally,
we find empirical evidence on the positive effect of foreign customers’ adoptions of ISO 9000
on domestic adoptions.
In general, these findings are consistent with the common-language hypothesis, which
states that ISO 9000 lowers informational asymmetry between firms and allows them to
organize vertical relations more efficiently. The negative effect of ISO 9000 adoptions on
bilateral imports in the full sample can be explained by a substitution effect, as ISO 9000
certified firms tend to trade with each other more than with uncertified firms. Since domestic
certified firms are likely to choose other certified firms as suppliers, the average bilateral
imports from all trade partners falls with domestic adoptions given that concentration of the
23
adoptions around the world is high. In sum, ISO 9000 spurs international trade, but also adds
to its concentration.
The hypothesis that ISO 9000, as a tool for introducing import restrictions, is a barrier
to international trade is not able to explain our empirical findings, although we cannot reject
it. The substitution effect indicated by our results is, however, another way, in which ISO
9000 constitutes an effective trade barrier. If the diffusion of ISO 9000 in the less developed
countries remains sluggish – e.g. due to weak institutional framework – the benefits of ISO
9000 envisioned by its developers will stay in the developed countries’ domain.
6. Appendix
In this appendix we derive first order conditions for optimal timing of ISO 9000
adoptions by firms. We assume that once the standard is adopted, it yields the infinite stream
of future benefits. The present value of the stream of benefits can be written as
∫∞
−=t
iis
ii dssxvuettxvV ))(,()),(,( ρ , (12)
where ρ is a common instantaneous discount rate. The cost of adoption consists of the sunk
investment in reorganization of the firm qi and the instantaneous audit fee pi, both of which
are assumed to be constant over time. We write the present value of the cost as
∫∞
−− +=t
is
it
ii dspeqetpqC ρρ),,( . (13)
The optimal timing of adoption involves solving the following maximization problem
[ ),,()),(,(max tpqCttxvV iiiit− ]. (14)
Assuming that problem (14) is concave, we obtain the intrinsic valuation of the indifferent
firm vi,t* as the solution to
24
0),,()),(,( *, =− tpqC
dtdttxvV
dtd
iiiti , (15)
which simplifies to
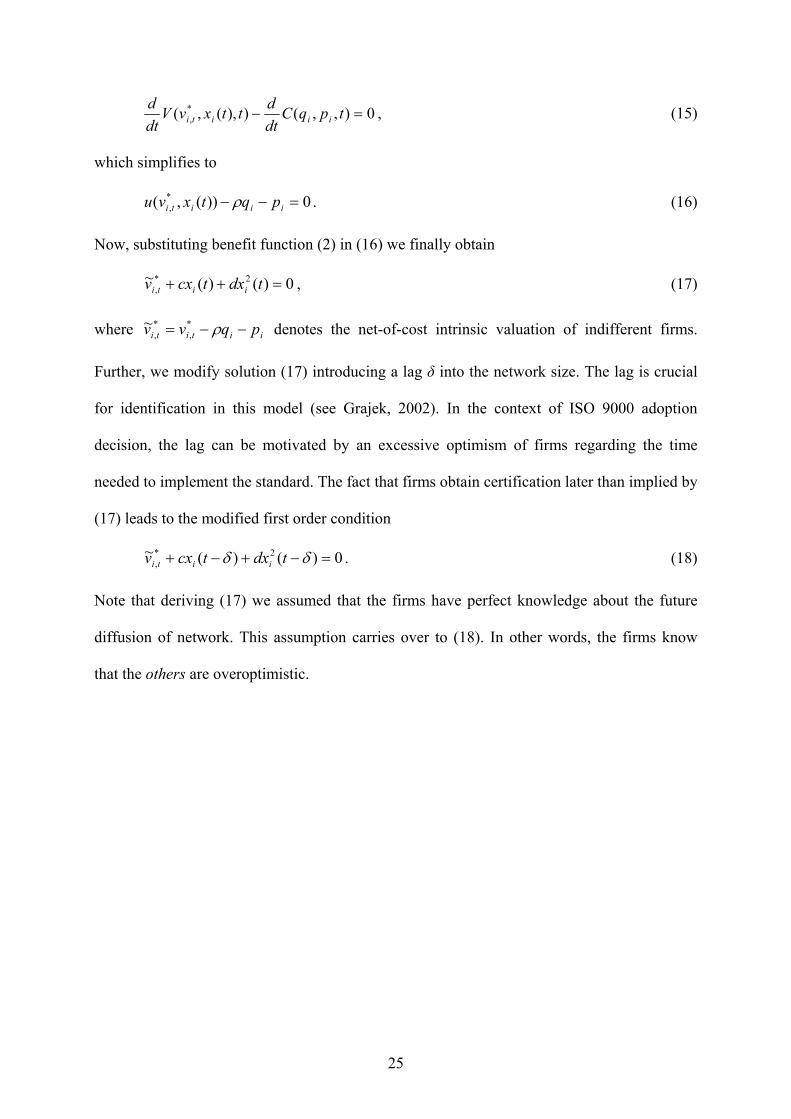
0))(,( *, =−− iiiti pqtxvu ρ . (16)
Now, substituting benefit function (2) in (16) we finally obtain
0)()(~ 2*, =++ tdxtcxv iiti , (17)
where denotes the net-of-cost intrinsic valuation of indifferent firms.
Further, we modify solution (17) introducing a lag
iititi pqvv −−= ρ*,
*,
~
δ into the network size. The lag is crucial
for identification in this model (see Grajek, 2002). In the context of ISO 9000 adoption
decision, the lag can be motivated by an excessive optimism of firms regarding the time
needed to implement the standard. The fact that firms obtain certification later than implied by
(17) leads to the modified first order condition
0)()(~ 2*, =−+−+ δδ tdxtcxv iiti . (18)
Note that deriving (17) we assumed that the firms have perfect knowledge about the future
diffusion of network. This assumption carries over to (18). In other words, the firms know
that the others are overoptimistic.
25

References
Anderson J.E, D. Marcouiller (2002), “Insecurity and the Pattern of Trade: An empirical
Investigation”, Review of Economics and Statistics, 84(2), 342-252.
Anderson J.E., E. van Wincoop (2003), “Gravity with Gravitas: A Solution to the Border
Puzzle”, American Economic Review, 93(1), 170-192.
Anderson S.W., Daly J.D., Johnson M.F. (1995), “The Value of Management Control
Systems: Evidence on the Market Reaction to ISO 9000 Quality Assurance Certificates”,
University of Michigan Business School, Working Paper #9501-16.
Anderson S.W., Daly J.D., Johnson M.F. (1999), “Why Firms seek ISO 9000 Certification:
Regulatory Compliance or Competitive Advantage?”, Production and Operations
Management, 8(1), 28-43.
Arellano M., S. Bond (1991), “Some Test of Specification for Panel Data: Monte Carlo
Evidence and an Application to Employment Equations”, Review of Economic Studies,
58(2), 277-297.
Bénézech D., Lambert G., Lanoux B., Lerch Ch., Loos-Baroin J. (2001), “Completion of
knowledge codification: an illustration through the ISO 9000 standards implementation
process”, Research Policy, 30(9), 1395-1407.
Blind K. (2001), “The Impact of Innovations and Standards on Trade of Measurment and
Testing Products: Empirical Results of Switzerland’s Bilateral Trade Flows with
Germany, France and the UK”, Information Economics and Policy, 13(4), 439-460.
Blind K. (2002), “Driving Forces for Standardization at Development Organizations”, Applied
Economics, 34(16), 1985-1998.
Casella A. (1996), “Free Trade and Evolving Standards”, in Bhagwati J., Hudec R., edts., Fair
Trade and Harmonization: Prerequisites for Free Trade?, vol.1, MIT Press, Cambridge,
119-156.
26

Deardorff A.V. (1998), “Determinants of Bilateral Trade: Does Gravity Work in a
Neoclassical World?” in J.A. Frankel, ed., The regionalization of the world economy,
University of Chicago Press, Chicago, 7-22.
Docking D.S., R.J. Dowen (1999), “Market Interpretation of ISO 9000 Registration”, Journal
of Financial Research, XXII(2), 147-160.
Frankel J.A, Stein E., Wei S.-J. (1997), Regional Trading Blocks in the World Economic
System, Institute for International Economics, Washington, DC.
Freund C.L., D. Weinhold (2004), “The effect of the Internet on international trade”, Journal
of International Economics, 62, 171-189.
Glick R., A.K. Rose (2002), “Does currency union affect trade? The time-series evidence”,
European Economic Review, 46, 1125-1151.
Grajek M. (2002), “Identification of Network Externalities in Markets for Non-Durables”,
Wissenschaftszentrum Berlin, Discussion Paper FS IV 02-32.
Hummels D., J. Levinsohn (1995), “Monopolistic Competition and International Trade:
Reconsidering the Evidence”, Quarterly Journal of Economics 110(3), 799-836.
ISO (2001), Quality Management Principles, ISO Central Secretariat, Geneve.
ISO (2002), The ISO Survey of ISO 9000 and ISO 14000 Certificates, Eleventh cycle – 2001,
ISO Central Secretariat, Geneve.
Moenius J. (2000), “Information versus Product Adaptation: The Role of Standards in Trade”,
Northwestern University, mimeo.
Rauch J.E. (1999), “Networks versus markets in international trade”, Journal of International
Economics, 48(1), 7-35.
Rauch J.E., V. Trindade (2002), “Ethnic Chinese Networks in International Trade”, Review of
Economics and Statistics, 84(1), 116-130.
Swann P., Temple P., Shurmer M. (1996), “Standards and Trade Performance: The UK
Experience”, Economic Journal, 106(438), 1297-1313.
27

Wooldridge J.M. (2002), Econometric Analysis of Cross Section and Panel Data, MIT Press,
Cambridge and London.
28
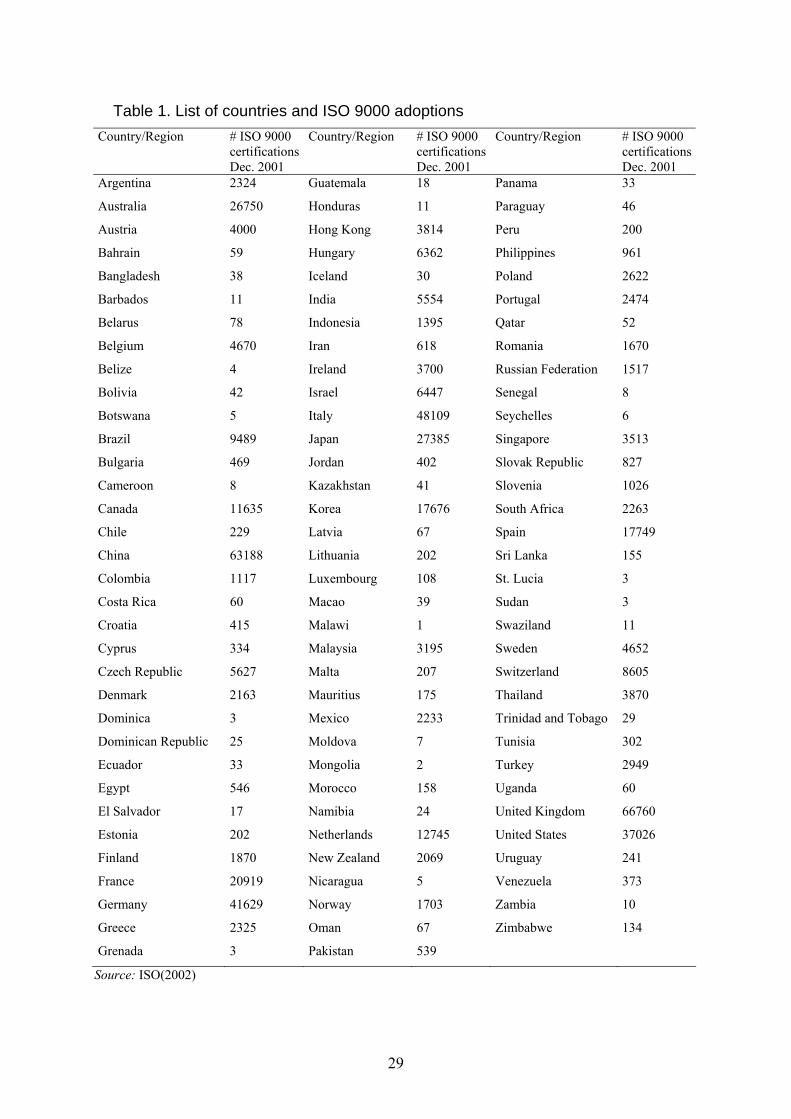
Table 1. List of countries and ISO 9000 adoptions Country/Region # ISO 9000
certifications Dec. 2001
Country/Region # ISO 9000 certifications Dec. 2001
Country/Region # ISO 9000 certifications Dec. 2001
Argentina 2324 Guatemala 18 Panama 33
Australia 26750 Honduras 11 Paraguay 46
Austria 4000 Hong Kong 3814 Peru 200
Bahrain 59 Hungary 6362 Philippines 961
Bangladesh 38 Iceland 30 Poland 2622
Barbados 11 India 5554 Portugal 2474
Belarus 78 Indonesia 1395 Qatar 52
Belgium 4670 Iran 618 Romania 1670
Belize 4 Ireland 3700 Russian Federation 1517
Bolivia 42 Israel 6447 Senegal 8
Botswana 5 Italy 48109 Seychelles 6
Brazil 9489 Japan 27385 Singapore 3513
Bulgaria 469 Jordan 402 Slovak Republic 827
Cameroon 8 Kazakhstan 41 Slovenia 1026
Canada 11635 Korea 17676 South Africa 2263
Chile 229 Latvia 67 Spain 17749
China 63188 Lithuania 202 Sri Lanka 155
Colombia 1117 Luxembourg 108 St. Lucia 3
Costa Rica 60 Macao 39 Sudan 3
Croatia 415 Malawi 1 Swaziland 11
Cyprus 334 Malaysia 3195 Sweden 4652
Czech Republic 5627 Malta 207 Switzerland 8605
Denmark 2163 Mauritius 175 Thailand 3870
Dominica 3 Mexico 2233 Trinidad and Tobago 29
Dominican Republic 25 Moldova 7 Tunisia 302
Ecuador 33 Mongolia 2 Turkey 2949
Egypt 546 Morocco 158 Uganda 60
El Salvador 17 Namibia 24 United Kingdom 66760
Estonia 202 Netherlands 12745 United States 37026
Finland 1870 New Zealand 2069 Uruguay 241
France 20919 Nicaragua 5 Venezuela 373
Germany 41629 Norway 1703 Zambia 10
Greece 2325 Oman 67 Zimbabwe 134
Grenada 3 Pakistan 539
Source: ISO(2002)
29
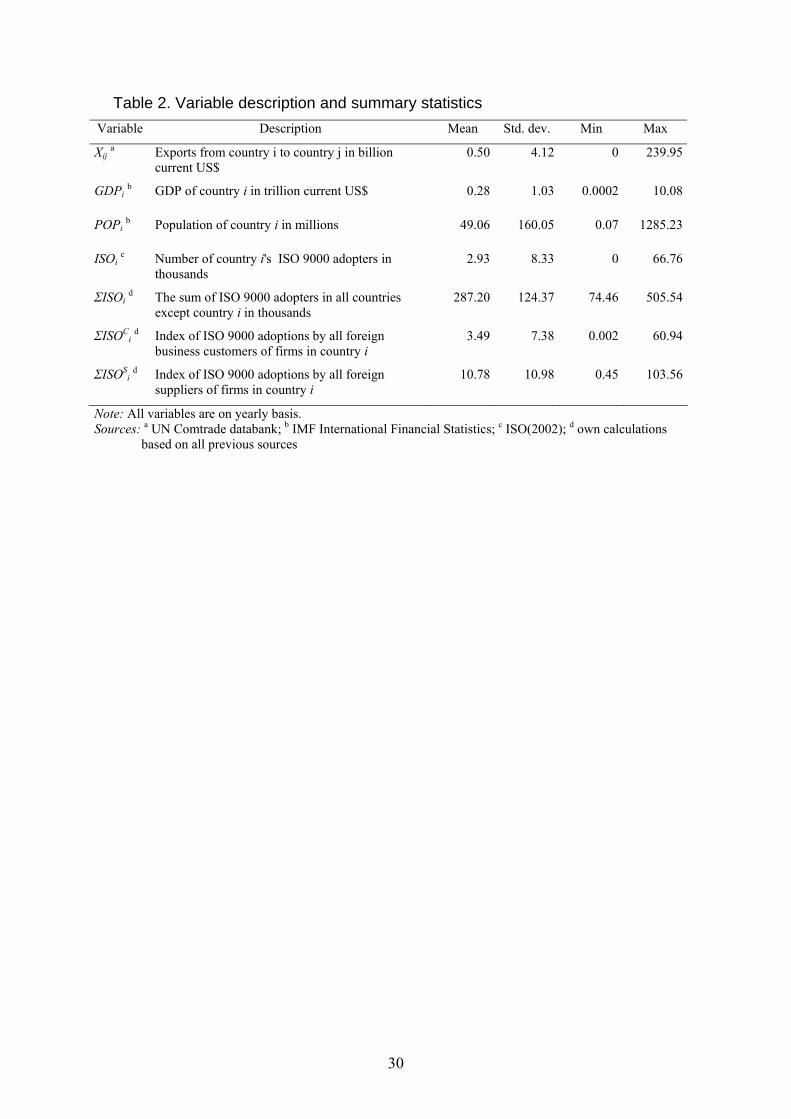
Table 2. Variable description and summary statistics Variable Description Mean Std. dev. Min Max
Xij a Exports from country i to country j in billion current US$
0.50 4.12 0 239.95
GDPi b GDP of country i in trillion current US$ 0.28 1.03 0.0002 10.08
POPi b Population of country i in millions 49.06 160.05 0.07 1285.23
ISOi c Number of country i's ISO 9000 adopters in thousands
2.93 8.33 0 66.76
ΣISOi d The sum of ISO 9000 adopters in all countries except country i in thousands
287.20 124.37 74.46 505.54
ΣISOCi d Index of ISO 9000 adoptions by all foreign
business customers of firms in country i 3.49 7.38 0.002 60.94
ΣISOSi d Index of ISO 9000 adoptions by all foreign
suppliers of firms in country i 10.78 10.98 0.45 103.56
Note: All variables are on yearly basis. Sources: a UN Comtrade databank; b IMF International Financial Statistics; c ISO(2002); d own calculations based on all previous sources
30
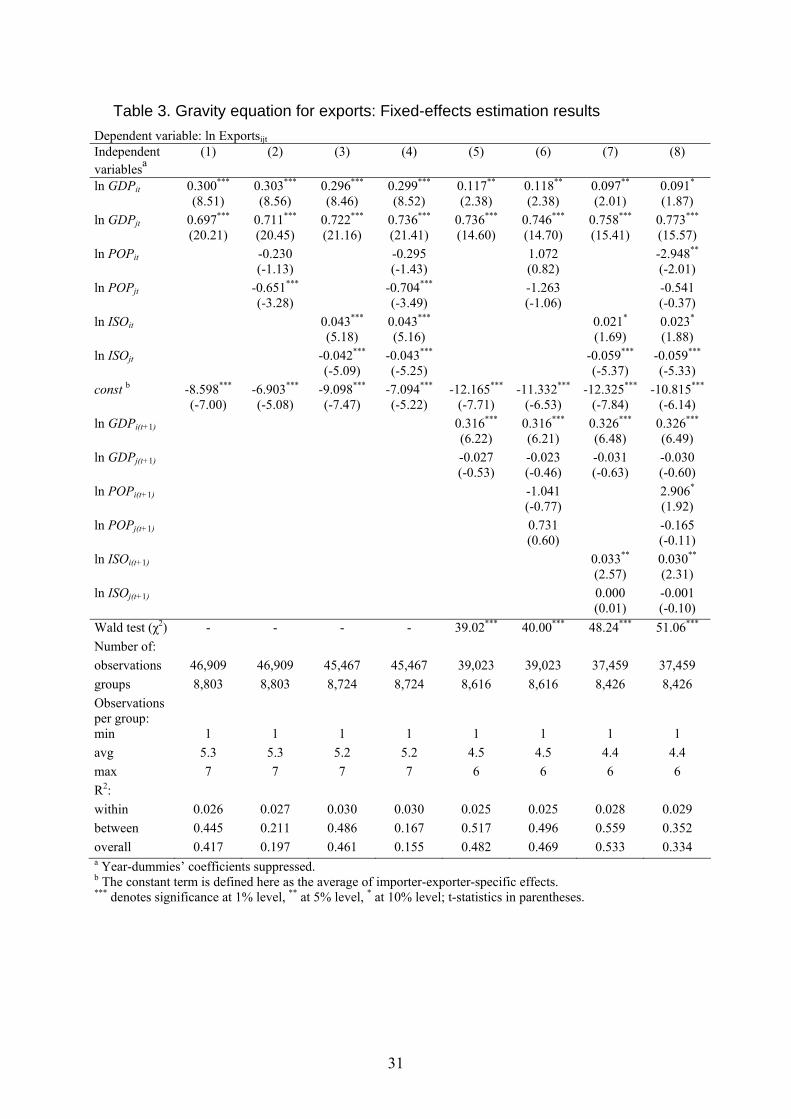
Table 3. Gravity equation for exports: Fixed-effects estimation results Dependent variable: ln Exportsijt Independent variablesa
(1) (2) (3) (4) (5) (6) (7) (8)
ln GDPit 0.300***
(8.51) 0.303***
(8.56) 0.296***
(8.46) 0.299***
(8.52) 0.117**
(2.38) 0.118**
(2.38) 0.097**
(2.01) 0.091*
(1.87) ln GDPjt 0.697***
(20.21) 0.711***
(20.45) 0.722***
(21.16) 0.736***
(21.41) 0.736***
(14.60) 0.746***
(14.70) 0.758***
(15.41) 0.773***
(15.57) ln POPit -0.230
(-1.13) -0.295
(-1.43) 1.072
(0.82) -2.948**
(-2.01) ln POPjt -0.651***
(-3.28) -0.704***
(-3.49) -1.263
(-1.06) -0.541
(-0.37) ln ISOit 0.043***
(5.18) 0.043***
(5.16) 0.021*
(1.69) 0.023*
(1.88) ln ISOjt -0.042***
(-5.09) -0.043***
(-5.25) -0.059***
(-5.37) -0.059***
(-5.33) const b -8.598***
(-7.00) -6.903***
(-5.08) -9.098***
(-7.47) -7.094***
(-5.22) -12.165***
(-7.71) -11.332***
(-6.53) -12.325***
(-7.84) -10.815***
(-6.14) ln GDPi(t+1) 0.316***
(6.22) 0.316***
(6.21) 0.326***
(6.48) 0.326***
(6.49) ln GDPj(t+1) -0.027
(-0.53) -0.023 (-0.46)
-0.031 (-0.63)
-0.030 (-0.60)
ln POPi(t+1) -1.041 (-0.77)
2.906*
(1.92) ln POPj(t+1) 0.731
(0.60) -0.165
(-0.11) ln ISOi(t+1) 0.033**
(2.57) 0.030**
(2.31) ln ISOj(t+1) 0.000
(0.01) -0.001 (-0.10)
Wald test (χ2) - - - - 39.02*** 40.00*** 48.24*** 51.06***
Number of: observations 46,909 46,909 45,467 45,467 39,023 39,023 37,459 37,459 groups 8,803 8,803 8,724 8,724 8,616 8,616 8,426 8,426 Observations per group:
min 1 1 1 1 1 1 1 1 avg 5.3 5.3 5.2 5.2 4.5 4.5 4.4 4.4 max 7 7 7 7 6 6 6 6 R2: within 0.026 0.027 0.030 0.030 0.025 0.025 0.028 0.029 between 0.445 0.211 0.486 0.167 0.517 0.496 0.559 0.352 overall 0.417 0.197 0.461 0.155 0.482 0.469 0.533 0.334 a Year-dummies’ coefficients suppressed. b The constant term is defined here as the average of importer-exporter-specific effects. *** denotes significance at 1% level, ** at 5% level, * at 10% level; t-statistics in parentheses.
31
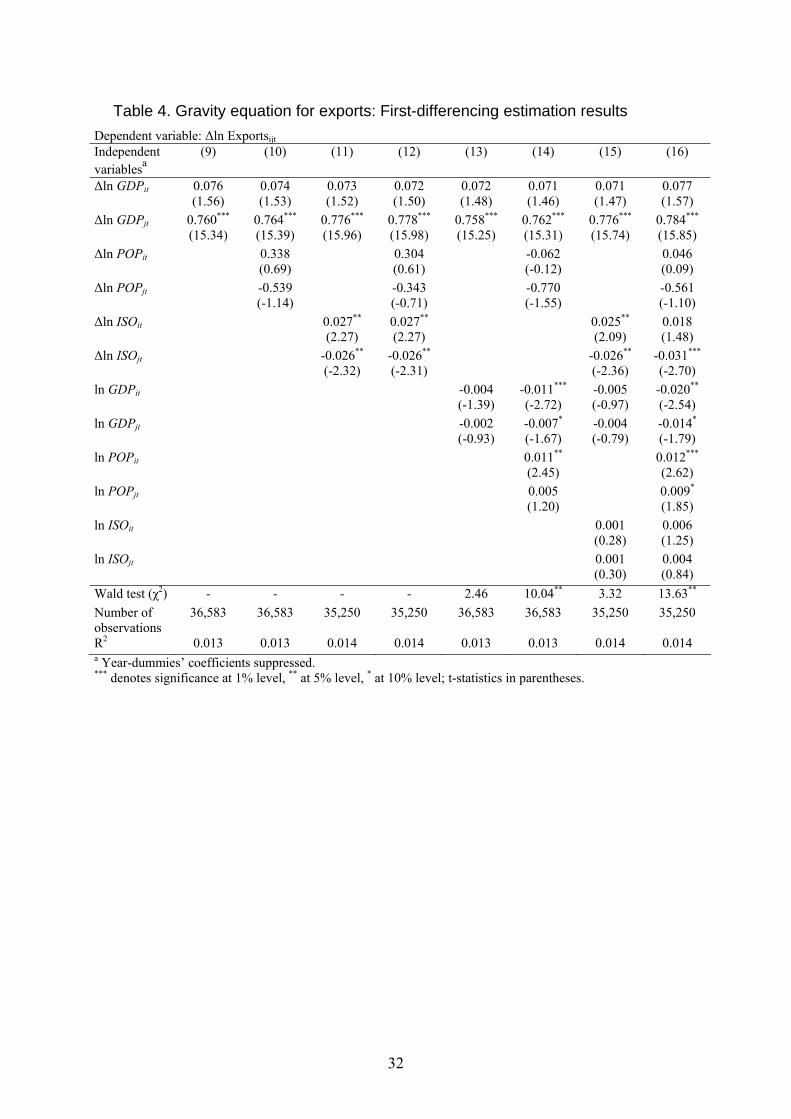
Table 4. Gravity equation for exports: First-differencing estimation results Dependent variable: ∆ln ExportsijtIndependent variablesa
(9) (10) (11) (12) (13) (14) (15) (16)
∆ln GDPit 0.076 (1.56)
0.074 (1.53)
0.073 (1.52)
0.072 (1.50)
0.072 (1.48)
0.071 (1.46)
0.071 (1.47)
0.077 (1.57)
∆ln GDPjt 0.760***
(15.34) 0.764***
(15.39) 0.776***
(15.96) 0.778***
(15.98) 0.758***
(15.25) 0.762***
(15.31) 0.776***
(15.74) 0.784***
(15.85) ∆ln POPit 0.338
(0.69) 0.304
(0.61) -0.062
(-0.12) 0.046
(0.09) ∆ln POPjt -0.539
(-1.14) -0.343
(-0.71) -0.770
(-1.55) -0.561
(-1.10) ∆ln ISOit 0.027**
(2.27) 0.027**
(2.27) 0.025**
(2.09) 0.018 (1.48)
∆ln ISOjt -0.026**
(-2.32) -0.026**
(-2.31) -0.026**
(-2.36) -0.031***
(-2.70) ln GDPit -0.004
(-1.39) -0.011***
(-2.72) -0.005 (-0.97)
-0.020**
(-2.54) ln GDPjt -0.002
(-0.93) -0.007*
(-1.67) -0.004 (-0.79)
-0.014*
(-1.79) ln POPit 0.011**
(2.45) 0.012***
(2.62) ln POPjt 0.005
(1.20) 0.009*
(1.85) ln ISOit 0.001
(0.28) 0.006 (1.25)
ln ISOjt 0.001 (0.30)
0.004 (0.84)
Wald test (χ2) - - - - 2.46 10.04** 3.32 13.63**
Number of observations
36,583 36,583 35,250 35,250 36,583 36,583 35,250 35,250
R2 0.013 0.013 0.014 0.014 0.013 0.013 0.014 0.014 a Year-dummies’ coefficients suppressed. *** denotes significance at 1% level, ** at 5% level, * at 10% level; t-statistics in parentheses.
32

Table 5. Gravity equation for exports (only OECD countries): First-differencing estimation results
Dependent variable: ∆ln ExportsijtIndependent variablesa
(17) (18) (19) (20) (21) (22) (23) (24)
∆ln GDPit 0.322***
(5.47) 0.316***
(5.33) 0.311***
(5.28) 0.306***
(5.16) 0.319***
(5.42) 0.259***
(4.34) 0.308***
(5.22) 0.261***
(4.36) ∆ln GDPjt 0.879***
(15.19) 0.883***
(15.10) 0.871***
(15.03) 0.874***
(14.95) 0.879***
(15.22) 0.874***
(14.88) 0.859***
(14.70) 0.863***
(14.60) ∆ln POPit 0.461
(0.73) 0.390
(0.62) 0.696
(1.10) 0.698
(1.08) ∆ln POPjt -0.272
(-0.42) -0.299
(-0.47) -0.319
(-0.50) -0.561
(-0.86) ∆ln ISOit 0.063***
(3.72) 0.063***
(3.70) 0.060***
(3.55) 0.018 (0.97)
∆ln ISOjt 0.036**
(2.07) 0.036**
(2.08) 0.036**
(2.09) 0.035*
(1.85) ln GDPit -0.011***
(-3.69) -0.044***
(-7.54) -0.011*
(-1.92) -0.044***
(-5.42) ln GDPjt -0.008**
(-2.56) -0.013**
(-2.23) -0.001 (-0.10)
-0.001 (-0.14)
ln POPit 0.041***
(6.58) 0.038***
(5.64) ln POPjt 0.007
(1.08) 0.001
(0.21) ln ISOit 0.000
(0.07) 0.002 (0.36)
ln ISOjt -0.008 (-1.46)
-0.009 (-1.60)
Wald test (χ2) - - - - 19.48*** 63.64*** 20.20*** 52.62***
Number of observations
4,559 4,559 4,559 4,559 4,559 4,559 4,559 4,559
R2 0.085 0.085 0.089 0.089 0.089 0.098 0.093 0.099 a Year-dummies’ coefficients suppressed. *** denotes significance at 1% level, ** at 5% level, * at 10% level; t-statistics in parentheses.
33
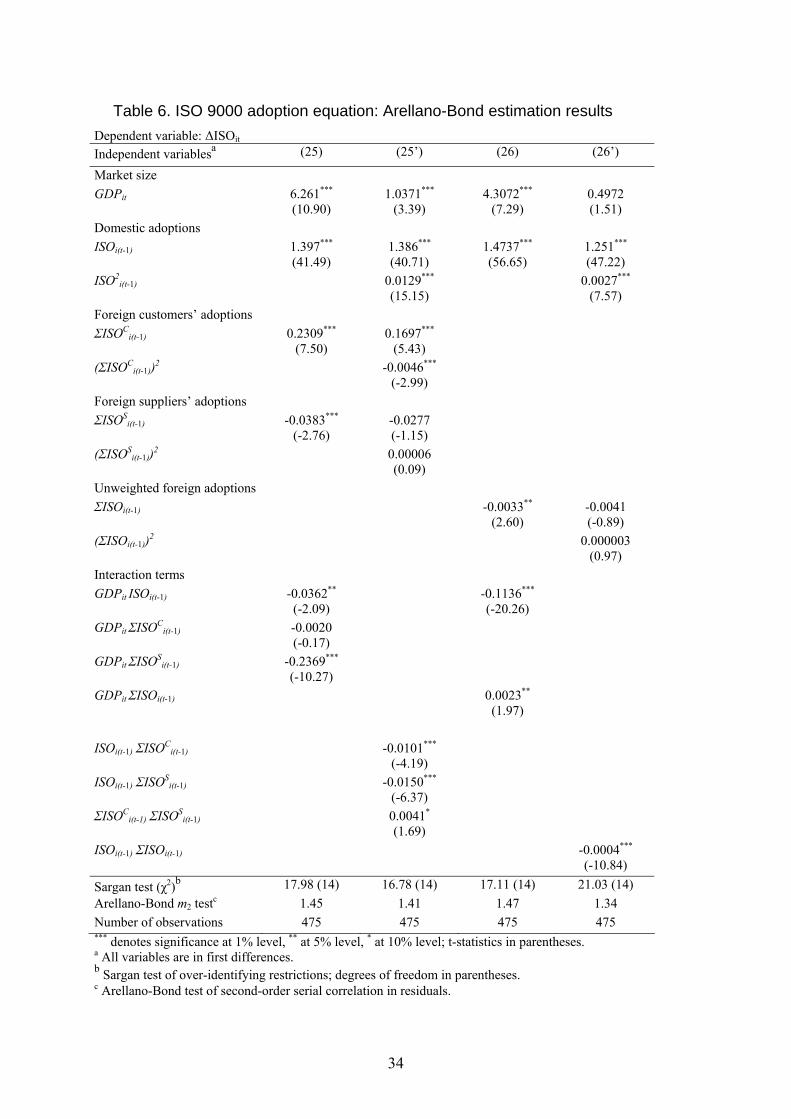
Table 6. ISO 9000 adoption equation: Arellano-Bond estimation results Dependent variable: ∆ISOit
Independent variablesa (25) (25’) (26) (26’)
Market size GDPit 6.261***
(10.90) 1.0371***
(3.39) 4.3072***
(7.29) 0.4972 (1.51)
Domestic adoptions ISOi(t-1) 1.397***
(41.49) 1.386***
(40.71) 1.4737***
(56.65) 1.251***
(47.22) ISO2
i(t-1) 0.0129***
(15.15) 0.0027***
(7.57) Foreign customers’ adoptions ΣISOC
i(t-1) 0.2309***
(7.50) 0.1697***
(5.43)
(ΣISOCi(t-1))2 -0.0046***
(-2.99)
Foreign suppliers’ adoptions ΣISOS
i(t-1) -0.0383***
(-2.76) -0.0277 (-1.15)
(ΣISOSi(t-1))2 0.00006
(0.09)
Unweighted foreign adoptions ΣISOi(t-1) -0.0033**
(2.60) -0.0041 (-0.89)
(ΣISOi(t-1))2 0.000003 (0.97)
Interaction terms GDPit ISOi(t-1) -0.0362**
(-2.09) -0.1136***
(-20.26)
GDPit ΣISOCi(t-1) -0.0020
(-0.17)
GDPit ΣISOSi(t-1) -0.2369***
(-10.27)
GDPit ΣISOi(t-1) 0.0023**
(1.97)
ISOi(t-1) ΣISOC
i(t-1) -0.0101***
(-4.19)
ISOi(t-1) ΣISOSi(t-1) -0.0150***
(-6.37)
ΣISOCi(t-1) ΣISOS
i(t-1) 0.0041*
(1.69)
ISOi(t-1) ΣISOi(t-1) -0.0004***
(-10.84) Sargan test (χ2)b 17.98 (14) 16.78 (14) 17.11 (14) 21.03 (14) Arellano-Bond m2 testc 1.45 1.41 1.47 1.34 Number of observations 475 475 475 475 *** denotes significance at 1% level, ** at 5% level, * at 10% level; t-statistics in parentheses. a All variables are in first differences. b Sargan test of over-identifying restrictions; degrees of freedom in parentheses. c Arellano-Bond test of second-order serial correlation in residuals.
34