Differentiating and Understanding the Mehlich 3, Bray, and Olsen ...
33
Differentiating and Understanding the Mehlich 3, Bray, and Olsen Soil Phosphorus Tests Dr. John E. Sawyer Soil Fertility Extension Specialist Iowa State University
Transcript of Differentiating and Understanding the Mehlich 3, Bray, and Olsen ...

Differentiating and Understanding the Mehlich 3, Bray, and Olsen Soil
Phosphorus Tests
Dr. John E. SawyerSoil Fertility Extension SpecialistIowa State University
The Four Components ofSoil Testing
Field SamplingExtraction and Chemical AnalysisInterpreting the Analytical ResultsMaking the Fertilizer Recommendation
Iowa State University

What are the Laboratory Components in a Soil Test Method
Soil preparation and samplingExtractantExtraction procedureChemical analysis method (measurement)(Result interpretation)
Iowa State University

Soil Test InterpretationIndex of Availability and Crop Response
Soil Test
Rel
ativ
e Yi
eld,
%
0
20
100
40
60
80
Likely Marginal Unlikely
EconomicOptimum
VL L Opt H VH
Iowa State University

Laboratory Method for Phosphorus
Grind soilMeasure 2 g soil into 50 ml flask (125 ml for Olsen)Add 20 ml extraction solution (40 ml for Olsen)Shake for 5 minutes (30 min for Olsen)Filter though filter paperDetermine P concentration by colorimetric procedure -- Ascorbic Acid Method
NCR 221 (Rev.)Iowa State University

Phosphorus Test Extractants
Bray 1-P Extractant (Bray & Kurtz, 1945)0.025 M HCl; 0.03 M NH4F
Mehlich-3 Extractant (Mehlich, 1984)0.2 N acetic acid; 0.25 N NH4NO3; 0.015 NH4F; 0.013 N HNO3; 0.001 M EDTA
Olsen Extractant (Olsen et al., 1954)0.5 M NaHCO3
Iowa State University

P Extraction withDilute Acid Fluoride (Bray)
Acid soilsFluoride ion promotes P desorption by decreasing aluminum activity by forming aluminum - fluoride complexes
Highly calcareous soilsAcid neutralized by calcium carbonate and CaF2 is formedThis is when Bray results in false low values
Iowa State University

P Extraction withDilute Acids and Fluoride (Mehlich)
Acid soilsSimilar to Bray
Highly calcareous soils? Variety and stronger acids than Bray? More buffered solution
Iowa State University

P Extraction withBuffered Alkaline Solution (Olsen)
NaHCO3 solution decreases concentration and activity of Ca2+ and Al3+ and increases P solubility
Iowa State University

Phosphorus Soil Test Reproducibility
Bray 1-P± 10% (dry soil basis)1 ppm detection limit
Mehlich 3± 10% (dry soil basis)1 ppm detection limit
Olsen± 12% (dry soil basis)2 ppm detection limit
NCR 221 (Rev.)Iowa State University

Ols
en P
(ppm
)
Bray-1 P (ppm)0 20 40 60 80
0
20
40
60
80
Ols
en P
(ppm
)
Mehlich-3 P (ppm)0 20 40 60 80
0
20
40
60
80
Meh
lich-
3 P
(ppm
)Bray-1 P (ppm)
0 20 40 60 800
20
40
60
80
SOILS OF pH 7.3 OR LOWER
SOILS OF pH 7.4 OR HIGHER
Ols
en P
(ppm
)
Bray-1 P (ppm)0 20 40 60 80
0
20
40
60
80
Ols
en P
(ppm
)Mehlich-3 P (ppm)
0 20 40 60 800
20
40
60
80
Meh
lich-
3 P
(ppm
)
Bray-1 P (ppm)0 20 40 60 80
0
20
40
60
80
Iowa State University

Iowa State University

Iowa State University

Iowa State University

Iowa State University

Meh
lich-
3 P
(ppm
)
Bray-1 P (ppm)0 20 40 600 25 50 75 100
0
25
50
75
100pH<6.5
Y=1.2+0.93X r=0.96
0 25 50 75 100
pH 6.5-7.3 pH 7.4-8.2
17 GRID-SAMPLED FIELDS, 2925 SAMPLES
Y=2.7+0.98X r=0.95
Iowa State University

Meh
lich-
3 P
(ppm
)
Olsen P (ppm)0 20 40 600 20 40 60
0
25
50
75
100pH< 6.5
r = 0.91
0 20 40 60
pH 6.5-7.3 pH 7.4-8.2
17 GRID-SAMPLED FIELDS, 2925 SAMPLES
r = 0.82r = 0.91
Iowa State University

Bray-1 P (ppm)0 10 20 30 40 50
0
25
50
75
100
0 25 50 75 1000
10
20
30
40
50
0 25 50 75 1000
25
50
75
100
544 SAMPLES OF pH 7.4 TO 8.2
Bray-1 P (ppm) Olsen P (ppm)
Ols
en P
(ppm
)
Meh
lich-
3 P
(ppm
)
Meh
lich-
3 P
(ppm
)
Iowa State University

Meh
lich-
3 K
(ppm
)
Ammonium acetate K (ppm)0 100 200 300 4000 100 200 300 400
0
100
200
300
400
pH<6.5Y = 15 + 0.82x r = 0.88
0 100 200 300 400
pH 6.5-7.3 pH 7.4-8.2
17 GRID-SAMPLED FIELDS, 2925 SAMPLES
Y = 14 + 0.83 r = 0.91
Y = 21 + 0.73 r = 0.84
Iowa State University

0 10 20 30 40 50 60 70 800
20
40
60
80
100
0 10 20 30 40 50 60 70 80
pH < 7.0pH 7.0-7.4pH > 7.4
MEHLICH-3
BRAY-1 P (ppm)
REL
ATI
VE C
OR
N Y
IELD
(%)
VL L O H
MEHLICH-3 P (ppm)
BRAY-1
pH < 7.0pH 7.0-7.4pH > 7.4
VH
CORRELATION WITH YIELD RESPONSE - ALL SOILS
VL L O H VH
Iowa State University

Current Iowa classes
0 5 10 15 20 25 30 35 40 450
20
40
60
80
100
pH < 7.0pH 7.0-7.4pH > 7.4
OLSEN
SOIL-TEST P (ppm)
REL
ATI
VE C
OR
N Y
IELD
(%)
VL L O H
Iowa State University

0 10 20 30 40 50 60 70 80 900
10
20
30
40
50
60
70
80
90pH < 7.4pH >= 7.4
M3 Colorimetric P (ppm)
Meh
lich-
3 IC
P (p
pm)
Iowa State University

0 20 40 60 80
1
2
3
4
0 20 40 60 800
5
10
15
20
25
30
35
ICP
- CO
LOR
IMET
RIC
P
ICP
/ CO
LOR
IMET
RIC
RA
TIO
M3 COLORIMETRIC P (ppm) M3-COLORIMETRIC P (ppm)
COMPARISON OF ICP AND COLORIMETRIC P DETERMINATION
Iowa State University

Soil Test InterpretationIndex of Availability and Crop Response
Rel
ativ
e Yi
eld,
%
0
20
100
40
60
80
Likely Marginal Unlikely
VL L Opt H VH
Bray: 0 6 11 16 21+Mehlich 3: 0 6 11 16 21+Olsen: 0 4 8 12 16+
For High Subsoil P Soils
Iowa State University

Soil Test InterpretationIndex of Availability and Crop Response
Rel
ativ
e Yi
eld,
%
0
20
100
40
60
80
Likely Marginal Unlikely
VL L Opt H VH
Bray: 0 9 16 21 31+Mehlich 3: 0 9 16 21 31+Olsen: 0 6 11 15 21+
For Low Subsoil P Soils
Iowa State University

Iowa State University Interpretations for P Soil Tests
Bray P1 and Mehlich-3: Phosphorus (P)WheatAlfalfa
All crops exceptwheat and alfalfa
Subsoil PRelative Level Low High
ppmVery Low (VL) 0 –15 0 – 8 0 – 5Low (L) 16 – 20 9 – 15 6 – 10Optimum (Opt) 21 – 25 16 – 20 11 – 15High (H) 26 – 30 21 – 30 16 – 20Very High (VH) 31 + 31 + 21 +Pm-1688 General Guide for Crop Nutrient Recommendations in Iowa
Iowa State University

Iowa State University Interpretations for P Soil Tests
Olsen: Phosphorus (P)WheatAlfalfa
All crops exceptwheat and alfalfa
Subsoil PRelative Level Low High
ppmVery Low (VL) 0 –10 0 – 5 0 – 3Low (L) 11 – 14 6 – 10 4 – 7Optimum (Opt) 15 – 17 11 – 14 8 – 11High (H) 18 – 20 15 – 20 12 – 15Very High (VH) 21 + 21 + 16 +Pm-1688 General Guide for Crop Nutrient Recommendations in Iowa
Iowa State University

Iowa State UniversitySubsoil P and K Determination
P -- Bray P-1 test30 to 42 inch depth
Low ≤ 8 ppmHigh ≤ 9 ppm
K -- Ammonium acetate test12 to 24 inch depth
Low ≤ 50 ppmHigh ≤ 51 ppm
Iowa State University
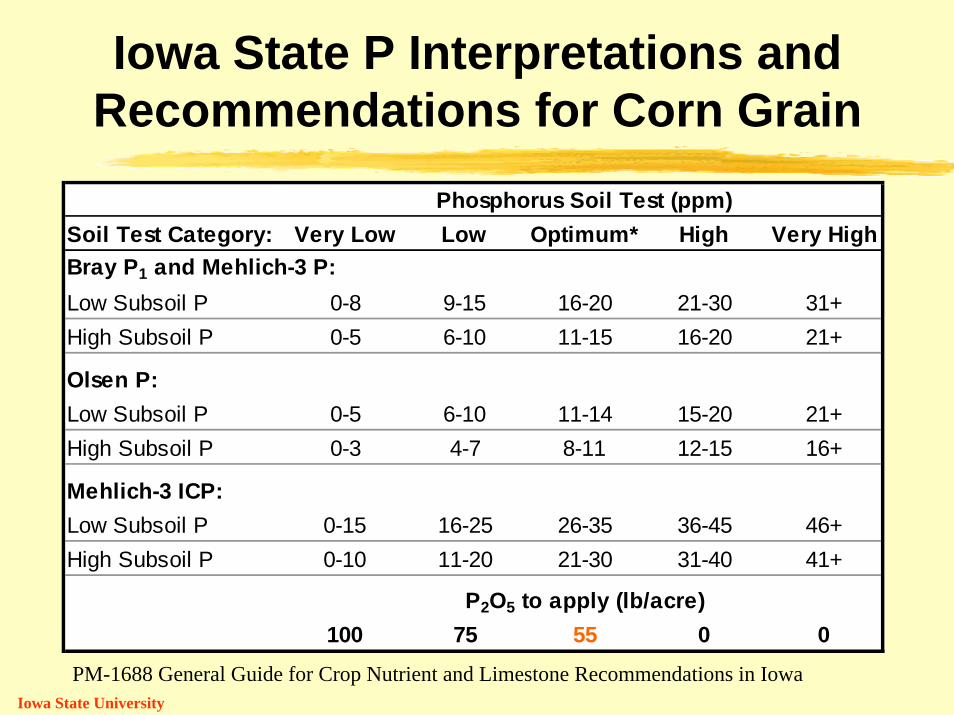
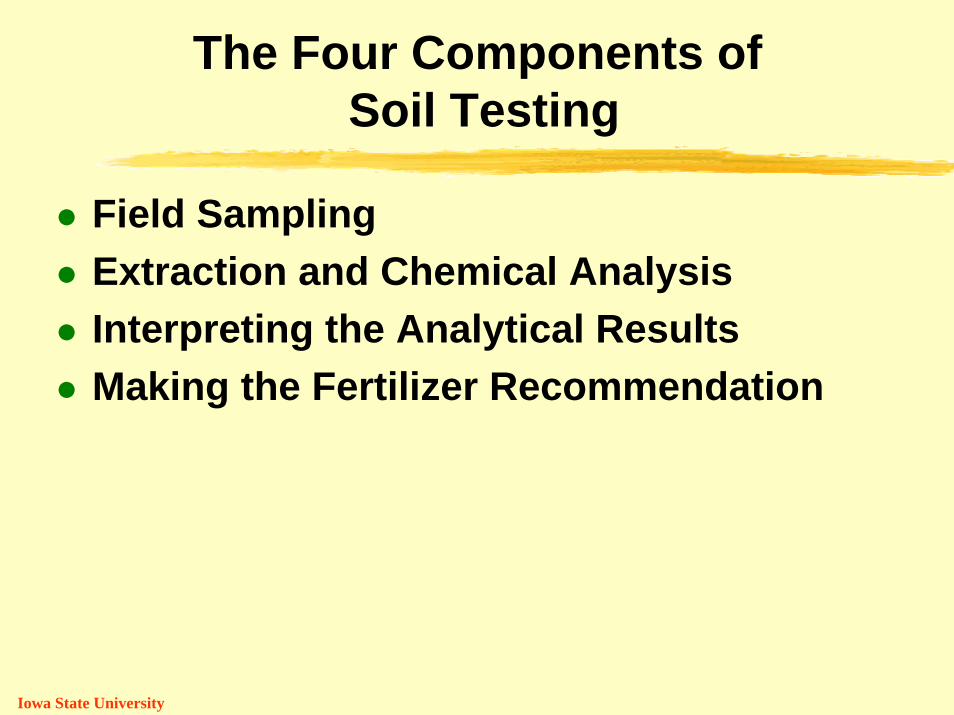
Iowa State P Interpretations and Recommendations for Corn Grain
Soil Test Category: Very Low Low Optimum* High Very High
Low Subsoil P 0-8 9-15 16-20 21-30 31+High Subsoil P 0-5 6-10 11-15 16-20 21+
Low Subsoil P 0-5 6-10 11-14 15-20 21+High Subsoil P 0-3 4-7 8-11 12-15 16+
Low Subsoil P 0-15 16-25 26-35 36-45 46+High Subsoil P 0-10 11-20 21-30 31-40 41+
100 75 55 0 0
Phosphorus Soil Test (ppm)
P2O5 to apply (lb/acre)
Bray P1 and Mehlich-3 P:
Olsen P:
Mehlich-3 ICP:
PM-1688 General Guide for Crop Nutrient and Limestone Recommendations in IowaIowa State University

Iowa State K Interpretations and Recommendations for Corn Grain
Soil Test Category: Very Low Low Optimum* High Very High
Low Subsoil K 0-90 91-130 131-170 171-200 201+High Subsoil K 0-70 71-110 111-150 151-180 181+
Fine Textured 130 90 45 0 0Sandy Textured 110 70 45 0 0
K2O to apply (lb/acre)
Potassium Soil Test (ppm)
Ammonium Acetate and Mehlich-3 Extractable K:
PM-1688 General Guide for Crop Nutrient and Limestone Recommendations in Iowa
Iowa State University

Current Iowa State University Suggestions on Use of P Soil Tests
Bray 1-PIf soil pH is less than 7.4
OlsenIf soil pH is above 7.4If soil pH is above 5.0
Mehlich 3Any soil
Iowa State University

Mehlich 3 Extraction of Ca, Mg, Kand Estimation of CEC
In acid and neutral soilsSimilar to ammonium acetate extraction
In calcareous soilsNot the same, especially for CaSame problem with CEC estimation as with ammonium acetate extraction
Iowa State University

Mehlich 3 Extraction of Zn or Other Elements
Not recommended by NCR 13 committeeNot recommended for use in Iowa
In Iowa -- still use DTPA extraction for Zn
Iowa State University