Differential Scanning Calorimetry of Epoxy Curing …...Title Differential Scanning Calorimetry of...
4
Introduction When testing materials using DSC, scientists often utilize multiple techniques to study their samples. When presented with a sample which exhibits multiple and/or overlapping thermal events, separation and identification of the transitions become important. One of the more obvious questions is whether the events are thermo-dynamic or kinetically controlled. A couple of examples of thermodynamic events would be the melting point and the glass transition of materials. An example of a kinetic transition would be a thermal event, which involves a change in the material such as cross-linking, and decomposition. It is not uncommon to find kinetic events close to (if not overlapping) thermodynamic transitions, such as enthalpic relaxation and the glass transition or melting and decomposition. The two most common techniques used to assist when studying these types of materials is HyperDSC ® or MT-DSC. HyperDSC can be utilized to suppress kinetic events, and MT-DSC to separate kinetic from thermodynamic events. A commonly studied sample by DSC is thermoset epoxy materials where the sample is heated to an elevated temperature, at which point it starts to cross-link.When studying these types of materials, multiple transitions are typically sought after: • Initial glass transition Tgi • Peak cure temperature • Cure onset temperature • Cure heat • Final glass transition Tgf • Specific heat of the final material • Percent cure Differential Scanning Calorimetry of Epoxy Curing Using DSC 6000 Thermal Analysis APPLICATION NOTE Author Justin Lang Ph.D. PerkinElmer, Inc. 710 Bridgeport Avenue Shelton, CT 06484
Transcript of Differential Scanning Calorimetry of Epoxy Curing …...Title Differential Scanning Calorimetry of...

Introduction
When testing materials using DSC, scientists often utilize multiple techniques to study their samples. When presented with a sample which exhibits multiple and/or overlapping thermal events, separation and identification of the transitions become important. One of the more obvious questions is whether the events are thermo-dynamic or
kinetically controlled. A couple of examples of thermodynamic events would be the melting point and the glass transition of materials. An example of a kinetic transition would be a thermal event, which involves a change in the material such as cross-linking, and decomposition. It is not uncommon to find kinetic events close to (if not overlapping) thermodynamic transitions, such as enthalpic relaxation and the glass transition or melting and decomposition. The two most common techniques used to assist when studying these types of materials is HyperDSC® or MT-DSC. HyperDSC can be utilized to suppress kinetic events, and MT-DSC to separate kinetic from thermodynamic events.
A commonly studied sample by DSC is thermoset epoxy materials where the sample is heated to an elevated temperature, at which point it starts to cross-link.When studying these types of materials, multiple transitions are typically sought after:
• InitialglasstransitionTgi
• Peakcuretemperature
• Cureonsettemperature
• Cureheat
• FinalglasstransitionTgf
• Specificheatofthefinalmaterial
• Percentcure
Differential Scanning Calorimetry of Epoxy Curing Using DSC 6000
Thermal Analysis
a p p l i c a t i o n n o t e
AuthorJustin Lang Ph.D. PerkinElmer, Inc.
710 Bridgeport Avenue Shelton, CT 06484
2
PerkinElmer’sDSC6000isanexcellenttoolformeasuringthese thermal events, not only in the typical testing methods, but also thanks to the expanded StepScan (MT-DSC) capability of the instrument.
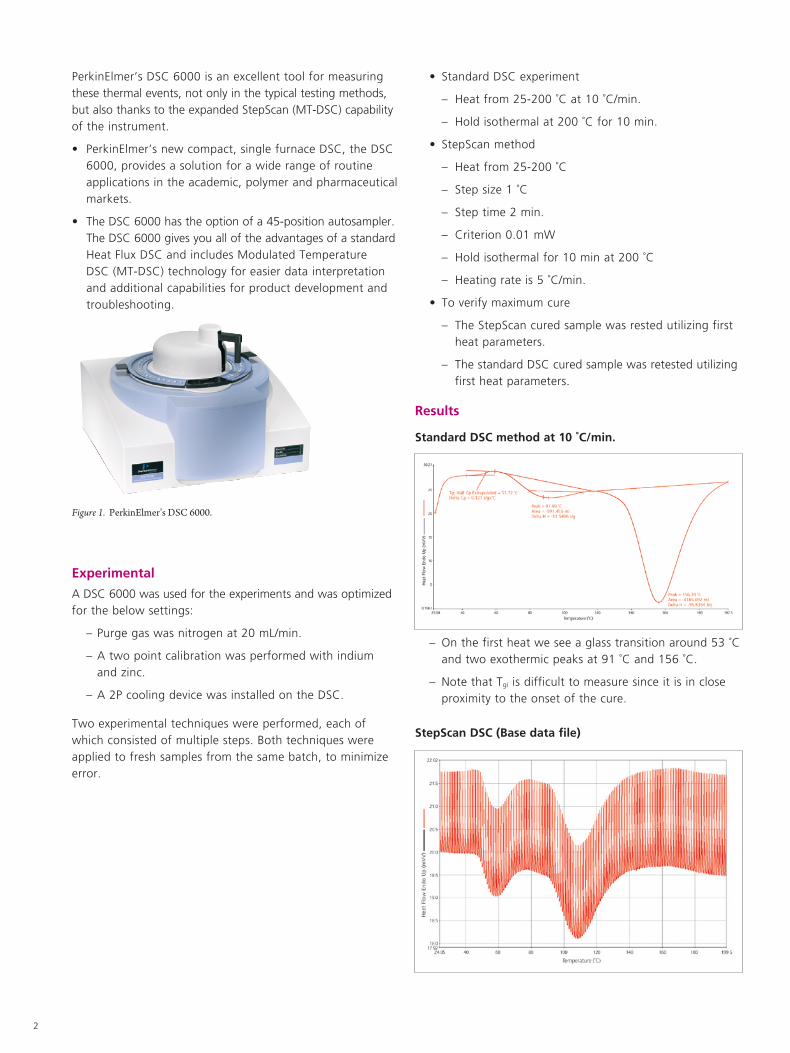
• PerkinElmer’snewcompact,singlefurnaceDSC,theDSC6000,providesasolutionforawiderangeofroutineapplications in the academic, polymer and pharmaceutical markets.
• TheDSC6000hastheoptionofa45-positionautosampler.TheDSC6000givesyoualloftheadvantagesofastandard HeatFluxDSCandincludesModulatedTemperatureDSC (MT-DSC) technology for easier data interpretation and additional capabilities for product development and troubleshooting.
Experimental
ADSC6000wasusedfortheexperimentsandwasoptimizedfor the below settings:
–Purgegaswasnitrogenat20mL/min.
– A two point calibration was performed with indium and zinc.
–A2PcoolingdevicewasinstalledontheDSC.
Two experimental techniques were performed, each of which consisted of multiple steps. Both techniques were applied to fresh samples from the same batch, to minimize error.
• StandardDSCexperiment
– Heatfrom25-200˚Cat10˚C/min.
– Holdisothermalat200˚Cfor10min.
• StepScanmethod
– Heatfrom25-200˚C
– Stepsize1˚C
– Step time 2 min.
– Criterion0.01mW
– Holdisothermalfor10minat200˚C
– Heatingrateis5˚C/min.
• Toverifymaximumcure
– The StepScan cured sample was rested utilizing first heat parameters.
– The standard DSC cured sample was retested utilizing first heat parameters.
Results
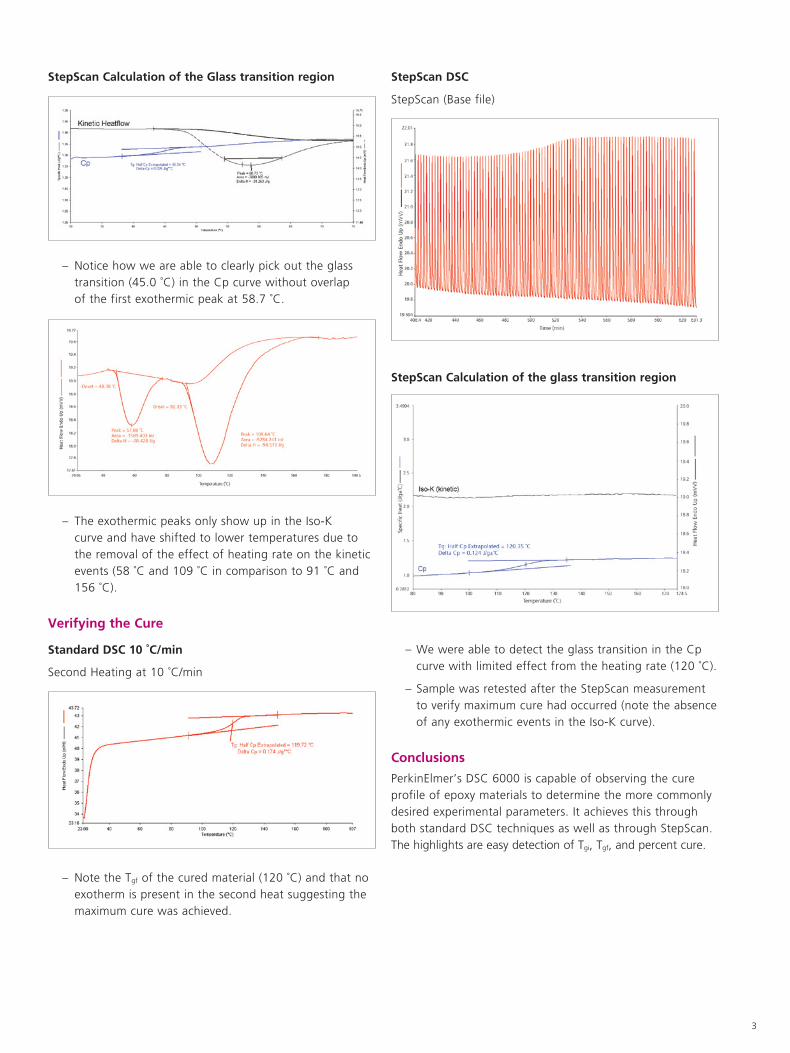
Standard DSC method at 10 ˚C/min.
– Onthefirstheatweseeaglasstransitionaround53˚C andtwoexothermicpeaksat91˚Cand156˚C.
– Note that Tgi is difficult to measure since it is in close proximity to the onset of the cure.
StepScan DSC (Base data file)
Figure 1. PerkinElmer’s DSC 6000.
3
StepScan Calculation of the Glass transition region
– Notice how we are able to clearly pick out the glass transition(45.0˚C)intheCpcurvewithoutoverlap ofthefirstexothermicpeakat58.7˚C.
– The exothermic peaks only show up in the Iso-K curve and have shifted to lower temperatures due to the removal of the effect of heating rate on the kinetic events(58˚Cand109˚Cincomparisonto91˚Cand 156˚C).
Verifying the Cure
Standard DSC 10 ˚C/min
SecondHeatingat10˚C/min
– Note the Tgfofthecuredmaterial(120˚C)andthatno exotherm is present in the second heat suggesting the maximum cure was achieved.
StepScan DSC
StepScan (Base file)
StepScan Calculation of the glass transition region
– We were able to detect the glass transition in the Cp curvewithlimitedeffectfromtheheatingrate(120˚C).
– Sample was retested after the StepScan measurement to verify maximum cure had occurred (note the absence of any exothermic events in the Iso-K curve).
Conclusions
PerkinElmer’sDSC6000iscapableofobservingthecureprofile of epoxy materials to determine the more commonly desired experimental parameters. It achieves this through both standard DSC techniques as well as through StepScan. The highlights are easy detection of Tgi, Tgf, and percent cure.

For a complete listing of our global offices, visit www.perkinelmer.com/ContactUs
Copyright ©2010, PerkinElmer, Inc. All rights reserved. PerkinElmer® is a registered trademark of PerkinElmer, Inc. All other trademarks are the property of their respective owners. 009285_01
PerkinElmer, Inc. 940 Winter Street Waltham, MA 02451 USA P: (800) 762-4000 or (+1) 203-925-4602www.perkinelmer.com