Differential Loran-C ENC2004 corrected by scl
15
Differential Loran-C Kevin M. Carroll and Anthony Hawes, U. S. Coast Guard Loran Support Unit Benjamin Peterson and Kenneth Dykstra, Peterson Integrated Geopositioning, LLC Peter Swaszek, University of Rhode Island Sherman Lo, Stanford University Abstract The U. S Coast Guard and Federal Aviation Administration are cooperating in a major effort to define and analyze the performance of a new Enhanced Loran system as a backup for GPS provided services. Each transportation mode has defined requirements that the new Enhanced Loran must meet to be acceptable in the radionavigation mix of systems. The USCG developed a set of requirements for Loran maritime navigation in terms of availability, accuracy, integrity and continuity for the Harbor Entrance and Approach (HEA) region. The USCG chaired Loran Accuracy Performance Panel (LORAPP) is spearheading the research and a proof-of- concept project into Loran meeting maritime navigation needs. This paper examines Loran’s ability to meet HEA requirements. The accuracy component is considered the greatest challenge for Enhanced Loran to overcome in the maritime environment. The paper explores how the Loran system can correct for signal propagation variations by broadcasting differential corrections similar to the DGPS system. The differential corrected Loran, or dLoran, uses a 32- state Pulse Position Modulation scheme on one additional pulse in the Loran group. The data pulse is used to broadcast a propagation correction to a nominal Additional Secondary Factor (ASF) value derived from multiple land-base monitor sites. A detailed analysis of the communication scheme is given as it relates to the data channel using the 100kHz sine wave Loran signal. The ASF correction value is composed of a spatial and temporal component. We examine the process to survey desired waterways creating a spatial grid for each transmitter station in view. The waterway grid is correlated to a land-base monitor station that measures the temporal component. In broadcasting the temporal variations, the shipboard receiver then moves the entire grid up/down to match the temporal correction. We examine the efforts to transmit the PPM scheme on the U. S. Coast Guard’s solid-state transmitter. The initial performance results of tests of the complete ‘on-air’ system are presented. Introduction The Loran Integrity Performance Panel (LORIPP) and Loran Accuracy Performance Panel (LORAPP) both determined that the Enhanced Loran system requires a minimal form of augmentation to meet integrity and accuracy requirements. The data rate for the augmentation is considerable less the data rate of the Interpulse Frequency Modulation (IFM) demonstrated in Alaska in the summer of 2001 [1]. The many discussions on the best way to transmit the augmentation data to the user led to the development of a new Loran 2003 Data Channel which uses an additional modulated (9 th ) pulse to the standard group of eight pulses. The Loran evaluation team felt best to keep the augmentation within the Loran signal and keeps system complexity relatively low for each group of users. It must be noted that any of the features for augmentation are not finalized or approved by the U. S. government. Aviation receivers would receive notification of the transmit station identification and time of transmission. This data allows receivers to solve signal source identification and cross chain lane ambiguities necessary for all-in-view, master independent navigation. Only the strongest signal needs to be demodulated to identify all received stations. Timing and maritime receivers do require the augmentation data in the form of Additional Secondary Factor (ASF) corrections to correct for temporal changes in propagation. The corrections are offsets values from a published nominal list. The offset vice absolute ASF corrections conserves bits while maintaining the dynamic range seen in past studies. The offset values are measured at a monitoring base station. Receivers would have a spatial grid in memory based on surveyed ASF data correlated to a monitoring base station. The ASF correction system is still in a proof-of-concept stage and will be covered in future papers with respect its validity and monitor density. Loran 2003 Modulation Scheme The modulation scheme is a 32-state Pulse Position Modulation (PPM) resulting in 5 bits/pulse. The scheme adds one additional positive phased pulse a minimum of 1000 microseconds after standard group of eight pulses per Group Repetition Interval (GRI). This means master stations would have a total of ten pulses per GRI and secondary stations would have nine pulses. in legacy
Transcript of Differential Loran-C ENC2004 corrected by scl
Differential Loran-C
Kevin M. Carroll and Anthony Hawes, U. S. Coast Guard Loran Support Unit Benjamin Peterson and Kenneth Dykstra, Peterson Integrated Geopositioning, LLC
Peter Swaszek, University of Rhode Island Sherman Lo, Stanford University
Abstract The U. S Coast Guard and Federal Aviation Administration are cooperating in a major effort to define and analyze the performance of a new Enhanced Loran system as a backup for GPS provided services. Each transportation mode has defined requirements that the new Enhanced Loran must meet to be acceptable in the radionavigation mix of systems. The USCG developed a set of requirements for Loran maritime navigation in terms of availability, accuracy, integrity and continuity for the Harbor Entrance and Approach (HEA) region. The USCG chaired Loran Accuracy Performance Panel (LORAPP) is spearheading the research and a proof-of-concept project into Loran meeting maritime navigation needs. This paper examines Loran’s ability to meet HEA requirements. The accuracy component is considered the greatest challenge for Enhanced Loran to overcome in the maritime environment. The paper explores how the Loran system can correct for signal propagation variations by broadcasting differential corrections similar to the DGPS system. The differential corrected Loran, or dLoran, uses a 32-state Pulse Position Modulation scheme on one additional pulse in the Loran group. The data pulse is used to broadcast a propagation correction to a nominal Additional Secondary Factor (ASF) value derived from multiple land-base monitor sites. A detailed analysis of the communication scheme is given as it relates to the data channel using the 100kHz sine wave Loran signal. The ASF correction value is composed of a spatial and temporal component. We examine the process to survey desired waterways creating a spatial grid for each transmitter station in view. The waterway grid is correlated to a land-base monitor station that measures the temporal component. In broadcasting the temporal variations, the shipboard receiver then moves the entire grid up/down to match the temporal correction. We examine the efforts to transmit the PPM scheme on the U. S. Coast Guard’s solid-state transmitter. The initial performance results of tests of the complete ‘on-air’ system are presented. Introduction The Loran Integrity Performance Panel (LORIPP) and Loran Accuracy Performance Panel (LORAPP) both
determined that the Enhanced Loran system requires a minimal form of augmentation to meet integrity and accuracy requirements. The data rate for the augmentation is considerable less the data rate of the Interpulse Frequency Modulation (IFM) demonstrated in Alaska in the summer of 2001 [1]. The many discussions on the best way to transmit the augmentation data to the user led to the development of a new Loran 2003 Data Channel which uses an additional modulated (9th) pulse to the standard group of eight pulses. The Loran evaluation team felt best to keep the augmentation within the Loran signal and keeps system complexity relatively low for each group of users. It must be noted that any of the features for augmentation are not finalized or approved by the U. S. government. Aviation receivers would receive notification of the transmit station identification and time of transmission. This data allows receivers to solve signal source identification and cross chain lane ambiguities necessary for all-in-view, master independent navigation. Only the strongest signal needs to be demodulated to identify all received stations. Timing and maritime receivers do require the augmentation data in the form of Additional Secondary Factor (ASF) corrections to correct for temporal changes in propagation. The corrections are offsets values from a published nominal list. The offset vice absolute ASF corrections conserves bits while maintaining the dynamic range seen in past studies. The offset values are measured at a monitoring base station. Receivers would have a spatial grid in memory based on surveyed ASF data correlated to a monitoring base station. The ASF correction system is still in a proof-of-concept stage and will be covered in future papers with respect its validity and monitor density. Loran 2003 Modulation Scheme The modulation scheme is a 32-state Pulse Position Modulation (PPM) resulting in 5 bits/pulse. The scheme adds one additional positive phased pulse a minimum of 1000 microseconds after standard group of eight pulses per Group Repetition Interval (GRI). This means master stations would have a total of ten pulses per GRI and secondary stations would have nine pulses. in legacy
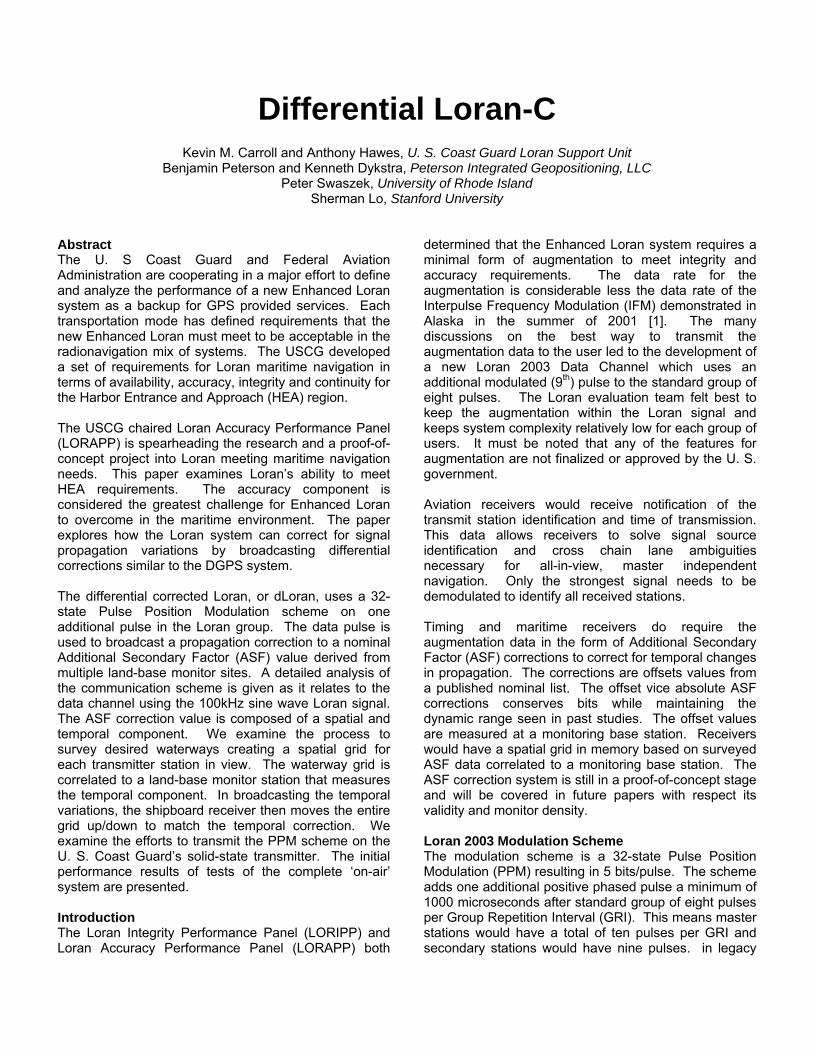
receivers, the additional pulse would average to zero, and the overall increase in cross-rate interference would be 0.5 dB. The shift to PPM vice IFM adds many advantages to transmitter and receiver. The transmitter does not required extensive changes to the output network. The complexity of the control software is significantly reduced and can be done without major modifications to the current Timing and Frequency Equipment and Transmitter Control Console. The receiver’s complexity is greatly reduced without the data wipe-off and other functions required by IFM. We needed more than minor phase changes to achieve the 32-states and five bits/pulse. The phase changes give three bits/pulse. In order to squeeze out the remaining two bits, the envelope is changed in position. The modulation scheme moves the envelope three times creating a 4-state envelope position and with 8-state phase changes gives the full 32-state PPM. Figure 1 illustrates the time domain view of the 32-state
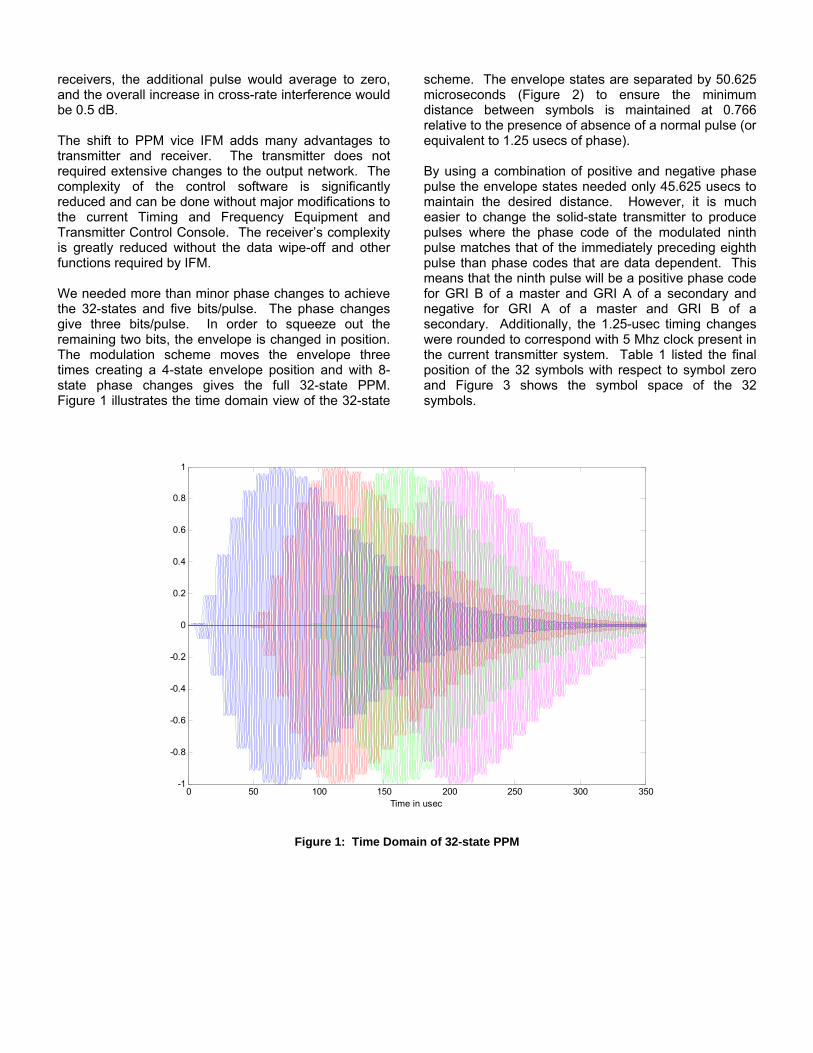
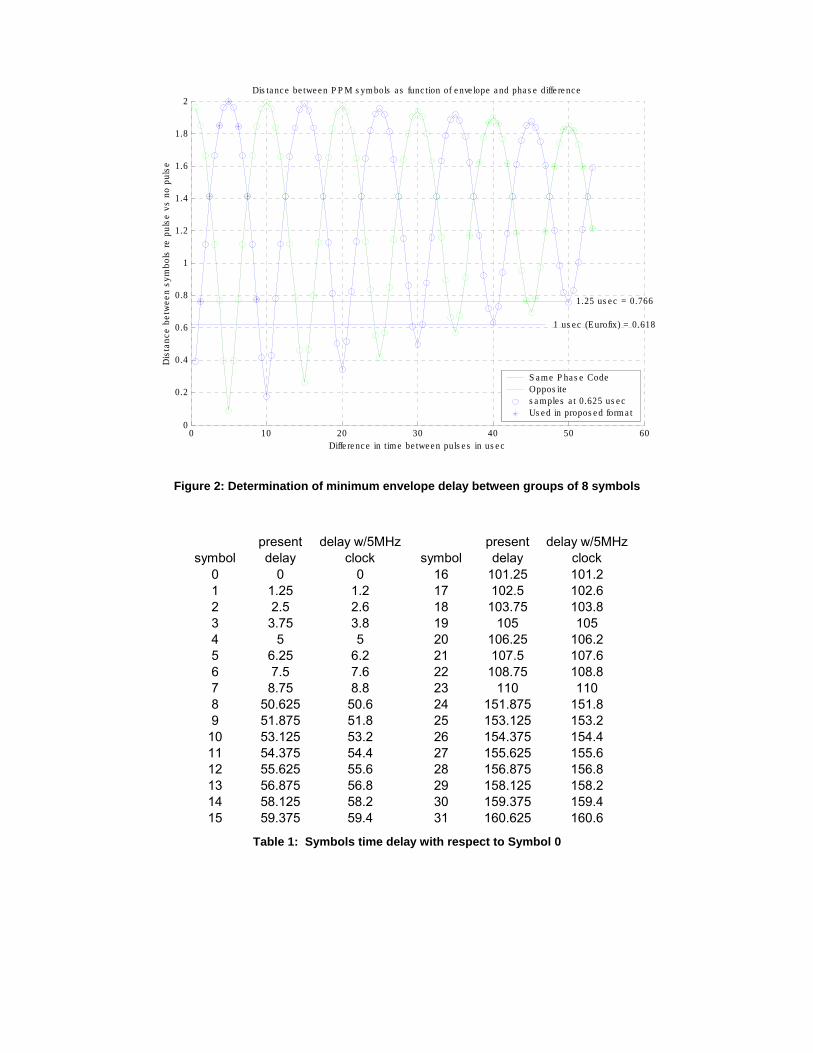
scheme. The envelope states are separated by 50.625 microseconds (Figure 2) to ensure the minimum distance between symbols is maintained at 0.766 relative to the presence of absence of a normal pulse (or equivalent to 1.25 usecs of phase). By using a combination of positive and negative phase pulse the envelope states needed only 45.625 usecs to maintain the desired distance. However, it is much easier to change the solid-state transmitter to produce pulses where the phase code of the modulated ninth pulse matches that of the immediately preceding eighth pulse than phase codes that are data dependent. This means that the ninth pulse will be a positive phase code for GRI B of a master and GRI A of a secondary and negative for GRI A of a master and GRI B of a secondary. Additionally, the 1.25-usec timing changes were rounded to correspond with 5 Mhz clock present in the current transmitter system. Table 1 listed the final position of the 32 symbols with respect to symbol zero and Figure 3 shows the symbol space of the 32 symbols.
Figure 1: Time Domain of 32-state PPM
0 50 100 150 200 250 300 350-1
-0.8
-0.6
-0.4
-0.2
0
0.2
0.4
0.6
0.8
1
Time in usec
0 10 20 30 40 50 600
0.2
0.4
0.6
0.8
1
1.2
1.4
1.6
1.8
2
Diffe re nc e in tim e be twe e n puls e s in us e c
Dis
tanc
e be
twee
n sy
mbo
ls re
pul
se v
s no
pul
se
1 .25 us e c = 0.766
1 us e c (E urofix) = 0.618
Dis ta nc e be twe e n P P M s ym bols a s func tion of e nve lope a nd pha s e diffe re nc e
S a m e P ha s e CodeOppos ites a mple s a t 0.625 us e cUs e d in propos e d form a t
Figure 2: Determination of minimum envelope delay between groups of 8 symbols
symbolpresent delay
delay w/5MHz clock symbol
present delay
delay w/5MHz clock
0 0 0 16 101.25 101.21 1.25 1.2 17 102.5 102.62 2.5 2.6 18 103.75 103.83 3.75 3.8 19 105 1054 5 5 20 106.25 106.25 6.25 6.2 21 107.5 107.66 7.5 7.6 22 108.75 108.87 8.75 8.8 23 110 1108 50.625 50.6 24 151.875 151.89 51.875 51.8 25 153.125 153.2
10 53.125 53.2 26 154.375 154.411 54.375 54.4 27 155.625 155.612 55.625 55.6 28 156.875 156.813 56.875 56.8 29 158.125 158.214 58.125 58.2 30 159.375 159.415 59.375 59.4 31 160.625 160.6
Table 1: Symbols time delay with respect to Symbol 0
0
1
2
3
4
5
6
7
8
910
11
12
13 14
15
16
17
18
19
20
21
22
23
2425
26
27
28 29
30
31
0
45
90
135
180
225
270
315
0 50100 150
Figure 3: Symbol Space view of 32-state PPM
Augmentation Message For the purpose of proof-of-concept testing, the message length is limited to a 24 GRI format. This gives a maximum message length of 2.38 seconds based on the current United States Loran rates. The panels’ desired to limit the message length minimizes the receiver’s time to alarm for integrity purposes. Time to first fix will vary among the different users groups. The maritime differential (ASF corrections) receiver requires corrections for multiple stations. Assuming Time-of-transmission is operational, a receiver needs one correction per Loran station vice 2 corrections in System Area Monitoring control. Each monitor would have six corrections that would be divided between 3 messages per site (2 corrections per message). Assuming each Loran station transmits differential data from a maximum of 15 to 25 base stations (45 to 75 ASF correction messages), a dual rated station would have update/time to first fix of one to one and one half minutes. The time doubles for single rated stations (Lorsta’s Jupiter and Middletown are the only signal rated stations with significant potential for maritime base stations). Intertwined with the ASF corrections would be aviation integrity message and timing messages. Integrity warning or ASF monitoring station “don’t use” message would be transmitted as needed and have priority over all over messages.
The actual format and bit assignment has not been completed for every message type. We developed a proposed ASF correction and absolute time message format for testing (Table 2).
Time # bits Resolution RangeMSG type 4 16
Time 31 1 msg epoch 97-163 yrsLeap Secs 6 64
Next leap Sec 1sta ID 3 8Total 45
dLoran # bits Resolution RangeMSG type 4 16
Time Base Quality 3Ref ID 10 1024Sig ID 3 2 16
Corr # 1 10 2ns +/- 1.022 usecCorr # 2 10 2ns +/- 1.022 usec
Age/Quality 5Total 45
Table 2: Message formats
An aviation integrity warning for the presence of early skywave is being considered by the LORIPP. It would warn the user not to use a signal if geomagnetic latitude of midpoint of propagation exceeds a specified number of degrees and either
signal strength drops lower than a dB threshold or transmission path is greater than some distance [2]. Reed-Solomon Codes In the LORAN 2003 Data Channel application, coding plays three roles: (1) to provide error correction capability for the transmission recognizing that the channel includes noise, cross rate interference, and blanking, and (2) to provide integrity information that the decoded data is valid with high probability. In addition it is necessary to synchronize on the message epoch. While it is possible to provide these features in different ways (e.g. forward error correction for the channel interference, CRC codes for integrity, and separate synchronization sequences or symbols), the LORAN 2003 Data Channel system employs a single Reed-Solomon code to accomplish all three. Below these issues are described in some detail. (While the discussion below focuses on using an errors-only RS decoder, we note that all of the development and results directly extends to errors-and-erasures decoding.) We begin with a brief review of Reed-Solomon codes. Reed-Solomon (RS) coding is a well-known forward error correction coding method that efficiently protects data from unknown and potentially bursty channel disturbances (see e.g. [3] for an in-depth coverage of these codes). RS codes are non-binary codes; the number of symbols in the code alphabet, q, is either a prime or a power of a prime. In most applications q is a power of 2, q = 2b, so that each symbol corresponds to b bits. For the LORAN 2003 system with 9th pulse modulation b = 5, so that q equals 25 = 32 and each codeword symbol takes on one of 32 values (typically written as 0, 1, 2, … 31). RS codes consist of n = q – 1 such q-ary symbols in sequence of which k are data symbols and n – k are parity check symbols; the resulting code is called an (n,k) code. RS codes can be shortened by setting some of the information symbols to zero and not transmitting them; this effectively reduces both n and k. For example, in the LORAN 2003 system, the original RS code has parameters n = 31 and k = 16; setting 7 of the symbols to zero results in a (24,9) code. The encoding and decoding processes for RS codes are usually described using polynomials on finite fields; the details of the method are beyond the scope of this presentation. However, we can provide an example. In LORAN 2003 the 45-bit message string (commas added for visual convenience) 01100,01001,01001,10101,10111,01101,10010,00110,00100 becomes the symbol sequence m = [12,9,9,21,23,13,18,6,4]. Appending seven zeroes to
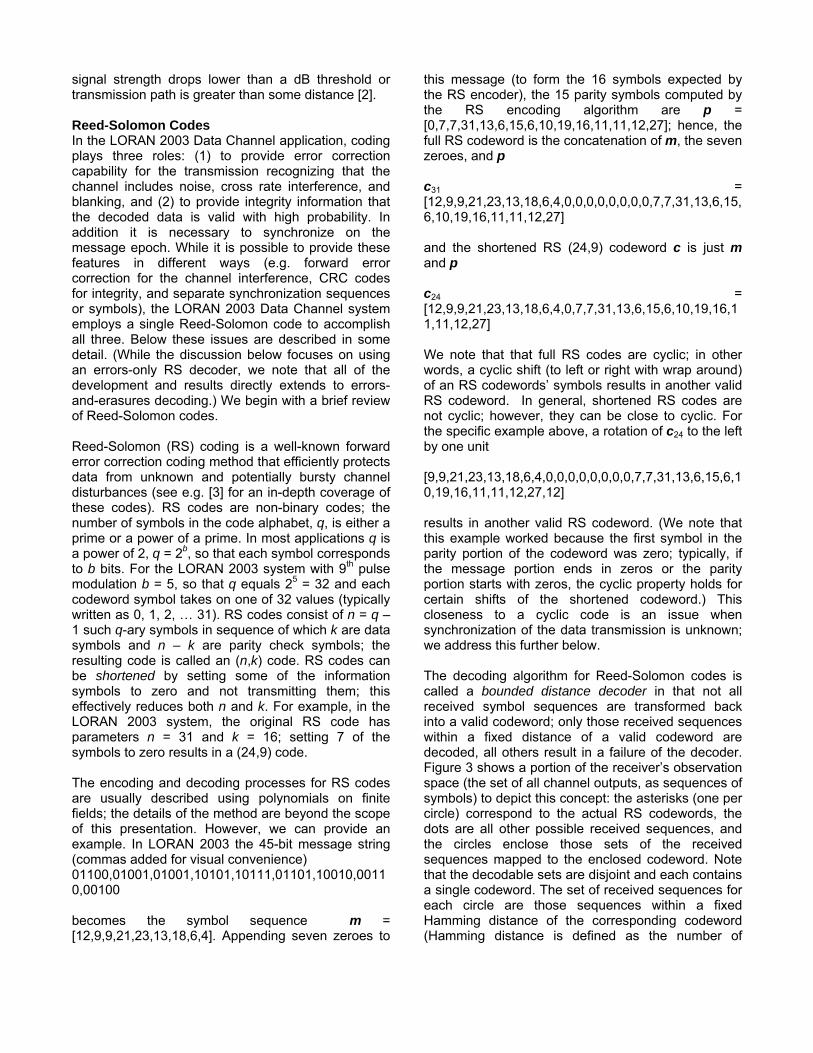
this message (to form the 16 symbols expected by the RS encoder), the 15 parity symbols computed by the RS encoding algorithm are p = [0,7,7,31,13,6,15,6,10,19,16,11,11,12,27]; hence, the full RS codeword is the concatenation of m, the seven zeroes, and p c31 = [12,9,9,21,23,13,18,6,4,0,0,0,0,0,0,0,0,7,7,31,13,6,15,6,10,19,16,11,11,12,27] and the shortened RS (24,9) codeword c is just m and p c24 = [12,9,9,21,23,13,18,6,4,0,7,7,31,13,6,15,6,10,19,16,11,11,12,27] We note that that full RS codes are cyclic; in other words, a cyclic shift (to left or right with wrap around) of an RS codewords’ symbols results in another valid RS codeword. In general, shortened RS codes are not cyclic; however, they can be close to cyclic. For the specific example above, a rotation of c24 to the left by one unit [9,9,21,23,13,18,6,4,0,0,0,0,0,0,0,0,7,7,31,13,6,15,6,10,19,16,11,11,12,27,12] results in another valid RS codeword. (We note that this example worked because the first symbol in the parity portion of the codeword was zero; typically, if the message portion ends in zeros or the parity portion starts with zeros, the cyclic property holds for certain shifts of the shortened codeword.) This closeness to a cyclic code is an issue when synchronization of the data transmission is unknown; we address this further below. The decoding algorithm for Reed-Solomon codes is called a bounded distance decoder in that not all received symbol sequences are transformed back into a valid codeword; only those received sequences within a fixed distance of a valid codeword are decoded, all others result in a failure of the decoder. Figure 3 shows a portion of the receiver’s observation space (the set of all channel outputs, as sequences of symbols) to depict this concept: the asterisks (one per circle) correspond to the actual RS codewords, the dots are all other possible received sequences, and the circles enclose those sets of the received sequences mapped to the enclosed codeword. Note that the decodable sets are disjoint and each contains a single codeword. The set of received sequences for each circle are those sequences within a fixed Hamming distance of the corresponding codeword (Hamming distance is defined as the number of
symbol differences between two sequences and takes on integer values between zero and the number of symbols in a codeword). Imagining that the transmitted codeword is the one in the yellow filled circle, the decoder correctly decodes this codeword if the received sequence is also within the yellow circle (fortunately, this occurs with high probability). If the received sequence is within some other circle (shown in orange) the decoder releases the incorrect codeword corresponding to that circle, making an error. Finally, if the received sequence is not within any of the circles, i.e. in the gray region, the decoder reports a failure.
*
*
*
*
*
*
Figure 4: Representation of the decoder's operation.
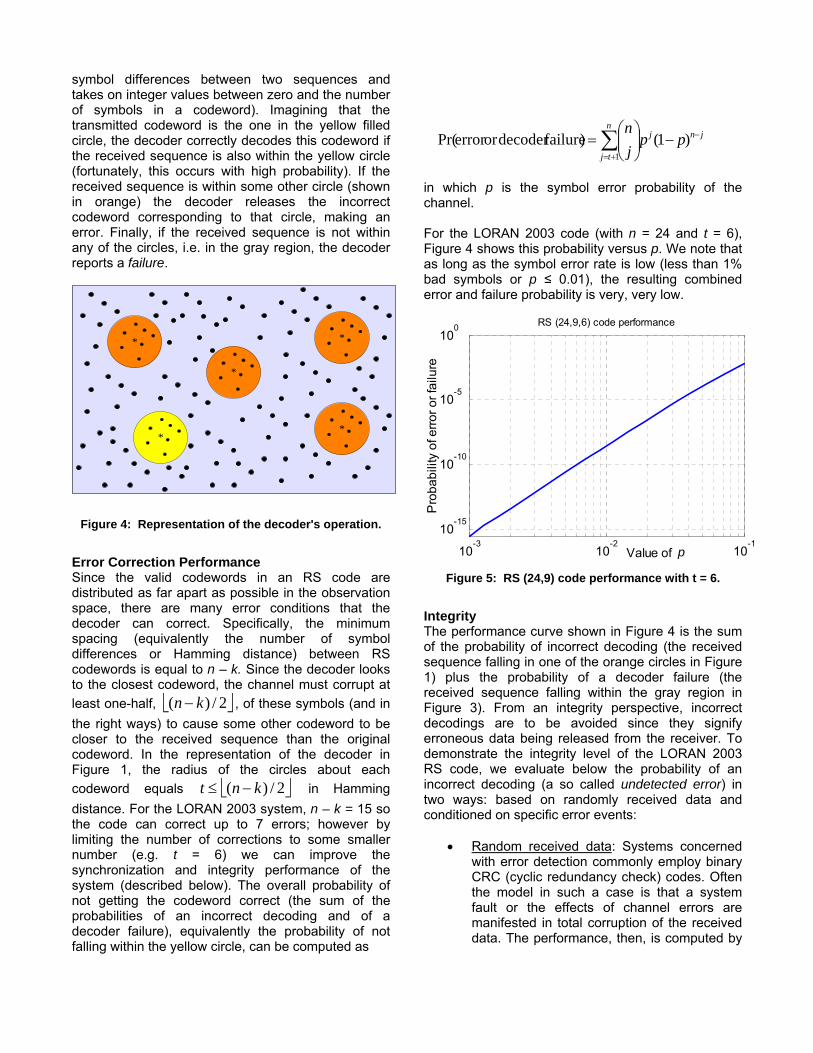
Error Correction Performance Since the valid codewords in an RS code are distributed as far apart as possible in the observation space, there are many error conditions that the decoder can correct. Specifically, the minimum spacing (equivalently the number of symbol differences or Hamming distance) between RS codewords is equal to n – k. Since the decoder looks to the closest codeword, the channel must corrupt at least one-half, ⎣ ⎦2/)( kn − , of these symbols (and in the right ways) to cause some other codeword to be closer to the received sequence than the original codeword. In the representation of the decoder in Figure 1, the radius of the circles about each codeword equals ⎣ ⎦2/)( knt −≤ in Hamming distance. For the LORAN 2003 system, n – k = 15 so the code can correct up to 7 errors; however by limiting the number of corrections to some smaller number (e.g. t = 6) we can improve the synchronization and integrity performance of the system (described below). The overall probability of not getting the codeword correct (the sum of the probabilities of an incorrect decoding and of a decoder failure), equivalently the probability of not falling within the yellow circle, can be computed as
in which p is the symbol error probability of the channel. For the LORAN 2003 code (with n = 24 and t = 6), Figure 4 shows this probability versus p. We note that as long as the symbol error rate is low (less than 1% bad symbols or p ≤ 0.01), the resulting combined error and failure probability is very, very low.
10-3
10-2
10-1
10-15
10-10
10-5
100
Value of p
Pro
babi
lity
of e
rror o
r fai
lure
RS (24,9,6) code performance
Figure 5: RS (24,9) code performance with t = 6.
Integrity The performance curve shown in Figure 4 is the sum of the probability of incorrect decoding (the received sequence falling in one of the orange circles in Figure 1) plus the probability of a decoder failure (the received sequence falling within the gray region in Figure 3). From an integrity perspective, incorrect decodings are to be avoided since they signify erroneous data being released from the receiver. To demonstrate the integrity level of the LORAN 2003 RS code, we evaluate below the probability of an incorrect decoding (a so called undetected error) in two ways: based on randomly received data and conditioned on specific error events:
• Random received data: Systems concerned with error detection commonly employ binary CRC (cyclic redundancy check) codes. Often the model in such a case is that a system fault or the effects of channel errors are manifested in total corruption of the received data. The performance, then, is computed by
∑+=
−−⎟⎟⎠
⎞⎜⎜⎝
⎛=
n
tj
jnj ppjn
1)1()failuredecoder or error Pr(
n
t
j
jk
RS q
qjn
q ∑=
−⎟⎟⎠
⎞⎜⎜⎝
⎛−
= 0
)1()1()errorundetectedPr(
assuming that the received bits are arbitrary (a probability of ½ for each bit value so that all binary sequences are equally likely) and the undetected error probability of the code equals the ratio of the number of bit patterns that pass the CRC parity check to the total number of bit patterns. For a CRC code with k information bits and r parity bit, this is
For example, a CRC code with r = 24 parity bits yields integrity performance of 2-24 or approximately 10–7. We can employ a similar analysis for the RS codes in terms of random data. The difference is that we must count the total number of decodable sequences, those within t units in Hamming distance of a valid codeword, toward the undetected error event. The resulting expression is
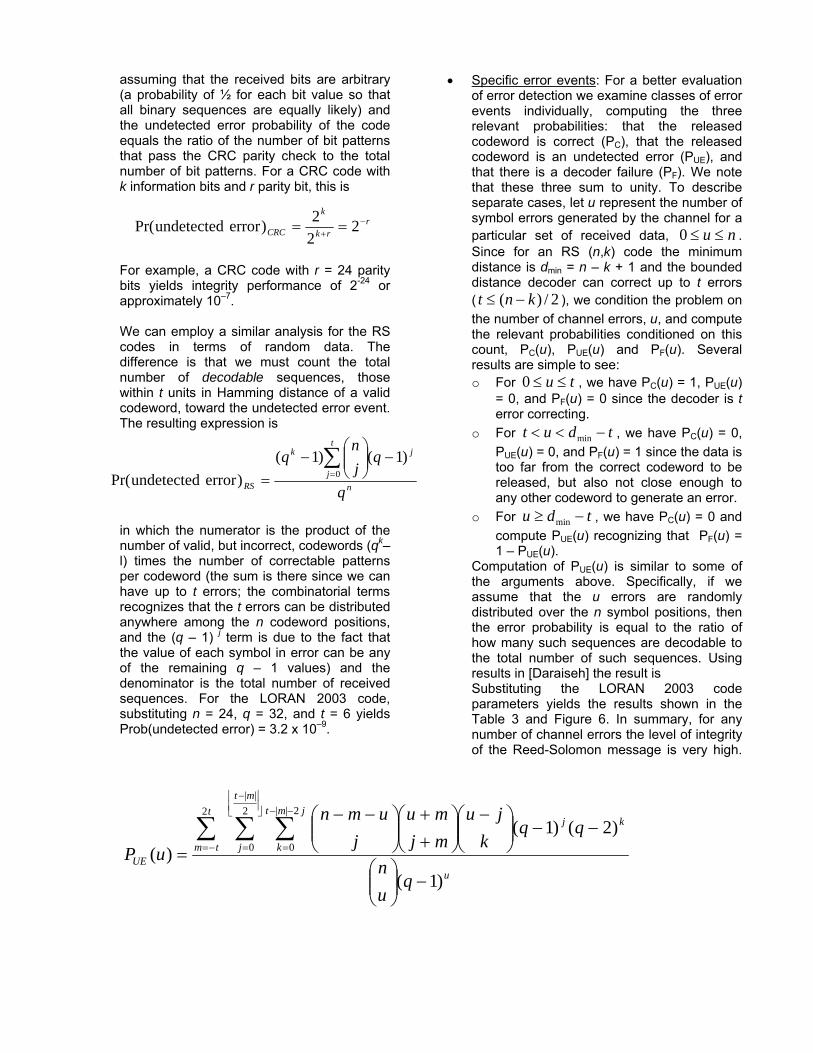
in which the numerator is the product of the number of valid, but incorrect, codewords (qk– l) times the number of correctable patterns per codeword (the sum is there since we can have up to t errors; the combinatorial terms recognizes that the t errors can be distributed anywhere among the n codeword positions, and the (q – 1) j term is due to the fact that the value of each symbol in error can be any of the remaining q – 1 values) and the denominator is the total number of received sequences. For the LORAN 2003 code, substituting n = 24, q = 32, and t = 6 yields Prob(undetected error) = 3.2 x 10⁻⁹.
• Specific error events: For a better evaluation of error detection we examine classes of error events individually, computing the three relevant probabilities: that the released codeword is correct (PC), that the released codeword is an undetected error (PUE), and that there is a decoder failure (PF). We note that these three sum to unity. To describe separate cases, let u represent the number of symbol errors generated by the channel for a particular set of received data, nu ≤≤0 . Since for an RS (n,k) code the minimum distance is dmin = n – k + 1 and the bounded distance decoder can correct up to t errors ( 2/)( knt −≤ ), we condition the problem on the number of channel errors, u, and compute the relevant probabilities conditioned on this count, PC(u), PUE(u) and PF(u). Several results are simple to see: o For tu ≤≤0 , we have PC(u) = 1, PUE(u)
= 0, and PF(u) = 0 since the decoder is t error correcting.
o For tdut −<< min , we have PC(u) = 0, PUE(u) = 0, and PF(u) = 1 since the data is too far from the correct codeword to be released, but also not close enough to any other codeword to generate an error.
o For tdu −≥ min , we have PC(u) = 0 and compute PUE(u) recognizing that PF(u) = 1 – PUE(u).
Computation of PUE(u) is similar to some of the arguments above. Specifically, if we assume that the u errors are randomly distributed over the n symbol positions, then the error probability is equal to the ratio of how many such sequences are decodable to the total number of such sequences. Using results in [Daraiseh] the result is Substituting the LORAN 2003 code parameters yields the results shown in the Table 3 and Figure 6. In summary, for any number of channel errors the level of integrity of the Reed-Solomon message is very high.
rrk
k
CRC−
+ == 222)errorundetectedPr(
u
mt
j
kjjmt
k
t
tmUE
qun
qqk
jumjmu
jumn
uP)1(
)2()1()(
2||
0
2||
0
2
−⎟⎟⎠
⎞⎜⎜⎝
⎛
−−⎟⎟⎠
⎞⎜⎜⎝
⎛ −⎟⎟⎠
⎞⎜⎜⎝
⎛++
⎟⎟⎠
⎞⎜⎜⎝
⎛ −−
=∑ ∑∑
⎥⎦⎥
⎢⎣⎢ −
=
−−
=−=
0 1 2 3 4 5 6 710-9
10-8
10-7
10-6
10-5
10-4
10-3
10-2
10-1
12
11
10
9
8
7
6
5
4
3
2
1
0
12
11
10
9
8
7
6
5
4
3
2
1
0
Pro
babi
lity
of e
rrone
ous
mes
sage
bei
ng a
ccep
ted
by d
ecod
er
Number of corrections (t)
Number of erasures
Figure 6: Correctable Erasure/Errors versus Probability of Error
Error count u PUE(u) PF(u) 0,1,2,3,4,5,6 0 0
7,8,9 0 1 10 1.1 × 10⁻¹⁰ 1 – PUE(10) 11 5.5 × 10⁻¹⁰ 1 – PUE(11) 12 1.4 × 10⁻⁹ 1 – PUE(12) 13 2.3 × 10⁻⁹ 1 – PUE(13) 14 3.0 × 10⁻⁹ 1 – PUE(14) 15 3.2 × 10⁻⁹ 1 – PUE(15) 16 3.2 × 10⁻⁹ 1 – PUE(16) 17 3.2 × 10⁻⁹ 1 – PUE(17) 18 3.2 × 10⁻⁹ 1 – PUE(18) 19 3.2 × 10⁻⁹ 1 – PUE(19) 20 3.2 × 10⁻⁹ 1 – PUE(20) 21 3.2 × 10⁻⁹ 1 – PUE(21) 22 3.2 × 10⁻⁹ 1 – PUE(22) 23 3.2 × 10⁻⁹ 1 – PUE(23) 24 3.2 × 10⁻⁹ 1 – PUE(24)
Table 3: Integrity performance of the (24,9) RS Code.
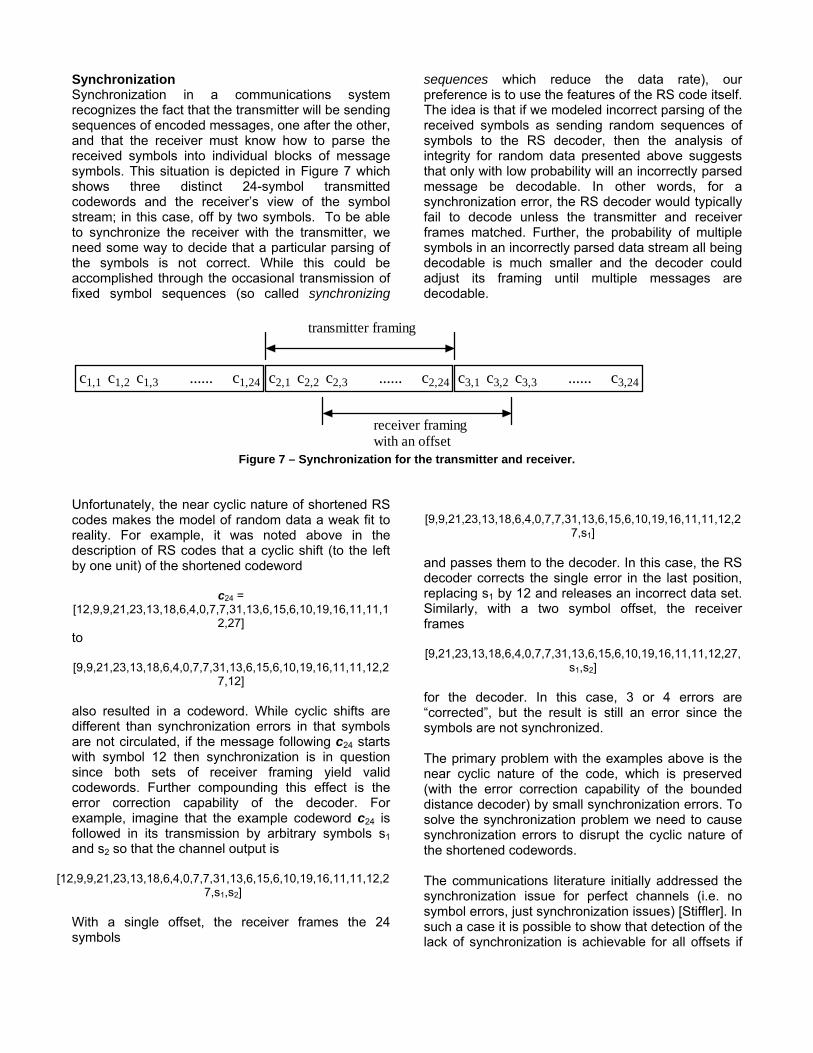
Synchronization Synchronization in a communications system recognizes the fact that the transmitter will be sending sequences of encoded messages, one after the other, and that the receiver must know how to parse the received symbols into individual blocks of message symbols. This situation is depicted in Figure 7 which shows three distinct 24-symbol transmitted codewords and the receiver’s view of the symbol stream; in this case, off by two symbols. To be able to synchronize the receiver with the transmitter, we need some way to decide that a particular parsing of the symbols is not correct. While this could be accomplished through the occasional transmission of fixed symbol sequences (so called synchronizing
sequences which reduce the data rate), our preference is to use the features of the RS code itself. The idea is that if we modeled incorrect parsing of the received symbols as sending random sequences of symbols to the RS decoder, then the analysis of integrity for random data presented above suggests that only with low probability will an incorrectly parsed message be decodable. In other words, for a synchronization error, the RS decoder would typically fail to decode unless the transmitter and receiver frames matched. Further, the probability of multiple symbols in an incorrectly parsed data stream all being decodable is much smaller and the decoder could adjust its framing until multiple messages are decodable.
c1,1 c1,2 c1,3 ...... c1,24 c2,1 c2,2 c2,3 ...... c2,24 c3,1 c3,2 c3,3 ...... c3,24
transmitter framing
receiver framingwith an offset
Figure 7 – Synchronization for the transmitter and receiver.
Unfortunately, the near cyclic nature of shortened RS codes makes the model of random data a weak fit to reality. For example, it was noted above in the description of RS codes that a cyclic shift (to the left by one unit) of the shortened codeword
c24 = [12,9,9,21,23,13,18,6,4,0,7,7,31,13,6,15,6,10,19,16,11,11,1
2,27] to [9,9,21,23,13,18,6,4,0,7,7,31,13,6,15,6,10,19,16,11,11,12,2
7,12]
also resulted in a codeword. While cyclic shifts are different than synchronization errors in that symbols are not circulated, if the message following c24 starts with symbol 12 then synchronization is in question since both sets of receiver framing yield valid codewords. Further compounding this effect is the error correction capability of the decoder. For example, imagine that the example codeword c24 is followed in its transmission by arbitrary symbols s1 and s2 so that the channel output is
[12,9,9,21,23,13,18,6,4,0,7,7,31,13,6,15,6,10,19,16,11,11,12,27,s1,s2]
With a single offset, the receiver frames the 24 symbols
[9,9,21,23,13,18,6,4,0,7,7,31,13,6,15,6,10,19,16,11,11,12,2
7,s1]
and passes them to the decoder. In this case, the RS decoder corrects the single error in the last position, replacing s1 by 12 and releases an incorrect data set. Similarly, with a two symbol offset, the receiver frames [9,21,23,13,18,6,4,0,7,7,31,13,6,15,6,10,19,16,11,11,12,27,
s1,s2]
for the decoder. In this case, 3 or 4 errors are “corrected”, but the result is still an error since the symbols are not synchronized. The primary problem with the examples above is the near cyclic nature of the code, which is preserved (with the error correction capability of the bounded distance decoder) by small synchronization errors. To solve the synchronization problem we need to cause synchronization errors to disrupt the cyclic nature of the shortened codewords. The communications literature initially addressed the synchronization issue for perfect channels (i.e. no symbol errors, just synchronization issues) [Stiffler]. In such a case it is possible to show that detection of the lack of synchronization is achievable for all offsets if
the code’s data rate (k/n) is less than one-half. The solution is to employ a coset code in which the original code is modified by adding (modulo q) a fixed vector c* to each codeword. (Note that c* itself cannot be a codeword as that would not modify the code, just permute the codeword to information symbols assignment.) Coset codes employ the same decoding algorithm as the original code (just first subtract out c*, again modulo q, before decoding) and have the same error and integrity performance. The synchronization of coset codes with error correction has received much less attention in the literature. For example, it is unclear if there exists a coset vector c that guarantees synchronization detection for all offsets given that the decoder employs error correction. However, we have had good success with simple coset vectors such as
c* = [ 0,1,2,3,4,5,6,7,8,9,10,11,12,13,14,15,16,17,18,19,20,21,22,23 ]
Transmission Tests A prototype control software program for the tube-type transmitter (TTX) is finished (too many times due
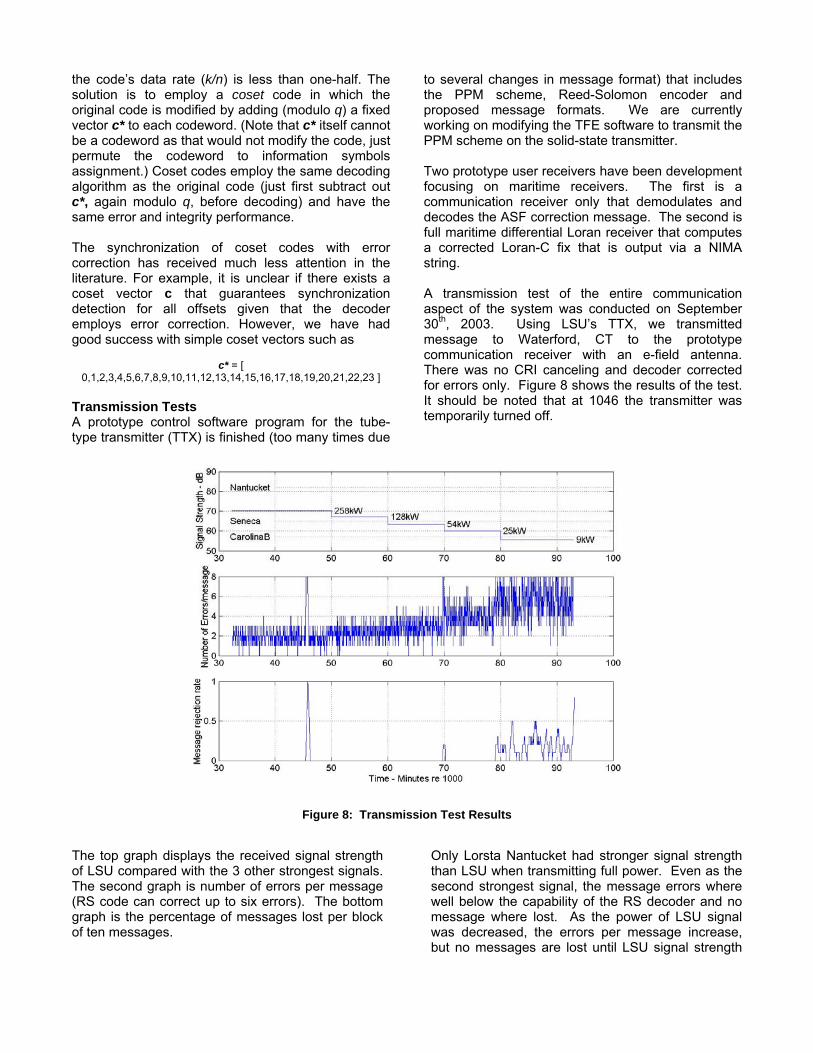
to several changes in message format) that includes the PPM scheme, Reed-Solomon encoder and proposed message formats. We are currently working on modifying the TFE software to transmit the PPM scheme on the solid-state transmitter. Two prototype user receivers have been development focusing on maritime receivers. The first is a communication receiver only that demodulates and decodes the ASF correction message. The second is full maritime differential Loran receiver that computes a corrected Loran-C fix that is output via a NIMA string. A transmission test of the entire communication aspect of the system was conducted on September 30th, 2003. Using LSU’s TTX, we transmitted message to Waterford, CT to the prototype communication receiver with an e-field antenna. There was no CRI canceling and decoder corrected for errors only. Figure 8 shows the results of the test. It should be noted that at 1046 the transmitter was temporarily turned off.
Figure 8: Transmission Test Results
The top graph displays the received signal strength of LSU compared with the 3 other strongest signals. The second graph is number of errors per message (RS code can correct up to six errors). The bottom graph is the percentage of messages lost per block of ten messages.
Only Lorsta Nantucket had stronger signal strength than LSU when transmitting full power. Even as the second strongest signal, the message errors where well below the capability of the RS decoder and no message where lost. As the power of LSU signal was decreased, the errors per message increase, but no messages are lost until LSU signal strength
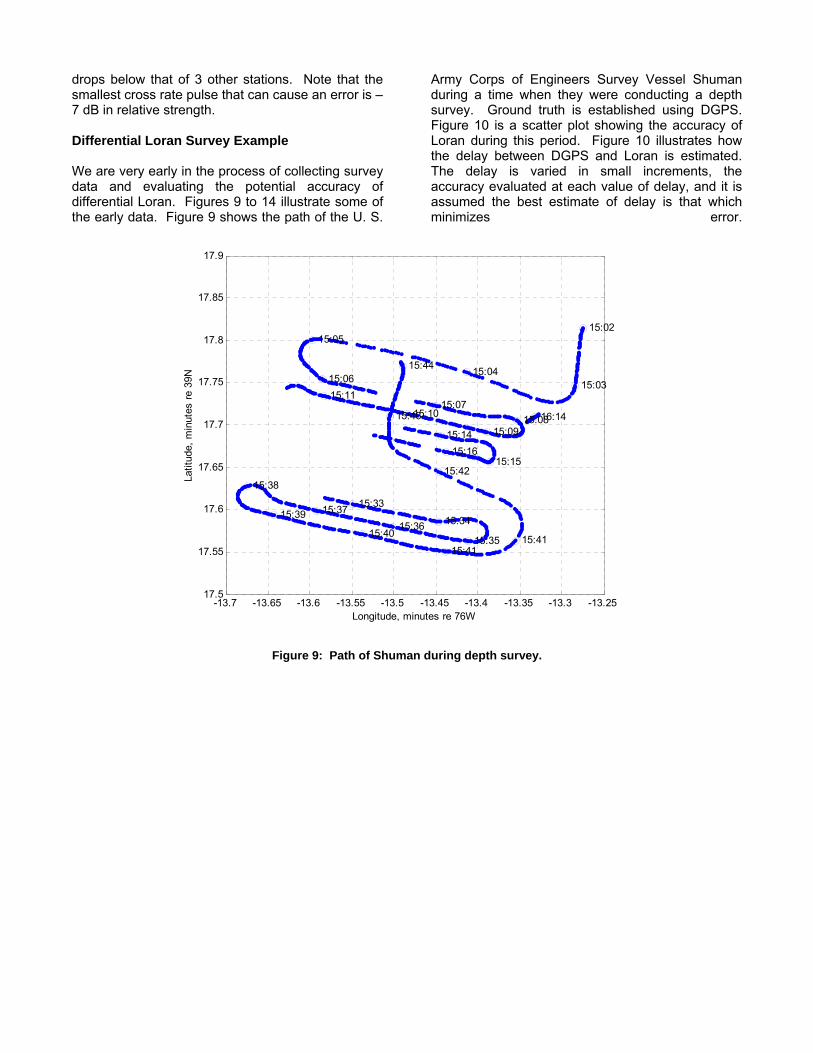
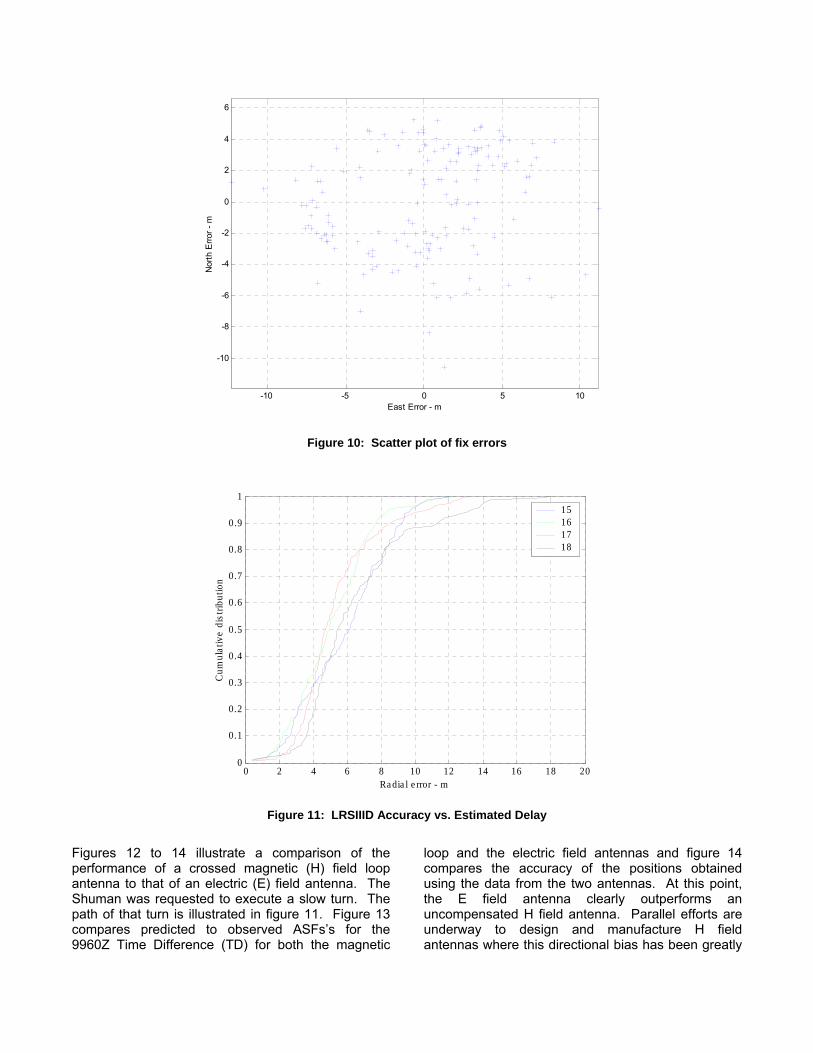
drops below that of 3 other stations. Note that the smallest cross rate pulse that can cause an error is –7 dB in relative strength. Differential Loran Survey Example We are very early in the process of collecting survey data and evaluating the potential accuracy of differential Loran. Figures 9 to 14 illustrate some of the early data. Figure 9 shows the path of the U. S.
Army Corps of Engineers Survey Vessel Shuman during a time when they were conducting a depth survey. Ground truth is established using DGPS. Figure 10 is a scatter plot showing the accuracy of Loran during this period. Figure 10 illustrates how the delay between DGPS and Loran is estimated. The delay is varied in small increments, the accuracy evaluated at each value of delay, and it is assumed the best estimate of delay is that which minimizes error.
-13.7 -13.65 -13.6 -13.55 -13.5 -13.45 -13.4 -13.35 -13.3 -13.2517.5
17.55
17.6
17.65
17.7
17.75
17.8
17.85
17.9
15:02
15:03 15:04
15:05
15:06
15:07 15:08
15:09
15:10
15:11
15:14
15:15 15:16
15:33
15:34
15:35 15:36
15:37
15:38
15:39
15:40
15:41 15:41
15:42
15:43
15:44
16:14
Longitude, minutes re 76W
Latit
ude,
min
utes
re 3
9N
Figure 9: Path of Shuman during depth survey.
-10 -5 0 5 10
-10
-8
-6
-4
-2
0
2
4
6
East Error - m
Nor
th E
rror -
m
Figure 10: Scatter plot of fix errors
0 2 4 6 8 10 12 14 16 18 200
0.1
0.2
0.3
0.4
0.5
0.6
0.7
0.8
0.9
1
Ra dia l e rror - m
Cum
ulat
ive
dist
ribut
ion
15161718
Figure 11: LRSIIID Accuracy vs. Estimated Delay
Figures 12 to 14 illustrate a comparison of the performance of a crossed magnetic (H) field loop antenna to that of an electric (E) field antenna. The Shuman was requested to execute a slow turn. The path of that turn is illustrated in figure 11. Figure 13 compares predicted to observed ASFs’s for the 9960Z Time Difference (TD) for both the magnetic
loop and the electric field antennas and figure 14 compares the accuracy of the positions obtained using the data from the two antennas. At this point, the E field antenna clearly outperforms an uncompensated H field antenna. Parallel efforts are underway to design and manufacture H field antennas where this directional bias has been greatly
diminished and/or to calibrate and compensate for this bias.
-12.92 -12.9 -12.88 -12.86 -12.84 -12.82 -12.8 -12.78 -12.76 -12.74 -12.7218.1
18.12
18.14
18.16
18.18
18.2
18.22
18.24
18.26
18.28
18.3
16:32
16:32
16:33
16:34
16:35
16:36
16:37
16:38
16:39
16:40
16:41
Longitude , m inute s re 76W
Latit
ude,
min
utes
re 3
9N
Figure 12: Test of directional dependence of H field antenna
16.52 16.54 16.56 16.58 16.6 16.62 16.64 16.66 16.68 16.7 16.7222.5
23
23.5
24
24.5
usec
9960Z TD re 59100 us e c
P re dic te d from GP SLRS IIID (E fie ld)S a tMa te (H fie ld)
16.52 16.54 16.56 16.58 16.6 16.62 16.64 16.66 16.68 16.7 16.72-0.6
-0.4
-0.2
0
0.2
0.4
Hours - GMT
usec
Re la tive to pre dic te d
LRS IIIDS a tMa te
Figure 13: TOA Measurements during H-field directional dependence test
0 2 4 6 8 10 12 14 16 18 200
0.1
0.2
0.3
0.4
0.5
0.6
0.7
0.8
0.9
1
Ra dia l e rror - m
Cum
ulat
ive
dist
ribut
ion
LRS IIID (E fie ld)S a tMa te (H fie ld)
Figure 14: Comparison of E & H field accuracy during turns
Modulation of Solid State Transmitter The challenge in modulating the current solid-state-transmitter (SSX) is that it only accepts timing pulses. From these timing pulses, generated by the TFE suite, it builds the teardrop Loran pulse. This limitation forces the modification to complete Differential Loran to the TFE suite. The prototype design architecture for dLoran testing on a TFE system was developed as seen in Figure 15.
Figure 15: Test Design of the Differential Loran
network. The prototype system starts with the dLoran base stations placed throughout a region. As Loran transmitting stations are upgraded, they broadcast corrections from multiple base stations. The dLoran corrections are fed from the base stations to the transmit station through a WAN into a message generation software. For development purposes, this software runs on a separate computer to ease code modifications and run different system parameters. The computer’s system clock is synchronized to the TFE clock via Network Time
Protocol (NTP). The software will be integrated into the TFE system when everything is ready for full operational status. The message generation software encodes the corrections in the proper format, including the Reed-Solomon forward error correction code. The software divides the message into the correct 5-bit symbol. The actual PPM symbol is passed to the TFE for transmission after the TFE request the data over a RS-232 port. The TFE has been modified to accept symbol numbers that map to a PPM positions. The TFE adds the modulation pulse to the transmitter group of Loran pulses based on the received symbol. Each rate would transmit separate correction, time and station identification messages. Therefore, two separate messages would be transmitted simultaneously in dual-rate operations. The phase of the modulated signal would match the phase of the previous pulse as seen in Figure 16.
Figure 16: Phase Coding of Loran Pulses
TFE/NTP Server
Message Generator PC/NTP
ClientNTP
RS -232 messages
LAN/WAN
dLoranBase
Station 1
dLoranBase
Station N
Differential Data
SSX
Group Master Secondary A + + - - + - + - - + + + + + + - - + + B + - - + + + + + + - + - + - + + - - -
Phase of Modulated (9th) pulse
Figure 17: Location of 9th Pulse within Loran Group.
Figure 17 illustrates where the modulated pulse falls within the standard Loran group. The pulse “zero” symbol is 1000 microseconds after the eight pulse in both a secondary and master groups. The modulated pulse can move later in time according to symbol number (Table 1) but it will never move closer than 1000 microseconds to the 8th pulse. If no data is present to transmit, TFE will not transmit an extra pulse. dLoran Modulation Test Results In March 2004, the first successful test of the prototype system was completed at the Loran Support Unit. The primary goal of the test was to ensure the SSX produced the correct spacing for each symbol as well as handle the time movement of an additional pulse. The team was able to transmit messages on Low, High or both rates into the simulator for all message types. A prototype Loran receiver/demodulator was connected to the output of the antenna simulator. All messages were demodulated without error and without invoking the forward-error-correcting code. The next major step is to start implement this prototype system on an operational transmitting station (Lorsta Seneca) in late fall. The system would encompass monitor base stations located from Washington, DC to Boston, MA. The modulated signal and data will be purely for testing purposes and non-operational. Conclusions The methods of generating, coding and decoding, modulating and demodulating, and using differential Loran ASF corrections has been demonstrated and presented. Although very early in the data analysis stage, these early results suggest that meeting the
HEA accuracy requirement should be possible. Early results have shown the E field antenna clearly outperforms an uncompensated H field antenna, but efforts are underway to design and manufacture H field antennas where this directional bias has been greatly diminished and/or to calibrate and compensate for this bias. Great strives forward have been accomplished in modifying transmit station equipment to broadcast the modulated data. Many successful tests have been performed on the Loran Support Unit’s test transmitter work on system discrepancies. The goal is to start transmitting test corrections from an operational station later this year. Acknowledgements We thank our colleagues at the U. S. Army Corps of Engineers Philadelphia Office and the crew of their survey vessel M/V Shuman for supporting us without hesitation during the dLoran tests. The effort was funded by the Federal Aviation Administration Loran Evaluation project; Mitch Narins, project manager. References [1] B. Peterson, K. Dykstra, P. Swaszek, J. Boyer, K.Carroll and M. Narins, High Speed Loran-C Data Communications—Flight Test Results, Proceedings of the ION-GPS 2001, Salt Lake City, September 2001. [2] Ben Peterson and Per Enge, Mitigation of the Effects Early Skywaves, presented at International Loran Association Technical Symposium, Boulder, CO, November 5, 2003. [3] Wieker, Error Control Systems for Digital Communication and Storage, Prentice Hall, 1995. [4] A. Daraiseh and C. Baum, “Decoder error and failure probabilities for Reed-Solomon codes: decodable vectors method,” IEEE Trans. Commun., 46(7), July 1998, pp.857-859. [5] J. J. Stiffler, “Comma-free error-correcting codes,” IEEE Trans. Information Theory, Jan. 1965, pp.107-112.
Note: The views expressed herein are those of the authors and are not be construed as official or reflecting the views of the Commandant, U. S. Coast Guard, U. S. Federal Aviation Administration or the U. S. Departments of
Homeland Security or Transportation.
Secondary Rate
Master Rate Master Pulse
Modulated (9th) pulse