Differences in pitting growth kinetics between ... · exclusive. By the characterisation of current...
12
Contents lists available at ScienceDirect Corrosion Science journal homepage: www.elsevier.com/locate/corsci Differences in pitting growth kinetics between Zr 60 Ni 25 Al 15 and Zr 60 Cu 25 Al 15 metallic glasses exposed to a 0.6 M NaCl aqueous solution Yu Li, Jian Xu ⁎ Shenyang National Laboratory for Materials Science, Institute of Metal Research, Chinese Academy of Sciences, 72 Wenhua Road, Shenyang, 110016, China ARTICLE INFO Keywords: A. Alloy A. Zirconium B. Polarisation C. Amorphous structures C. Kinetic parameters C. Pitting corrosion ABSTRACT By the artificial pit electrode approach, growth behaviours of stable pits for melt-spun Zr 60 Ni 25 Al 15 and Zr 60 Cu 25 Al 15 metallic glasses (MGs) exposed to a 0.6 M NaCl solution are investigated. By characterising the current transient events and growth kinetics parameters, the effect of selective dissolution caused by the late transition metals on the pitting growth kinetics is revealed. The pit solution acidity is estimated with local acidification model. It is shown that the stable pitting growth for Zr 60 Cu 25 Al 15 MG is considerably more fa- vourable compared to Zr 60 Ni 25 Al 15 , because of its more rapid pit growth rate and more aggressive pit solution. 1. Introduction Metallic glasses (MGs) with structurally amorphous features exhibit superior corrosion resistance in corrosive media because of their che- mical homogeneity, lack of lattice defects, and considerably beneficial solutes in long-range disordered solid solutions [1,2]. Zirconium-based MGs are well known to exhibit excellent corrosion resistance in halide- free solutions because of the formation of a uniform surface passive film mainly comprising zirconium oxides. Unfortunately, such passive films are susceptible to deterioration in chloride-containing aqueous solu- tions. Typically, multicomponent Zr–Ni–Cu–Al, Zr–Ti–Ni–Cu, and Zr–Ti–Ni–Cu–Be bulk metallic glasses (BMGs) are highly susceptible to pitting corrosion [3–8]. Besides passive elements such as zirconium, titanium, and aluminium, the pitting corrosion resistance of Zr-based MGs chemically depends on the incorporated species of late transition metals (LTMs) such as copper, cobalt, and nickel. These elements are required to render the glass-forming ability of BMGs. For the alloys with one LTM, Ni-bearing Zr 55 Ti 4 Ni 22 Al 19 BMG exhibits a pitting potential ∼400 mV greater than that of Cu-bearing Zr 61 Ti 2 Cu 25 Al 12 BMG in a 0.6 M NaCl solution [8], indicative of a significantly enhanced pitting resistance. However, the intrinsic sources responsible for this compo- sitional effect of LTM on the pitting resistance are still unclear. In conventional crystalline metals [9–12], the evolution of corrosion pits is well known to apparently occur in several distinct stages, in- cluding the passivity breakdown, metastable pitting, and pit growth. To understand the overall picture of the pitting behaviour, it is necessary to characterise the pit evolution processes. However, to the best of our knowledge, a few studies have reported the pit evolution processes of Zr-based MGs. Recently, our group [8] has reported that the electro- chemical characteristics, composition, and thicknesses of the surface passive films of Zr 61 Ti 2 Cu 25 Al 12 and Zr 55 Ti 4 Ni 22 Al 19 BMGs are similar. The LTM elements in the BMGs are not incorporated into the passive film to form oxides. Thus, differences in the passivity breakdown pro- cess between these two alloys are thought to not crucially affect the pitting resistance of Zr-based MGs. Previous studies [5–8,13] have re- ported the selective dissolution of elements such as zirconium, tita- nium, and aluminium over copper in Cu-bearing Zr-based MGs during pitting growth. In contrast, no selective dissolution occurs in Ni-bearing MGs [8]. Thus far, the effect of the selective dissolution behaviour caused by different LTMs in these alloys on the kinetics of stable pitting growth is not clear. Clarifying the pit growth kinetics of Zr-based MGs is essential for understanding the chemical effect of LTM on the pitting resistance of Zr-based MGs and designing highly corrosion-resistant BMGs. During pit growth, the metal cations from the pitting dissolution undergo hydrolysis, accompanied with the simultaneous production of metal hydroxide(s) and hydrogen ions. These processes generate a sufficiently aggressive acidic pit solution, which can depassivate the material via destabilising passive films on the metal surface [9–11]. Burstein et al. [12,14] have suggested that stable pitting growth is controlled by the diffusion of metal cations from the pit bottom to the pit mouth. The pit depth inevitably serves as a sufficient diffusion barrier. In addition, the local acidic solution dynamically leads to the enhanced Cl − concentration because these anions migrate to the pit to simultaneously maintain the charge neutrality. Because of the high metal cation and Cl − concentrations, a salt film is precipitated at the pit http://dx.doi.org/10.1016/j.corsci.2017.09.007 Received 25 June 2017; Received in revised form 22 August 2017; Accepted 4 September 2017 ⁎ Corresponding author. E-mail address: [email protected] (J. Xu). Corrosion Science 128 (2017) 73–84 Available online 12 September 2017 0010-938X/ © 2017 Elsevier Ltd. All rights reserved. MARK
Transcript of Differences in pitting growth kinetics between ... · exclusive. By the characterisation of current...
Contents lists available at ScienceDirect
Corrosion Science
journal homepage: www.elsevier.com/locate/corsci
Differences in pitting growth kinetics between Zr60Ni25Al15 andZr60Cu25Al15 metallic glasses exposed to a 0.6 M NaCl aqueous solution
Yu Li, Jian Xu⁎
Shenyang National Laboratory for Materials Science, Institute of Metal Research, Chinese Academy of Sciences, 72 Wenhua Road, Shenyang, 110016, China
A R T I C L E I N F O
Keywords:A. AlloyA. ZirconiumB. PolarisationC. Amorphous structuresC. Kinetic parametersC. Pitting corrosion
A B S T R A C T
By the artificial pit electrode approach, growth behaviours of stable pits for melt-spun Zr60Ni25Al15 andZr60Cu25Al15 metallic glasses (MGs) exposed to a 0.6 M NaCl solution are investigated. By characterising thecurrent transient events and growth kinetics parameters, the effect of selective dissolution caused by the latetransition metals on the pitting growth kinetics is revealed. The pit solution acidity is estimated with localacidification model. It is shown that the stable pitting growth for Zr60Cu25Al15 MG is considerably more fa-vourable compared to Zr60Ni25Al15, because of its more rapid pit growth rate and more aggressive pit solution.
1. Introduction
Metallic glasses (MGs) with structurally amorphous features exhibitsuperior corrosion resistance in corrosive media because of their che-mical homogeneity, lack of lattice defects, and considerably beneficialsolutes in long-range disordered solid solutions [1,2]. Zirconium-basedMGs are well known to exhibit excellent corrosion resistance in halide-free solutions because of the formation of a uniform surface passive filmmainly comprising zirconium oxides. Unfortunately, such passive filmsare susceptible to deterioration in chloride-containing aqueous solu-tions. Typically, multicomponent Zr–Ni–Cu–Al, Zr–Ti–Ni–Cu, andZr–Ti–Ni–Cu–Be bulk metallic glasses (BMGs) are highly susceptible topitting corrosion [3–8]. Besides passive elements such as zirconium,titanium, and aluminium, the pitting corrosion resistance of Zr-basedMGs chemically depends on the incorporated species of late transitionmetals (LTMs) such as copper, cobalt, and nickel. These elements arerequired to render the glass-forming ability of BMGs. For the alloys withone LTM, Ni-bearing Zr55Ti4Ni22Al19 BMG exhibits a pitting potential∼400 mV greater than that of Cu-bearing Zr61Ti2Cu25Al12 BMG in a0.6 M NaCl solution [8], indicative of a significantly enhanced pittingresistance. However, the intrinsic sources responsible for this compo-sitional effect of LTM on the pitting resistance are still unclear.
In conventional crystalline metals [9–12], the evolution of corrosionpits is well known to apparently occur in several distinct stages, in-cluding the passivity breakdown, metastable pitting, and pit growth. Tounderstand the overall picture of the pitting behaviour, it is necessaryto characterise the pit evolution processes. However, to the best of ourknowledge, a few studies have reported the pit evolution processes of
Zr-based MGs. Recently, our group [8] has reported that the electro-chemical characteristics, composition, and thicknesses of the surfacepassive films of Zr61Ti2Cu25Al12 and Zr55Ti4Ni22Al19 BMGs are similar.The LTM elements in the BMGs are not incorporated into the passivefilm to form oxides. Thus, differences in the passivity breakdown pro-cess between these two alloys are thought to not crucially affect thepitting resistance of Zr-based MGs. Previous studies [5–8,13] have re-ported the selective dissolution of elements such as zirconium, tita-nium, and aluminium over copper in Cu-bearing Zr-based MGs duringpitting growth. In contrast, no selective dissolution occurs in Ni-bearingMGs [8]. Thus far, the effect of the selective dissolution behaviourcaused by different LTMs in these alloys on the kinetics of stable pittinggrowth is not clear. Clarifying the pit growth kinetics of Zr-based MGs isessential for understanding the chemical effect of LTM on the pittingresistance of Zr-based MGs and designing highly corrosion-resistantBMGs.
During pit growth, the metal cations from the pitting dissolutionundergo hydrolysis, accompanied with the simultaneous production ofmetal hydroxide(s) and hydrogen ions. These processes generate asufficiently aggressive acidic pit solution, which can depassivate thematerial via destabilising passive films on the metal surface [9–11].Burstein et al. [12,14] have suggested that stable pitting growth iscontrolled by the diffusion of metal cations from the pit bottom to thepit mouth. The pit depth inevitably serves as a sufficient diffusionbarrier. In addition, the local acidic solution dynamically leads to theenhanced Cl− concentration because these anions migrate to the pit tosimultaneously maintain the charge neutrality. Because of the highmetal cation and Cl− concentrations, a salt film is precipitated at the pit
http://dx.doi.org/10.1016/j.corsci.2017.09.007Received 25 June 2017; Received in revised form 22 August 2017; Accepted 4 September 2017
⁎ Corresponding author.E-mail address: [email protected] (J. Xu).
Corrosion Science 128 (2017) 73–84
Available online 12 September 20170010-938X/ © 2017 Elsevier Ltd. All rights reserved.
MARK
bottom as a resistive layer [15–18]. Furthermore, based on the one-dimensional pit growth model, a minimum critical value of cation flux,expressed as the product of the current density i and pit depth d, istheoretically required for the pit to maintain a critical chemistry, andthus sustainable spontaneous pitting growth [19]. Moreover, the stablegrowth of an open hemispherical pit is feasible only under the conditionthat the product of current density and pit depth (ipit·rpit) exceeds acritical value [9,20,21]. For stainless steels (SS) exposed to chloridesolutions, this value has been reported to be 0.3–0.6 A/m [9].
Artificial pit electrodes, fabricated by embedding a wire-shapedmetal in an insulator such as epoxy, are typically used to examine thepit dissolution kinetics in naturally assembled pit environments[18,22–26]. This approach exhibits advantages in several aspects, in-cluding (i) attaining a unidirectional pit geometry, (ii) excluding po-tential multiple pits, and (iii) only monitoring the active pit surface. Infact, artificial pit electrodes have been widely utilized to examine thepitting growth behaviour of SS, such as rate-determining factors, saltfilm formation, and physical meaning of the pitting potential[18,22,23,27–31]. Recently, Kelly et al. [26,32,33] have developed acyclic electrochemical technique, introducing a rapid, high-throughputextraction of key kinetic parameters, such as the pit stability productunder a salt film (i·x)saltfilm and the repassivation potential Erp, by singleartificial pit testing. Regarding the MGs, Scully et al. [24,25] haveutilized the artificial pit approach and examined the pit stabilisation ofseveral nanocrystalline-containing Al-based MGs and the effect of mi-croalloying with nickel on the stable pitting growth of Al–Cu–Mg-basedMGs.
In this study, two LTM-bearing Zr-based MGs, Zr60Ni25Al15 andZr60Cu25Al15, are selected to investigate the growth kinetics of stablepits with artificial pit electrodes exposed to 0.6 M NaCl solution.Maintaining an equal stoichiometry of nickel and copper in the glassyalloys ensures that the LTM concentration effect on the pitting growth isexclusive. By the characterisation of current transient events and thegrowth kinetics parameters, the effect of the selective dissolution be-haviour on the stable pit growth is expected to be revealed. Finally, thechemical effect of LTM on the pitting resistance of Zr-based MGs isdiscussed by comparing the differences in several perspectives betweentwo Zr-based MGs.
2. Experimental
2.1. Materials
Two ternary Zr–LTM–Al alloys with nominal compositions ofZr60Ni25Al15 and Zr60Cu25Al15 (in atomic percentage) were selected tofabricate MG ribbons, denoted as ZNA and ZCA hereafter, respectively.Elemental pieces with a purity greater than 99.9 wt% were used asstarting materials. Master alloy ingots were prepared by arc meltingunder a Ti-gettered argon atmosphere in a water-cooled copper cru-cible. The alloy ingots were melted several times to ensure a homo-geneous composition. The MG ribbons were fabricated by melt spinningon a copper wheel at a surface speed of 20 m/s under purified argon.The width and thickness of the as-quenched ribbons were 363–398 μmand 48–61 μm, respectively.
The amorphous nature of the melt-spun ribbons was characterizedby x-ray diffraction (XRD) on a Rigaku D/max 2400 diffractometer withmonochromatic CuKα radiation (λ = 0.1542 nm), and the XRD patternswere recorded from the air-side surface of ribbons. The glass transitionand crystallisation behaviour of the glassy ribbons were investigated ona Perkin-Elmer differential scanning calorimeter (DSC diamond) withan alumina container under flowing purified argon at a heating rate of20 K/min. A second run under identical conditions was carried out todetermine the baseline after each run. To confirm the reproducibility ofthe data, at least three samples taken from independent sites of theribbon were examined for each alloy. All of the measured glass tran-sition temperatures (Tg) and onset temperature of crystallisation (Tx)
were reproducible within an error of± 1K.
2.2. Electrochemical setup
The as-prepared MG ribbons as the working electrode were elec-trically connected with copper wires, followed by mounting betweentwo glass microscope cover slips with a thin epoxy layer. The detailedprocessing of this sandwiched-like electrode is described elsewhere[24]. The surface exposed to electrolyte is the cross section of the MGribbon. Then, pit growth in the ribbon took place along the longitudinaldirection. Such a sample architecture is desirable to permit the ex situvisualisation of the grown pit under an optical microscope. The elec-trode surface exposed to the electrolyte was polished to up to 2000 gritusing SiC abrasive papers and immediately dipped into the unbuffered0.6 M NaCl solution with the electrode surface facing upward. Theexposed area of the electrode was approximately 2 × 10⁻⁴ cm2. ThepH of the test electrolyte was maintained at 6.0 ± 0.1. The tempera-ture during testing was maintained at 25 ± 1 °C using a water bath.
The experimental setup comprised a conventional three-electrodeelectrochemical cell with a platinum foil and a saturated calomelelectrode (SCE) as the counter and reference electrodes, respectively.Electrochemical measurements were carried out on an EG &G PrincetonApplied Research Model 2273 electrochemical workstation.Potentiodynamic polarisation curves were recorded at a potentialsweep rate of 1 mV/s after holding at the steady open circuit potential(OCP) for a period of 600 s in the electrolyte. To create artificial pits,pitting was initiated by the application of an anodic potential of +1.5 Vvs. SCE for 10 s. Once the pit was initiated, the applied potential wasreduced to +1 V vs. SCE and held for a certain duration to manipulatethe pit growth process. Once a desired depth was established, rapidcathodic polarisation scanning was immediately conducted at a scanrate of 25 mV/s to a final potential of −1 V vs. SCE. To determine theresistance inside the pits, high-frequency impedance measurementswere carried out at frequencies ranging from 105 Hz to 1 Hz. For eachalloy, electrochemical acquisition was repeated four times for fiveelectrodes (i.e. 20 measurements in total) to obtain data for statisticalanalysis.
The current transient analysis was counted by the peak analyser ofOrigin 9.0 software. In this study, the criterion to identify the currenttransients is defined as the condition under which the peak current is atleast three folds greater than the amplitude of the background current.All of the parameters used to characterise the transient response aredetermined from four repeated measurements.
2.3. Pit morphology observation
After making the artificial pits, the cross-sectional morphologies ofpits was observed ex situ by confocal laser scanning microscopy (CLSM,OLYMPUS LEXT OLS4000, Japan). The corroded samples for scanningelectron microscopy (SEM) observation were mounted between twopieces of adhesive tape using a resin. After pit growth, one side of theadhesive tape was torn off, and dipped into the resin solubilizer. By thistreatment, the species inside the pit were stuck to the remaining side ofthe adhesive tape, retaining majority of the pit environment. Thesamples were then coated with gold and dried in a desiccator prior tocharacterisation. The morphology and chemistry of the samples werecharacterized using a Zeiss Supra™ 55 Sapphire field-emission SEM(FESEM, Carl Zeiss Group, Germany), equipped with a 20 X-MaxN en-ergy-dispersive spectrometer (EDS, Oxford Instruments, UK).
3. Results
3.1. Characterisation of the amorphous nature
Fig. 1(a) shows the XRD patterns of the as-prepared glassy ribbonsof ZNA and ZCA alloys. The diffraction patterns for both alloys consist
Y. Li, J. Xu Corrosion Science 128 (2017) 73–84
74

only of a broad diffuse peak, with no distinct crystalline diffractionlines, indicative of the formation of a completely amorphous phase.Fig. 1(b) shows the DSC curves of glassy ribbons of two alloys. Withisochronous heating, the curves of the two alloys exhibit a well-definedendothermic plateau associated with the glass transition event, andsharp exothermic peaks related to the crystallisation of the amorphousphase are observed. The Tg and Tx are 697 K and 790 K and 684 K and758 K for ZNA and ZCA MGs, respectively, indicating that the Ni-bearing MG is more thermally stable than the Cu-bearing MG. Thetemperature extensions of the supercooled liquid (ΔTx = Tx − Tg) forthe ZNA and ZCA MGs are 93 K and 74 K, respectively, indicative of atypical glassy feature. The crystallisation entropy ΔHx values for ZNAand ZCA are obtained by the integral of heat release of the crystal-lisation peak are 5.7 kJ/mol and 4.6 kJ/mol, respectively.
3.2. Pitting potential
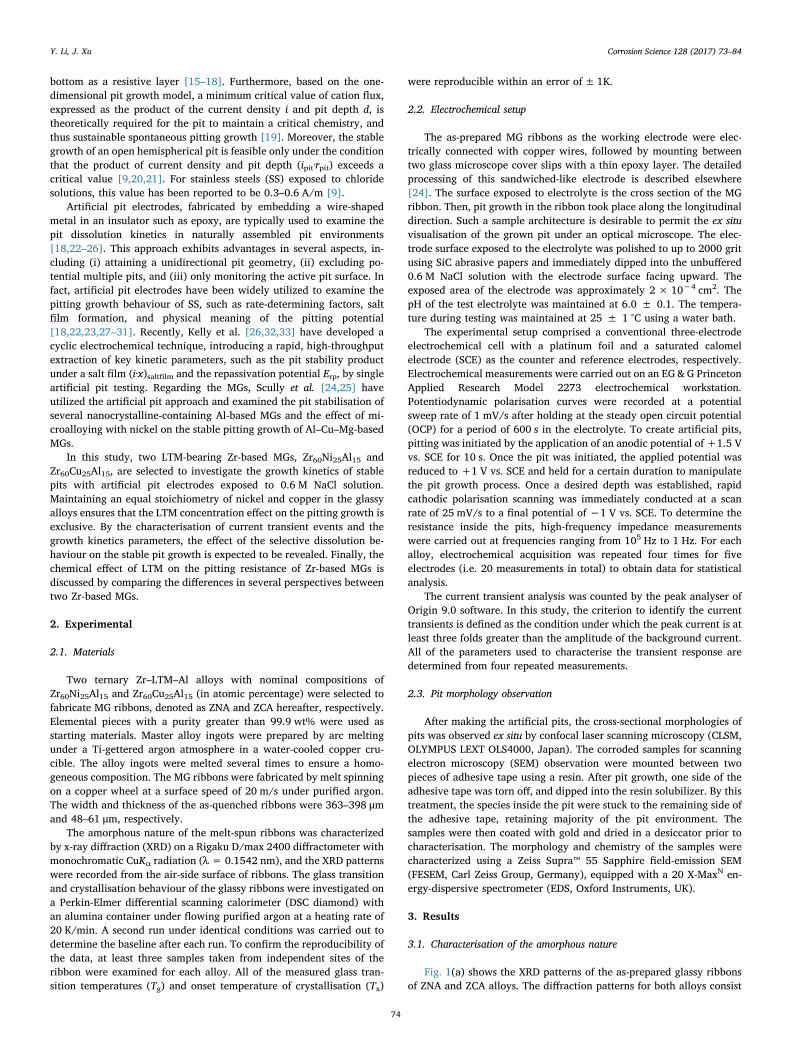
Fig. 2(a) shows the typical potentiodynamic polarisation curves ofZNA and ZCA MGs exposed to a 0.6 M NaCl solution. Notably, no sig-nificant differences in the passive current density (ipass) and corrosionpotential (Ecorr) between two MGs are observed. These values are on theorder of several μA/cm2 and approximately −570 mV vs. SCE, re-spectively. During upward scanning, both MGs exhibit typical pittingfeatures under polarisation, as indicated by that the current densityabruptly increases at a critical potential, Epit, as shown in Fig. 2(a).Regarding the scatter of the recorded Epit values for a given alloy, thedistribution of Epit from a number of measurements is more significant.
Fig. 2(b) shows the cumulative probability plot of Epit, which reflectsthe probability of a given potential at or below the value on the x-axis.The Epit for ZNA is statistically much greater than that for ZCA. Thedashed lines and shadow areas represent the average values and var-iation ranges (standard deviation) for the recorded Epit values, respec-tively. The average Epit values are 325 and −160 mV vs. SCE for ZNAand ZCA, respectively. Notably, the average Epit of ZNA is 485 mVgreater than that of ZCA. Several definitions of Epit have been proposed,namely (i) the potential above which the stable pits propagate or apotential required to maintain a salt film inside a pit [18], (ii) a po-tential at which the chemistry of the pit solution is so sufficiently ag-gressive that it makes the passive film locally unstable and then su-presses repassivation [34], or (iii) the minimum potential at whichmetastable pits become stable [35]. Essentially, the magnitude of Epitreflects a critical state for a pit to sustain stable growth. In this sense,the Cu-bearing ZCA MG has been primarily thought to reach such astate considerably easier than Ni-bearing ZNA.
3.3. Artificial pit growth
According to the obtained Epit values, it is necessary to select anappropriate potential to control the growth of artificial pits. This po-tential should meet two basic requirements. First, it must be sufficientlygreater than the Epit of each MG to ensure the diffusion-controlled pitgrowth. Newman et al. [18] have suggested that pit growth at a highpotential is controlled by diffusion, accompanied by the formation of ametal salt film at the pit bottom, whereas mixed activation or ohmiccontrol occurs at a low potential. Second, the selected potential shouldbe less than the potential of oxygen evolution on the electrode surfaceto prevent the involvement of any additional anodic reaction. For Zr-based MGs, the oxygen evolution reaction typically occurs at around1.2 V vs. SCE [3]. Considering these issues, the growth of artificial pitswas maintained at 1 V vs. SCE.
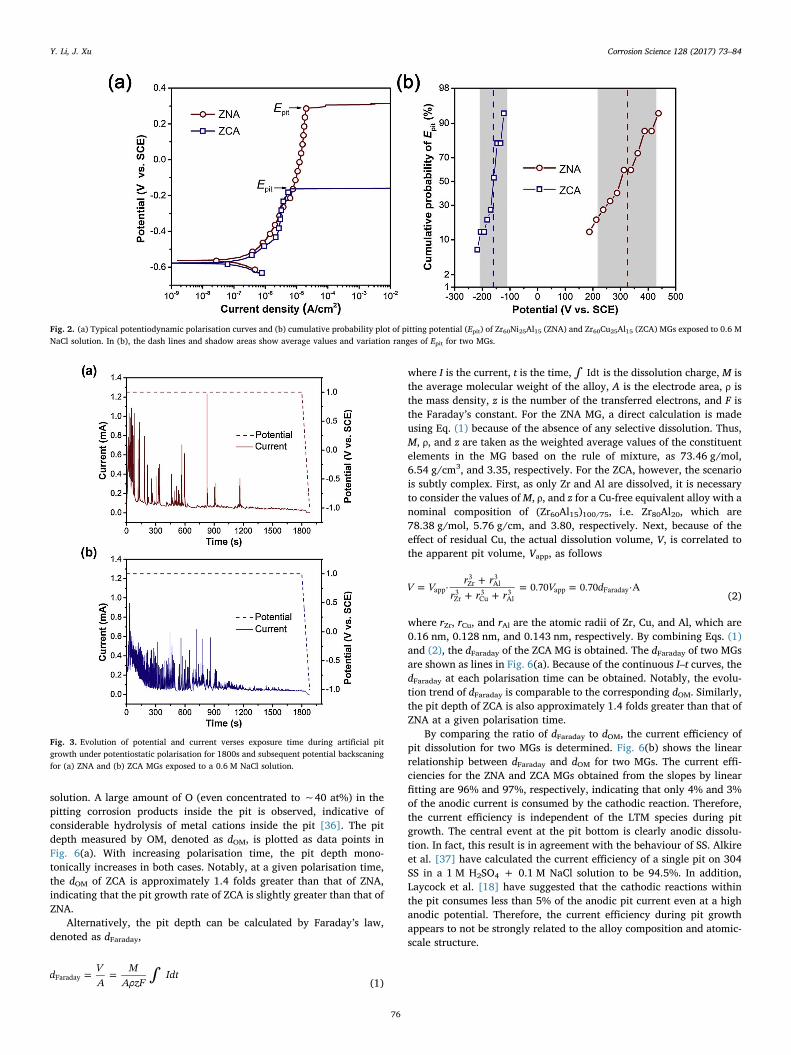
The characterisation of the artificial pit covers two distinct stages[26,27], including potentiostatic polarisation at 1 V vs. SCE to establishdiffusion-controlled pit dissolution and subsequent dropping the po-tential to −1 V vs. SCE to dissolve the salt film and render repassiva-tion. Fig. 3 shows the data of potential and current versus the exposuretime for artificial pits of two MGs with potentiostatic polarisation for1800s and subsequent potential backscaning. In the potentiostatic po-larisation regime, the current rapidly decreases during the initial 300 s,which is associated with the proceeding of diffusion-controlled pitdissolution [26]. With increasing polarisation time, a near-steady stateis attained. Notably, the current–time curves show a number of currenttransient events (Fig. 3), which are analysed in Section 3.5 in detail. Thesignificance of data within the potential backscaning regime is furtherdiscussed in Section 3.6.
3.4. Pit depth and current efficiency
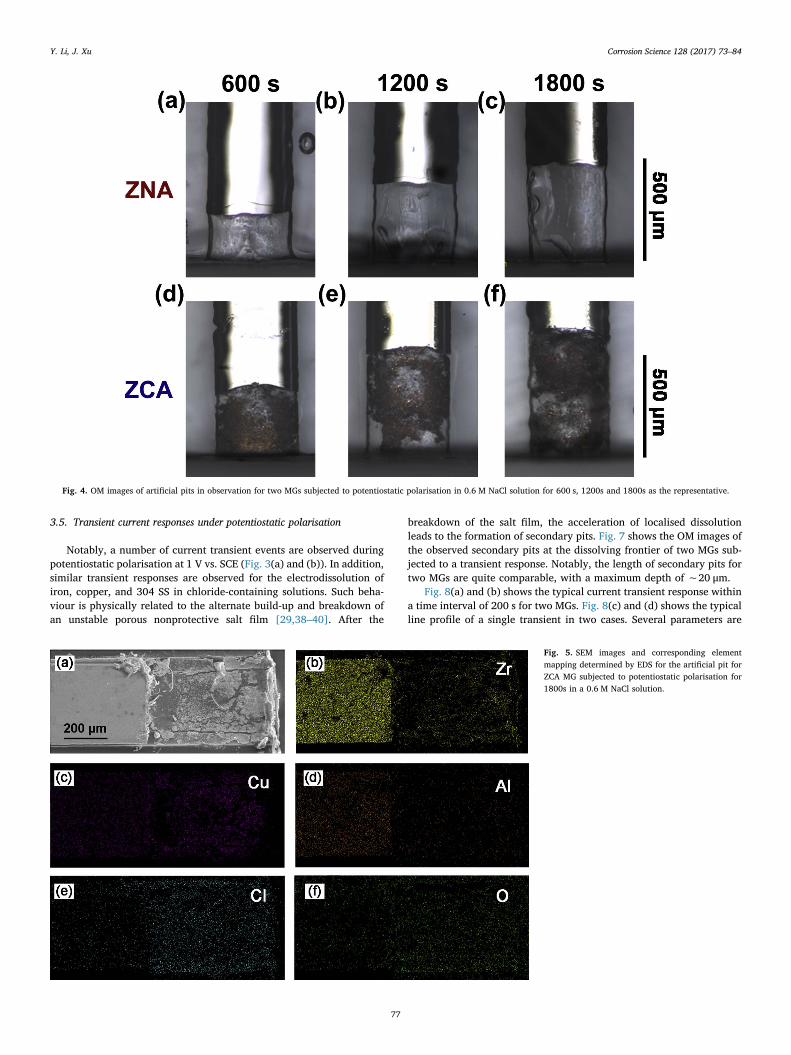
Fig. 4 shows the optical microscopy images recorded for the artifi-cial pits of two MGs, which are subjected to potentiostatic polarisationin a 0.6 M NaCl solution for different times, including 600 s, 1200s, and1800s. At polarisation times of 300 s, 900 s, and 1500s, similar ap-pearance is observed (not shown). For the ZNA MG, significant residualelement species along the pit are not detected (Fig. 4(a)–(c)). In con-trast, for the ZCA MG, considerable amounts of elemental Cu are leftover along the pit because of the selective dissolution of Zr and Al(Fig. 4(d)–(f)). Fig. 5 shows the SEM images and element maps of theartificial pit for the ZCA MG subjected to a potentiostatic polarisationtime of 1800s. The enrichment of Cu (Fig. 5(c)) and depletion of Zr andAl (Fig. 5(b) and (d)) within the pit with respect to the bulk matrix areobserved. The ratio of [Cu]/([Zr]+ [Cu]+ [Al]) inside the pit increasesup to 80 at%, where [j] is the atomic percentage of element j. In ad-dition, a small amount of Zr and Al as well as Cl (Fig. 5(e)) are detectedinside the pit, probably originating from the Cl−-concentrated pit
Fig. 1. (a) XRD patterns taken from air sides and (b) DSC scans of melt-spun ribbons forZr60Ni25Al15 and Zr60Cu25Al15 MGs.
Y. Li, J. Xu Corrosion Science 128 (2017) 73–84
75
solution. A large amount of O (even concentrated to ∼40 at%) in thepitting corrosion products inside the pit is observed, indicative ofconsiderable hydrolysis of metal cations inside the pit [36]. The pitdepth measured by OM, denoted as dOM, is plotted as data points inFig. 6(a). With increasing polarisation time, the pit depth mono-tonically increases in both cases. Notably, at a given polarisation time,the dOM of ZCA is approximately 1.4 folds greater than that of ZNA,indicating that the pit growth rate of ZCA is slightly greater than that ofZNA.
Alternatively, the pit depth can be calculated by Faraday’s law,denoted as dFaraday,
∫= =d VA
MAρzF
IdtFaraday(1)
where I is the current, t is the time, ∫ Idt is the dissolution charge, M isthe average molecular weight of the alloy, A is the electrode area, ρ isthe mass density, z is the number of the transferred electrons, and F isthe Faraday’s constant. For the ZNA MG, a direct calculation is madeusing Eq. (1) because of the absence of any selective dissolution. Thus,M, ρ, and z are taken as the weighted average values of the constituentelements in the MG based on the rule of mixture, as 73.46 g/mol,6.54 g/cm3, and 3.35, respectively. For the ZCA, however, the scenariois subtly complex. First, as only Zr and Al are dissolved, it is necessaryto consider the values ofM, ρ, and z for a Cu-free equivalent alloy with anominal composition of (Zr60Al15)100/75, i.e. Zr80Al20, which are78.38 g/mol, 5.76 g/cm, and 3.80, respectively. Next, because of theeffect of residual Cu, the actual dissolution volume, V, is correlated tothe apparent pit volume, Vapp, as follows
=+
+ += =V V
r rr r r
V d· 0.70 0.70 ·AappZr3
Al3
Zr3
Cu3
Al3 app Faraday
(2)
where rZr, rCu, and rAl are the atomic radii of Zr, Cu, and Al, which are0.16 nm, 0.128 nm, and 0.143 nm, respectively. By combining Eqs. (1)and (2), the dFaraday of the ZCA MG is obtained. The dFaraday of two MGsare shown as lines in Fig. 6(a). Because of the continuous I–t curves, thedFaraday at each polarisation time can be obtained. Notably, the evolu-tion trend of dFaraday is comparable to the corresponding dOM. Similarly,the pit depth of ZCA is also approximately 1.4 folds greater than that ofZNA at a given polarisation time.
By comparing the ratio of dFaraday to dOM, the current efficiency ofpit dissolution for two MGs is determined. Fig. 6(b) shows the linearrelationship between dFaraday and dOM for two MGs. The current effi-ciencies for the ZNA and ZCA MGs obtained from the slopes by linearfitting are 96% and 97%, respectively, indicating that only 4% and 3%of the anodic current is consumed by the cathodic reaction. Therefore,the current efficiency is independent of the LTM species during pitgrowth. The central event at the pit bottom is clearly anodic dissolu-tion. In fact, this result is in agreement with the behaviour of SS. Alkireet al. [37] have calculated the current efficiency of a single pit on 304SS in a 1 M H2SO4 + 0.1 M NaCl solution to be 94.5%. In addition,Laycock et al. [18] have suggested that the cathodic reactions withinthe pit consumes less than 5% of the anodic pit current even at a highanodic potential. Therefore, the current efficiency during pit growthappears to not be strongly related to the alloy composition and atomic-scale structure.
Fig. 2. (a) Typical potentiodynamic polarisation curves and (b) cumulative probability plot of pitting potential (Epit) of Zr60Ni25Al15 (ZNA) and Zr60Cu25Al15 (ZCA) MGs exposed to 0.6 MNaCl solution. In (b), the dash lines and shadow areas show average values and variation ranges of Epit for two MGs.
Fig. 3. Evolution of potential and current verses exposure time during artificial pitgrowth under potentiostatic polarisation for 1800s and subsequent potential backscaningfor (a) ZNA and (b) ZCA MGs exposed to a 0.6 M NaCl solution.
Y. Li, J. Xu Corrosion Science 128 (2017) 73–84
76
3.5. Transient current responses under potentiostatic polarisation
Notably, a number of current transient events are observed duringpotentiostatic polarisation at 1 V vs. SCE (Fig. 3(a) and (b)). In addition,similar transient responses are observed for the electrodissolution ofiron, copper, and 304 SS in chloride-containing solutions. Such beha-viour is physically related to the alternate build-up and breakdown ofan unstable porous nonprotective salt film [29,38–40]. After the
breakdown of the salt film, the acceleration of localised dissolutionleads to the formation of secondary pits. Fig. 7 shows the OM images ofthe observed secondary pits at the dissolving frontier of two MGs sub-jected to a transient response. Notably, the length of secondary pits fortwo MGs are quite comparable, with a maximum depth of ∼20 μm.
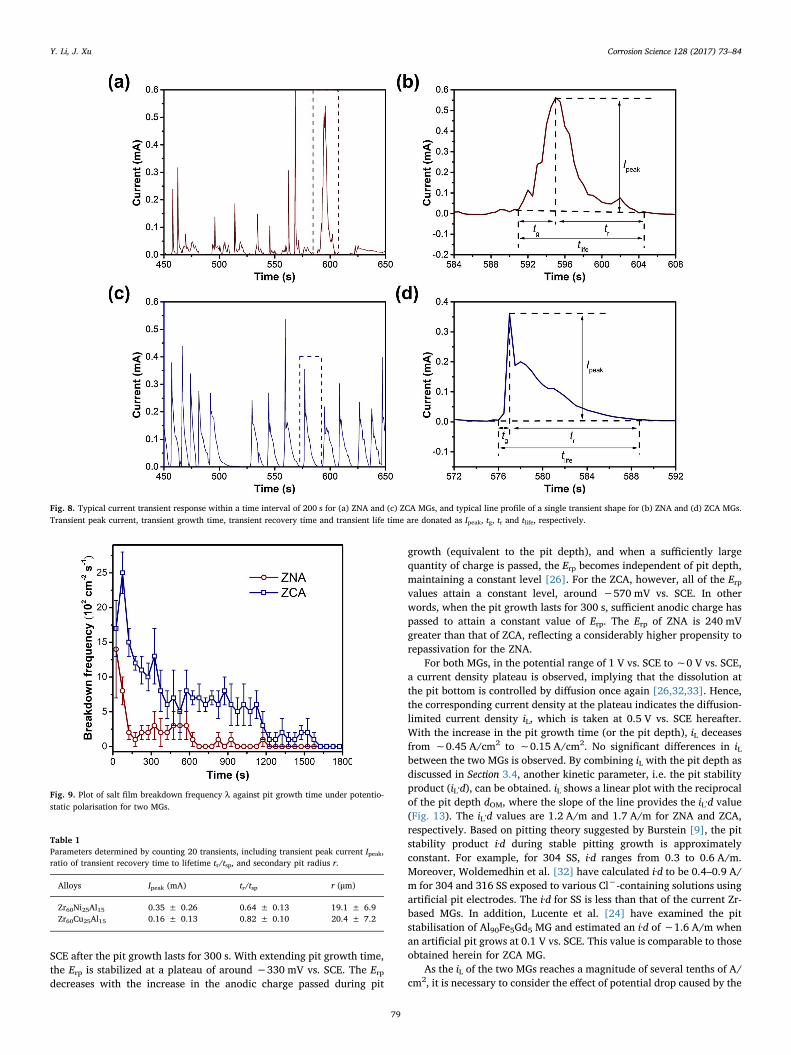
Fig. 8(a) and (b) shows the typical current transient response withina time interval of 200 s for two MGs. Fig. 8(c) and (d) shows the typicalline profile of a single transient in two cases. Several parameters are
Fig. 4. OM images of artificial pits in observation for two MGs subjected to potentiostatic polarisation in 0.6 M NaCl solution for 600 s, 1200s and 1800s as the representative.
Fig. 5. SEM images and corresponding elementmapping determined by EDS for the artificial pit forZCA MG subjected to potentiostatic polarisation for1800s in a 0.6 M NaCl solution.
Y. Li, J. Xu Corrosion Science 128 (2017) 73–84
77

used for quantitative characterisation, including the transient peakcurrent Ipeak, transient growth time tg, transient recovery time tr, andtransient lifetime tlife. Apparently, three significant distinctions areobserved: (i) the number of current transients for ZCA is greater thanthat for ZNA, (ii) the magnitude of current transients for ZNA is greaterthan that for ZCA, and (iii) the transients of ZCA show typical char-acteristics of a sudden jump followed by a gentle decay.
As the current transient is correlated to the salt film breakdown, thesalt film breakdown frequency λ is defined as
=λ NA t· interval (3)
where N is the transient number at a certain time interval, tinterval, and A
is the surface area. Fig. 9 shows the λ of two MGs at a tinterval of 50 s.The scattered data reflect that the breakdown of the salt film is a highlystochastic process. λ decreases with the increase of the pit growth timein both cases, probably corresponding to the thickening of the salt filmand high difficulty for breakdown [41]. At a given time, the λ of ZCA isseveral folds greater than that of ZNA, indicating that the salt filmbreakdown is more favourable on ZCA compared to ZNA. Furthermore,the current transient of ZNA rarely occurs after the pit growth lasts for∼600 s, roughly corresponding to a pit depth of 250 μm. For ZCA, thepit growth lasts for 1200s to reach the same scenario, with a corre-sponding pit depth of ∼510 μm.
By selecting a single transient with intervals of 30 s and 60 s, a totalof 20 transients are counted for ZNA and ZCA MGs, respectively. Thestatistical analysis of Ipeak, ratio of the transient recovery time to life-time (tr/tlife), and secondary pit radius (r) is performed. Table 1 sum-marizes the average values and standard deviation for these para-meters. Fig. 10(a) shows the cumulative distribution of Ipeak for the twoMGs. The Ipeak of ZNA is greater than that of ZCA with statistical sig-nificance. The average Ipeak values for ZNA and ZCA are 0.35 mA and0.16 mA, respectively, indicating that the accelerated localised dis-solution of ZNA is more rapid compared to ZCA. Fig. 10(b) shows thecumulative distribution of tr/tlife for the two MGs. The tr/tlife for ZCA isgreater than that for ZCA, indicating that the salt film on ZCA is con-siderably more difficult to be regenerated compared to that on ZNA. Bythe combination of integral charges for the current transient andFaraday’s law, the volume of secondary pits can be estimated. Based onthe assumption that secondary pits are shaped as a semi-circularcolumn (inset in Fig. 10(c)), the radius of the secondary pit (r) is cal-culated by the following equation,
∫=rd
MρzF
I dt2π
·(4)
where d is the thickness of the ribbon sample, taken as 50 μm. Here, it isnecessary to consider the effect of the selective dissolution behaviourfor ZCA. Fig. 10(c) shows the cumulative distribution of the secondarypit radius for the two MGs. Notably, the r of two MGs is quite com-parable without significant differences, at a level of ∼20 μm.
3.6. Kinetic parameters of pit growth
Fig. 11 shows the backscaning potentiodynamic polarisation curvesof the two MGs after the completion of pit growth for several periods.Decreasing the potential leads to the dissolution of the salt film and therepassivation of MGs. For the ZNA MG, an apparent repassivationtransition occurs. At the repassivation potential (Erp), the current den-sity suddenly decreases by two orders of magnitude. However, no ob-vious transition is observed for ZCA. For comparison, the potential atwhich the current density decreases by two orders of magnitude isdetermined as Erp. Fig. 12 shows a plot of Erp against the pit growthtime of the two MGs. Notably, the Erp of ZNA is around −180 mV vs.
Fig. 6. (a) Plot of dOM as symbols and dFaraday as lines against pit growth time underpotentiostatic polarisation for two MGs. (b) Plot of relationship between dOM and dFaradayat a given time for two MGs.
Fig. 7. OM images in observation of secondary pitsat dissolving frontier for (a) ZNA and (b) ZCA MGssubjected to a current transient response.
Y. Li, J. Xu Corrosion Science 128 (2017) 73–84
78
SCE after the pit growth lasts for 300 s. With extending pit growth time,the Erp is stabilized at a plateau of around −330 mV vs. SCE. The Erpdecreases with the increase in the anodic charge passed during pit
growth (equivalent to the pit depth), and when a sufficiently largequantity of charge is passed, the Erp becomes independent of pit depth,maintaining a constant level [26]. For the ZCA, however, all of the Erpvalues attain a constant level, around −570 mV vs. SCE. In otherwords, when the pit growth lasts for 300 s, sufficient anodic charge haspassed to attain a constant value of Erp. The Erp of ZNA is 240 mVgreater than that of ZCA, reflecting a considerably higher propensity torepassivation for the ZNA.
For both MGs, in the potential range of 1 V vs. SCE to ∼0 V vs. SCE,a current density plateau is observed, implying that the dissolution atthe pit bottom is controlled by diffusion once again [26,32,33]. Hence,the corresponding current density at the plateau indicates the diffusion-limited current density iL, which is taken at 0.5 V vs. SCE hereafter.With the increase in the pit growth time (or the pit depth), iL deceasesfrom ∼0.45 A/cm2 to ∼0.15 A/cm2. No significant differences in iLbetween the two MGs is observed. By combining iL with the pit depth asdiscussed in Section 3.4, another kinetic parameter, i.e. the pit stabilityproduct (iL·d), can be obtained. iL shows a linear plot with the reciprocalof the pit depth dOM, where the slope of the line provides the iL·d value(Fig. 13). The iL·d values are 1.2 A/m and 1.7 A/m for ZNA and ZCA,respectively. Based on pitting theory suggested by Burstein [9], the pitstability product i·d during stable pitting growth is approximatelyconstant. For example, for 304 SS, i·d ranges from 0.3 to 0.6 A/m.Moreover, Woldemedhin et al. [32] have calculated i·d to be 0.4–0.9 A/m for 304 and 316 SS exposed to various Cl−-containing solutions usingartificial pit electrodes. The i·d for SS is less than that of the current Zr-based MGs. In addition, Lucente et al. [24] have examined the pitstabilisation of Al90Fe5Gd5 MG and estimated an i·d of ∼1.6 A/m whenan artificial pit grows at 0.1 V vs. SCE. This value is comparable to thoseobtained herein for ZCA MG.
As the iL of the two MGs reaches a magnitude of several tenths of A/cm2, it is necessary to consider the effect of potential drop caused by the
Fig. 8. Typical current transient response within a time interval of 200 s for (a) ZNA and (c) ZCA MGs, and typical line profile of a single transient shape for (b) ZNA and (d) ZCA MGs.Transient peak current, transient growth time, transient recovery time and transient life time are donated as Ipeak, tg, tr and tlife, respectively.
Fig. 9. Plot of salt film breakdown frequency λ against pit growth time under potentio-static polarisation for two MGs.
Table 1Parameters determined by counting 20 transients, including transient peak current Ipeak,ratio of transient recovery time to lifetime tr/tsp, and secondary pit radius r.
Alloys Ipeak (mA) tr/tsp r (μm)
Zr60Ni25Al15 0.35 ± 0.26 0.64 ± 0.13 19.1 ± 6.9Zr60Cu25Al15 0.16 ± 0.13 0.82 ± 0.10 20.4 ± 7.2
Y. Li, J. Xu Corrosion Science 128 (2017) 73–84
79
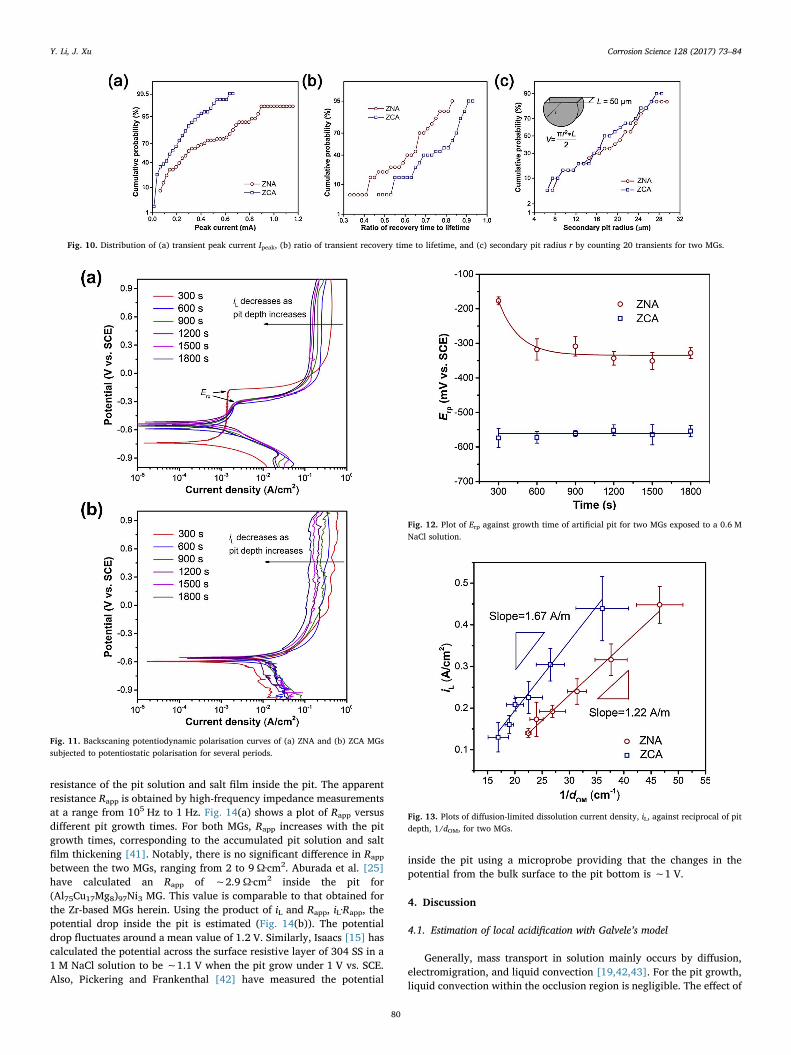
resistance of the pit solution and salt film inside the pit. The apparentresistance Rapp is obtained by high-frequency impedance measurementsat a range from 105 Hz to 1 Hz. Fig. 14(a) shows a plot of Rapp versusdifferent pit growth times. For both MGs, Rapp increases with the pitgrowth times, corresponding to the accumulated pit solution and saltfilm thickening [41]. Notably, there is no significant difference in Rapp
between the two MGs, ranging from 2 to 9 Ω·cm2. Aburada et al. [25]have calculated an Rapp of ∼2.9 Ω·cm2 inside the pit for(Al75Cu17Mg8)97Ni3 MG. This value is comparable to that obtained forthe Zr-based MGs herein. Using the product of iL and Rapp, iL·Rapp, thepotential drop inside the pit is estimated (Fig. 14(b)). The potentialdrop fluctuates around a mean value of 1.2 V. Similarly, Isaacs [15] hascalculated the potential across the surface resistive layer of 304 SS in a1 M NaCl solution to be ∼1.1 V when the pit grow under 1 V vs. SCE.Also, Pickering and Frankenthal [42] have measured the potential
inside the pit using a microprobe providing that the changes in thepotential from the bulk surface to the pit bottom is ∼1 V.
4. Discussion
4.1. Estimation of local acidification with Galvele’s model
Generally, mass transport in solution mainly occurs by diffusion,electromigration, and liquid convection [19,42,43]. For the pit growth,liquid convection within the occlusion region is negligible. The effect of
Fig. 10. Distribution of (a) transient peak current Ipeak, (b) ratio of transient recovery time to lifetime, and (c) secondary pit radius r by counting 20 transients for two MGs.
Fig. 11. Backscaning potentiodynamic polarisation curves of (a) ZNA and (b) ZCA MGssubjected to potentiostatic polarisation for several periods.
Fig. 12. Plot of Erp against growth time of artificial pit for two MGs exposed to a 0.6 MNaCl solution.
Fig. 13. Plots of diffusion-limited dissolution current density, iL, against reciprocal of pitdepth, 1/dOM, for two MGs.
Y. Li, J. Xu Corrosion Science 128 (2017) 73–84
80

electromigration within the pit is less predominant. For a 1-mm-deeppit, the potential drop caused by electromigration is approximately67 mV [33]. This value is considerably less than that caused by thediffusion effect ( > 1 V). In this sense, in the local acidification modelproposed by Galvele [19], only the diffusion equation is consideredduring the mass transfer, whereas the contributions from electro-migration and liquid convection are neglected. Based on this model, theion concentrations at the pit bottom are estimated for the ZNA and ZCAMGs.
The pit geometry during pit growth is assumed to be one-dimen-sional (Fig. 15). Two reactions, the anodic dissolution of the metal andthe first-order hydrolysis of the metal cation, are considered at the pitbottom, namely,
→ ++ −nM M en (5)
+ ↔ ++ + +M H O M(OH) Hn2
(n-1) (6)
Meanwhile, the equilibrium of hydrolysis is assumed to be rapidlyattained. Regarding Eq. (6), the flux equations of the species containingO, H, and M atoms are expressed as follows,
+ =+
+
DdC
dxD
dC
dx0H O
H OM(OH)
M(OH)2
2(n-1)
(n-1)
(7)
+ + =+
+
++
DdC
dxD
dC
dxD
dCdx
2 0H OH O
M(OH)M(OH)
HH
22
(n-1)(n-1)
(8)
+ =++
+
+
DdC
dxD
dC
dxizFM
MM(OH)
M(OH) Lnn
(n-1)(n-1)
(9)
where Dj is the diffusion coefficient of species j, and Cj is the con-centration of species j. In Eq. (9), the right-hand term i
zFL is the amount
of freshly generated metal cation. Combining Eqs. (7), (8), and (9) andeliminating the terms of the H2O and M(OH)(n−1)+ species, the fluxequation of the metal cation and H+ is expressed as follows
+ =++
++
DdC
dxD
dCdx
izF
,MM
HH Ln
n
(10)
By taking the line integral along the pit depth, the relationshipbetween +CMn and +CH is obtained as follows:
+ = ++ + + +D C D C i dzF
x· ,M M H HL
1n n(11)
where x1 is the boundary condition when d = 0, which is the product of+CH in the bulk solution and +DH . Generally, the solution at the pit
bottom is mostly saturated by metal chloride [11]. Thus, the +CMn in Eq.(11) is taken from the weighted average concentration of the saturatedmetal chloride, +CM ,satn , of each element in the MG. Table 2 summarizesthe relevant constants and parameters used for the model. Herein, no-tably, +CM ,satn is taken from an equivalent binary MG with a nominalcomposition of Zr80Al20 without copper for ZCA. Then, for ZNA andZCA MGs, the CZNA,sat and CZCA,sat are 3.38 M and 2.9 M, respectively.Based on Eq. (11), the calculated +CH ,ZNA and +CH ,ZCA for ZNA and ZCAMGs are 0.04 M and 0.18 M, respectively. The converted pH values are1.3 and 0.8, respectively. For comparison, notably, the measured pH ofsolution in the occluded cells (in the form of pits or crevices) for severalaustenitic SS is known to range from −0.13 to 2.0 [44,45]. This resultindicated that the local acidity in the pits of two MGs is comparable tothat of SS. According to the calculated pH, the acidity of the pit solutionfor Cu-bearing ZCA is greater than that for Ni-bearing ZNA MG, in-dicating that the pit solution is more aggressive for ZCA.
4.2. Differences in the pit growth kinetics
Our results indicated that the two investigated MGs, ZNA and ZCA,exhibit apparently different features either in the initial stage or in thesteady stage of stable pitting growth. Fig. 16 shows the schematicgraphs to describe the diffusion-controlled pit growth for two MGs. Forcomparison purposes, Table 3 summarizes remarkable differences in
Fig. 14. (a) Apparent resistance, Rapp, and (b) corresponding IR-drop versus severalperiods of potentiostatic polarisation for two MGs.
Fig. 15. Schematic diagram of pit geometry based on Galvele’s localised acidificationmodel.
Table 2Several constants and parameters used in calculation with localised acidification modelfor two Zr-based MGs.
Parameter Value Units Refs.
+DMn 10−9 m2/s [19]+DH 9.3 × 10⁻⁹ m2/s [19]
+CZr4 ,sat . 2.85 mol/L [47]
+CAl3 ,sat 3.11 mol/L [41]
+CNi2 ,sat 4.8 mol/L [48]
Dj: diffusion coefficient of species j; +CMn ,sat : saturated concentration of metal chloride.
Y. Li, J. Xu Corrosion Science 128 (2017) 73–84
81
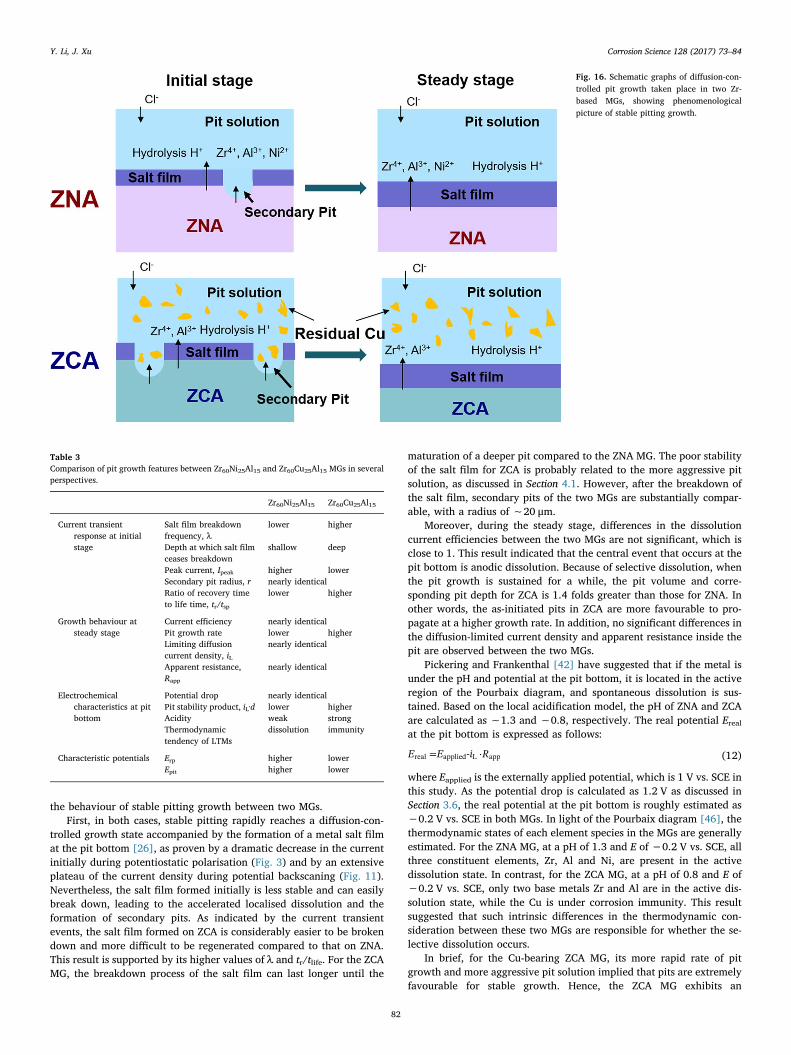
the behaviour of stable pitting growth between two MGs.First, in both cases, stable pitting rapidly reaches a diffusion-con-
trolled growth state accompanied by the formation of a metal salt filmat the pit bottom [26], as proven by a dramatic decrease in the currentinitially during potentiostatic polarisation (Fig. 3) and by an extensiveplateau of the current density during potential backscaning (Fig. 11).Nevertheless, the salt film formed initially is less stable and can easilybreak down, leading to the accelerated localised dissolution and theformation of secondary pits. As indicated by the current transientevents, the salt film formed on ZCA is considerably easier to be brokendown and more difficult to be regenerated compared to that on ZNA.This result is supported by its higher values of λ and tr/tlife. For the ZCAMG, the breakdown process of the salt film can last longer until the
maturation of a deeper pit compared to the ZNA MG. The poor stabilityof the salt film for ZCA is probably related to the more aggressive pitsolution, as discussed in Section 4.1. However, after the breakdown ofthe salt film, secondary pits of the two MGs are substantially compar-able, with a radius of ∼20 μm.
Moreover, during the steady stage, differences in the dissolutioncurrent efficiencies between the two MGs are not significant, which isclose to 1. This result indicated that the central event that occurs at thepit bottom is anodic dissolution. Because of selective dissolution, whenthe pit growth is sustained for a while, the pit volume and corre-sponding pit depth for ZCA is 1.4 folds greater than those for ZNA. Inother words, the as-initiated pits in ZCA are more favourable to pro-pagate at a higher growth rate. In addition, no significant differences inthe diffusion-limited current density and apparent resistance inside thepit are observed between the two MGs.
Pickering and Frankenthal [42] have suggested that if the metal isunder the pH and potential at the pit bottom, it is located in the activeregion of the Pourbaix diagram, and spontaneous dissolution is sus-tained. Based on the local acidification model, the pH of ZNA and ZCAare calculated as ∼1.3 and ∼0.8, respectively. The real potential Erealat the pit bottom is expressed as follows:
= ⋅E E i R-real applied L app (12)
where Eapplied is the externally applied potential, which is 1 V vs. SCE inthis study. As the potential drop is calculated as 1.2 V as discussed inSection 3.6, the real potential at the pit bottom is roughly estimated as−0.2 V vs. SCE in both MGs. In light of the Pourbaix diagram [46], thethermodynamic states of each element species in the MGs are generallyestimated. For the ZNA MG, at a pH of 1.3 and E of −0.2 V vs. SCE, allthree constituent elements, Zr, Al and Ni, are present in the activedissolution state. In contrast, for the ZCA MG, at a pH of 0.8 and E of−0.2 V vs. SCE, only two base metals Zr and Al are in the active dis-solution state, while the Cu is under corrosion immunity. This resultsuggested that such intrinsic differences in the thermodynamic con-sideration between these two MGs are responsible for whether the se-lective dissolution occurs.
In brief, for the Cu-bearing ZCA MG, its more rapid rate of pitgrowth and more aggressive pit solution implied that pits are extremelyfavourable for stable growth. Hence, the ZCA MG exhibits an
Fig. 16. Schematic graphs of diffusion-con-trolled pit growth taken place in two Zr-based MGs, showing phenomenologicalpicture of stable pitting growth.
Table 3Comparison of pit growth features between Zr60Ni25Al15 and Zr60Cu25Al15 MGs in severalperspectives.
Zr60Ni25Al15 Zr60Cu25Al15
Current transientresponse at initialstage
Salt film breakdownfrequency, λ
lower higher
Depth at which salt filmceases breakdown
shallow deep
Peak current, Ipeak higher lowerSecondary pit radius, r nearly identicalRatio of recovery timeto life time, tr/tsp
lower higher
Growth behaviour atsteady stage
Current efficiency nearly identicalPit growth rate lower higherLimiting diffusioncurrent density, iL
nearly identical
Apparent resistance,Rapp
nearly identical
Electrochemicalcharacteristics at pitbottom
Potential drop nearly identicalPit stability product, iL·d lower higherAcidity weak strongThermodynamictendency of LTMs
dissolution immunity
Characteristic potentials Erp higher lowerEpit higher lower
Y. Li, J. Xu Corrosion Science 128 (2017) 73–84
82
apparently weaker pitting resistance compared to the ZNA MG, as di-rectly highlighted by its considerably lower Epit and Erp. In other words,in LTM-bearing Zr-based MGs, the dependence of the pitting resistanceon the LTM species is intrinsically related to the significantly differentpitting growth behaviours.
5. Conclusions
By virtue of artificial pit electrode approach, different growth be-haviours of stable pits between two LTM-bearing Zr-based MGs,Zr60Ni25Al15 and Zr60Cu25Al15, respectively, exposed to a 0.6 M NaClsolution were revealed, as highlighted by the following aspects.
(i) By characterising the current transient events at the initial stageof stable pitting growth, the salt film formed on the Zr60Cu25Al15 MG isbroken down considerably easier than Zr60Ni25Al15, as well as is moredifficult to be regenerated. After the breakdown of the salt film, how-ever, substantially comparable secondary pits are formed on both MGs.
(ii) Because of the occurrence of the selective dissolution of base-metal elements such as zirconium and aluminium, the pit growth rate ofZr60Cu25Al15 MG is greater than that of Zr60Ni25Al15 MG. No significantdifferences in the dissolution current efficiency, diffusion-limited cur-rent density, apparent resistance inside pits, and the correspondingpotential drop are observed between the two MGs. The iL·d values forthe pit stability products of Zr60Ni25Al15 and Zr60Cu25Al15 MGs are1.2 A/m and 1.7 A/m, respectively. Combined with the local acid-ification model, the converted pH values at the pit bottom are 1.3 and0.8, respectively, indicating that the Zr60Cu25Al15 suffers a more ag-gressive pit solution.
(iii) Under the estimated pH and real potential at the pit bottom, allthree constituent elements in Zr60Ni25Al15 fall within the active dis-solution state based on thermodynamic considerations. In contrast, forthe Zr60Cu25Al15 MG, only two base metals zirconium and aluminiumare in the active dissolution state, while copper is under corrosionimmunity. Such differences are responsible for whether selective dis-solution occurs.
In summary, the stable pitting growth for Zr60Cu25Al15 MG is con-siderably more favourable compared to Zr60Ni25Al15 because of itsmore rapid growth rate and more aggressive pit solution. Such a dif-ference in the kinetic behaviour also directly correlates to the indicationof pitting potential (Epit) in that the latter is considerably greater thanthe former (∼485 mV). As a result, the effect of the LTM species inZr–LTM–Al MGs on the pitting resistance is intrinsically related to theirdifferent pitting growth kinetics.
Acknowledgements
The authors gratefully acknowledge the stimulating discussionswith Dr. Bo Zhang. This work was supported by the National NaturalScience Foundation of China under Grant No. 51171180.
References
[1] J.R. Scully, A. Gebert, J.H. Payer, Corrosion and related mechanical properties ofbulk metallic glasses, J. Mater. Res. 22 (2006) 302–313.
[2] K. Hashimoto, What we have learned from studies on chemical properties ofamorphous alloys? Appl. Surf. Sci. 257 (2011) 8141–8150.
[3] A. Gebert, K. Buchholz, A. Leonhard, K. Mummert, J. Eckert, L. Schultz,Investigations on the electrochemical behaviour of Zr-based bulk metallic glasses,Mater. Sci. Eng. 267 (1999) 294–300.
[4] S. Hiromoto, A.P. Tsai, M. Sumita, T. Hanawa, Effect of chloride ion on the anodicpolarization behavior of the Zr65Al7.5Ni10Cu17.5 amorphous alloy in phosphatebuffered solution, Corros. Sci. 42 (2000) 1651–1660.
[5] U.K. Mudali, S. Baunack, J. Eckert, L. Schultz, A. Gebert, Pitting corrosion of bulkglass-forming zirconium-based alloys, J. Alloys Compd. 377 (2004) 290–297.
[6] B.A. Green, H.M. Meyer, R.S. Benson, Y. Yokoyama, P.K. Liaw, C.T. Liu, A study ofthe corrosion behaviour of Zr50Cu(40-X)Al10PdX bulk metallic glasses with scanningAuger microanalysis, Corros. Sci. 50 (2008) 1825–1832.
[7] A. Kawashima, K. Ohmura, Y. Yokoyama, A. Inoue, The corrosion behaviour of Zr-based bulk metallic glasses in 0.5 M NaCl solution, Corros. Sci. 53 (2011)2778–2784.
[8] Y. Li, J. Xu, Role of late transition metals on pitting resistance of Zr-Ti-(Cu, Ni, Co)-Al bulk metallic glasses in 0 .6 M NaCl aqueous solution, J. Mater. Sci. Technol.(2017), http://dx.doi.org/10.1016/j.jmst.2017.04.010.
[9] P.C. Pistorius, G.T. Burstein, Metastable pitting corrosion of stainless steel and thetransition to stability, Philos. Trans. R. Soc. Lond. Ser. A: Phys. and Eng. Sci. 341(1992) 531–559.
[10] G.S. Frankel, Pitting corrosion of metals, J. Electrochem. Soc. 145 (1998)2186–2198.
[11] J. Soltis, Passivity breakdown, pit initiation and propagation of pits in metallicmaterials − Review, Corros. Sci. 90 (2015) 5–22.
[12] G.T. Burstein, C. Liu, R.M. Souto, S.P. Vines, Origins of pitting corrosion, Corro.Eng. Sci. Technol. 39 (2004) 25–30.
[13] A. Gebert, P.F. Gostin, M. Uhlemann, J. Eckert, L. Schultz, Interactions betweenmechanically generated defects and corrosion phenomena of Zr-based bulk metallicglasses, Acta Mater. 60 (2012) 2300–2309.
[14] G.T. Burstein, P.C. Pistorius, S.P. Mattin, The nucleation and growth of corrosionpits on stainless steel, Corros. Sci. 35 (1993) 57–62.
[15] H.S. Isaacs, The behavior of resistive layers in the localized corrosion of stainlesssteel, J. Electrochem. Soc. 120 (1973) 1456–1462.
[16] T.R. Beck, R.C. Alkire, Occurrence of salt films during initiation and growth ofcorrosion pits, J. Electrochem. Soc. 126 (1979) 1662–1666.
[17] T. Beck, H.S. Isaacs, U. Bertocci, J. Kruger, S. Smialowska (Eds.), Occurrence andProperties of Anodic Salt Films in Pitting Corrosion, Advances in LocalizedCorrosion, NACE, Houston, TX, 1987, p. 85 (1990).
[18] N.J. Laycock, R.C. Newman, Localised dissolution kinetics, salt films and pittingpotentials, Corros. Sci. 39 (1997) 1771–1790.
[19] J.R. Galvele, Transport processes and the mechanism of pitting of metals, J.Electrochem. Soc. 123 (1976) 464–474.
[20] P.C. Pistorius, G.T. Burstein, Growth of corrosion pits on stainless steel in chloridesolution containing dilute sulphate, Corros. Sci. 33 (1992) 1885–1897.
[21] G. Burstein, S. Mattin, Nucleation of corrosion pits on stainless steel, Philos. Mag.lett. 66 (1992) 127–131.
[22] N. Laycock, R. Newman, The use of pitting transients to test microscopic models oflocalized corrosion, Mater. Sci. Forum (1995) 649–662.
[23] M.H. Moayed, R.C. Newman, The relationship between pit chemistry and pit geo-metry near the critical pitting temperature, J. Electrochem. Soc. 153 (2006)B330–B335.
[24] A.M. Lucente, J.R. Scully, Localized corrosion of Al-based amorphous-nanocrys-talline alloys with solute-lean nanocrystals: pit stabilization, J. Electrochem. Soc.155 (2008) C234–C243.
[25] T. Aburada, J.M. Fitz-Gerald, J.R. Scully, Pitting and dealloying of solute-rich Al-Cu-Mg-based amorphous alloys: effect of alloying with minor concentrations ofnickel, J. Electrochem. Soc. 158 (2011) C253–C265.
[26] J. Srinivasan, M.J. McGrath, R.G. Kelly, A high-throughput artificial pit techniqueto measure kinetic parameters for pitting stability, J. Electrochem. Soc. 162 (2015)C725–C731.
[27] R.C. Newman, The dissolution and passivation kinetics of stainless alloys containingmolybdenum-II. Dissolution kinetics in artificial pits, Corros. Sci. 25 (1985)341–350.
[28] G. Gaudet, W. Mo, T. Hatton, J. Tester, J. Tilly, H.S. Isaacs, R. Newman, Masstransfer and electrochemical kinetic interactions in localized pitting corrosion,AIChE J. 32 (1986) 949–958.
[29] R.C. Newman, M.A.A. Ajjawi, A micro-electrode study of the nitrate effect on pittingof stainless steels, Corros. Sci. 26 (1986) 1057–1063.
[30] R.C. Newman, M.A.A. Ajjawi, H. Ezuber, S. Turgoose, An experimental confirma-tion of the pitting potential model of galvele, Corros. Sci. 28 (1988) 471–477.
[31] H. Ezuber, A.J. Betts, R.C. Newman, Electrochemical kinetics in localized corrosioncavities, Mater. Sci. Forum (1991) 247–258.
[32] M.T. Woldemedhin, J. Srinivasan, R.G. Kelly, Effects of environmental factors onkey kinetic parameters relevant to pitting corrosion, J. Solid State Electrochem. 19(2015) 3449–3461.
[33] J. Srinivasan, C. Liu, R.G. Kelly, Geometric evolution of flux from a corroding one-dimensional pit and its implications on the evaluation of kinetic parameters for pitstability, J. Electrochem. Soc. 163 (2016) C694–C703.
[34] R.B. Inturi, Z. Szklarska-Smialowska, Dependence of the pitting potential of Al al-loys on solubility of alloying element oxides, Corros. Sci. 34 (1993) 705–710.
[35] K. Sasaki, G.T. Burstein, The generation of surface roughness during slurry erosion-corrosion and its effect on the pitting potential, Corros. Sci. 38 (1996) 2111–2120.
[36] W. Tian, S. Li, N. Du, S. Chen, Q. Wu, Effects of applied potential on stable pitting of304 stainless steel, Corros. Sci. 93 (2015) 242–255.
[37] R.C. Alkire, K.P. Wong, The corrosion of single pits on stainless steel in acidicchloride solution, Corros. Sci. 28 (1988) 411–421.
[38] W. Li, K. Nobe, A.J. Pearlstein, Electrodissolution kinetics of iron in chloride so-lutions: viii. Chaos in potential/current oscillations, J. Electrochem. Soc. 140(1993) 721–728.
[39] H.P. Lee, K. Nobe, A.J. Pearlstein, Film formation and current oscillations in theelectrodissolution of Cu in acidic chloride media: i. Experimental studies, J.Electrochem. Soc. 132 (1985) 1031–1037.
[40] W. Li, X. Wang, K. Nobe, Electrodissolution kinetics of iron in chloride solutions: vii.Experimental potential/current oscillations, J. Electrochem. Soc. 137 (1990)1184–1188.
[41] T.R. Beck, Salt film formation during corrosion of aluminum, Electrochim. Acta 29(1984) 485–491.
[42] H.W. Pickering, R.P. Frankenthal, On the mechanism of localized corrosion of ironand stainless steel: i. Electrochemical studies, J. Electrochem. Soc. 119 (1972)1297–1304.
Y. Li, J. Xu Corrosion Science 128 (2017) 73–84
83

[43] J.C. Walton, Mathematical modeling of mass transport and chemical reaction increvice and pitting corrosion, Corros. Sci. 30 (1990) 915–928.
[44] T. Suzuki, M. Yamabe, Y. Kitamura, Composition of anolyte within pit anode ofaustenitic stainless steels in chloride solution, Corrosion 29 (1973) 18–22.
[45] J. Mankowski, Z. Szklarska-Smialowska, Studies on accumulation of chloride ions inpits growing during anodic polarization, Corros. Sci. 15 (1975) 493–501.
[46] M. Pourbaix, Atlas of Electrochemical Equilibria Aqueous Solutions, 2nd english
ed., National Association of Corrosion Engineers, Houston, Tex, United States,1974.
[47] E. Larsen, Zirconium and hafnium chemistry, Adv. Inorgan. Chem. Radiochem. 13(1970) 1–133.
[48] H.H. Strehblow, J. Wenners, Investigation of the processes on iron and nickelelectrodes at high corrosion current densities in solutions of high chloride content,Electrochim. Acta 22 (1977) 421–427.
Y. Li, J. Xu Corrosion Science 128 (2017) 73–84
84


![Growth and annealing kinetics of [alpha]-sexithiophene … · Growth and annealing kinetics of a-sexithiophene ... Furthermore,transient effectscan only beidentified if the growth](https://static.fdocuments.in/doc/165x107/5af4bf067f8b9a95468e5eee/growth-and-annealing-kinetics-of-alpha-sexithiophene-and-annealing-kinetics.jpg)