Investigating the growth kinetics in sourdough microbial ...
Upload
jayashree-sethuramanCategory
view
580download
2
MICROBIAL GROWTH KINETICS
Presented by
Jayashree Sethuraman
13MSB0004(SBST)
VIT University
1

INTRODUCTION
• Microbial growth is the result of both cell division and change
in cell size
• Growth – variety of physical, chemical and nutritional
conditions
• Conversion of nutrients into biological compounds which are
used for energy production and also for biosynthesis and
product formation
• Good example for autocatalytic reaction
2
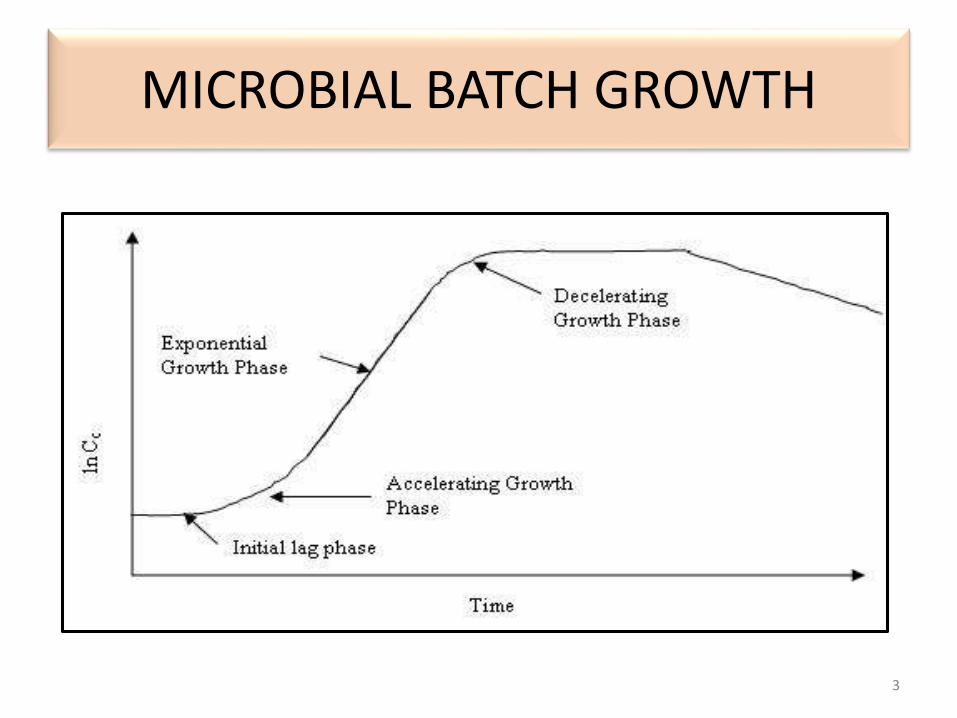
MICROBIAL BATCH GROWTH
3
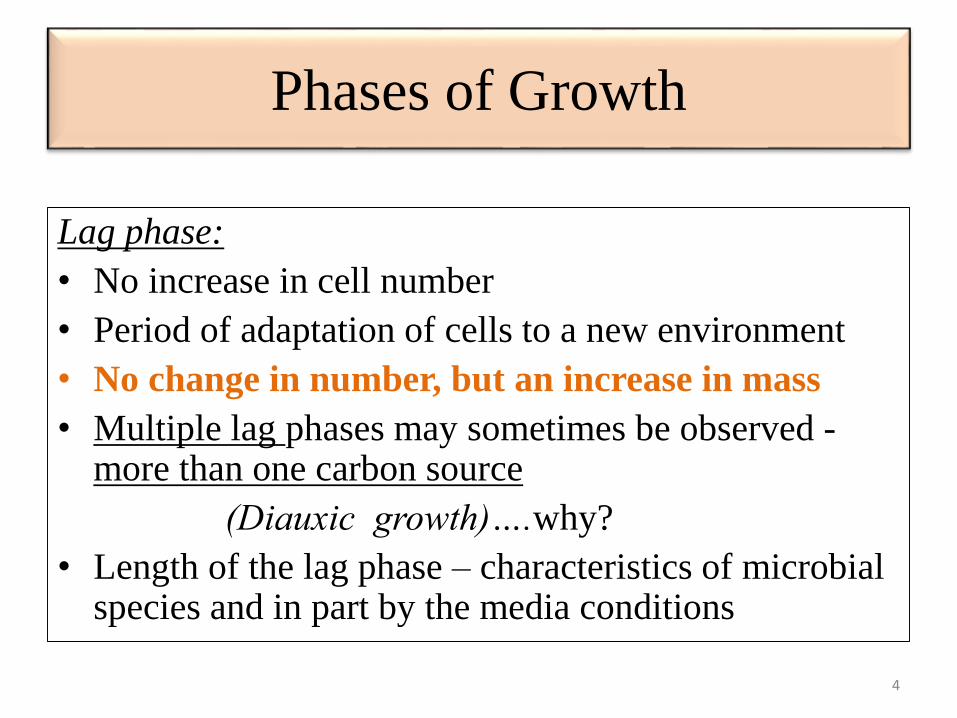
Phases of Growth
Lag phase:
• No increase in cell number
• Period of adaptation of cells to a new environment
• No change in number, but an increase in mass
• Multiple lag phases may sometimes be observed -more than one carbon source
(Diauxic growth)….why?
• Length of the lag phase – characteristics of microbial species and in part by the media conditions
4
Cont.…
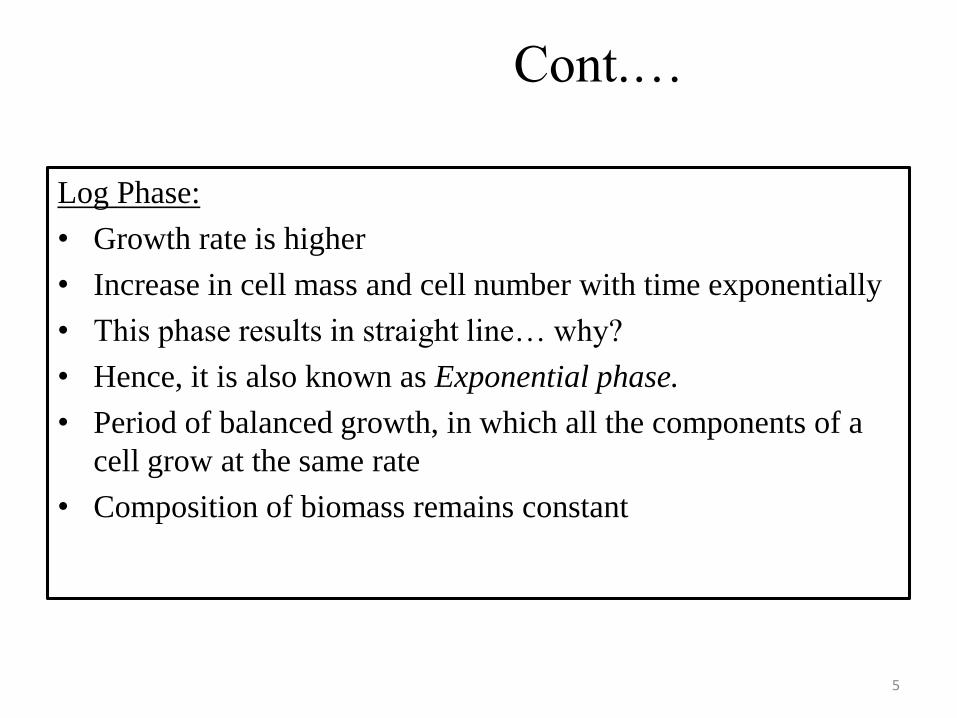
Log Phase:
• Growth rate is higher
• Increase in cell mass and cell number with time exponentially
• This phase results in straight line… why?
• Hence, it is also known as Exponential phase.
• Period of balanced growth, in which all the components of a
cell grow at the same rate
• Composition of biomass remains constant
5

Cont.…
• The exponential growth rate is the first order reaction
• The rate of biomass is correlated with the specific growth
rate(µ) and the biomass concentration or cell number, X
• A measure of the rapidity of growth has dimension T-1
dX/dt = µ.X
Integration of the eq. between the limits X0 at the time t=0 and
X at sometime t gives:
ln (X/X0) = µt (or) X=X0 e µt
Taking the neutral log,
ln X = ln X0 + µt
6

7
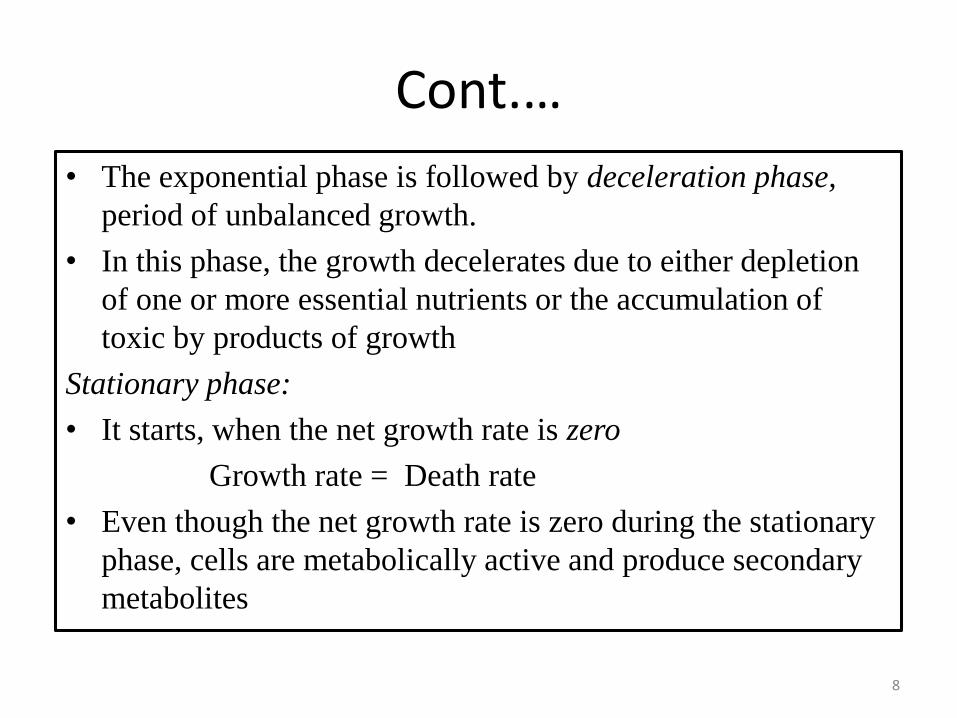
Cont.…
• The exponential phase is followed by deceleration phase,
period of unbalanced growth.
• In this phase, the growth decelerates due to either depletion
of one or more essential nutrients or the accumulation of
toxic by products of growth
Stationary phase:
• It starts, when the net growth rate is zero
Growth rate = Death rate
• Even though the net growth rate is zero during the stationary
phase, cells are metabolically active and produce secondary
metabolites
8
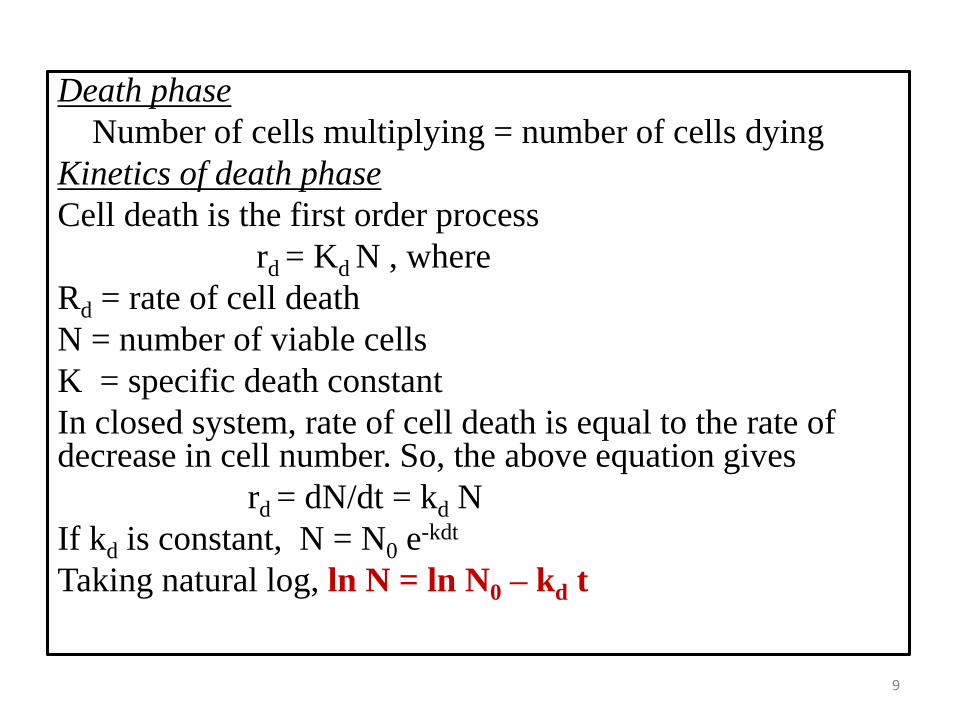
Death phase
Number of cells multiplying = number of cells dying
Kinetics of death phase
Cell death is the first order process
rd = Kd N , where
Rd = rate of cell death
N = number of viable cells
K = specific death constant
In closed system, rate of cell death is equal to the rate of decrease in cell number. So, the above equation gives
rd = dN/dt = kd N
If kd is constant, N = N0 e-kdt
Taking natural log, ln N = ln N0 – kd t
9

EFFECT OF SUSTRATE CONCENTRATION
IN BATCH CULTURE
• The specific growth rate is generally found to be a function of three parameters
1. The concentration of growth limiting substrate, S
2. The maximum specific growth rate, µmax
3. A substrate - specific constant, K sµ = µmax / Ks + S (MONOD EQUATION)
Specific growth rate is independent of substrate concentration as long as excess substrate is present.
Taking the reciprocal values in the monod equation and rearranging it:
1/ µmax = Ks + S / µmax S (or)
1/ µ = (Ks / µmax . 1/S ) + 1/ µmax
The plot of 1/ µ against 1/S produces a straight line with intercept on the y axis at 1/ µmax and slope equals to Ks / µmax
10

• Substrate concentration and other conditions remain
constant, and the cells grow at a constant, fully
acclimatised exponential rate on the effluent.
• Defining characteristic of continuous culture is a
perpetual feeding process.
• The reaction variables and control parameters remain
consistent, establishing a time-constant state within
the reactor.
CONTINUOUS CULTURE
11

CONTINUOUS GROWTH KINETICS
• The actual growth rate depends not only on the volumetric
flow rate of the medium into the reactor, but also on the
dilution rate(D)
D = F/V
The net change in the cell concentration over a period of time
may be expressed as:
dX/dt = rate of growth in reactor – rate o loss from
reactor(µX-Dx)
Under steady state conditions, the rate of growth = rate of loss
dX/dt = 0
Therefore, µX = DX & µ = D
12

• For any given dilution rate, under steady state conditions, the
residual substrate concentration in the reactor can be predicted
by substituting D for µ in the Monod equation
D = µmax Sr / Ks + Sr
where Sr = steady state residual substrate concentration in the
reactor at the fixed dilution rate. Rearrangement gives,
D(Ks + Sr) = µmax Sr or DKs + DSr = µmax Sr
Dividing by S gives,
DKs / Sr + D = µmax
hence, Sr = DKs / µmax - D
Cont.…
13

Cont.….• Thus growth is controlled by the availability of a rate-limiting
nutrient
• Chemostat – system where the concentration of the rate-
limiting nutrient entering the system is fixed.
• Turbidostat – nutrients in the medium are not limited, cell
concentration is held constant(?)
14

15

SOLID-STATE FERMENTATION FOR THE
SYNTHESIS OF CITRIC ACID BY
ASPERGILLUS NIGER
Abstract
• Solid-state fermentation was carried out to evaluate three different
agro-industrial wastes, sugar cane bagasse, coffee husk and cassava
bagasse for their efficiency in production of citric acid by a culture
of Aspergillus niger. Cassava bagasse best supported the mould's
growth, giving the highest yield of citric acid among the tested
substrates. Results showed the fungal strain had good adaptation to
the substrate (cassava bagasse) and increased the protein content (23
g/kg) in the fermented matter. Citric acid production reached a
maximum (88-g/kg dry matter) when fermentation was carried out
with cassava bagasse having initial moisture of 62% at 26°C for 120
h.
16

METHODS
• Micro-organisms - Seven strains of A.niger, one strain, NRRL 2001, was
chosen.
• Inoculum - A.niger spores were produced in Czapeck Dox Broth with agar
(50 ml) in a 250 ml Erlenmeyer flask
• Substrate - Three solid materials, sugar cane bagasse,
co€ee husk and cassava bagasse were tested
• Fermentation - Fermentation was carried out in vertical column
fermenter
• Analytical methodsSamples (5 g) were mixed well with 50 ml of distilled water to extract citric acid and sugars. The ®ltrate so obtained was subjected to high performance liquid chromatograph analysis using a Shimadzu LC-10AD HPLC. A temperature of 60°C and 5 mM H2SO4 as the mobile phase at a ¯ow-rate of 0.6 ml/min were used.
17

18
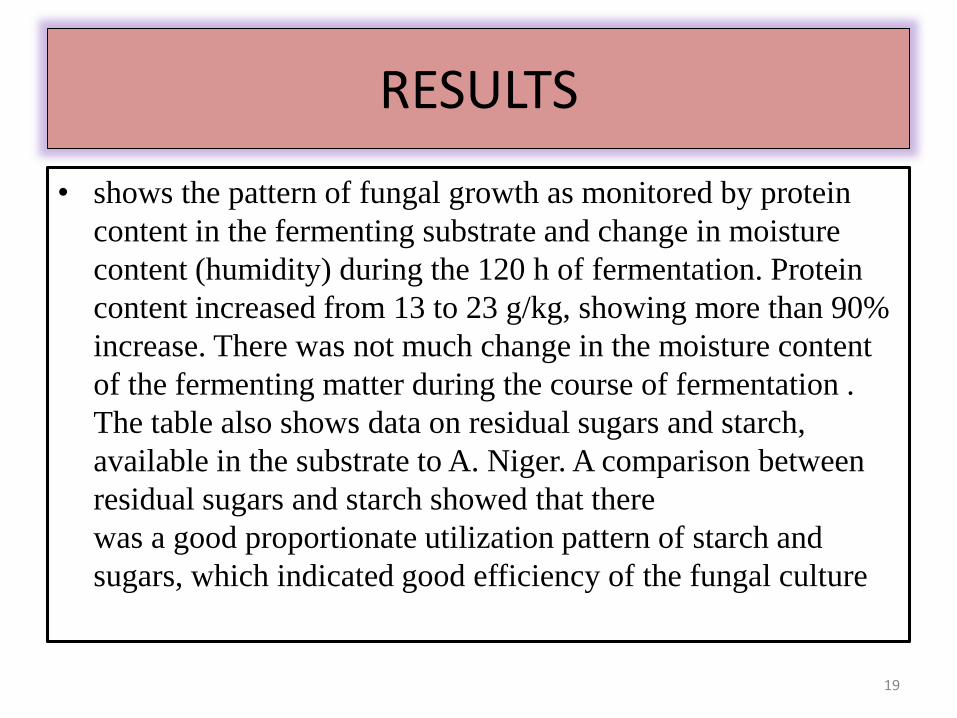
RESULTS
• shows the pattern of fungal growth as monitored by protein
content in the fermenting substrate and change in moisture
content (humidity) during the 120 h of fermentation. Protein
content increased from 13 to 23 g/kg, showing more than 90%
increase. There was not much change in the moisture content
of the fermenting matter during the course of fermentation .
The table also shows data on residual sugars and starch,
available in the substrate to A. Niger. A comparison between
residual sugars and starch showed that there
was a good proportionate utilization pattern of starch and
sugars, which indicated good efficiency of the fungal culture
19

20