Differences in Level of Consumption among Socio -Economic Groups ... - Government Of...
288
Report No. 472(55/1.0/10) Differences in Level of Consumption among Socio-Economic Groups 1999-2000 NSS 55 th Round July 1999- June 2000 National Sample Survey Organisation Ministry of Statistics and Programme Implementation Government of India
Transcript of Differences in Level of Consumption among Socio -Economic Groups ... - Government Of...

Report No. 472(55/1.0/10)
Differences in Level of Consumption among Socio-Economic Groups
1999-2000
NSS 55th Round July 1999- June 2000
National Sample Survey Organisation Ministry of Statistics and Programme Implementation
Government of India

NSS Report No. 472: Differences in Level of Consumption among Socio-Economic Groups, 1999-2000
PREFACE
The National Sample Survey Organisation (NSSO) has been carrying out all-India household surveys on Consumer Expenditure and Employment & Unemployment with a large sample usually once in every five years. The sixth such survey was conducted in the 55th round (July 1999-June 2000) - which covered Non-agricultural Enterprises in the Informal Sector in addition. The schedule of enquiry on Consumer Expenditure for the survey was, more or less, similar to that adopted in previous quinquennial rounds. The present report is the tenth in the series of reports through which the results on consumer expenditure survey are being released. This report gives the distribution of rural and urban population over different classes of monthly per capita expenditure, separately for persons belonging to specific household (occupational) types, social groups and size classes of land possessed in different States and Union Territories of India. This report also brings out the variation in the level of consumer expenditure by household occupation type, household social group and size class of land possessed. This report has four sections and one appendix. Section 1 of the report is introductory while Section 2 presents Sample Design and Estimation Procedure. Section 3 gives Concepts and Definitions. Section 4 discusses Summary of Findings. The detailed tables are provided in the Appendix.
The Field Operations Division (FOD) of the Organisation conducted the fieldwork for the survey. The collected data were processed and tabulated by the Data Processing Division (DPD) of the NSSO. The Survey Design & Research Division (SDRD) of the NSSO developed the survey design and prepared the report.
I am grateful to the Chairman and members of the Governing Council, Heads of
various Divisions of the NSSO and their colleagues for the contribution made in preparing the report. Comments/suggestions from the readers will be most welcome. New Delhi N. S. Sastry September 2001 Director General & Chief Executive Officer National Sample Survey Organisation

Contents
Section 1 Introduction
1
Section 2 Sample design
3
Section 3 Concepts & definitions
9
Section 4 Summary of findings 13
Appendix Detailed tables
Table 1R Per 1000 distribution of persons by MPCE class and average MPCE separately for different household types in Rural India by State/UT-rural
A-1
Table 1U -do- urban A-18 Table 2R Per 1000 distribution of persons by MPCE class and average MPCE
separately for different social groups and by State/UT-rural A-35
Table 2U -do- urban A-52 Table 3R Per 1000 distribution of persons by MPCE class and average MPCE of
rural households in different size classes of land possessed and by State/UT
A-69
Table 4R Average MPCE of rural households classified by type, social group and area of land possessed and by State/UT - rural
A-86
Table 4U -do- urban A-119 Table 5R Break-up of MPCE by broad groups of food items for each household
type in rural areas and by State/UT-rural A-125
Table 5U -do- urban A-136 Table 6R Break-up of MPCE by broad groups of non-food items for each
household type in rural areas and by State/UT-rural A-147
Table 6U -do- urban A-158 Table 7R Break-up of MPCE by broad groups of food items for each social
group in rural areas and by State/UT-rural A-169
Table 7U -do- urban A-180 Table 8R Break-up of MPCE by broad groups of non-food items for each social A-191

group in rural areas and by State/UT-rural Table 8U -do- urban A-202 Table 9R Break-up of MPCE by broad groups of food items for each land
possessed class in rural areas and by State/UT A-211
Table 10R Break-up of MPCE by broad groups of non-food items for each land possessed class in rural areas and by State/UT
A-222
Table 11R Break-up of MPCE by broad groups of food items for each in rural areas and by State/UT-rural
A-233
Table 11U -do- urban A-247 Table 12R Break-up of average MPCE by broad groups non-food of items for
each socio-economic category of households - rural A-249
Table 12U -do- urban A-263

NSS Report No. 472: Differences in Level of Consumption among Socio-Economic Groups, 1999-2000
Highlights
• This report brings out the variation in the level
and pattern of consumer expenditure of households classified by household occupational type, household social group and size of land possessed, and by State/Union Territory and Sector (rural/urban).
• At the national level, among the rural
households, those belonging to occupational types ‘others’ showed the highest average of monthly per capita expenditure (MPCE) (Rs.652) and agricultural labour, the lowest (Rs.386).
• In the urban areas, average MPCE was the
highest (Rs.1031) for the household type ‘others’ as in the rural areas. The average MPCE was the lowest (Rs.541) for the casual labour households.
• In rural India, 38% of the population was
engaged as self-employed in agriculture and 31% as agricultural labourer.
• The labourer households accounted for about
38% of population in rural areas whereas in the urban areas their share was only 14%.
• In rural India, the total of scheduled caste and
scheduled tribe populations constituted 31% of total rural population – same as the social group ‘others’. OBC accounted for the highest proportion (38%) of rural population.
• In urban India, as a whole, the total of
scheduled caste and scheduled tribe populations constituted only 18% of total
population, while the social group ‘others’ constituted 52% of total population.
• In rural India, average MPCE was the highest for the social group ‘others’ (Rs 577), followed by OBC (Rs 474), SC (Rs 419) and ST (Rs 388). The order was a little different for urban India: ‘others’ (Rs 1005), then OBC (Rs 735), then ST (Rs 691) and finally SC (Rs 609).
• The percentage of population with land less
than 0.01 hectare was less than 1 only in Kerala and Orissa. The same percentages were above 10 in Maharashtra and Gujarat.
• In rural India, the households having 4.01
hectares or more of land had the highest average MPCE (Rs.628) among different size classes of land possessed. On the whole, with the exception of the size class ‘<0.01 hectare,’ average MPCE of the households appeared to increase with the size of holding.
• In rural India, among the household
occupational types, agricultural labour households showed lower levels of per capita consumption of important item groups like milk and milk products and meat, egg and fish.
• In urban India, among the different household
types per capita consumption of many item groups (like cereals, milk and milk products and sugar) was the lowest for casual labour households.
• In urban India, per capita consumption
expenditure on cereals was the highest for ST households.

NSS Report No. 472: Differences in Level of Consumption among Socio-Economic Groups, 1999-2000
1
Section 1
Introduction
1.1 The fifty-fifth round of NSS was conducted during July 1999 to June 2000 for collecting information on household consumer expenditure, employment-unemployment and informal non-agricultural enterprises (other than those engaged in industrial categories of 'mining & quarrying', electricity, gas and water supply) from nationwide samples of households or enterprises. It was the sixth quinquennial survey on Consumer Expenditure and Employment-Unemployment. (See Note 1 below.) In the central sample, the household consumer expenditure schedule was canvassed in 120309 households located in 6046 villages and 4116 urban blocks. This report is the tenth of the series of reports through which the findings of the 55th round consumer expenditure survey are being released. Through the consumer expenditure schedule, data were collected on quantity and value of household consumption of different goods and services, using different reference periods, viz. "last 7 days", "last 30 days" or "last 365 days" preceding the date of survey. However, this report is based on data relating to the reference period of the last 365 days preceding the date of survey for items of clothing, footwear, education, medical (institutional) and durable goods, and of the last 30 days for all other items of consumption including food items. 1.2 The survey ascertained total household expenditure on domestic
account for each sample household during the last 30 days (or last 365 days) and, apart from this, recorded some household particulars including household size, household social group (SC/ST/OBC/others), the broad occupational type (self-employed in agriculture, regular wage/salary earning etc.) of the household and, for rural house-holds, the area of household land possessed. 1.3 This information was used to generate the distribution of rural and urban population over different classes of monthly per capita expenditure, separately for persons belonging to specific household types, occupational groups, and land possessed size classes, in different States and Union Territories (UTs) of India. These data form the basis of the present report. 1.4 The report thus enables the comparison of per capita consumption (considered not as a one-dimensional average but as a distribution of persons over different expenditure classes) for different sections of population demar-cated by differing socio-economic charac-teristics. 1.5 Data on the same subject was last presented for 1993-94, based on the fifth consumer expenditure survey of the quinquennial series conducted during that period vide NSS report No. 422.

NSS Report No. 472: Differences in Level of Consumption among Socio-Economic Groups, 1999-2000 2
1.6 The Sample Design and Estimation Procedure followed in the NSS 55th round survey is given in Section 2. Section 3 presents important concepts and definitions adopted in the survey and used in this report. The survey findings on consumer expenditure are presented in Section 4. The detailed tables on the consumption expenditure on different groups of items are provided separately for each State, UT and all-India in Appendix. Notes 1. The National Sample Survey: The NSS was set up in 1950, with the idea of having a permanent survey organisation to collect data on various facets of the economy through nationwide sample surveys in order to assist in socio-economic planning and policy-making. The NSS is a continuing survey in the sense that it is carried out in the form of successive "rounds", each round usually of a year's duration, covering several topics of current interest in a specific survey period. At present each NSS round reaches, at the all-India level, about 12,000 to 14,000 villages and blocks in the Central sample (covered by the Central agency NSSO) and an independent sample of about 14,000 to 16,000 villages and blocks in the State sample (covered by the Governments of various States and Union
Territories). The entire area of the country - rural and urban - is covered, with the exception of some interior areas of Nagaland and Andaman & Nicobar Islands, and Ladakh and Kargil districts of Jammu & Kashmir. 2. Household consumer expenditure survey: It was originally the practice to collect data on household consumer expenditure in every round of NSS, starting from the very first round (1950-51). From 1972-73, according to a decision of the Governing Council of NSSO, the consumer expenditure survey became a quinquennial feature and was also integrated with the employment and unemployment survey in the sense that a common sample of households was subjected to both the enquiries. However, independent samples of households for these two surveys were canvassed during the 55th round. An annual series of consumer expenditure surveys was again launched from the 42nd round (1986-87) to fill the data gaps which planners and researchers had begun to feel. It is the larger-scale quinquennial surveys, however, which are expected to be more useful for the study of trends in the level of consumer expenditure and of the emergence of new spending patterns. So far, six quinquennial surveys of consumer expenditure have been conducted and these were conducted in the 27th, 32nd, 38th, 43rd, 50th and 55th rounds of NSS. They relate, respectively, to the years 1972-73, 1977-78, 1983, 1987-88, 1993-94 and 1999-2000.

NSS Report No. 472: Differences in Level of Consumption among Socio-Economic Groups, 1999-2000
3
Section 2
Sample design
2.1 Sample Design 2.1.1 General: A stratified sampling design was adopted for selection of the sample first-stage units (FSUs). The FSUs were villages (panchayat wards for Kerala) for rural areas and Urban Frame Survey (UFS) blocks for urban areas. The Ultimate stage units (USUs) were households for consumer expenditure schedule. The households were selected by the method of circular systematic sampling from the corresponding frame in the FSU. Large FSUs were subdivided into hamlet-groups (rural)/ sub-blocks (urban) that were grouped into two segments, and USUs were selected independently from each of these segments. 2.1.2 Sampling frame for first stage units: List of villages (panchayat wards for Kerala) as per 1991 Census and latest lists of UFS blocks were respectively used for selection of rural and urban sample FSUs. For selection of sample villages from the State of Jammu & Kashmir, list of villages as per 1981 Census was used as the sampling frame. All the uninhabited villages of the country as per 1991 Census, interior villages of Nagaland situated beyond 5 km of a bus route and inaccessible villages of Andaman & Nicobar Islands were left out of the survey coverage of the NSS 55th round. 2.1.3 Stratification 2.1.3.1 Rural: Two special strata were formed at the State/ UT level, viz.,
Stratum 1: all FSUs with population
between 1 to 100, and Stratum 2: FSUs with population more
than 15,000. [Note: The above two strata were spread across a given State and were not confined to any particular administrative division within the State.]
Above strata of either type are formed if at least 50 such FSU’s are there in the respective frames. Otherwise, they are merged with the general strata.
While forming general strata
(consisting of FSUs other than those covered under strata 1 & 2), efforts were made to treat each district as a separate stratum. If limitation of sample size didn’t allow formation of so many strata, smaller districts within a particular NSS region were merged to form a stratum. Each district with rural population of 2 millions or more as per 1991 Census (1.8 millions or more as per 1981 Census in case of Jammu & Kashmir) was split into a number of strata.
. 2.1.3.2 Urban : Strata were formed within NSS Regions as follows:
Stratum number
Composition of strata by considering population of various towns as per the 1991 Census
1, 3, 5 * ‘hospital area’ (HA) / ‘industrial area’ (IA) / ‘bazaar area’ (BA) blocks taken together of each single city with a population of 10 lakhs or more (there could be a maximum of 3 such cities within an NSS Region)

NSS Report No. 472: Differences in Level of Consumption among Socio-Economic Groups, 1999-2000 4
Stratum number
Composition of strata by considering population of various towns as per the 1991 Census
2, 4, 6 * Other blocks of each single city with a population of 10 lakhs or more
7 HA or IA or BA blocks of all towns
with population between 50,000 and less than 10 lakhs
8 Other blocks of all towns with
population between 50,000 and less than 10 lakhs
9 HA or IA or BA blocks of all towns
with population less than 50,000
10 Other blocks of all towns with population less than 50,000
* Stratum numbers 3, 4, 5 & 6 remain void if there was only one city in an NSS region with a population of 10 lakhs or more. If sample size was not adequate for forming so many strata, all blocks of stratum 7 were merged with those of stratum 8 and all blocks of stratum 9 were merged with those of stratum 10. 2.1.4 Sample size : A total number of 10,384 FSUs was selected for survey in the Central sample at all-India level (rural & urban combined) in the 55th round. For State sample, there was normally an equal matching. Exceptions were only for Nagaland (urban), Delhi, Goa and Maharashtra (urban) where State sample size was higher than Central sample. Sample for the whole round for each State/UT and Sector (i.e. rural/ urban) was allocated equally among the four sub-rounds. Sample FSUs for each sub-round were selected afresh in the form of two independent sub-samples. The details of allocation and survey of FSUs, households and persons are given in Statement 0. 2.1.5 Allocation of first-stage units (FSU's): State/ UT level rural sample size was allocated among the rural strata in proportion to population. State/ UT level urban sample was first allocated among the
three classes of towns (i.e. 10 lakh +, 50000 to less than 10 lakhs and less than 50,000) in proportion to population. Then sample allocation for each of the three classes of towns, within an NSS region, was further allocated between two strata types consisting of - (i) HA/ IA/ BA blocks, and (ii) the rest in proportion to total number of FSUs in the respective frames with double weightage given to the first category of blocks. Stratum level allocations for both rural and urban areas of a sub-round were made in even numbers in order to facilitate selection of FSUs in the form of two independent sub-samples. Sub-sample numbers were 1 & 2 for sub-round 1; 3 & 4 for sub-round 2; 5 & 6 for sub-round 3 and 7 & 8 for sub-round 4. 2.1.6 Selection of first-stage units: For each sub-round, sample FSUs from each stratum were selected in the form of 2 independent sub-samples by following circular systematic sampling with (a) probability proportional to population for all rural strata other than stratum 1, and (b) equal probability for rural stratum 1 as well as all urban strata. Thus stratum level allocation of FSUs was multiple of 8. 2.1.7 Formation of hamlet-groups in large villages and number of hamlet-groups selected for survey: Depending upon the values of approximate present population (P) and approximate total number of non-agricultural enterprises (E), decision was taken to divide the FSU into a fixed number of hamlet-groups (hg’s - the term applicable for rural samples) / sub-blocks (sb’s - the term applicable for urban samples) as per the rules given below:

NSS Report No. 472: Differences in Level of Consumption among Socio-Economic Groups, 1999-2000
5
value of P
no. of hg’s/ sb’s
formed in the
FSU as per
popula- tion
criterion
value of E
no. of hg’s/ sb’s
formed in the
FSU as per
enter- prise
criterion (1) (2) (3) (4)
less than 1200
1 @ less than 100
1 @
1200 – 1999 5 100 – 249 5 2000 – 2399 6 250 – 299 6 2400 – 2799 7 300 – 349 7 2800 – 3199 8 350 – 399 8 (and so on) (and so on) @ no. of hb’s/ sb’s = ‘1’ means the whole FSU
was considered for listing. [For rural areas of Himachal Pradesh, Sikkim and Poonch, Rajouri, Udhampur and Doda districts of Jammu & Kashmir, number of hg’s formed in the village as per population criterion was : 1 for P < 600, 5 for P = 600 to 999, 6 for P = 1000 to 1199, 7 for P = 1200 to 1399, 8 for P = 1400 to 1599, and so on.] The number (D) of hamlet-groups (hg)/ sub-blocks (sb) formed in the FSU was the higher of the two values as per population and enterprise criteria. If value of P was less than 1200 (600 for certain hilly areas specified above) as well as value of E was less than 100 for an FSU, hg/ sb formation was not resorted to and the whole FSU was considered for listing. In case hg’s/ sb’s were formed in the sample FSU, the same was done by more or less equalizing population. 2.1.8 Formation of Segments within FSU: The hg/ sb having maximum concentration of non-agricultural enterprises was selected with certainty for listing of households/ enterprises. This hg/ sb was referred to as segment 1. From the remaining (D-1) hg’s/ sb’s of the FSU, 2 more hg’s/ sb’s were selected circular systematically and these 2 selected hg’s/ sb’s together was referred to as segment 2 for doing a combined listing of households/ enterprises. Thus listing of households/ enterprises was done only in
segments 1 and 2 of the FSU. The FSU not requiring hg/ sb formation was to be treated as segment 1. 2.1.9 Stratification of households : All the households listed in a segment (both rural & urban) were stratified into two second stage strata, viz. ‘affluent households’ (forming second stage stratum 1) and the rest (forming second stage stratum 2). In rural sector, a maximum of ten households which were relatively affluent than others and possessed at least certain item(s) like motor car/ jeep, colour TV, telephone, etc. or owns land / livestock in excess of certain limits. In urban sector, the households having MPCE (monthly per capita consumer expenditure) greater than certain limit for a given town/city were treated as ‘affluent’ households for the present survey and were included in the frame of second stage stratum 1, and rest of the urban households were included in the frame of second stage stratum 2.
2.1.10 Number of households/ enterprises selected for survey: The number of households/ enterprises selected for survey from each FSU in general is given below: segment
number of households allotted for consumer expenditure schedule in
Second Stage Stratum (SSS) 1 2 total
(1) (2) (3) (4) FSU with hg/ sb formation 1 1 3 4 2 1 7 8 FSU with no hg/ sb formation 1 2 10 12
2.2 Estimation Procedure: 2.2.1 General procedure of selection of households: Sample households were selected from the respective frames by circular systematic sampling with equal probability. For the purpose of systematic

NSS Report No. 472: Differences in Level of Consumption among Socio-Economic Groups, 1999-2000 6
sampling, households in the frame of second stage stratum 2 were arranged by means of livelihood and land possessed classes for rural samples and by means of livelihood and MPCE classes for urban samples. 2.2.2 Approach: The estimate for a sub-round was obtained by combining the estimates of the corresponding sub-sample replicates. Similarly, an estimate for the Round was obtained by combining the four sub-round-wise estimates. 2.2.3 The following notations are being used in this section:
a = subscript for the a-th stratum r = subscript for the r-th sub-
sample replicate ( r = 1,2,…,8) q = subscript for the q-th sub-
round (q = 1,2,3 & 4) f = subscript for the f-th sampled
village/ block as First Stage Unit ( FSU )
s = subscript for the s-th segment of sampled village/ block ( s = 1 & 2)
c = subscript for the c-th 2nd stage stratum of households in the sampled village/ block (c = 1,2)
j = subscript for the j-th sampled household
p = subscript for pooled estimate z = size used for selection of an
FSU from the sampling frame Z = total of sizes in the sampling
frame for the stratum [Note: For urban sector, z=1 and Z=N
which is the total number of UFS blocks (FSU’s) in the frame.]
n = number of sampled FSU surveyed within a stratum and a sub-sample replicate (including zero cases but excluding casualty and not reported cases) and used for tabulation
L= number of sub-sample replicates surveyed and used for tabulation
D = number of hamlet-groups/ sub-blocks formed in rural/ urban sampled FSU
H = total number of households listed in the appropriate frame
h = number of sampled households surveyed and used for tabulation from the frame
E = total number of enterprises listed in the appropriate frame
e = number of sampled enterprises surveyed and used for tabulation from the frame
y, x = value of characteristic y, x obtained in the sample
∃, ∃Y X = estimated value of characteristic y, x obtained from the sample.
2.2.4 ESTIMATES OF AGGREGATE: In the formulae given in this section, ∃Y is the estimate of aggregate of any characteristic y for a given stratum (a), and for a particular sub-round (q) and sub-sample replicate (r). These formulae are provided for the general case of FSU’s having two segments 1 & 2. For the FSU’s requiring no hg/ sb formation, the formula is identical to that given for segment 1 while the contribution from segment 2 is taken as zero for estimating a characteristic of household from a given 2nd stage stratum (c) in the selection frame
Rural : ∑ ∑∑= ==
=n h
yBzn
ZY
f
fsc
j
fscj
s
fscf
c
1 1
2
1
1ˆ (1)
Here fsc
fscfsc
hH
B = , for segment 1 (s=1) and
fsc
fscffsc
hHD
B ×−
=2
1, for segment 2 (s =2).
Urban: ∑ ∑∑= ==
=n h
yBnZ
Yf
fsc
j
fscj
s
fscc
1 1
2
1
ˆ …(2)

NSS Report No. 472: Differences in Level of Consumption among Socio-Economic Groups, 1999-2000
7
Here fsc
fscfsc
hH
B = , for segment 1 (s=1) and
fsc
fscffsc
hHD
B ×−
=2
1, for segment 2 (s =2).
Note: For tabulating any characteristic from this
detailed schedule ∑=c
cYY ˆˆ is to be used.
2.2.4.1 COMBINED ESTIMATE FROM SUB-SAMPLES: In the previous section, the estimate of a characteristic Y as obtained for a stratum (a), for a particular sub-round (q) and a sub-sample replicate (r), actually represent aqrY . The combined /pooled estimate for a particular stratum and a particular sub-round is computed as the average of sub-sample replicate estimates and is given below:
∑=
=L
r
aqraq YL
Y1
ˆ1ˆ …(3)
2.2.4.2 ESTIMATE OF AGGREGATES FOR A SUB-ROUND AT STATE/ UT/ REGION LEVEL: If qrY be the State/ UT/ Region level aggregate from the r-th sub-sample replicate and q-th sub-round, and qpY , the combined/ pooled estimate of the aggregate based on the whole sample, for a given sub-round q, then
∑=a
aqrqr YY ˆˆ …(4)
based on sub-sample replicate group r, and
∑=
=L
r
qrqp YL
Y1
ˆ1ˆ …(5)
based on all sub-sample replicates. 2.2.4.3 ESTIMATES OF AGGREGATE FOR THE ROUND (i.e. all the 4 sub-rounds together) AT STATE/ UT/ REGION LEVEL: The estimates of aggregates for the whole round are computed as the simple average of the sub-round estimates derived in section 2.2.2, and are given below:
∑=
=4
1
ˆ41ˆ
q
qrr YY
…(6) based on sub-sample replicate1 and 2*and
∑=
=4
1
ˆ41ˆ
q
qpp YY …(7)
based on whole sample. *Note: In the Round, sub-samples 1, 3, 5 & 7 (in sub-rounds 1 to 4) are combined together to form sub-sample replicate1 (annual) while sub-samples 2, 4, 6 & 8 (in sub-rounds 1 to 4) are combined together to form sub-sample replicate 2 (annual). This was followed in the remaining sections also. Stratum level estimate for the Round is obtained similarly. 2.2.5 ESTIMATES OF RATIO: If X & Y be the State/ UT/ Region level aggregate estimate corresponding to variables x and y, then the estimate of ratio is given below:
r
rr
XY
R ˆˆ
ˆ = …(8)
based on sub-sample group r, and
p
pp
XY
Rˆˆ
ˆ = …(9)
based on the whole sample. The formulae for X are obtained similarly by replacing Y by X and y by x in the above formulae Stated in previous sections. Note: Estimates for the sub-round qrR and qpR have
been obtained by replacing rY and pY by qrY and
qpY , respectively and rX and pX by qrX and qpX , respectively.

NSS Report No. 472: Differences in Level of Consumption among Socio-Economic Groups, 1999-2000 8
Statement 0: Number of sample villages/ blocks allotted and surveyed and number of sample households and persons surveyed
State/UT no. of villages no. of blocks no. of households
surveyed no. of persons
surveyed allotted surveyed allotted surveyed rural urban rural urban
(1) (2) (3) (4) (5) (6) (7) (8) (9) Andhra Pr. 432 432 320 320 5181 3806 22600 16524 Arunachal Pr 80 74 24 21 827 233 4314 953 Assam 296 291 72 71 3462 852 19272 3370 Bihar 624 611 192 190 7311 2279 40109 11764 Goa 16 16 24 24 192 284 944 1239 Gujarat 208 208 232 232 2479 2764 12807 12855 Haryana 96 96 64 64 1132 758 6502 3732 Himachal Pr. 144 140 80 80 1634 947 7793 3429 J & K 208 131 128 84 1472 1008 8322 5035 Karnataka 232 232 208 208 2763 2470 14154 11220 Kerala 240 240 168 168 2604 2015 12324 9115 M.P. 432 432 264 264 5144 3145 28816 16075 Maharashtra 352 352 440 440 4121 5234 20399 24172 Manipur 64 64 56 56 738 665 3997 3522 Meghalaya 80 80 32 32 933 384 4901 1673 Mizoram 40 39 72 72 428 858 2276 4169 Nagaland 40 40 24 24 480 264 2441 1102 Orissa 296 293 88 88 3477 1050 17059 4560 Punjab 184 184 160 160 2152 1883 12067 8348 Rajasthan 272 272 168 168 3229 1985 19021 10159 Sikkim 88 88 24 24 1056 288 5173 1171 Tamil Nadu 352 352 360 359 4173 4212 17338 16571 Tripura 136 86 48 40 1031 569 4853 2408 U.P. 792 791 392 391 9432 4638 57397 25051 West Bengal 384 384 288 288 4550 3432 23508 14061 A.& N. Is. 24 24 16 16 273 191 1514 788 Chandigarh 16 16 64 64 180 765 654 3105 D.&N. Haveli 16 16 8 8 192 96 914 381 Daman & Diu 16 15 16 16 180 192 821 946 Delhi 16 16 96 96 187 1081 982 4883 Lakshadweep 8 7 16 16 84 192 363 1202 Pondicherry 24 24 32 32 288 384 1222 1577 all-India 6208 6046 4176 4116 71385 48924 374856 225160

NSS Report No. 472: Differences in Level of Consumption among Socio-Economic Groups, 1999-2000 9
Section 3
Concepts and Definitions
3.1 Household : A group of persons normally living together and taking food from a common kitchen constitutes a household. The word "normally" means that temporary visitors are excluded but temporary stay-aways are included. Thus a son or daughter residing in a hostel for studies is excluded from the household of his/her parents, but a resident employee or resident domestic servant or paying guest (but not just a tenant in the house) is included in the employer/host's household. "Living together" is usually given more importance than "sharing food from a common kitchen" in drawing the boundaries of a household in case the two criteria are in conflict; however, in the specia l case of a person taking food with his family but sleeping elsewhere (say in a shop or a different house) due to space shortage, the household formed by such a person's family members is taken to include the person also. Each inmate of a mess, hotel, boarding and lodging house, hostel, etc. is considered as a single -member household except that a family living in a hotel (say) is considered as one household only; the same applies to residential staff of such establishments. 3.2 Household consumer expenditure : The expenditure incurred by a household on domestic consumption during the reference period is the household's consumer expenditure. The household consumer expenditure is the total of the monetary values of consumption of various groups of items namely (i) food, pan (betel leaves), tobacco, intoxicants and fuel & light, (ii) clothing and footwear and (iii) miscellaneous goods and services and durable articles. 3.2.1 For groups (i) and (ii), the total value of consumption is derived by aggregatin g the
monetary value of goods actually consumed during the reference period. An item of clothing and footwear would be considered to have been consumed if it is brought into maiden or first use during the reference period. The consumption may be out of (a) purchases made during the reference period or earlier; (b) home grown stock; (c) receipt in exchange of goods and services; (d) any other receipt like gift, charity, borrowing and (e) free collection. Home produce is evaluated at the ex farm or ex factory rate. For evaluating the consumption of the items of group (iii) i.e. items categorised as miscellaneous goods and services and durable articles, a different approach is followed. In this case, the expenditure made during the reference period for the purchase of goods and services is considered as consumption. 3.2.2 It is pertinent to mention here that the consumer expenditure of a household on food items relates to the actual consumption by the normal resident members of the household and also by the guests whether during ceremonies or otherwise. To avoid double counting, transfer payments like charity, loan advance, etc. made by the household are not considered as consumption for items of groups (i) and (ii), since transfer receipts of these items have been taken into account. However, the item "cooked meals" is an exception to the rule. Meals prepared in the household kitchen and provided to the employees and/or others would automatically get included in domestic consumption of employer (payer) household. There is a practical difficulty of estimating the quantities and values of individual items used for preparing the meals served to employees or to others. Thus, to avoid double counting, cooked meals received as perquisites from employer household or as gift or charity are

NSS Report No. 472: Differences in Level of Consumption among Socio-Economic Groups, 1999-2000 10
not recorded in the recipient household. As a general principle, cooked meals purchased from the market for consumption of the normal resident members and for guests and employees will also be recorded in the purchaser household. 3.2.3 This procedure of recording cooked meals served to others in the expenditure of the serving households only leads to bias-free estimates of average per capita consumption as well as total consumer expenditure. However, as the proportions of donors and recipients of free cooked meals are likely to vary in opposite directions over the expenditure classes, the nutritional intake derived from the consumer expenditure survey data may present a somewhat distorted picture. These derived nutrition intakes may get inflated for the rich (net donors) and somewhat understated for the poor (net recipients). This point has to be kept firmly in mind while using the NSS consumer expenditure data for any nutritional studies relating to the nutritional status of households. 3.3 Reference period : Reference period means the period of time for which data on consumption was collected. The reference period used for the survey was a “moving” one, varying from household to household, although it was a fixed length of period. During the 55th round of NSS, information on consumption of food, pan, tobacco & intoxicants was collected independently for two different reference periods of last 30 days and last 7 days from the same households. For items of clothing, footwear, durable goods, education and medical (institutional) expenses, data were collected for the reference period of “last 365 days” preceding the date of survey. For the remaining items, a reference period of “last 30 days” preceding the date of survey was used. However, the monthly per capita consumption expenditure (MPCE) figures in this report are based on data collected for the “last 365 days” for clothing, footwear, durable goods,
education and medical (institutional) expenses and for the “last 30 days” for the rest of the items. 3.4 Sector: This word used for the rural-urban demarcation: rural and urban are the only two sectors as far as this report is concerned. 3.5 Major states: This refers to the following states of India: Andhra Pradesh, Assam, Bihar, Gujarat, Haryana, Karnataka, Kerala, Madhya Pradesh, Maharashtra, Orissa, Punjab, Rajasthan, Tamil Nadu, Uttar Pradesh and West Bengal. 3.6 Value of consumption : Consumption out of purchase is evaluated at the purchase price. Consumption out of home produce is evaluated at ex farm or ex factory rate. Value of consumption out of gifts, loans, free collection, and goods received in exchange of goods and services imputed at average local retail prices prevailing during the reference period. 3.7 Hous ehold size : The size of a household is the total number of persons in the household. 3.8 Monthly per capita expenditure (MPCE): For a household, this is household consumer expenditure over a period of 30 days divided by household size. A person's MPCE is understood as that of the household to which he/she belongs. 3.9 MPCE classes: The MPCE classes are normally revised during quinquennial surveys of Consumer Expenditure. Usually, 12 MPCE classes are formed from a table giving estimated cumulative percentage frequency distribution of persons by MPCE for each sector separately. The upper limits of these classes correspond broadly to 5%, 10%, 20%, 30%, 40%, 50%, 60%, 70%, 80%, 90%, 95% and 100% - of population. The class limits are given below:
NSS Report No. 472: Differences in Level of Consumption among Socio-Economic Groups, 1999-2000 11
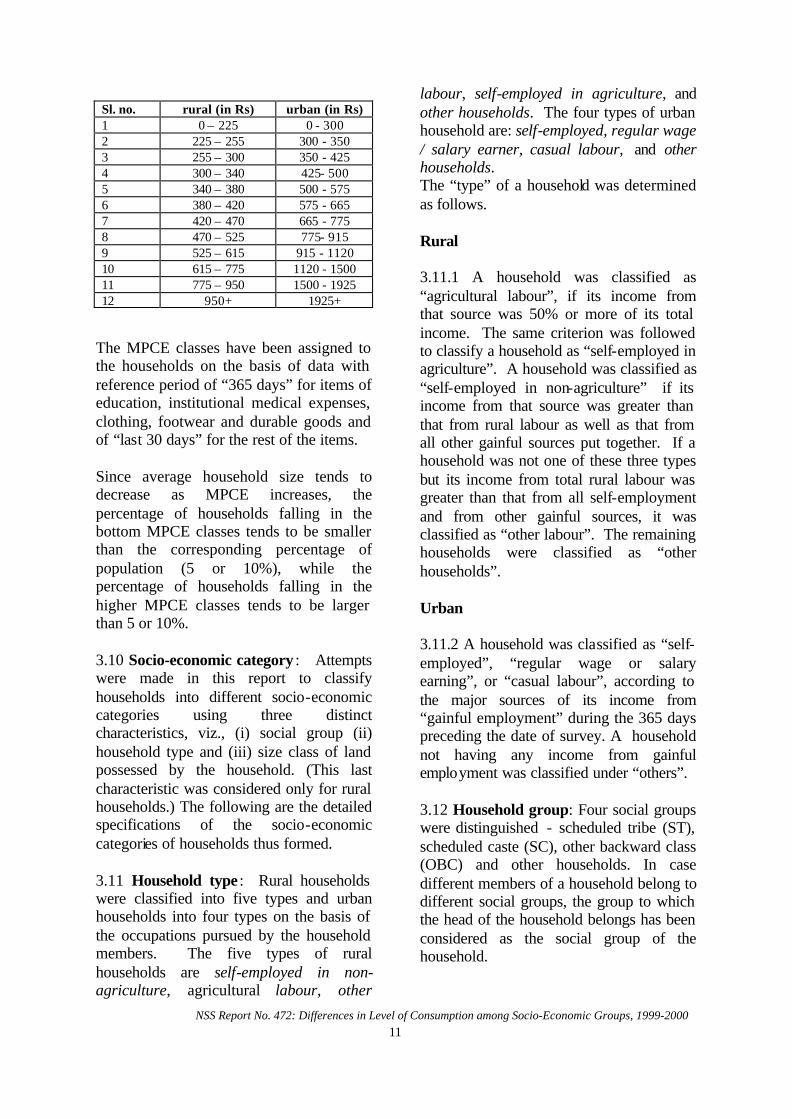
Sl. no. rural (in Rs) urban (in Rs) 1 0 – 225 0 - 300 2 225 – 255 300 - 350 3 255 – 300 350 - 425 4 300 – 340 425- 500 5 340 – 380 500 - 575 6 380 – 420 575 - 665 7 420 – 470 665 - 775 8 470 – 525 775- 915 9 525 – 615 915 - 1120 10 615 – 775 1120 - 1500 11 775 – 950 1500 - 1925 12 950+ 1925+
The MPCE classes have been assigned to the households on the basis of data with reference period of “365 days” for items of education, institutional medical expenses, clothing, footwear and durable goods and of “last 30 days” for the rest of the items. Since average household size tends to decrease as MPCE increases, the percentage of households falling in the bottom MPCE classes tends to be smaller than the corresponding percentage of population (5 or 10%), while the percentage of households falling in the higher MPCE classes tends to be larger than 5 or 10%. 3.10 Socio-economic category : Attempts were made in this report to classify households into different socio-economic categories using three distinct characteristics, viz., (i) social group (ii) household type and (iii) size class of land possessed by the household. (This last characteristic was considered only for rural households.) The following are the detailed specifications of the socio-economic categories of households thus formed. 3.11 Household type : Rural households were classified into five types and urban households into four types on the basis of the occupations pursued by the household members. The five types of rural households are self-employed in non-agriculture, agricultural labour, other
labour, self-employed in agriculture, and other households. The four types of urban household are: self-employed, regular wage / salary earner, casual labour, and other households. The “type” of a household was determined as follows. Rural 3.11.1 A household was classified as “agricultural labour”, if its income from that source was 50% or more of its total income. The same criterion was followed to classify a household as “self-employed in agriculture”. A household was classified as “self-employed in non-agriculture” if its income from that source was greater than that from rural labour as well as that from all other gainful sources put together. If a household was not one of these three types but its income from total rural labour was greater than that from all self-employment and from other gainful sources, it was classified as “other labour”. The remaining households were classified as “other households”. Urban 3.11.2 A household was classified as “self-employed”, “regular wage or salary earning”, or “casual labour”, according to the major sources of its income from “gainful employment” during the 365 days preceding the date of survey. A household not having any income from gainful employment was classified under “others”. 3.12 Household group: Four social groups were distinguished - scheduled tribe (ST), scheduled caste (SC), other backward class (OBC) and other households. In case different members of a household belong to different social groups, the group to which the head of the household belongs has been considered as the social group of the household.

NSS Report No. 472: Differences in Level of Consumption among Socio-Economic Groups, 1999-2000 12
3.13 Land possessed: The area of land possessed (in hectares) includes land owned, leased in, and (encroached) land neither owned nor leased in, but excludes land leased out. 3.14 Milk and milk products: This group includes ghee, butter, curds, ice cream, etc. Milk-based sweetmeats (pera, rasogolla, etc.) come under ‘beverages, refreshments and processed food’ unless they are prepared from milk, sugar, etc., within the household. In the latter case, consumption of milk, sugar, etc., is accounted separately instead of as a single item under ‘milk products’. 3.15 Beverages, refreshments, etc. (including processed food): This includes all beverages including tea, coffee, cocoa, cold drinks and various commercially produced beverages, biscuits and confectionery, salted refreshments, sweets, pickles, sauce, jams and jellies, and also cooked meals obtained on payment. 3.16 Clothing: This category includes bedsheets, bedcovers, pillows, curtains, mattresses, blankets, rugs, mats and matting, cotton yarn, wool and knitting wool. It, however, excludes tailoring charges, which come under ‘miscellaneous goods and services’. 3.17 Durable goods: This term refers to durable goods other than clothing and footwear (which come under semi-durables); items included here are distinguished from miscellaneous goods by having a longer expected lifetime of use (roughly, one year or more). Though life of some petty durables such as pens, torches, spectacles and walking sticks, as well as books, is normally one year or more, they are by convention included among miscellaneous goods and not under durable goods. Durable goods used for household purposes thus include furniture and fixtures, recreational goods such as
cameras, TV, cassettes and musical instruments, jewellery and ornaments, clocks and watches, household utensils and appliances for cooking, heating, cooling, and other work such as sewing, vehicles for personal transport, tyres and tubes, fluorescent tubes and lamps, and other electrical and sanitary fittings. Expenditure incurred on repairs and construction of durables used for domestic purpose is included in "expenditure on durable goods".

NSS Report No. 472: Differences in Level of Consumption among Socio-Economic Groups, 1999-2000 13
Section 4
Summary of findings 4.0 The main findings on variation in the level and pattern of consumer expenditure by household occupational type, household social group and size of land possessed have been discussed in this section. This report is based on mainly two types of tables – per 1000 distribution of persons and average monthly per capita expenditure on different broad groups of items. The discussions have been restricted to major States and all-India only. The variation in average MPCEs over a socio-economic category for each major State and all-India has been examined first and then the corresponding distributions of persons and then per 1000 distribution at all-India level by MPCE class have been discussed in this section. 4.1 MPCE and household type: a state-by-state look Statements 1R and 1U show average MPCE of different household types in major States and all-India. They reveal the following points. Rural In the rural areas, the average MPCEs of persons belonging to any household type were significantly different among major States. At the national level, the average for the occupational type ‘others’ was the highest followed by self-employed in agriculture, self-employed in non-agriculture, other labour and agricultural labour. At the State level also, the average MPCE was the highest for the household type ‘others’. However, the average MPCEs of households belonging to household types ‘self-employed in
agriculture’ and ‘self-employed in non-agriculture’ did not vary much within many major States as for all-India. However, large differences between these two types are noticed for Punjab and Haryana. Similarly, the average MPCEs did not vary much within many of the major States between other labour and agricultural labour households. Here also, Maharashtra shows a very large gap between the two averages. The average MPCE was the lowest for agricultural labour in most of the major States followed by other labour. Urban In the urban areas, average MPCE was the highest for the household type ‘others’ as in the rural areas. The average MPCE was the lowest for the casual labour households in all the major States. Unlike rural areas, the average MPCE of households belonging to household type ‘others’ was not the highest for all the major States. For four out of fifteen major States the average was the highest for regular wage/salary earning households. The variation in average MPCE across household types was much greater in urban areas than in rural areas. 4.2 Distribution of population by household type Statements 2R and 2U show the percentage distributions of persons by household type in major States and all-India. These statements bring out that as many as 38% of population

NSS Report No. 472: Differences in Level of Consumption among Socio-Economic Groups, 1999-2000 14
was engaged as self-employed in agriculture and 31% as agricultural labourer in rural India. Thus, more than two-thirds of the rural population was engaged in agriculture. The labourer households in rural areas accounted for about 38% of population whereas in the urban areas the corresponding population was only 14%. In urban areas, the occupational types – self-employed and regular wage/salary earners – each accounted for about 39-40% of population. From these statements it is clear that the occupational distributions of population over different types were very different in rural and urban areas. Closer look reveals that in some States these distributions were markedly different from the distribution at the national level. 4.3 Distribution of population by MPCE class:
Statements 3R and 3U show the distribution of persons by MPCE class separately for each household type at all-India level for rural and urban areas, respectively. In rural areas, it shows that the proportions of persons belonging to household type ‘others’ falling in the top MPCE classes were more than the corresponding proportions for all household types. This was also somewhat true for self-employed in agriculture. But the distribution was just the opposite for population belonging to occupational type ‘agricultural labour’. In urban areas, the distribution was tilted towards higher MPCE classes for regular wage/salary earning households. For casual labour households, the distribution was just the opposite, relatively concentrated over lower values of MPCE.
4.4 Average MPCE by social group: Statement 4 gives average MPCEs of different social groups in each major State and all-India for both rural and urban areas. In rural areas,
average MPCE at the national level was the lowest (Rs 388) for scheduled tribe (ST) population followed by scheduled caste (SC) population (Rs 419), other backward classes (OBC) (Rs 474) and ‘others’ (Rs 577). For urban areas, the ordering among social groups was the same excepting for ST and SC – where the ranking was reversed. However, in the rural areas, there were five States, namely, Andhra Pradesh, Assam, Bihar, Kerala and Uttar Pradesh for which the average MPCE was higher for the ST population compared to that of the SC population. Similarly, there were two States, namely, Assam and West Bengal, for which average MPCE was higher for OBC population compared to the social group ‘others’. In the urban areas of the major States, the pattern was similar to the national pattern for most of the major States except for West Bengal and Punjab for which the average MPCE of SC population was slightly higher compared to that of ST population. 4.5 Distribution of population by social group: Statement 5 gives per 1000 distribution of persons by social group in each major State and all-India for both rural and urban areas. Rural In rural areas, the ascending order of social groups by percentage of population was ST, SC, others and OBC. The total of scheduled caste and scheduled tribe populations constituted 31% of total rural population – same as the social group ‘others’. In rural areas, OBC constituted the highest segment of the population (38%). Among the major States, the percentages of rural population belonging to ST was less than 2% in Haryana, Kerala, Punjab, Tamil Nadu and Uttar Pradesh whereas the

NSS Report No. 472: Differences in Level of Consumption among Socio-Economic Groups, 1999-2000 15
same was above 27% in Madhya Pradesh and Orissa. The proportion of SC population was relatively low in Assam (11%), Bihar (11%) and Kerala (10%) and relatively high in Punjab (38%) and Tamil Nadu (31%). Urban In urban areas, at the national level, the total of scheduled caste and scheduled tribe populations constituted only 18% of total urban population and the social group ‘others’ constituted 52% of total urban population. Among major States, the proportion of ST population was relatively high only in Orissa (11%) and 7% or less in all other major States. Among major States, the proportion of SC population was relatively high in Punjab (28%) and Haryana (21%). There were only two major States having more than 50% OBC population – Kerala (55%) and Tamil Nadu (68%). 4.6 Distribution of population by MPCE class for different social groups Statement 6 shows per 1000 distributions of rural and urban persons in different States by MPCE class separately for different social groups with "all groups” column provided for comparison. It is clear that the MPCE figures for the SC and ST groups were much lower than those for the general population. This is revealed by the much higher proportion of persons falling in the lower MPCE ranges for SC and ST groups compared to the general population. This was true for both rural and urban areas. The MPCE level of the OBC was better than those for SC and ST but not as high as that for population belonging to the social group ‘others’.
4.7 Size class of Land Possessed - Rural Average MPCE by size class of land possessed: Statement 7 shows the average of MPCE for each size class of land possessed separately for each major State and all-India though only for rural areas. It shows that the average of MPCE increases rather slowly with the increase in the area of land possessed, provided one overlooks households having land less than 0.01 hectare. For Kerala, the average MPCE of the population in this size class of land possessed was strikingly high. Even in other States, the lowest size class might depend more on non-agricultural occupations, which explains the exceptional character of average MPCE for this size class. 4.8 Distribution of persons by size class of land possessed: Statement 8 shows the percentage distribution of persons by size class of land possessed for rural areas of major States and all-India. It reveals that the percentage of population with land less than 0.01 hectare was less than 1% only in Kerala and Orissa. The percentage of population possessing 4.01 hectares of land or more was the highest in Rajasthan (22%) followed by Madhya Pradesh (12%), Karnataka (11%) and Punjab (11%). It was the lowest (below 1%) in Kerala followed by West Bengal. At all-India level, households comprising more than 52% of rural population had possessed land not exceeding 0.40 hectare. 4.9 Distribution of population by MPCE class for size classes of land possessed: Statement 9 shows the distribution of persons by MPCE class for different size classes of land possessed at all-India level. It shows that the distribution for the classes 0.41 – 1.00 hectare and 1.01 – 2.00 hectares were more or less

NSS Report No. 472: Differences in Level of Consumption among Socio-Economic Groups, 1999-2000 16
similar to the distribution for ‘all classes’. For the class 0.01-0.40 hectare, the distribution was tilted towards lower MPCE values while for the classes above 2.01 hectares the distribution was tilted towards higher values of MPCE. 4.10 Average MPCE by household type, social group and size class of land possessed - a three way classification: Statement 10 presents the all-India averages MPCE for different combinations of household type, social group and size class of land possessed, along with the corresponding number of sample households for rural India. It reveals that the sample size was not adequate for all the cells of the three-way classification to throw up reliable averages of MPCE even at all-India level. It is found that average MPCE for households differs significantly across household types, social groups and size classes of land possessed. However, the size class of land possessed <0.01 hectare did not follow the same pattern as the other size classes of land possessed in respect of average MPCE of the households. The households having land 4.01 hectares or more had the highest average of MPCE among different size classes of land possessed. This was true for each social group and household type. The exceptions to this general pattern were probably due to sampling fluctuations especially where the sample size was very small. 4.11 Average MPCE by household type and social group Statement 11 shows the all-India average MPCEs of different combinations of household type, social group along with number of sample households for urban India. It shows that average MPCE for ST households classified as casual labour households had the lowest average MPCE out of 16 basic combinations presented in the Statement. And the highest
average was for the households with ‘others’ as both social group and household type. 4.12 Break-up of MPCE MPCE over household types: Statement 12 shows the break-up of MPCE by broad groups of items for each household type at all-India level, separately for rural and urban areas. Corresponding to this statement, the percentages of total expenditure spent on different items are shown in Statement 15. In rural India, MPCE for agricultural labour households was the least among the different household types. So, if the spending pattern was similar to other households, the monthly per capita expenditure on different item groups would be expected to be proportionately smaller. This was somewhat true for almost all item groups except cereals, spices and pan, tobacco and intoxicants, for which the consumption level was broadly the same as for some other types of households. Statement 11 presents the average MPCEs of different combinations of household type and social group for urban India. In urban India, per capita cereal consumption was relatively low for casual labour households compared to other households. As the total MPCE for casual labour households was the least among different household types, the per capita expenditure on different item groups like cereals and spices appeared to be the least for casual labour households. 4.13 Break-up of MPCE over social groups : Statement 13 shows the break-up of MPCE by broad groups of items for each social group at all-India level, separately for rural and urban areas. Corresponding to this statement, the percentages of total expenditure spent on different items are shown in Statement 16. In rural India, the level of consumption of cereal, meat egg & fish, vegetables, salt were almost the same for household groups other than

NSS Report No. 472: Differences in Level of Consumption among Socio-Economic Groups, 1999-2000 17
‘others’. The households with type ‘others’ normally have relatively high levels of consumption for many groups of items except for spices and second-hand clothing. Their consumption level was also not high for pan, tobacco & intoxicants. In urban India, per capita consumption on cereals was the highest for ST households. SC households consumed less of ‘beverages, refreshments, etc’ than other households. Per capita consumption on vegetables and salt were more or less the same for ST, SC and OBC households. 4.14 Break-up of MPCE over social
groups : Statement 14 shows the break-up of MPCE by broad groups of items for each size class of land possessed at all-India level for rural areas. Corresponding to this statement, the percentages of total expenditure spent on different items are shown in Statement 17. In rural India, the total MPCE did not vary much over the size class of land possessed. The same was true for per capita consumption expenditure on different groups of items.

NSS Report No. 472: Differences in Level of Consumption among Socio-Economic Groups, 1999-2000 18
Statement 1R: Average MPCE (Rs) of different household types in rural areas of major States household type
State self-employed in non-agriculture
agricultural labour
other labour
self-employed in agriculture
others all
(1) (2) (3) (4) (5) (6) (7)
Rural Andhra Pradesh 467 391 435 503 646 453 Assam 433 329 357 444 545 426 Bihar 392 331 314 422 449 384 Gujarat 578 440 469 629 722 551 Haryana 664 543 545 808 822 714
Karnataka 593 411 488 533 688 500 Kerala 800 570 656 925 1016 766 Madhya Pradesh 449 329 352 439 514 401 Maharashtra 584 391 581 521 707 497 Orissa 403 307 370 393 538 373 Punjab 687 537 623 909 854 742 Rajasthan 566 470 470 561 652 549 Tamil Nadu 546 436 559 558 700 514 Uttar Pradesh 440 368 428 499 553 466 West Bengal 452 383 454 489 677 454 all-India 502 386 483 520 652 486
Statement 1U: Average MPCE (Rs) of different household types in urban areas of major States household type
State self-employed regular wage/salary
earning casual labour others all
(1) (2) (3) (4) (5) (6)
Urban Andhra Pradesh 710 935 482 1010 773 Assam 705 1007 464 874 814 Bihar 525 784 343 678 602 Gujarat 890 996 600 1201 892 Haryana 881 1066 602 1089 912 Karnataka 848 1082 541 1101 911 Kerala 950 1129 653 1258 932 Madhya Pradesh 668 801 417 958 693 Maharashtra 966 1043 516 1418 973 Orissa 553 759 395 656 618 Punjab 905 938 634 1144 899 Rajasthan 721 938 527 890 796 Tamil Nadu 957 1021 837 1129 971 Uttar Pradesh 626 850 406 870 690 West Bengal 808 982 491 1165 866 all-India 813 981 541 1031 855

NSS Report No. 472: Differences in Level of Consumption among Socio-Economic Groups, 1999-2000 19
Statement 2R: Percentage distribution of persons by household type in rural areas of major States household type
State self-employed in non-agriculture
agricultural labour
other labour
self-employed in agriculture others all
(1) (2) (3) (4) (5) (6) (7) RuralAndhra Pradesh 13.09 45.33 5.90 28.17 7.28 100.00Assam 16.16 16.66 14.06 38.10 14.82 100.00Bihar 13.64 34.82 4.27 37.02 10.01 100.00Gujarat 10.75 36.68 7.07 36.84 8.66 100.00Haryana 13.64 19.37 10.19 40.75 15.68 100.00 Karnataka 10.38 40.08 4.61 37.68 7.20 100.00Kerala 18.94 22.57 25.17 19.34 13.87 100.00Madhya Pradesh 7.64 35.62 4.04 46.72 5.96 100.00Maharashtra 8.92 42.49 7.38 30.01 11.17 100.00Orissa 11.04 42.25 3.61 31.57 11.25 100.00 Punjab 14.69 27.56 8.10 34.44 15.21 100.00Rajasthan 13.19 7.82 14.12 57.27 7.60 100.00Tamil Nadu 14.61 44.90 13.05 18.51 8.77 100.00Uttar Pradesh 15.85 18.17 5.84 51.40 8.54 100.00West Bengal 22.95 38.57 5.41 23.33 9.23 100.00 all-India 13.82 31.05 7.39 37.71 9.85 100.00
Statement 2U: Percentage distribution of persons by household type in urban areas of major States
household type State self-employed
regular wage/salary earning casual labour others all
(1) (2) (3) (4) (5) (6) Urban Andhra Pradesh 33.46 39.94 19.87 6.39 100.00 Assam 40.58 36.84 10.26 11.90 100.00 Bihar 43.32 31.03 12.37 12.43 100.00 Gujarat 39.81 37.25 18.19 4.73 100.00 Haryana 44.40 34.35 13.97 6.01 100.00 Karnataka 34.49 41.35 16.90 7.06 100.00 Kerala 37.12 25.74 29.25 7.50 100.00 Madhya Pradesh 39.79 37.03 16.70 6.18 100.00 Maharashtra 32.34 52.28 11.18 3.94 100.00 Orissa 35.34 40.32 16.63 7.61 100.00 Punjab 44.12 38.20 11.86 5.63 100.00 Rajasthan 43.60 40.32 10.98 5.10 100.00 Tamil Nadu 32.65 42.51 18.76 5.87 100.00 Uttar Pradesh 49.71 30.87 10.88 7.95 100.00 West Bengal 41.54 40.71 11.06 6.35 100.00 all-India 39.09 39.86 14.28 6.42 100.00

NSS Report No. 472: Differences in Level of Consumption among Socio-Economic Groups, 1999-2000 20
Statement 3R: Per 1000 distribution o f persons by MPCE class separately for different household types in rural India
all-India household type
MPCE class (Rs) self-employed in
non-agriculture
agricultural labour
other labour
self-employed
in agriculture
others all
(1) (2) (3) (4) (5) (6) (7) Rural
0-225 34 95 55 28 25 52 225-255 42 83 48 35 21 50 255-300 92 151 97 75 54 100 300-340 84 134 91 91 56 100 340-380 114 124 94 95 61 103 380-420 97 104 107 97 68 97 420-470 108 92 104 113 85 102 470-525 100 75 95 107 86 93 525-615 113 66 110 123 120 103 615-775 101 48 100 121 177 99 775-950 63 17 58 57 99 50
950-more 52 11 40 58 149 50 all classes 1000 1000 1000 1000 1000 1000
Statement 3U: Per 1000 distribution of persons by MPCE class separately for different household types in urban India
all-India household type
MPCE class (Rs) self-employed
regular wage/salary
earning
casual labour others all
(1) (2) (3) (4) (5) (6) Urban
0-300 52 15 157 34 52 300-350 56 24 110 40 50 350-425 114 54 177 63 96 425-500 110 75 160 80 101 500-575 108 86 122 68 99 575-665 105 97 95 103 100 665-775 99 117 66 95 101 775-915 97 121 48 99 100
915-1120 87 132 35 124 100 1120-1500 85 141 21 125 101 1500-1925 40 71 6 79 50 1925-more 45 66 2 90 50 all classes 1000 1000 1000 1000 1000

NSS Report No. 472: Differences in Level of Consumption among Socio-Economic Groups, 1999-2000 21
Statement 4: Average MPCE (Rs) of households in different social groups in rural and urban areas of major States
social group
State ST
SC
other backward classes others all
(1) (2) (3) (4) (5) (6) Rural Andhra Pradesh 383 382 439 564 453 Assam 437 414 436 422 426 Bihar 337 329 385 458 384 Gujarat 438 459 530 655 551 Haryana 508 543 641 834 714
Karnataka 404 419 507 560 500 Kerala 674 597 724 871 766 Madhya Pradesh 325 375 418 516 401 Maharashtra 384 429 490 570 497 Orissa 285 351 395 480 373 Punjab 548 582 652 909 742 Rajasthan 466 501 560 622 549 Tamil Nadu 384 427 548 651 514 Uttar Pradesh 425 399 442 563 466 West Bengal 376 439 516 463 454
all-India 388 419 474 577 486 Urban Andhra Pradesh 635 614 712 878 773 Assam 750 557 737 872 814 Bihar 525 441 500 808 602 Gujarat 662 652 671 1057 892 Haryana 950 602 819 1070 912 Karnataka 634 593 829 1044 911 Kerala 994 797 834 1100 932 Madhya Pradesh 567 526 586 861 693 Maharashtra 724 705 780 1095 973 Orissa 490 441 580 728 618 Punjab 654 667 763 1048 899 Rajasthan 679 588 720 918 796 Tamil Nadu 1076 592 959 1277 971 Uttar Pradesh 899 553 576 797 690 West Bengal 574 591 684 956 866 all-India 691 609 735 1005 855

NSS Report No. 472: Differences in Level of Consumption among Socio-Economic Groups, 1999-2000 22
Statement 5: Percentage distribution of persons by social group in rural and urban areas of major States
State
ST
SC other backward classes others all
(1) (2) (3) (4) (5) (6)
Rural Andhra Pradesh 7.10 22.38 45.37 25.05 100.00 Assam 15.80 11.11 18.66 54.27 100.00 Bihar 7.18 20.97 51.41 20.07 100.00 Gujarat 19.37 10.91 32.51 37.21 100.00 Haryana 0.44 24.11 25.25 50.12 100.00 Karnataka 7.83 19.65 39.15 33.31 100.00 Kerala 1.70 9.85 51.08 37.35 100.00 Madhya Pradesh 27.98 14.49 41.50 16.00 100.00 Maharashtra 16.63 13.01 30.27 39.99 100.00 Orissa 27.01 20.93 31.55 20.32 100.00 Punjab 1.06 38.18 14.67 45.99 100.00 Rajasthan 19.79 16.34 36.29 27.57 100.00 Tamil Nadu 1.19 30.61 63.09 4.81 100.00 Uttar Pradesh 1.21 24.69 44.80 29.16 100.00 West Bengal 6.70 27.17 6.77 59.04 100.00 all-India 10.49 20.42 37.52 31.41 100.00 Urban Andhra Pradesh 3.01 12.91 37.84 46.11 100.00 Assam 6.05 10.21 13.69 69.92 100.00 Bihar 6.04 12.01 46.77 34.92 100.00 Gujarat 4.16 14.43 23.45 57.95 100.00 Haryana 1.47 20.50 21.47 55.81 100.00 Karnataka 4.50 10.79 30.65 54.02 100.00 Kerala 0.65 6.38 55.32 37.50 100.00 Madhya Pradesh 7.32 13.73 36.47 42.43 100.00 Maharashtra 3.13 13.19 18.49 65.02 100.00 Orissa 10.90 17.54 22.81 48.50 100.00 Punjab 1.35 27.76 13.37 57.46 100.00 Rajasthan 3.76 18.41 26.66 51.16 100.00 Tamil Nadu 0.85 12.66 68.13 18.17 100.00 Uttar Pradesh 0.94 15.62 31.26 51.91 100.00 West Bengal 1.92 17.85 6.14 73.86 100.00 all-India 3.40 14.35 30.38 51.70 100.00

NSS Report No. 472: Differences in Level of Consumption among Socio-Economic Groups, 1999-2000 23
Statement 6: Per 1000 distribution of persons by MPCE class and average MPCE
separately for different social groups in rural and urban India
social group MPCE class (Rs.)
ST SC other
backward classes
others all groups
(1) (2) (3) (4) (5) (6) Rural 0-225 125 75 43 23 52 225-255 94 69 51 23 50 255-300 156 130 103 60 100 300-340 121 128 107 67 100 340-380 102 122 109 84 103 380-420 86 99 102 93 97 420-470 85 97 106 107 102 470-525 64 82 97 105 93 525-615 70 87 103 124 103 615-775 55 64 95 143 99 775-950 24 25 47 77 50 950-more 17 22 38 95 50 all classes 1000 1000 1000 1000 1000 Urban 0-300 114 92 60 31 52 300-350 61 87 67 29 50 350-425 121 150 121 65 96 425-500 135 146 121 75 101 500-575 96 112 115 85 99 575-665 110 99 118 90 100 665-775 70 102 102 103 101 775-915 90 84 86 113 100 915-1120 73 54 87 121 100 1120-1500 75 46 72 135 101 1500-1925 36 18 30 72 50 1925-more 20 10 22 80 50 all classes 1000 1000 1000 1000 1000

NSS Report No. 472: Differences in Level of Consumption among Socio-Economic Groups, 1999-2000 24
Statement 7: Average MPCE (Rs) of rural households in different size classes of land possessed in major States
land possessed classes (hectares) State
< 0.01 0.01 - 0.40 0.41 - 1.00 1.01 - 2.00 2.01 - 4.00 4.01 & above
all classes
(1) (2) (3) (4) (5) (6) (7) (8) Andhra Pradesh 441 439 430 459 505 638 453 Assam 325 394 439 466 507 521 426 Bihar 332 365 404 419 482 558 384 Gujarat 505 499 531 569 649 740 551 Haryana 621 632 807 740 809 896 714 Karnataka 518 496 462 492 531 550 500 Kerala 1101 720 928 927 1058 1969 766 Madhya Pradesh 402 371 363 387 413 531 401 Maharashtra 565 482 466 484 493 571 497 Orissa 600 361 361 403 390 453 373 Punjab 661 628 828 811 971 1005 742 Rajasthan 493 528 502 534 577 605 549 Tamil Nadu 547 501 488 530 623 845 514 Uttar Pradesh 476 424 456 497 580 681 466 West Bengal 468 435 501 492 516 568 454 all-India 500 462 468 491 542 628 486
Statement 8: Percentage distribution of persons in rural areas by size class of land possessed in major States
land possessed classes (hectares)
State < 0.01
0.01 -
0.40
0.41 -
1.00
1.01 -
2.00
2.01 -
4.00
4.01 &
above
all classes
(1) (2) (3) (4) (5) (6) (7) (8) Andhra Pradesh 3.96 51.44 19.84 12.17 8.43 4.16 100.00 Assam 2.75 46.89 22.21 19.97 6.98 1.20 100.00 Bihar 9.53 53.60 18.89 11.31 4.78 1.89 100.00 Gujarat 11.33 41.04 14.85 13.70 9.89 9.19 100.00 Haryana 4.20 49.16 11.39 11.88 13.42 9.95 100.00 Karnataka 3.27 35.69 20.22 17.05 13.04 10.74 100.00 Kerala 0.97 81.28 10.82 4.95 1.73 0.25 100.00 Madhya Pradesh 5.63 25.06 18.67 20.15 18.69 11.81 100.00 Maharashtra 10.48 36.55 16.79 15.69 12.69 7.79 100.00 Orissa 0.89 48.54 27.23 13.73 7.21 2.40 100.00 Punjab 7.38 52.92 9.29 9.13 10.78 10.50 100.00 Rajasthan 1.38 24.04 18.56 17.60 15.92 22.49 100.00 Tamil Nadu 8.69 64.96 15.34 6.32 3.30 1.40 100.00 Uttar Pradesh 3.63 43.91 25.25 15.88 8.34 3.00 100.00 West Bengal 3.68 69.10 16.27 7.91 2.49 0.55 100.00 all-India 5.67 46.57 19.48 13.71 8.93 5.64 100.00

NSS Report No. 472: Differences in Level of Consumption among Socio-Economic Groups, 1999-2000 25
Statement 9 : Per 1000 distribution of persons by MPCE class and average MPCE of rural
households in different size classes of land possessed all-India
land possessed (hectares) MPCE class (Rs) <0.01 0.01- 0.40 0.41-1.00 1.01-
2.00 2.01-4.00
4.01 & above
all classes
(1) (2) (3) (4) (5) (6) (7) (8) 0-225 68 61 52 41 29 15 52 225-255 54 59 49 46 33 21 50 255-300 103 119 98 83 69 45 100 300-340 96 107 107 100 85 46 100 340-380 95 110 107 99 92 65 103 380-420 79 99 105 106 86 67 97 420-470 91 100 113 100 106 97 102 470-525 82 89 88 104 101 121 93 525-615 102 89 105 115 126 144 103 615-775 91 85 96 111 129 164 99 775-950 64 41 43 52 69 91 50 950-more 74 41 37 44 74 124 50 all classes 1000 1000 1000 1000 1000 1000 1000

NSS Report No. 472: Differences in Level of Consumption among Socio-Economic Groups, 1999-2000 26
Statement 10: Average MPCE of rural households classified by household type, social group and area of land possessed
Rural average MPCE (Rs) of households of
social group number of sample households of
social group household type
area of land
possessed (hectare) ST SC OBC others all ST SC OBC others all
(1) (2) (3) (4) (5) (6) (7) (8) (9) (10) (11) (12)
< 0.01 464.19 459.06 516.44 618.41 533.22 40 173 317 315 8530.01 - 0.40 406.13 428.19 488.63 526.09 486.81 302 1312 2927 2560 71030.41 - 1.00 448.39 447.24 471.98 603.18 513.79 123 170 536 535 13671.00 - 2.00 358.58 451.16 510.34 635.16 529.80 73 66 205 243 5892.01 - 4.00 508.19 591.24 620.11 709.40 645.59 34 23 105 134 296
4.01 + 488.08 - 764.96 791.28 711.38 27 - 58 81 177
self-employed in
non-agriculture
all sizes 420.21 435.46 495.09 557.19 502.28 599 1754 4148 3868 10385
< 0.01 361.07 376.27 395.94 436.17 389.97 188 658 593 261 17020.01 - 0.40 334.20 381.30 398.97 410.82 387.65 1697 4590 4441 2522 132590.41 - 1.00 321.66 357.61 400.45 441.50 378.06 669 600 999 413 26821.00 - 2.00 338.32 381.68 374.32 421.08 375.89 205 139 289 150 7832.01 - 4.00 329.81 402.72 375.92 478.87 397.45 52 38 74 55 220
4.01 + 263.82 - - - 430.13 20 - - - 52
agricultural labour
all sizes 332.58 378.31 397.08 419.35 385.98 2831 6034 6406 3414 18698
< 0.01 474.45 472.15 509.10 646.28 525.85 37 181 191 176 5850.01 - 0.40 392.35 434.75 497.26 546.02 482.97 447 959 1477 1157 40410.41 - 1.00 382.36 401.59 471.45 537.54 445.01 157 107 151 129 5441.00 - 2.00 361.64 435.06 500.43 519.75 466.60 28 25 59 34 1462.01 - 4.00 - - - - 484.20 - - - - 54
4.01 + - - - - 515.24 - - - - 20
other labour
all sizes 391.02 438.09 496.18 554.31 482.74 688 1290 1902 1509 5390 < 0.01 397.98 - 398.75 551.87 454.97 22 - 29 24 89
0.01 - 0.40 461.42 446.01 453.77 579.28 496.99 407 425 1216 1246 32990.41 - 1.00 417.16 422.84 462.84 548.66 483.69 1442 836 2673 2740 76961.00 - 2.00 406.28 437.18 476.14 572.57 497.58 1501 584 2316 2439 68502.01 - 4.00 400.79 460.87 502.67 638.42 540.36 1021 314 1655 2016 5010
4.01 + 450.45 521.90 586.31 698.91 626.59 436 182 1449 2117 4190
self-employed in agriculture
all sizes 414.72 442.22 488.02 602.81 519.53 4829 2355 9338 10582 27134
< 0.01 533.48 605.86 705.12 772.68 705.96 157 186 298 517 11580.01 - 0.40 581.93 592.63 584.15 733.40 652.27 389 865 1747 2411 54130.41 - 1.00 541.13 520.86 549.43 712.96 613.81 191 154 410 627 13831.00 - 2.00 613.60 536.04 576.63 692.33 625.96 146 58 232 348 7852.01 - 4.00 512.17 659.82 579.36 740.71 657.89 162 31 131 231 556
4.01 + 614.27 - 664.60 782.72 707.81 113 - 77 139 345
other households
all sizes 564.56 581.87 591.23 733.68 652.05 1158 1310 2895 4273 9640

NSS Report No. 472: Differences in Level of Consumption among Socio-Economic Groups, 1999-2000 27
Statement 10: Average MPCE of rural households classified by household type, social group and area of land possessed
Rural average MPCE (Rs) of households of
social group number of sample households of
social group household type
area of land
possessed (hectare) ST SC OBC others all ST SC OBC others all
(1) (2) (3) (4) (5) (6) (7) (8) (9) (10) (11) (12)
< 0.01 411.40 429.00 492.38 628.24 499.91 444 1212 1428 1294 44190.01 - 0.40 371.53 413.85 460.05 537.34 462.07 3246 8162 11823 9906 331680.41 - 1.00 379.23 405.48 455.83 557.75 468.42 2583 1867 4777 4451 136911.00 - 2.00 397.11 431.38 471.93 573.67 491.06 1953 872 3102 3215 91572.01 - 4.00 402.80 467.98 503.20 642.04 541.79 1284 419 1984 2446 6142
4.01 + 444.79 509.66 591.93 704.82 627.53 614 223 1607 2356 4808
all households
all sizes 387.69 418.51 473.65 577.22 485.88 10124 12755 24721 23668 71385
Statement 11: Average MPCE of urban households classified by household type and social group Urban
average MPCE (Rs) of households of social group
number of s ample households of social group household type
ST SC OBC others all ST SC OBC others all
(1) (2) (3) (4) (5) (6) (7) (8) (9) (10) (11) self-employed 662.14 542.68 674.97 953.00 812.96 777 1572 5391 9864 17626 regular wage/salaried 834.94 754.69 859.34 1101.05 981.49 1471 2399 4862 11600 20359 casual labour 424.50 463.58 608.23 548.65 540.66 526 1569 2184 1727 6024 other households 808.09 649.49 860.69 1207.74 1030.82 400 433 1187 2726 4750 all households 690.52 608.79 734.82 1004.75 854.70 3202 5985 13668 25966 48924

NSS Report No. 472: Differences in Level of Consumption among Socio-Economic Groups, 1999-2000 28
Statement 12: Break-up of MPCE by broad groups of items separately for each household type in rural and urban India all-India
average per capita consumption expenditure (Rs) per 30 days on
household type cereals gram
cereal substi- tutes
pulses & products
milk & milk
products
edible oil
meat, egg
& fish
vegeta- bles
fruits (fresh)
fruits (dry) sugar salt spices
beve- rages,
refresh- ments etc.
food total
(1) (2) (3) (4) (5) (6) (7) (8) (9) (10) (11) (12) (13) (14) (15) (16)
Rural self-employed in non-agriculture
109.54 0.65 0.28 18.22 39.95 18.86 19.97 31.49 7.88 1.34 11.29 1.10 13.01 22.43 296.00
agricultural labour 103.40 0.47 0.32 15.83 20.13 15.57 14.04 27.17 4.46 1.08 8.87 1.05 13.39 15.50 241.29 other labour 103.08 0.67 0.75 16.69 32.28 17.32 20.28 28.86 8.29 1.27 10.89 1.08 13.94 26.60 282.01 self-employed in agriculture 110.66 0.72 0.32 20.52 59.16 19.14 14.04 30.22 7.10 1.69 13.47 1.07 13.00 17.78 308.92 others 111.06 0.83 0.42 20.91 61.09 22.27 22.24 36.61 11.38 2.26 13.73 1.25 14.32 38.20 356.58 not recorded 118.77 0.37 0.04 17.74 39.53 16.41 19.03 30.51 4.66 0.57 9.70 1.22 10.49 16.18 285.21 all households 107.75 0.64 0.36 18.50 42.56 18.16 16.14 29.98 6.89 1.47 11.57 1.09 13.32 20.38 288.80 Urban self-employed 103.71 0.93 0.27 23.46 76.72 25.90 24.80 42.50 16.31 3.77 13.92 1.31 18.80 48.43 400.83 regular wage/salaried 109.85 1.05 0.43 26.76 84.80 30.22 30.49 48.78 19.54 5.19 15.02 1.52 17.62 62.49 453.77 casual labour 97.63 0.66 0.33 18.68 32.75 19.43 20.82 32.31 8.14 1.20 10.90 1.15 14.86 30.73 289.60 others 108.55 1.06 0.34 26.07 85.58 27.78 29.27 48.23 20.28 4.46 15.14 1.45 18.41 92.53 479.13 not recorded 97.31 1.49 0.50 20.92 60.01 21.43 22.58 37.34 11.01 2.67 12.25 1.34 14.53 33.23 336.62 all households 105.58 0.95 0.35 24.25 74.17 26.81 26.78 43.90 16.67 4.01 14.00 1.38 17.73 54.28 410.84
(Contd.)

NSS Report No. 472: Differences in Level of Consumption among Socio-Economic Groups, 1999-2000 29
Statement 12: Break-up of MPCE by broad groups of items separately for each household type in rural and urban India
all-India
average per capita consumption expenditure (Rs) per 30 days on
household type pan,
tobacco &
intoxicants
fuel &
light
clothing footwear
misc. goods & services
durable goods
( includes second hand)
non- food total all
clothing (second hand)
durables (second hand)
no. of sample hhs reporting consumption
(1) (17) (18) (19) (20) (21) (22) (23) (24) (25) (26) (27) all-India Rural self-employed in non-agriculture
13.40 37.85 33.67 5.21 102.80 13.59 206.52 502.52 0.13 0.37 10385
agricultural labour 13.87 31.31 25.95 3.14 64.84 5.88 145.00 386.29 0.19 0.04 18698
other labour 17.74 37.99 30.89 4.91 95.95 13.47 200.96 482.96 0.14 0.29 5390 self-employed in agriculture
13.68 37.50 36.84 5.95 100.77 16.09 210.82 519.75 0.09 0.44 27134
others 13.34 46.67 44.08 10.81 161.05 20.07 296.02 652.59 0.13 0.69 9640
not recorded 10.82 34.67 31.65 4.41 71.95 7.18 160.68 445.89 0.18 0.00 138
all households 13.96 36.56 33.28 5.37 95.42 12.76 197.36 486.16 0.14 0.32 71385
Urban
self-employed 15.74 60.68 50.17 9.78 246.59 29.39 412.34 813.17 0.14 0.42 17626 regular wage/salaried 16.63 67.59 59.49 11.94 333.27 39.05 527.95 981.72 0.17 0.72 20359 casual labour 18.66 74.68 30.13 4.71 112.61 10.46 251.26 540.86 0.27 0.26 6024
others 11.20 74.30 62.19 11.94 357.47 34.82 551.92 1031.06 0.10 0.23 4750
not recorded 16.51 48.11 41.00 8.73 193.20 19.16 326.71 663.33 0.12 0.08 165
all households 16.22 66.26 51.76 10.05 268.93 30.85 444.07 854.92 0.17 0.50 48924

NSS Report No. 472: Differences in Level of Consumption among Socio-Economic Groups, 1999-2000 30
Statement 13: Break-up of MPCE by broad groups of items separately for each social group in rural and urban India all-India
average per capita consumption expenditure (Rs) per 30 days on
social group cereals gram
cereal substi- tutes
pulses & products
milk & milk
products
edible oil
meat, egg
& fish
vegeta- bles
fruits (fresh)
fruits (dry) sugar salt spices
beve- rages,
refresh- ments etc.
food total
(1) (2) (3) (4) (5) (6) (7) (8) (9) (10) (11) (12) (13) (14) (15) (16) Rural scheduled tribe 105.88 0.40 0.30 15.44 21.10 14.96 15.80 26.79 3.82 1.00 8.57 1.11 10.66 14.97 240.81 scheduled caste 104.46 0.49 0.17 16.40 27.44 15.91 14.75 27.96 4.50 0.80 9.90 1.05 12.23 16.94 253.00 other backward classes
105.69 0.66 0.35 18.93 41.81 17.80 14.40 28.65 7.15 1.28 11.11 1.03 14.30 20.02 283.17
others 112.88 0.79 0.52 20.37 60.49 21.12 19.21 33.94 9.19 2.30 14.21 1.17 13.76 24.87 334.83 not recorded 123.13 0.93 0.03 19.42 34.18 19.05 21.89 31.14 4.35 0.39 9.04 1.24 10.61 15.19 290.61 all social groups 107.75 0.64 0.36 18.50 42.56 18.16 16.14 29.98 6.89 1.4711.57 1.09 13.32 20.38 288.80 Urban scheduled tribe 113.08 0.64 0.28 21.37 46.91 22.71 30.11 39.86 10.39 3.02 11.72 1.35 13.96 41.25 356.64 scheduled caste 100.23 0.78 0.19 20.90 45.86 22.53 22.97 38.00 9.22 1.75 12.75 1.31 14.43 36.97 327.89 other backward classes
104.65 0.91 0.32 23.25 56.58 23.13 25.78 37.97 13.56 2.34 12.51 1.27 21.48 45.19 368.95
others 107.07 1.04 0.41 25.97 94.22 30.44 28.22 49.29 21.00 5.69 15.38 1.47 16.70 65.31 462.21 not recorded 116.26 0.81 0.59 19.45 57.88 21.08 21.58 38.76 11.76 1.84 11.78 1.28 12.93 48.71 364.71 all social groups 105.58 0.95 0.35 24.25 74.17 26.81 26.78 43.90 16.67 4.0114.00 1.38 17.73 54.28 410.84
(Contd.)

NSS Report No. 472: Differences in Level of Consumption among Socio-Economic Groups, 1999-2000 31
Statement 13: Break-up of MPCE by broad groups of items separately for each social group in rural and urban India
all-India
average per capita consumption expenditure (Rs) per 30 days on
social group pan, tobacco &
intoxicants
fuel &
light
clothing footwear
misc. goods & services
durable goods
( includes second hand)
non- food total all
clothing (second hand)
durables (second hand)
no. of sample hhs reporting consumption
(1) (17) (18) (19) (20) (21) (22) (23) (24) (25) (26) (27)
Rural
scheduled tribe 17.72 31.25 26.61 3.71 59.68 8.08 147.05 387.86 0.36 0.13 10124
scheduled caste 15.38 33.91 28.20 5.45 75.08 7.86 165.89 418.88 0.15 0.10 12755
other backward classes 12.77 35.13 32.55 4.63 92.86 12.75 190.69 473.86 0.11 0.19 24721
others 13.22 41.80 39.71 6.77 123.69 17.55 242.73 577.56 0.08 0.69 23668
not recorded 12.51 31.09 31.77 4.39 87.12 7.11 173.99 464.59 0.01 0.00 117
all social groups 13.96 36.56 33.28 5.37 95.42 12.76 197.36 486.16 0.14 0.32 71385
Urban
scheduled tribe 21.45 51.75 43.78 8.51 183.93 24.72 334.13 690.77 0.47 0.33 3202
scheduled caste 19.17 48.13 37.88 6.83 152.33 16.77 281.10 608.99 0.26 0.57 5985
other backward classes 15.33 68.01 43.73 7.44 209.01 22.57 366.09 735.04 0.14 0.31 13668
others 15.60 71.27 60.89 12.58 342.32 40.09 542.76 1004.97 0.14 0.61 25966
not recorded 11.97 51.40 41.86 7.79 206.46 10.91 330.39 695.09 0.16 0.00 103
all social groups 16.22 66.26 51.76 10.05 268.93 30.85 444.07 854.92 0.17 0.50 48924

NSS Report No. 472: Differences in Level of Consumption among Socio-Economic Groups, 1999-2000 32
Statement 14: Break-up of MPCE by broad groups of food items separately for each land possessed class in rural India all-India Rural
average per capita consumption expenditure (Rs) per 30 days on
land possessed class
(hectare) cereals gram cereal substi- tutes
pulses & products
milk & milk
products
edible oil
meat, egg
& fish
vegeta- bles
fruits (fresh)
fruits (dry) sugar salt spices
beve- rages,
refresh- ments etc.
food total
(1) (2) (3) (4) (5) (6) (7) (8) (9) (10) (11) (12) (13) (14) (15) (16)
<0.01 95.31 0.74 0.41 19.04 35.74 19.34 13.95 31.67 6.39 1.62 11.12 1.10 13.83 31.98 282.22 0.01-0.40 107.78 0.59 0.38 16.82 30.92 17.43 18.64 30.29 6.98 1.14 10.12 1.11 13.75 21.26 277.22 0.41-1.00 110.67 0.59 0.28 18.49 40.70 17.86 15.89 29.99 6.31 1.29 10.84 1.09 12.39 16.68 283.07 1.01-2.00 109.38 0.64 0.31 20.09 51.59 18.24 13.89 29.32 6.70 1.65 12.56 1.04 12.14 17.18 294.73 2.01-4.00 107.58 0.71 0.39 21.74 66.08 19.68 12.54 29.12 7.33 2.23 15.11 1.03 14.42 19.62 317.59
4.01+ 106.14 0.96 0.43 22.86 92.70 21.43 9.73 28.66 8.45 3.08 18.48 1.04 13.59 23.19 350.75 all classes 107.75 0.64 0.36 18.50 42.56 18.16 16.14 29.98 6.89 1.47 11.57 1.09 13.32 20.38 288.80
average per capita consumption expenditure (Rs) per 30 days on
land possessed
class (hectare)
pan, tobacco &
intoxicants
fuel &
light
clothing footwear
misc. goods & services
durable goods
( includes second hand)
non- food total all
clothing (second hand)
durables (second hand)
no. of sample hhs reporting consumption
(1) (17) (18) (19) (20) (21) (22) (23) (24) (25) (26) (27)
<0.01 15.17 38.51 33.17 5.34 116.02 9.69 217.90 500.12 0.30 0.38 4419 0.01-0.40 13.74 36.17 30.41 4.98 89.08 10.77 185.14 462.37 0.14 0.24 33168 0.41-1.00 13.06 35.44 32.60 4.84 87.70 12.07 185.72 468.79 0.13 0.17 13691 1.01-2.00 13.70 35.62 34.84 5.47 93.55 13.35 196.53 491.27 0.08 0.39 9157 2.01-4.00 14.92 37.80 39.26 6.54 107.92 17.94 224.39 541.98 0.12 1.07 6142
4.01+ 16.89 42.02 46.24 8.42 138.51 25.00 277.07 627.82 0.08 0.15 4808 all classes 13.96 36.56 33.28 5.37 95.42 12.76 197.36 486.16 0.14 0.32 71385

NSS Report No. 472: Differences in Level of Consumption among Socio-Economic Groups, 1999-2000 33
Statement 15: Percentage distribution of MPCE over broad groups of items separately for each household type in rural and urban India all-India
percentage of average per capita consumption expenditure per 30 days on
household type cereals gram
cereal substi- tutes
pulses & products
milk & milk
products
edible oil
meat, egg
& fish
vegeta- bles
fruits (fresh)
fruits (dry)
sugar salt spices
beve- rages,
refresh- ments etc.
food total
(1) (2) (3) (4) (5) (6) (7) (8) (9) (10) (11) (12) (13) (14) (15) (16) Rural self-employed in non-agriculture
21.80 0.13 0.06 3.63 7.95 3.75 3.97 6.27 1.57 0.27 2.25 0.22 2.59 4.46 58.90
agricultural labour 26.77 0.12 0.08 4.10 5.21 4.03 3.63 7.03 1.15 0.28 2.30 0.27 3.47 4.01 62.46
other labour 21.34 0.14 0.16 3.46 6.68 3.59 4.20 5.98 1.72 0.26 2.25 0.22 2.89 5.51 58.39self-employed in agriculture
21.29 0.14 0.06 3.95 11.38 3.68 2.70 5.81 1.37 0.33 2.59 0.21 2.50 3.42 59.44
others 17.02 0.13 0.06 3.20 9.36 3.41 3.41 5.61 1.74 0.35 2.10 0.19 2.19 5.85 54.64
not recorded 26.64 0.08 0.01 3.98 8.87 3.68 4.27 6.84 1.05 0.13 2.18 0.27 2.35 3.63 63.96
all households 22.16 0.13 0.07 3.81 8.75 3.74 3.32 6.17 1.42 0.30 2.38 0.22 2.74 4.19 59.40
Urban
self-employed 12.75 0.11 0.03 2.89 9.43 3.19 3.05 5.23 2.01 0.46 1.71 0.16 2.31 5.96 49.29regular wage/salaried
11.19 0.11 0.04 2.73 8.64 3.08 3.11 4.97 1.99 0.53 1.53 0.15 1.79 6.37 46.22
casual labour 18.05 0.12 0.06 3.45 6.06 3.59 3.85 5.97 1.51 0.22 2.02 0.21 2.75 5.68 53.54
others 10.53 0.10 0.03 2.53 8.30 2.69 2.84 4.68 1.97 0.43 1.47 0.14 1.79 8.97 46.47
not recorded 14.67 0.22 0.08 3.15 9.05 3.23 3.40 5.63 1.66 0.40 1.85 0.20 2.19 5.01 50.75
all households 12.35 0.11 0.04 2.84 8.68 3.14 3.13 5.13 1.95 0.47 1.64 0.16 2.07 6.35 48.06
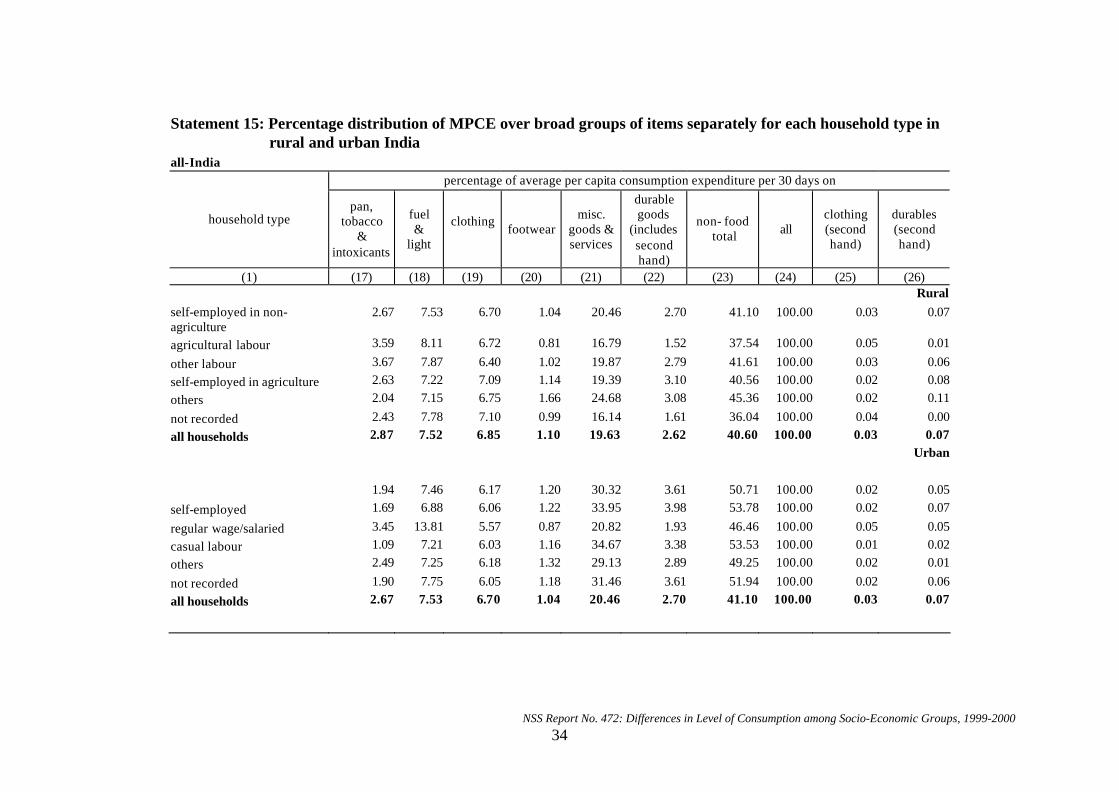
NSS Report No. 472: Differences in Level of Consumption among Socio-Economic Groups, 1999-2000 34
Statement 15: Percentage distribution of MPCE over broad groups of items separately for each household type in
rural and urban India all-India
percentage of average per capita consumption expenditure per 30 days on
household type pan,
tobacco &
intoxicants
fuel &
light
clothing footwear
misc. goods & services
durable goods
(includes second hand)
non- food total all
clothing (second hand)
durables (second hand)
(1) (17) (18) (19) (20) (21) (22) (23) (24) (25) (26) Rural self-employed in non-agriculture
2.67 7.53 6.70 1.04 20.46 2.70 41.10 100.00 0.03 0.07
agricultural labour 3.59 8.11 6.72 0.81 16.79 1.52 37.54 100.00 0.05 0.01
other labour 3.67 7.87 6.40 1.02 19.87 2.79 41.61 100.00 0.03 0.06
self-employed in agriculture 2.63 7.22 7.09 1.14 19.39 3.10 40.56 100.00 0.02 0.08
others 2.04 7.15 6.75 1.66 24.68 3.08 45.36 100.00 0.02 0.11
not recorded 2.43 7.78 7.10 0.99 16.14 1.61 36.04 100.00 0.04 0.00
all households 2.87 7.52 6.85 1.10 19.63 2.62 40.60 100.00 0.03 0.07
Urban
1.94 7.46 6.17 1.20 30.32 3.61 50.71 100.00 0.02 0.05
self-employed 1.69 6.88 6.06 1.22 33.95 3.98 53.78 100.00 0.02 0.07
regular wage/salaried 3.45 13.81 5.57 0.87 20.82 1.93 46.46 100.00 0.05 0.05
casual labour 1.09 7.21 6.03 1.16 34.67 3.38 53.53 100.00 0.01 0.02
others 2.49 7.25 6.18 1.32 29.13 2.89 49.25 100.00 0.02 0.01
not recorded 1.90 7.75 6.05 1.18 31.46 3.61 51.94 100.00 0.02 0.06
all households 2.67 7.53 6.70 1.04 20.46 2.70 41.10 100.00 0.03 0.07

NSS Report No. 472: Differences in Level of Consumption among Socio-Economic Groups, 1999-2000 35
Statement 16: Percentage distribution of MPCE over broad groups of items separately for each social group in rural and urban India all-India
percentage of average per capita consumption expenditure per 30 days on
social group cereals gram
cereal substi- tutes
pulses & products
milk & milk
products
edible oil
meat, egg
& fish
vegeta- bles
fruits (fresh)
fruits (dry) sugar salt spices
beve- rages,
refresh- ments etc,
food total
(1) (2) (3) (4) (5) (6) (7) (8) (9) (10) (11) (12) (13) (14) (15) (16)
Rural scheduled tribe 27.30 0.10 0.08 3.98 5.44 3.86 4.07 6.91 0.98 0.26 2.21 0.29 2.75 3.86 62.09 scheduled caste 24.94 0.12 0.04 3.92 6.55 3.80 3.52 6.67 1.07 0.19 2.36 0.25 2.92 4.04 60.40 other backward classes 22.30 0.14 0.07 3.99 8.82 3.76 3.04 6.05 1.51 0.27 2.34 0.22 3.02 4.22 59.76 others 19.54 0.14 0.09 3.53 10.47 3.66 3.33 5.88 1.59 0.40 2.46 0.20 2.38 4.31 57.97 not recorded 26.50 0.20 0.01 4.18 7.36 4.10 4.71 6.70 0.94 0.08 1.95 0.27 2.28 3.27 62.55 all social groups 22.16 0.13 0.07 3.81 8.75 3.74 3.32 6.17 1.42 0.30 2.38 0.22 2.74 4.19 59.40 Urban scheduled tribe 16.37 0.09 0.04 3.09 6.79 3.29 4.36 5.77 1.50 0.44 1.70 0.20 2.02 5.97 51.63 scheduled caste 16.46 0.13 0.03 3.43 7.53 3.70 3.77 6.24 1.51 0.29 2.09 0.22 2.37 6.07 53.84 other backward classes 14.24 0.12 0.04 3.16 7.70 3.15 3.51 5.17 1.84 0.32 1.70 0.17 2.92 6.15 50.19 others 10.65 0.10 0.04 2.58 9.38 3.03 2.81 4.90 2.09 0.57 1.53 0.15 1.66 6.50 45.99 not recorded 16.73 0.12 0.08 2.80 8.33 3.03 3.10 5.58 1.69 0.26 1.69 0.18 1.86 7.01 52.47 all social groups 12.35 0.11 0.04 2.84 8.68 3.14 3.13 5.13 1.95 0.47 1.64 0.16 2.07 6.35 48.06

NSS Report No. 472: Differences in Level of Consumption among Socio-Economic Groups, 1999-2000 36
Statement 16: Statement 16: Percentage distribution of MPCE over broad groups of items separately for each social group in
rural and urban India all-India
percentage of average per capita consumption expenditure per 30 days on
social group pan, tobacco &
intoxicants
fuel &
light
clothing footwear
misc. goods &
services
durable goods
(includes second hand)
non- food total all
clothing (second hand)
durables (second hand)
(1) (17) (18) (19) (20) (21) (22) (23) (24) (25) (26) Rural
scheduled tribe 4.57 8.06 6.86 0.96 15.39 2.08 37.91 100.00 0.09 0.03 scheduled caste 3.67 8.10 6.73 1.30 17.92 1.88 39.60 100.00 0.04 0.02 other backward classes 2.69 7.41 6.87 0.98 19.60 2.69 40.24 100.00 0.02 0.04 others 2.29 7.24 6.88 1.17 21.42 3.04 42.03 100.00 0.01 0.12 not recorded 2.69 6.69 6.84 0.94 18.75 1.53 37.45 100.00 0.00 0.00 all social groups 2.87 7.52 6.85 1.10 19.63 2.62 40.60 100.00 0.03 0.07 Urban scheduled tribe 3.11 7.49 6.34 1.23 26.63 3.58 48.37 100.00 0.07 0.05 scheduled caste 3.15 7.90 6.22 1.12 25.01 2.75 46.16 100.00 0.04 0.09 other backward classes 2.09 9.25 5.95 1.01 28.44 3.07 49.81 100.00 0.02 0.04 others 1.55 7.09 6.06 1.25 34.06 3.99 54.01 100.00 0.01 0.06 not recorded 1.72 7.39 6.02 1.12 29.70 1.57 47.53 100.00 0.02 0.00 all social groups 1.90 7.75 6.05 1.18 31.46 3.61 51.94 100.00 0.02 0.06

NSS Report No. 472: Differences in Level of Consumption among Socio-Economic Groups, 1999-2000 37
Statement 17: Statement 16: Percentage distribution of MPCE over broad groups of items separately for each land possessed class in rural and urban India
all-India Rural percentage of average per capita consumption expenditure per 30 days on
land possessed class
(hectare) cereals gram cereal substi- tutes
pulses & products
milk & milk
products
edible oil
meat, egg
& fish
vegeta- bles
fruits (fresh)
fruits (dry)
sugar salt spices
beve- rages,
refresh- ments etc.
food total
(1) (2) (3) (4) (5) (6) (7) (8) (9) (10) (11) (12) (13) (14) (15) (16)
<0.01 19.06 0.15 0.08 3.81 7.15 3.87 2.79 6.33 1.28 0.32 2.22 0.22 2.77 6.39 56.43 0.01-0.40 23.31 0.13 0.08 3.64 6.69 3.77 4.03 6.55 1.51 0.25 2.19 0.24 2.97 4.60 59.96 0.41-1.00 23.61 0.13 0.06 3.94 8.68 3.81 3.39 6.40 1.35 0.28 2.31 0.23 2.64 3.56 60.38 1.01-2.00 22.26 0.13 0.06 4.09 10.50 3.71 2.83 5.97 1.36 0.34 2.56 0.21 2.47 3.50 59.99 2.01-4.00 19.85 0.13 0.07 4.01 12.19 3.63 2.31 5.37 1.35 0.41 2.79 0.19 2.66 3.62 58.60
4.01+ 16.91 0.15 0.07 3.64 14.77 3.41 1.55 4.57 1.35 0.49 2.94 0.17 2.16 3.69 55.87 all classes 22.16 0.13 0.07 3.81 8.75 3.74 3.32 6.17 1.42 0.30 2.38 0.22 2.74 4.19 59.40
percentage of average per capita consumption expenditure per 30 days on
land possessed
class (hectare)
pan, tobacco &
intoxicants
fuel &
light
clothing
footwear misc.
goods & services
durable goods
(includes second hand)
non- food total
all clothing (second hand)
durables (second hand)
(1) (17) (18) (19) (20) (21) (22) (23) (24) (25) (26)
<0.01 3.03 7.70 6.63 1.07 23.20 1.94 43.57 100.00 0.06 0.08 0.01-0.40 2.97 7.82 6.58 1.08 19.27 2.33 40.04 100.00 0.03 0.05 0.41-1.00 2.79 7.56 6.95 1.03 18.71 2.57 39.62 100.00 0.03 0.04 1.01-2.00 2.79 7.25 7.09 1.11 19.04 2.72 40.00 100.00 0.02 0.08 2.01-4.00 2.75 6.97 7.24 1.21 19.91 3.31 41.40 100.00 0.02 0.20
4.01+ 2.69 6.69 7.37 1.34 22.06 3.98 44.13 100.00 0.01 0.02 all classes 2.87 7.52 6.85 1.10 19.63 2.62 40.60 100.00 0.03 0.07

NSS Report No. 472: Differences in Level of Consumption among Socio-Economic Groups, 1999-2000 38

NSS Report No. 472: Differences in Level of Consumption among Socio-Economic Groups, 1999-2000
September 2001
Appendix
Detailed tables
Estimates have been presented if number of sample households is 20 or more. A dash ‘-’ has been put for the cells having number of sample households less than 20.
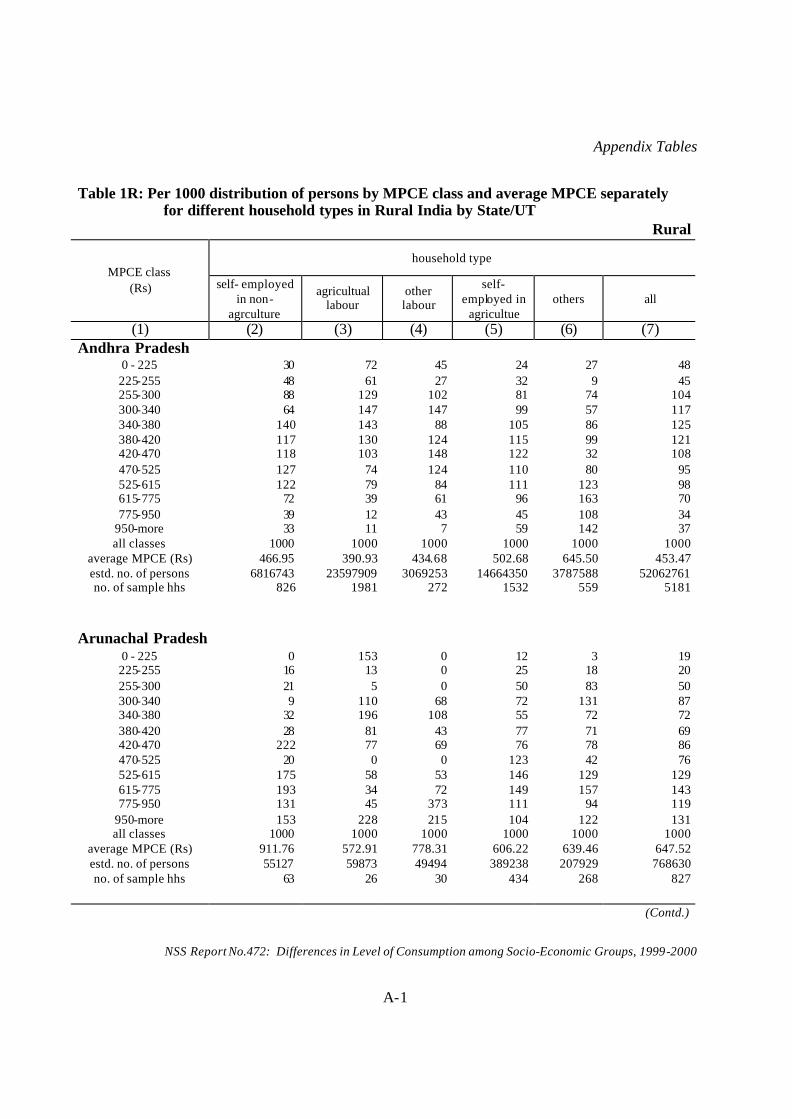
Appendix Tables
NSS Report No.472: Differences in Level of Consumption among Socio-Economic Groups, 1999-2000
A-1
Table 1R: Per 1000 distribution of persons by MPCE class and average MPCE separately for different household types in Rural India by State/UT
Rural
household type MPCE class
(Rs) self- employed in non-
agrculture
agricultual labour
other labour
self-employed in
agricultue others all
(1) (2) (3) (4) (5) (6) (7) Andhra Pradesh
0 - 225 30 72 45 24 27 48 225-255 48 61 27 32 9 45 255-300 88 129 102 81 74 104 300-340 64 147 147 99 57 117 340-380 140 143 88 105 86 125 380-420 117 130 124 115 99 121 420-470 118 103 148 122 32 108 470-525 127 74 124 110 80 95 525-615 122 79 84 111 123 98 615-775 72 39 61 96 163 70 775-950 39 12 43 45 108 34
950-more 33 11 7 59 142 37 all classes 1000 1000 1000 1000 1000 1000
average MPCE (Rs) 466.95 390.93 434.68 502.68 645.50 453.47 estd. no. of persons 6816743 23597909 3069253 14664350 3787588 52062761 no. of sample hhs 826 1981 272 1532 559 5181
Arunachal Pradesh
0 - 225 0 153 0 12 3 19 225-255 16 13 0 25 18 20 255-300 21 5 0 50 83 50 300-340 9 110 68 72 131 87 340-380 32 196 108 55 72 72 380-420 28 81 43 77 71 69 420-470 222 77 69 76 78 86 470-525 20 0 0 123 42 76 525-615 175 58 53 146 129 129 615-775 193 34 72 149 157 143 775-950 131 45 373 111 94 119
950-more 153 228 215 104 122 131 all classes 1000 1000 1000 1000 1000 1000
average MPCE (Rs) 911.76 572.91 778.31 606.22 639.46 647.52 estd. no. of persons 55127 59873 49494 389238 207929 768630 no. of sample hhs 63 26 30 434 268 827
(Contd.)

Appendix Tables
NSS Report No.472: Differences in Level of Consumption among Socio-Economic Groups, 1999-2000
A-2
Table 1R: Per 1000 distribution of persons by MPCE class and average MPCE separately for different household types in Rural India by State/UT
Rural
household type MPCE class
(Rs) self- employed in non-
agrculture
agricultual labour
other labour
self-employed in
agricultue others all
(1) (2) (3) (4) (5) (6) (7) Assam
0 - 225 36 162 112 19 14 58 225-255 47 98 96 31 25 53 255-300 84 171 136 75 50 97 300-340 107 159 144 101 62 112 340-380 164 124 163 123 78 129 380-420 112 130 114 137 72 119 420-470 150 65 71 172 86 124 470-525 96 38 91 113 122 96 525-615 98 33 42 129 196 106 615-775 65 17 18 76 181 72 775-950 28 3 9 17 79 24
950-more 13 0 4 8 35 11 all classes 1000 1000 1000 1000 1000 1000
average MPCE (Rs) 432.58 329.03 356.88 444.13 545.27 425.90 estd. no. of persons 3270433 3370378 2844570 7708749 2998529 20234911 no. of sample hhs 560 536 516 1307 530 3462
Bihar
0 - 225 44 123 229 37 69 79 225-255 82 135 89 47 52 84 255-300 161 195 191 122 124 156 300-340 132 171 149 137 140 149 340-380 144 136 131 133 102 132 380-420 109 77 79 125 85 100 420-470 118 58 50 131 110 98 470-525 80 50 53 75 86 67 525-615 66 30 13 92 96 64 615-775 40 19 14 63 73 44 775-950 15 4 1 26 24 16
950-more 8 2 2 13 40 11 all classes 1000 1000 1000 1000 1000 1000
average MPCE (Rs) 391.96 331.31 313.70 422.45 448.68 384.45 estd. no. of persons 10827008 27647689 3387380 29394753 7947994 79401995 no. of sample hhs 1156 2439 311 2551 829 7311
(Contd.)

Appendix Tables
NSS Report No.472: Differences in Level of Consumption among Socio-Economic Groups, 1999-2000
A-3
Table 1R: Per 1000 distribution of persons by MPCE class and average MPCE separately for different household types in Rural India by State/UT
Rural
household type MPCE class
(Rs) self- employed in non-
agrculture
agricultual labour
other labour
self-employed in
agricultue others all
(1) (2) (3) (4) (5) (6) (7) Goa
0 - 225 - - - - - - 225-255 - - - - - - 255-300 - - - - - - 300-340 0 83 65 0 0 29 340-380 0 141 0 0 0 24 380-420 0 0 0 289 0 26 420-470 81 168 160 15 60 100 470-525 0 87 31 59 38 41 525-615 179 130 107 191 146 144 615-775 171 148 198 139 166 168 775-950 248 120 258 41 82 149
950-more 321 123 180 265 507 319 all classes 1000 1000 1000 1000 1000 1000
average MPCE (Rs) 996.92 613.79 753.10 702.36 1046.78 868.66 estd. no. of persons 101439 117727 158691 63214 257401 698471 no. of sample hhs 30 29 34 19 80 192
Gujarat
0 - 225 14 23 86 18 3 23 225-255 12 34 62 11 9 23 255-300 35 98 41 19 41 53 300-340 48 123 47 36 25 69 340-380 85 127 38 55 23 81 380-420 80 91 109 58 39 74 420-470 125 151 123 96 72 119 470-525 128 109 223 116 136 124 525-615 193 128 105 184 91 151 615-775 132 90 129 196 226 148 775-950 65 18 19 101 156 65
950-more 85 8 17 112 179 70 all classes 1000 1000 1000 1000 1000 1000
average MPCE (Rs) 577.99 440.47 469.00 629.33 722.01 551.24 estd. no. of persons 3161749 10789066 2078537 10835428 2548602 29413381 no. of sample hhs 288 805 142 961 283 2479
(Contd.)

Appendix Tables
NSS Report No.472: Differences in Level of Consumption among Socio-Economic Groups, 1999-2000
A-4
Table 1R: Per 1000 distribution of persons by MPCE class and average MPCE separately for different household types in Rural India by State/UT
Rural
household type MPCE class
(Rs) self- employed in non-
agrculture
agricultual labour
other labour
self-employed in
agricultue others all
(1) (2) (3) (4) (5) (6) (7) Haryana
0 - 225 16 19 8 0 0 7 225-255 1 26 0 0 0 5 255-300 25 24 65 0 1 15 300-340 44 59 74 9 6 30 340-380 48 104 137 5 13 45 380-420 17 82 69 44 47 50 420-470 138 129 86 58 63 86 470-525 112 106 155 81 101 101 525-615 195 194 129 125 54 137 615-775 130 154 114 245 301 206 775-950 129 60 98 199 159 145
950-more 144 44 65 235 255 174 all classes 1000 1000 1000 1000 1000 1000
average MPCE (Rs) 664.00 543.08 544.75 808.05 821.71 714.16 estd. no. of persons 1881725 2673117 1405726 5623075 2163378 13797403 no. of sample hhs 161 174 108 490 195 1132
Himachal Pradesh
0 - 225 0 0 9 2 0 2 225-255 1 51 2 1 0 3 255-300 34 3 66 11 0 20 300-340 11 0 30 23 0 18 340-380 47 111 87 42 45 53 380-420 72 120 122 68 13 70 420-470 57 151 85 108 52 89 470-525 91 119 111 137 73 114 525-615 165 153 194 158 123 159 615-775 239 198 165 227 237 219 775-950 127 30 71 98 154 105
950-more 157 62 58 126 303 148 all classes 1000 1000 1000 1000 1000 1000
average MPCE (Rs) 701.33 541.00 562.23 661.23 877.12 684.29 estd. no. of persons 659012 188152 795388 2428859 876659 4950789 no. of sample hhs 216 63 233 784 337 1634
(Contd.)

Appendix Tables
NSS Report No.472: Differences in Level of Consumption among Socio-Economic Groups, 1999-2000
A-5
Table 1R: Per 1000 distribution of persons by MPCE class and average MPCE separately for different household types in Rural India by State/UT
Rural
household type MPCE class
(Rs) self- employed in non-
agrculture
agricultual labour
other labour
self-employed in
agricultue others all
(1) (2) (3) (4) (5) (6) (7) Jammu & Kashmir
0 - 225 - - - - - - 225-255 2 0 0 3 0 2 255-300 0 21 21 7 0 7 300-340 10 20 52 17 7 17 340-380 6 21 99 16 14 20 380-420 14 51 177 31 20 38 420-470 71 99 86 80 12 67 470-525 169 95 55 238 39 169 525-615 134 261 174 141 155 152 615-775 306 352 186 251 470 303 775-950 212 65 128 116 118 125
950-more 76 14 16 101 165 100 all classes 1000 1000 1000 1000 1000 1000
average MPCE (Rs) 683.61 595.33 545.32 659.55 791.73 676.99 estd. no. of persons 683561 375480 411859 3335949 1197155 6006439 no. of sample hhs 209 100 87 764 311 1472
Karnataka
0 - 225 1 50 36 13 5 27 225-255 40 56 70 25 3 39 255-300 84 122 46 62 38 86 300-340 41 118 98 79 63 90 340-380 90 146 70 100 29 111 380-420 98 111 161 90 61 101 420-470 75 130 138 115 102 117 470-525 93 97 20 124 68 101 525-615 158 93 145 139 163 125 615-775 117 55 88 123 181 98 775-950 95 15 89 65 133 54
950-more 108 8 39 63 153 51 all classes 1000 1000 1000 1000 1000 1000
average MPCE (Rs) 593.04 411.28 488.05 533.22 687.68 499.60 estd. no. of persons 3581211 13827049 1589295 13000117 2485012 34502633 no. of sample hhs 326 1012 125 1016 282 2763
(Contd.)

Appendix Tables
NSS Report No.472: Differences in Level of Consumption among Socio-Economic Groups, 1999-2000
A-6
Table 1R: Per 1000 distribution of persons by MPCE class and average MPCE separately for different household types in Rural India by State/UT
Rural
household type MPCE class
(Rs) self- employed in non-
agrculture
agricultual labour
other labour
self-employed in
agricultue others all
(1) (2) (3) (4) (5) (6) (7) Kerala
0 - 225 6 16 3 0 1 6 225-255 3 17 3 3 4 6 255-300 18 23 15 4 12 15 300-340 19 59 45 17 6 32 340-380 30 82 41 16 19 40 380-420 62 70 65 37 15 53 420-470 46 113 115 64 66 85 470-525 99 135 107 78 78 103 525-615 132 153 135 92 85 123 615-775 197 171 218 218 158 195 775-950 158 96 142 152 151 138
950-more 232 64 111 320 405 204 all classes 1000 1000 1000 1000 1000 1000
average MPCE (Rs) 799.56 569.50 655.77 925.46 1016.30 765.57 estd. no. of persons 3828305 4561860 5087497 3909088 2803853 20212310 no. of sample hhs 487 506 560 602 446 2604
Madhya Pradesh
0 - 225 84 176 138 57 36 103 225-255 72 120 167 69 47 90 255-300 100 203 221 114 48 145 300-340 104 130 101 117 57 116 340-380 109 119 120 122 88 118 380-420 98 89 53 100 50 91 420-470 78 52 56 99 309 91 470-525 103 48 49 94 60 75 525-615 95 30 36 95 87 69 615-775 73 23 40 71 103 55 775-950 61 5 8 32 39 24
950-more 23 6 12 27 77 22 all classes 1000 1000 1000 1000 1000 1000
average MPCE (Rs) 448.50 328.56 351.86 438.90 514.01 401.33 estd. no. of persons 4566311 21275063 2412208 27910010 3562603 59735574 no. of samp le hhs 418 1788 186 2402 348 5144
(Contd.)

Appendix Tables
NSS Report No.472: Differences in Level of Consumption among Socio-Economic Groups, 1999-2000
A-7
Table 1R: Per 1000 distribution of persons by MPCE class and average MPCE separately for different household types in Rural India by State/UT
Rural
household type MPCE class
(Rs) self- employed in non-
agrculture
agricultual labour
other labour
self-employed in
agricultue others all
(1) (2) (3) (4) (5) (6) (7) Maharashtra
0 - 225 21 81 11 22 28 47 225-255 46 76 8 37 3 49 255-300 59 145 82 70 29 97 300-340 48 140 64 86 28 97 340-380 65 112 97 73 36 87 380-420 71 117 77 83 51 92 420-470 106 105 101 125 71 107 470-525 105 88 73 128 101 102 525-615 132 53 184 139 124 104 615-775 155 48 117 124 228 106 775-950 108 22 99 58 154 61
950-more 83 11 86 55 145 51 all classes 1000 1000 1000 1000 1000 1000
average MPCE (Rs) 583.74 391.15 581.06 520.86 707.39 496.62 estd. no. of persons 4909659 23373570 4061079 16507586 6146692 55015485 no. of sample hhs 424 1610 226 1319 540 4121
Manipur
0 - 225 0 75 0 5 0 7 225-255 0 20 0 1 0 2 255-300 0 0 81 46 22 35 300-340 0 70 58 53 11 40 340-380 50 110 57 123 81 104 380-420 95 174 256 181 28 141 420-470 110 217 0 140 103 129 470-525 118 75 239 97 124 108 525-615 222 176 114 151 195 167 615-775 338 82 122 123 256 171 775-950 43 0 36 37 112 51
950-more 23 0 36 46 68 46 all classes 1000 1000 1000 1000 1000 1000
average MPCE (Rs) 582.20 441.32 505.25 508.61 626.67 537.46 estd. no. of persons 112254 75296 38101 754109 278404 1260775 no. of sample hhs 68 44 20 458 146 738
(Contd.)

Appendix Tables
NSS Report No.472: Differences in Level of Consumption among Socio-Economic Groups, 1999-2000
A-8
Table 1R: Per 1000 distribution of persons by MPCE class and average MPCE separately for different household types in Rural India by State/UT
Rural
household type MPCE class
(Rs) self- employed in non-
agrculture
agricultual labour
other labour
self-employed in
agricultue others all
(1) (2) (3) (4) (5) (6) (7) Meghalaya
0 - 225 0 1 0 0 0 0 225-255 0 0 0 0 0 0 255-300 0 37 0 3 0 6 300-340 26 78 0 18 13 24 340-380 0 99 31 57 13 51 380-420 51 100 264 77 25 77 420-470 28 154 142 168 47 141 470-525 180 121 230 201 75 176 525-615 338 261 52 247 205 244 615-775 203 105 239 176 368 196 775-950 133 35 10 28 105 45
950-more 41 9 34 24 148 40 all classes 1000 1000 1000 1000 1000 1000
average MPCE (Rs) 632.40 500.04 529.84 543.91 689.79 563.24 estd. no. of persons 96218 148782 33434 994854 185761 1462901 no. of sample hhs 67 103 27 631 103 933
Mizoram
0 - 225 - - - - - - 225-255 - - - - - - 255-300 0 25 0 5 4 4 300-340 0 131 0 5 0 6 340-380 22 0 0 27 0 20 380-420 76 22 0 62 0 49 420-470 31 43 0 58 0 43 470-525 35 0 0 160 46 122 525-615 46 111 0 189 93 153 615-775 175 606 107 249 274 257 775-950 212 7 314 178 287 200
950-more 403 55 580 67 296 145 all classes 1000 1000 1000 1000 1000 1000
average MPCE (Rs) 961.68 709.09 928.62 641.33 892.55 721.54 estd. no. of persons 27779 6028 4885 231433 65383 337888 no. of sample hhs 44 18 8 276 79 428
(Contd.)

Appendix Tables
NSS Report No.472: Differences in Level of Consumption among Socio-Economic Groups, 1999-2000
A-9
Table 1R: Per 1000 distribution of persons by MPCE class and average MPCE separately for different household types in Rural India by State/UT
Rural
household type MPCE class
(Rs) self- employed in non-
agrculture
agricultual labour
other labour
self-employed in
agricultue others all
(1) (2) (3) (4) (5) (6) (7) Nagaland
0 - 225 - - - - - - 225-255 - - - - - - 255-300 - - - - - - 300-340 0 0 0 4 0 2 340-380 12 0 0 0 0 1 380-420 0 0 63 10 0 8 420-470 0 0 0 7 0 4 470-525 0 323 0 25 29 28 525-615 0 0 76 70 14 50 615-775 317 0 244 246 280 258 775-950 123 0 427 266 233 246
950-more 548 677 189 373 443 403 all classes 1000 1000 1000 1000 1000 1000
average MPCE (Rs) 1223.65 866.27 835.76 891.57 1003.77 941.03 estd. no. of persons 24958 6492 14304 277814 150121 479466 no. of sample hhs 42 5 13 262 155 480
Orissa
0 - 225 105 246 191 95 76 162 225-255 53 143 102 95 17 102 255-300 116 168 140 130 80 139 300-340 137 144 138 134 75 131 340-380 129 94 42 114 70 99 380-420 93 78 100 104 84 89 420-470 119 54 103 85 82 76 470-525 79 34 53 83 68 59 525-615 70 17 42 67 127 52 615-775 65 14 48 58 159 51 775-950 18 4 18 18 73 19
950-more 19 4 23 16 87 19 all classes 1000 1000 1000 1000 1000 1000
average MPCE (Rs) 402.86 306.83 369.94 393.02 538.35 372.95 estd. no. of persons 3242832 12407847 1060508 9272014 3304362 29365462 no. of sample hhs 438 1356 118 1046 512 3477
(Contd.)

Appendix Tables
NSS Report No.472: Differences in Level of Consumption among Socio-Economic Groups, 1999-2000
A-10
Table 1R: Per 1000 distribution of persons by MPCE class and average MPCE separately for different household types in Rural India by State/UT
Rural
household type MPCE class
(Rs) self- employed in non-
agrculture
agricultual labour
other labour
self-employed in
agricultue others all
(1) (2) (3) (4) (5) (6) (7) Punjab
0 - 225 0 4 0 0 0 1 225-255 6 10 16 0 0 5 255-300 5 27 25 0 10 12 300-340 18 51 19 7 7 22 340-380 31 97 108 3 14 43 380-420 43 86 95 8 27 44 420-470 87 125 89 35 55 75 470-525 150 153 92 65 66 104 525-615 159 178 160 127 116 147 615-775 204 180 161 250 224 213 775-950 138 64 141 191 175 142
950-more 159 24 92 315 306 192 all classes 1000 1000 1000 1000 1000 1000
average MPCE (Rs) 687.20 536.98 622.52 908.86 854.13 742.29 estd. no. of persons 2210357 4146833 1219459 5182339 2288434 15047420 no. of sample hhs 316 530 154 774 378 2152
Rajasthan
0 - 225 6 38 17 6 8 10 225-255 12 44 23 7 3 12 255-300 18 74 101 38 38 47 300-340 53 109 63 57 35 60 340-380 46 100 118 71 39 74 380-420 105 103 122 94 54 97 420-470 121 177 135 123 94 127 470-525 151 73 131 135 130 131 525-615 173 138 145 156 157 156 615-775 191 57 99 193 222 171 775-950 75 40 28 66 96 62
950-more 48 46 17 56 125 54 all classes 1000 1000 1000 1000 1000 1000
average MPCE (Rs) 565.97 470.33 469.79 561.25 652.32 548.77 estd. no. of persons 4800727 2845778 5140079 20843271 2767635 36397491 no. of sample hhs 477 239 442 1744 327 3229
(Contd.)
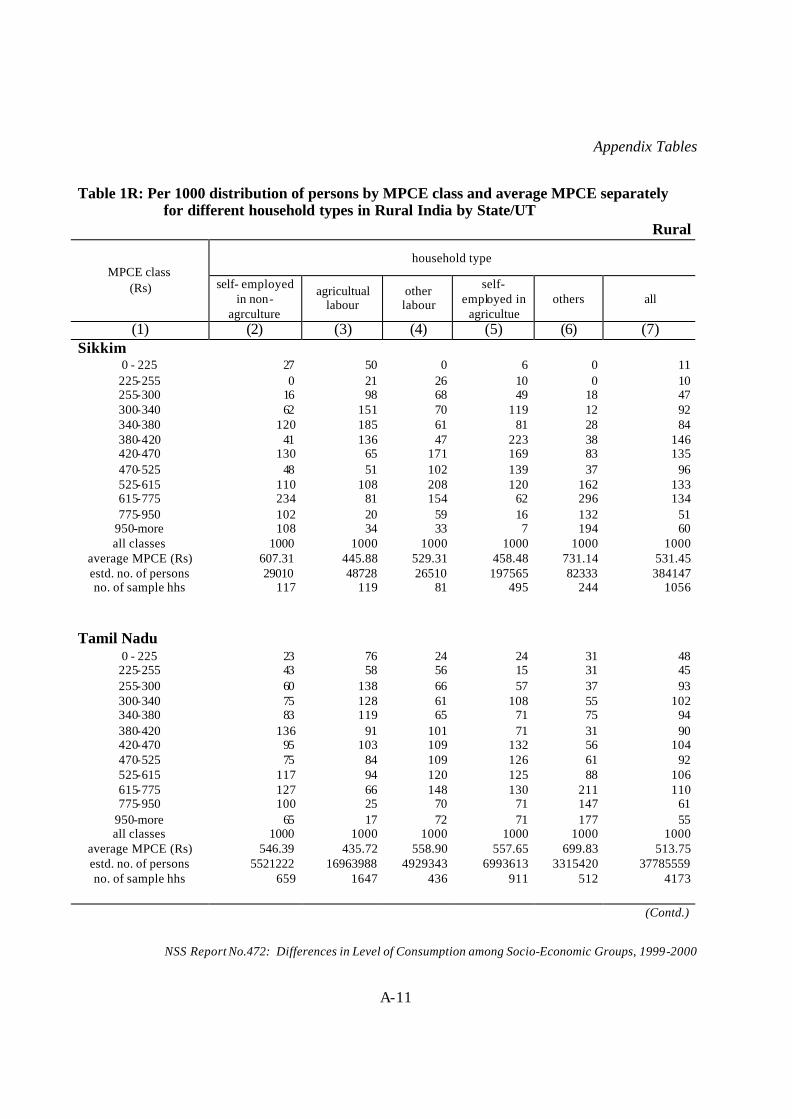
Appendix Tables
NSS Report No.472: Differences in Level of Consumption among Socio-Economic Groups, 1999-2000
A-11
Table 1R: Per 1000 distribution of persons by MPCE class and average MPCE separately for different household types in Rural India by State/UT
Rural
household type MPCE class
(Rs) self- employed in non-
agrculture
agricultual labour
other labour
self-employed in
agricultue others all
(1) (2) (3) (4) (5) (6) (7) Sikkim
0 - 225 27 50 0 6 0 11 225-255 0 21 26 10 0 10 255-300 16 98 68 49 18 47 300-340 62 151 70 119 12 92 340-380 120 185 61 81 28 84 380-420 41 136 47 223 38 146 420-470 130 65 171 169 83 135 470-525 48 51 102 139 37 96 525-615 110 108 208 120 162 133 615-775 234 81 154 62 296 134 775-950 102 20 59 16 132 51
950-more 108 34 33 7 194 60 all classes 1000 1000 1000 1000 1000 1000
average MPCE (Rs) 607.31 445.88 529.31 458.48 731.14 531.45 estd. no. of persons 29010 48728 26510 197565 82333 384147 no. of sample hhs 117 119 81 495 244 1056
Tamil Nadu
0 - 225 23 76 24 24 31 48 225-255 43 58 56 15 31 45 255-300 60 138 66 57 37 93 300-340 75 128 61 108 55 102 340-380 83 119 65 71 75 94 380-420 136 91 101 71 31 90 420-470 95 103 109 132 56 104 470-525 75 84 109 126 61 92 525-615 117 94 120 125 88 106 615-775 127 66 148 130 211 110 775-950 100 25 70 71 147 61
950-more 65 17 72 71 177 55 all classes 1000 1000 1000 1000 1000 1000
average MPCE (Rs) 546.39 435.72 558.90 557.65 699.83 513.75 estd. no. of persons 5521222 16963988 4929343 6993613 3315420 37785559 no. of sample hhs 659 1647 436 911 512 4173
(Contd.)

Appendix Tables
NSS Report No.472: Differences in Level of Consumption among Socio-Economic Groups, 1999-2000
A-12
Table 1R: Per 1000 distribution of persons by MPCE class and average MPCE separately for different household types in Rural India by State/UT
Rural
household type MPCE class
(Rs) self- employed in non-
agrculture
agricultual labour
other labour
self-employed in
agricultue others all
(1) (2) (3) (4) (5) (6) (7) Tripura
0 - 225 0 48 4 0 8 11 225-255 0 28 0 0 0 5 255-300 9 152 35 5 10 40 300-340 45 106 126 34 40 69 340-380 76 163 90 43 18 77 380-420 63 140 204 72 60 107 420-470 94 154 217 152 100 146 470-525 131 72 149 169 141 135 525-615 282 83 86 270 122 175 615-775 166 45 72 175 237 139 775-950 118 8 12 58 156 68
950-more 15 0 5 23 107 28 all classes 1000 1000 1000 1000 1000 1000
average MPCE (Rs) 571.79 395.68 451.59 561.26 659.75 528.09 estd. no. of persons 467970 442261 487022 593901 427133 2426079 no. of sample hhs 193 181 214 251 189 1031
Uttar Pradesh
0 - 225 41 101 62 26 24 44 225-255 46 106 46 35 41 51 255-300 137 173 140 85 86 113 300-340 120 144 135 105 70 113 340-380 140 121 99 110 97 115 380-420 107 97 139 107 108 107 420-470 99 77 95 108 82 98 470-525 89 66 76 98 83 88 525-615 80 56 92 120 131 102 615-775 80 37 56 111 135 91 775-950 35 15 40 53 54 43
950-more 25 8 20 43 89 36 all classes 1000 1000 1000 1000 1000 1000
average MPCE (Rs) 439.84 368.36 427.69 499.41 553.32 466.44 estd. no. of persons 20386351 23374775 7514552 66124685 10991870 128656471 no. of sample hhs 1492 1637 547 4741 994 9432
(Contd.)
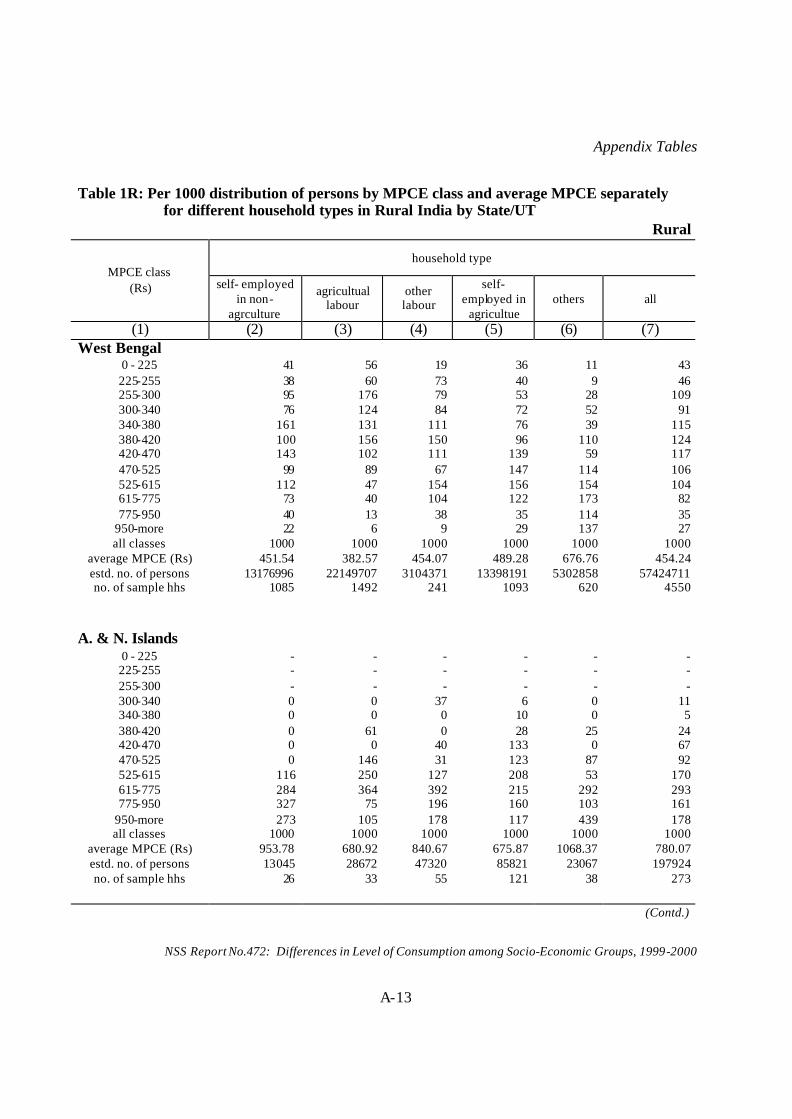
Appendix Tables
NSS Report No.472: Differences in Level of Consumption among Socio-Economic Groups, 1999-2000
A-13
Table 1R: Per 1000 distribution of persons by MPCE class and average MPCE separately for different household types in Rural India by State/UT
Rural
household type MPCE class
(Rs) self- employed in non-
agrculture
agricultual labour
other labour
self-employed in
agricultue others all
(1) (2) (3) (4) (5) (6) (7) West Bengal
0 - 225 41 56 19 36 11 43 225-255 38 60 73 40 9 46 255-300 95 176 79 53 28 109 300-340 76 124 84 72 52 91 340-380 161 131 111 76 39 115 380-420 100 156 150 96 110 124 420-470 143 102 111 139 59 117 470-525 99 89 67 147 114 106 525-615 112 47 154 156 154 104 615-775 73 40 104 122 173 82 775-950 40 13 38 35 114 35
950-more 22 6 9 29 137 27 all classes 1000 1000 1000 1000 1000 1000
average MPCE (Rs) 451.54 382.57 454.07 489.28 676.76 454.24 estd. no. of persons 13176996 22149707 3104371 13398191 5302858 57424711 no. of sample hhs 1085 1492 241 1093 620 4550
A. & N. Islands
0 - 225 - - - - - - 225-255 - - - - - - 255-300 - - - - - - 300-340 0 0 37 6 0 11 340-380 0 0 0 10 0 5 380-420 0 61 0 28 25 24 420-470 0 0 40 133 0 67 470-525 0 146 31 123 87 92 525-615 116 250 127 208 53 170 615-775 284 364 392 215 292 293 775-950 327 75 196 160 103 161
950-more 273 105 178 117 439 178 all classes 1000 1000 1000 1000 1000 1000
average MPCE (Rs) 953.78 680.92 840.67 675.87 1068.37 780.07 estd. no. of persons 13045 28672 47320 85821 23067 197924 no. of sample hhs 26 33 55 121 38 273
(Contd.)

Appendix Tables
NSS Report No.472: Differences in Level of Consumption among Socio-Economic Groups, 1999-2000
A-14
Table 1R: Per 1000 distribution of persons by MPCE class and average MPCE separately for different household types in Rural India by State/UT
Rural
household type MPCE class
(Rs) self- employed in non-
agrculture
agricultual labour
other labour
self-employed in
agricultue others all
(1) (2) (3) (4) (5) (6) (7) Chandigarh
0 - 225 6 0 0 0 0 1 225-255 0 0 0 0 0 0 255-300 0 0 0 0 52 18 300-340 56 0 182 0 54 58 340-380 0 0 0 0 0 0 380-420 0 122 0 0 0 16 420-470 179 149 192 0 0 88 470-525 147 0 0 0 0 32 525-615 68 48 150 0 105 80 615-775 98 230 61 0 174 120 775-950 136 274 157 39 169 154
950-more 309 178 258 961 446 433 all classes 1000 1000 1000 1000 1000 1000
average MPCE (Rs) 824.70 783.44 768.60 1411.65 1076.83 988.97 estd. no. of persons 21811 12828 14847 15392 33984 98862 no. of sample hhs 47 24 28 6 75 180
Dadra & Nagar Haveli
0 - 225 0 0 53 27 0 27 225-255 8 26 84 46 0 47 255-300 0 0 134 58 0 63 300-340 185 199 74 63 0 83 340-380 0 30 22 150 0 70 380-420 68 57 107 116 19 92 420-470 70 308 176 152 77 154 470-525 110 75 94 114 11 93 525-615 119 189 31 184 252 140 615-775 56 97 133 56 96 87 775-950 197 18 34 34 19 48
950-more 188 0 57 0 526 97 all classes 1000 1000 1000 1000 1000 1000
average MPCE (Rs) 656.33 463.35 483.28 447.57 1144.64 561.12 estd. no. of persons 14519 11032 41522 56868 16084 140026 no. of sample hhs 27 18 52 64 31 192
(Contd.)

Appendix Tables
NSS Report No.472: Differences in Level of Consumption among Socio-Economic Groups, 1999-2000
A-15
Table 1R: Per 1000 distribution of persons by MPCE class and average MPCE separately for different household types in Rural India by State/UT
Rural
household type MPCE class
(Rs) self- employed in non-
agrculture
agricultual labour
other labour
self-employed in
agricultue others all
(1) (2) (3) (4) (5) (6) (7) Daman & Diu
0 - 225 - - - - - - 225-255 - - - - - - 255-300 - - - - - - 300-340 0 90 0 0 0 23 340-380 0 85 0 0 0 22 380-420 0 0 0 0 0 0 420-470 0 219 17 0 0 62 470-525 0 13 103 0 0 39 525-615 0 122 76 268 64 98 615-775 288 254 218 192 69 207 775-950 305 172 123 262 126 173
950-more 408 46 463 278 741 376 all classes 1000 1000 1000 1000 1000 1000
average MPCE (Rs) 1009.41 609.58 944.82 794.90 1248.99 901.38 estd. no. of persons 7310 15774 21575 6883 10381 61923 no. of sample hhs 25 37 56 20 42 180
Delhi
0 - 225 - - - - - - 225-255 - - - - - - 255-300 - - - - - - 300-340 - - - - - - 340-380 0 97 0 0 6 7 380-420 3 0 0 0 8 6 420-470 0 101 221 0 0 6 470-525 58 144 0 172 19 41 525-615 210 0 345 0 33 93 615-775 123 355 0 103 253 208 775-950 413 0 435 302 126 225
950-more 193 304 0 422 553 415 all classes 1000 1000 1000 1000 1000 1000
average MPCE (Rs) 854.68 761.46 689.25 997.43 961.57 916.85 estd. no. of persons 1044144 116904 25005 74868 1850372 3111293 no. of sample hhs 61 15 3 9 99 187
(Contd.)

Appendix Tables
NSS Report No.472: Differences in Level of Consumption among Socio-Economic Groups, 1999-2000
A-16
Table 1R: Per 1000 distribution of persons by MPCE class and average MPCE separately for different household types in Rural India by State/UT
Rural
household type MPCE class
(Rs) self- employed in non-
agrculture
agricultual labour
other labour
self-employed in
agricultue others all
(1) (2) (3) (4) (5) (6) (7) Lakshadweep
0 - 225 - - - - - - 225-255 - - - - - - 255-300 - - - - - - 300-340 - - - - - - 340-380 - - - - - - 380-420 - - - - - - 420-470 0 0 142 0 35 39 470-525 0 62 118 0 145 95 525-615 0 665 95 0 167 151 615-775 0 0 223 291 97 154 775-950 236 150 47 394 240 243
950-more 764 123 375 315 316 319 all classes 1000 1000 1000 1000 1000 1000
average MPCE (Rs) 1073.05 684.97 833.58 925.26 886.09 876.13 estd. no. of persons 783 2681 4886 8222 16309 32880 no. of sample hhs 5 6 16 21 36 84
Pondicherry
0 - 225 0 51 0 0 0 25 225-255 0 60 0 26 0 32 255-300 0 102 0 0 5 51 300-340 47 79 11 0 13 49 340-380 35 147 103 0 0 95 380-420 55 86 22 0 56 61 420-470 140 117 150 0 14 103 470-525 229 94 64 176 0 96 525-615 139 107 140 118 170 126 615-775 121 79 206 86 145 117 775-950 144 29 179 195 193 104
950-more 91 48 125 399 402 141 all classes 1000 1000 1000 1000 1000 1000
average MPCE (Rs) 643.56 457.21 660.20 813.38 867.51 597.48 estd. no. of persons 35308 154641 56064 21290 44262 311565 no. of sample hhs 32 125 49 30 52 288
(Contd.)

Appendix Tables
NSS Report No.472: Differences in Level of Consumption among Socio-Economic Groups, 1999-2000
A-17
Table 1R: Per 1000 distribution of persons by MPCE class and average MPCE separately for different household types in Rural India by State/UT
Rural
household type MPCE class
(Rs) self- employed in non-
agrculture
agricultual labour
other labour
self-employed in
agricultue others all
(1) (2) (3) (4) (5) (6) (7) all-India
0 - 225 34 95 55 28 25 52 225-255 42 83 48 35 21 50 255-300 92 151 97 75 54 100 300-340 84 134 91 91 56 100 340-380 114 124 94 95 61 103 380-420 97 104 107 97 68 97 420-470 108 92 104 113 85 102 470-525 100 75 95 107 86 93 525-615 113 66 110 123 120 103 615-775 101 48 100 121 177 99 775-950 63 17 58 57 99 50
950-more 52 11 40 58 149 50 all classes 1000 1000 1000 1000 1000 1000
average MPCE (Rs) 502.28 385.98 482.74 519.53 652.05 485.88 estd. no. of persons 95575876 214815977 51134764 260903547 68137572 691783624 no. of sample hhs 10385 18698 5390 27134 9640 71385

Appendix Tables
NSS Report No.472: Differences in Level of Consumption among Socio-Economic Groups, 1999-2000
A-18
Table 1U: Per 1000 distribution of persons by MPCE class and average MPCE separately for different household types in urban India, by State/UT
Urban
household type MPCE class
(Rs) self-employed regular
wage/salary earning
casual labour
others all
(1) (2) (3) (4) (5) (6) Andhra Pradesh
0-300 46 15 127 37 49 300-350 60 23 97 42 52 350-425 129 56 216 55 112 425-500 119 91 205 67 121 500-575 125 85 153 62 110 575-665 110 91 90 118 99 665-775 100 139 43 88 104 775-915 103 108 25 75 88
915-1120 73 133 30 153 93 1120-1500 86 144 8 126 96 1500-1925 30 58 7 99 41 1925-more 20 56 0 77 34 all classes 1000 1000 1000 1000 1000
average MPCE (Rs) 709.78 934.82 482.28 1010.49 773.34 estd. no. of persons 7107748 8482972 4220116 1356997 21241239 no. of sample hhs 1246 1574 570 407 3806
Arunachal Pradesh
0-300 85 34 99 59 50 300-350 0 0 0 0 0 350-425 256 77 172 96 119 425-500 88 125 81 129 115 500-575 77 143 136 0 110 575-665 47 133 0 77 102 665-775 34 105 29 312 113 775-915 197 163 233 94 163
915-1120 50 89 26 14 70 1120-1500 95 50 224 177 84 1500-1925 66 46 0 9 45 1925-more 5 36 0 34 28 all classes 1000 1000 1000 1000 1000
average MPCE (Rs) 712.25 779.74 714.13 752.02 762.20 estd. no. of persons 13078 41259 3521 8626 66949 no. of sample hhs 39 141 17 31 233
(Contd.)

Appendix Tables
NSS Report No.472: Differences in Level of Consumption among Socio-Economic Groups, 1999-2000
A-19
Table 1U: Per 1000 distribution of persons by MPCE class and average MPCE separately for different household types in urban India, by State/UT
Urban
household type MPCE class
(Rs) self-employed regular
wage/salary earning
casual labour
others all
(1) (2) (3) (4) (5) (6) Assam
0-300 40 18 179 16 43 300-350 61 0 83 25 36 350-425 87 45 214 108 87 425-500 237 79 292 83 165 500-575 88 61 51 75 72 575-665 74 150 41 145 107 665-775 89 103 42 94 89 775-915 99 99 76 77 94
915-1120 74 125 7 185 100 1120-1500 115 170 15 92 124 1500-1925 17 76 0 36 39 1925-more 20 75 0 63 43 all classes 1000 1000 1000 1000 1000
average MPCE (Rs) 705.18 1006.78 464.37 873.66 813.82 estd. no. of persons 932071 846107 235683 273303 2296657 no. of sample hhs 270 354 79 145 852
Bihar
0-300 137 37 408 69 132 300-350 137 98 197 126 132 350-425 220 100 189 112 165 425-500 121 102 119 136 117 500-575 106 96 52 77 92 575-665 89 114 18 78 86 665-775 71 97 8 100 75 775-915 42 103 3 55 58
915-1120 28 75 0 130 51 1120-1500 23 100 4 77 51 1500-1925 19 40 1 22 23 1925-more 7 39 1 18 17 all classes 1000 1000 1000 1000 1000
average MPCE (Rs) 524.60 784.02 343.08 678.48 601.58 estd. no. of persons 5188337 3715916 1481160 1488575 11975995 no. of sample hhs 881 766 278 336 2279
(Contd.)

Appendix Tables
NSS Report No.472: Differences in Level of Consumption among Socio-Economic Groups, 1999-2000
A-20
Table 1U: Per 1000 distribution of persons by MPCE class and average MPCE separately for different household types in urban India, by State/UT
Urban
household type MPCE class
(Rs) self-employed regular
wage/salary earning
casual labour
others all
(1) (2) (3) (4) (5) (6) Goa
0-300 0 0 0 19 1 300-350 0 0 0 0 0 350-425 78 6 111 0 36 425-500 15 11 48 0 17 500-575 86 31 45 0 42 575-665 34 72 129 284 87 665-775 50 86 220 83 100 775-915 186 165 245 82 176
915-1120 146 210 140 86 179 1120-1500 258 155 42 261 163 1500-1925 114 148 15 60 114 1925-more 33 118 5 127 84 all classes 1000 1000 1000 1000 1000
average MPCE (Rs) 1075.61 1285.82 778.13 1157.29 1155.35 estd. no. of persons 121760 373084 103506 39879 638229 no. of sample hhs 52 170 40 22 284
Gujarat
0-300 11 5 26 12 11 300-350 27 10 54 2 25 350-425 56 16 129 45 54 425-500 70 87 205 55 100 500-575 111 82 149 103 107 575-665 124 92 127 126 113 665-775 140 109 139 86 126 775-915 133 138 82 85 123
915-1120 104 153 62 135 116 1120-1500 119 181 23 164 127 1500-1925 57 70 5 72 53 1925-more 48 56 0 115 45 all classes 1000 1000 1000 1000 1000
average MPCE (Rs) 890.28 995.88 600.17 1201.07 891.59 estd. no. of persons 5474567 5121986 2501496 650941 13750406 no. of sample hhs 1086 1007 432 238 2764
(Contd.)
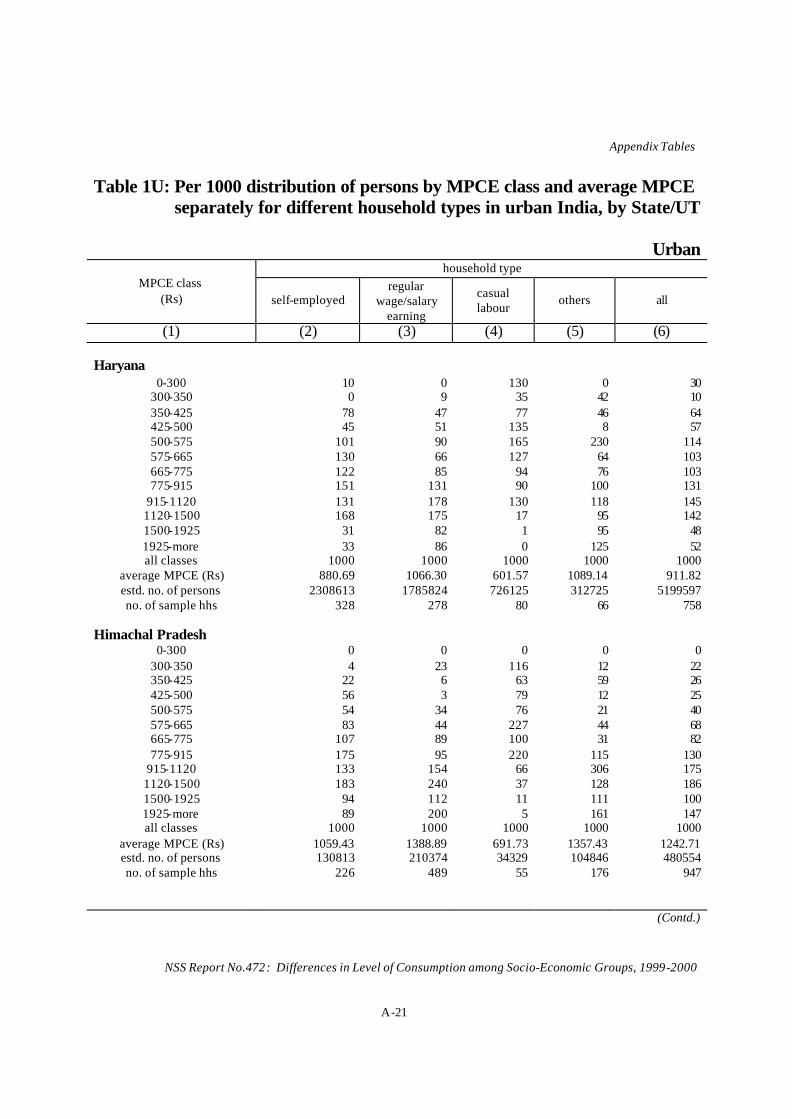
Appendix Tables
NSS Report No.472: Differences in Level of Consumption among Socio-Economic Groups, 1999-2000
A-21
Table 1U: Per 1000 distribution of persons by MPCE class and average MPCE separately for different household types in urban India, by State/UT
Urban
household type MPCE class
(Rs) self-employed regular
wage/salary earning
casual labour
others all
(1) (2) (3) (4) (5) (6) Haryana
0-300 10 0 130 0 30 300-350 0 9 35 42 10 350-425 78 47 77 46 64 425-500 45 51 135 8 57 500-575 101 90 165 230 114 575-665 130 66 127 64 103 665-775 122 85 94 76 103 775-915 151 131 90 100 131
915-1120 131 178 130 118 145 1120-1500 168 175 17 95 142 1500-1925 31 82 1 95 48 1925-more 33 86 0 125 52 all classes 1000 1000 1000 1000 1000
average MPCE (Rs) 880.69 1066.30 601.57 1089.14 911.82 estd. no. of persons 2308613 1785824 726125 312725 5199597 no. of sample hhs 328 278 80 66 758
Himachal Pradesh
0-300 0 0 0 0 0 300-350 4 23 116 12 22 350-425 22 6 63 59 26 425-500 56 3 79 12 25 500-575 54 34 76 21 40 575-665 83 44 227 44 68 665-775 107 89 100 31 82 775-915 175 95 220 115 130
915-1120 133 154 66 306 175 1120-1500 183 240 37 128 186 1500-1925 94 112 11 111 100 1925-more 89 200 5 161 147 all classes 1000 1000 1000 1000 1000
average MPCE (Rs) 1059.43 1388.89 691.73 1357.43 1242.71 estd. no. of persons 130813 210374 34329 104846 480554 no. of sample hhs 226 489 55 176 947
(Contd.)

Appendix Tables
NSS Report No.472: Differences in Level of Consumption among Socio-Economic Groups, 1999-2000
A-22
Table 1U: Per 1000 distribution of persons by MPCE class and average MPCE separately for different household types in urban India, by State/UT
Urban
household type MPCE class
(Rs) self-employed regular
wage/salary earning
casual labour
others all
(1) (2) (3) (4) (5) (6) Jammu & Kashmir
0-300 0 0 0 0 0 300-350 0 3 15 1 3 350-425 25 7 51 2 18 425-500 44 20 149 54 45 500-575 78 33 156 55 65 575-665 117 77 245 12 106 665-775 153 145 184 109 149 775-915 249 177 119 230 202
915-1120 163 234 52 189 184 1120-1500 118 165 28 187 134 1500-1925 39 77 1 123 58 1925-more 13 62 0 37 34 all classes 1000 1000 1000 1000 1000
average MPCE (Rs) 889.75 1061.79 650.08 1065.24 952.55 estd. no. of persons 598270 663091 158519 106312 1528457 no. of sample hhs 383 447 97 79 1008
Karnataka
0-300 29 13 107 9 34 300-350 39 10 70 8 30 350-425 90 51 175 65 86 425-500 89 67 150 61 88 500-575 111 67 150 47 95 575-665 107 81 148 133 105 665-775 110 96 74 111 99 775-915 106 107 56 90 97
915-1120 101 149 40 179 117 1120-1500 112 205 26 120 136 1500-1925 61 70 1 95 57 1925-more 44 84 3 83 56 all classes 1000 1000 1000 1000 1000
average MPCE (Rs) 847.90 1081.97 541.29 1101.20 910.78 estd. no. of persons 4631678 5551534 2268764 948025 13427101 no. of sample hhs 831 1010 374 252 2470
(Contd.)

Appendix Tables
NSS Report No.472: Differences in Level of Consumption among Socio-Economic Groups, 1999-2000
A-23
Table 1U: Per 1000 distribution of persons by MPCE class and average MPCE separately for different household types in urban India, by State/UT
Urban
household type MPCE class
(Rs) self-employed regular
wage/salary earning
casual labour
others all
(1) (2) (3) (4) (5) (6) Kerala
0-300 11 15 51 0 23 300-350 20 9 59 9 28 350-425 68 65 166 15 92 425-500 87 36 127 93 86 500-575 78 45 142 58 87 575-665 100 100 91 108 98 665-775 127 83 131 80 113 775-915 116 112 81 77 101
915-1120 140 128 72 110 116 1120-1500 130 198 50 158 126 1500-1925 60 98 20 77 59 1925-more 63 113 8 214 71 all classes 1000 1000 1000 1000 1000
average MPCE (Rs) 949.50 1128.87 653.06 1258.46 932.48 estd. no. of persons 2670152 1851108 2103629 539527 7192382 no. of sample hhs 739 587 471 212 2015
Madhya Pradesh
0-300 57 32 273 41 83 300-350 77 53 161 45 80 350-425 139 105 158 102 128 425-500 129 95 195 96 125 500-575 132 75 95 30 98 575-665 109 134 36 141 108 665-775 105 132 36 116 105 775-915 86 128 30 116 95
915-1120 70 87 4 94 67 1120-1500 56 88 9 106 63 1500-1925 30 35 4 35 28 1925-more 10 34 0 78 21 all classes 1000 1000 1000 1000 1000
average MPCE (Rs) 668.12 801.27 417.46 958.45 693.36 estd. no. of persons 6762579 6292364 2837588 1050626 16994867 no. of sample hhs 1204 1233 445 253 3145
(Contd.)

Appendix Tables
NSS Report No.472: Differences in Level of Consumption among Socio-Economic Groups, 1999-2000
A-24
Table 1U: Per 1000 distribution of persons by MPCE class and average MPCE separately for different household types in urban India, by State/UT
Urban
household type MPCE class
(Rs) self-employed regular
wage/salary earning
casual labour
others all
(1) (2) (3) (4) (5) (6) Maharashtra
0-300 48 11 169 13 41 300-350 50 10 112 15 35 350-425 89 38 199 23 72 425-500 86 58 129 44 75 500-575 101 80 103 26 87 575-665 90 95 112 44 93 665-775 98 132 56 104 112 775-915 92 131 47 69 106
915-1120 104 143 35 164 119 1120-1500 103 147 29 130 119 1500-1925 55 78 6 196 67 1925-more 84 76 2 172 74 all classes 1000 1000 1000 1000 1000
average MPCE (Rs) 966.14 1043.44 516.49 1418.32 973.16 estd. no. of persons 11151606 18028650 3857063 1359162 34487488 no. of sample hhs 1632 2768 504 318 5234
Manipur 0-300 0 0 0 0 0
300-350 5 6 0 0 5 350-425 127 13 159 18 68 425-500 195 96 210 297 157 500-575 177 118 467 248 162 575-665 147 201 92 218 178 665-775 197 236 56 134 205 775-915 90 118 16 39 97
915-1120 21 72 0 21 44 1120-1500 33 116 0 19 69 1500-1925 7 7 0 6 7 1925-more 1 17 0 0 8 all classes 1000 1000 1000 1000 1000
average MPCE (Rs) 616.36 823.23 519.28 594.32 707.43 estd. no. of persons 175033 192480 11528 32692 414351 no. of sample hhs 285 262 30 83 665
(Contd.)

Appendix Tables
NSS Report No.472: Differences in Level of Consumption among Socio-Economic Groups, 1999-2000
A-25
Table 1U: Per 1000 distribution of persons by MPCE class and average MPCE separately for different household types in urban India, by State/UT
Urban
household type MPCE class
(Rs) self-employed regular
wage/salary earning
casual labour
others all
(1) (2) (3) (4) (5) (6)
Meghalaya
0-300 0 0 0 0 0 300-350 0 0 0 0 0 350-425 0 0 63 0 6 425-500 14 4 82 0 14 500-575 82 46 259 15 73 575-665 229 53 97 0 90 665-775 117 172 207 199 165 775-915 131 338 120 250 264
915-1120 210 104 58 115 122 1120-1500 156 164 105 212 159 1500-1925 46 95 10 104 78 1925-more 15 25 0 105 28 all classes 1000 1000 1000 1000 1000
average MPCE (Rs) 907.64 1006.82 715.43 1162.19 971.64 estd. no. of persons 62910 178603 29945 23314 295653 no. of sample hhs 76 205 36 65 384
Mizoram
0-300 0 0 0 0 0 300-350 0 0 0 0 0 350-425 21 7 37 30 17 425-500 11 17 79 0 29 500-575 22 29 105 43 37 575-665 128 38 182 149 97 665-775 148 74 120 175 113 775-915 176 162 197 185 171
915-1120 188 231 148 215 204 1120-1500 170 272 124 152 204 1500-1925 48 88 9 37 59 1925-more 88 82 0 14 69 all classes 1000 1000 1000 1000 1000
average MPCE (Rs) 1039.41 1182.12 787.50 904.04 1056.27 estd. no. of persons 82364 96258 29538 15058 226049 no. of sample hhs 298 388 105 59 858
(Contd.)

Appendix Tables
NSS Report No.472: Differences in Level of Consumption among Socio-Economic Groups, 1999-2000
A-26
Table 1U: Per 1000 distribution of persons by MPCE class and average MPCE separately for different household types in urban India, by State/UT
Urban
household type MPCE class
(Rs) self-employed regular
wage/salary earning
casual labour
others all
(1) (2) (3) (4) (5) (6)
Nagaland
0-300 0 0 0 0 0 300-350 0 0 0 0 0 350-425 27 0 0 0 4 425-500 0 0 102 0 2 500-575 0 6 0 0 4 575-665 30 78 239 56 70 665-775 0 83 0 52 66 775-915 95 151 411 94 139
915-1120 291 151 44 332 198 1120-1500 201 327 82 135 271 1500-1925 163 118 82 300 153 1925-more 193 85 39 31 91 all classes 1000 1000 1000 1000 1000
average MPCE (Rs) 1384.13 1208.73 934.09 1293.65 1242.11 estd. no. of persons 30561 140972 4465 34513 211103 no. of sample hhs 33 175 7 47 264
Orissa
0-300 148 30 279 78 117 300-350 79 47 235 101 94 350-425 161 85 203 95 133 425-500 155 135 104 123 136 500-575 106 137 74 164 118 575-665 79 114 37 103 88 665-775 109 116 27 108 98 775-915 59 113 10 62 73
915-1120 60 79 18 91 63 1120-1500 34 88 10 55 54 1500-1925 6 28 1 6 14 1925-more 3 28 0 13 13 all classes 1000 1000 1000 1000 1000
average MPCE (Rs) 553.36 759.36 395.34 655.84 618.22 estd. no. of persons 2034778 2321505 957352 437974 5757632 no. of sample hhs 317 471 152 107 1050
(Contd.)
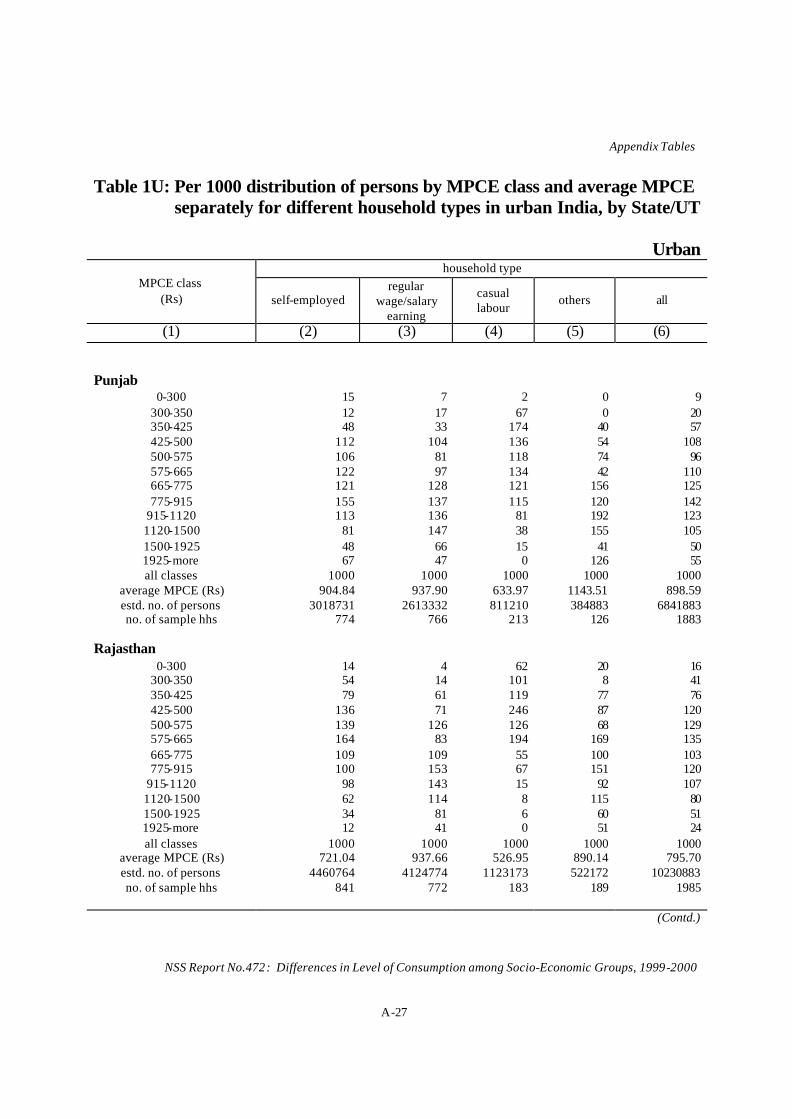
Appendix Tables
NSS Report No.472: Differences in Level of Consumption among Socio-Economic Groups, 1999-2000
A-27
Table 1U: Per 1000 distribution of persons by MPCE class and average MPCE separately for different household types in urban India, by State/UT
Urban
household type MPCE class
(Rs) self-employed regular
wage/salary earning
casual labour
others all
(1) (2) (3) (4) (5) (6)
Punjab
0-300 15 7 2 0 9 300-350 12 17 67 0 20 350-425 48 33 174 40 57 425-500 112 104 136 54 108 500-575 106 81 118 74 96 575-665 122 97 134 42 110 665-775 121 128 121 156 125 775-915 155 137 115 120 142
915-1120 113 136 81 192 123 1120-1500 81 147 38 155 105 1500-1925 48 66 15 41 50 1925-more 67 47 0 126 55 all classes 1000 1000 1000 1000 1000
average MPCE (Rs) 904.84 937.90 633.97 1143.51 898.59 estd. no. of persons 3018731 2613332 811210 384883 6841883 no. of sample hhs 774 766 213 126 1883
Rajasthan
0-300 14 4 62 20 16 300-350 54 14 101 8 41 350-425 79 61 119 77 76 425-500 136 71 246 87 120 500-575 139 126 126 68 129 575-665 164 83 194 169 135 665-775 109 109 55 100 103 775-915 100 153 67 151 120
915-1120 98 143 15 92 107 1120-1500 62 114 8 115 80 1500-1925 34 81 6 60 51 1925-more 12 41 0 51 24 all classes 1000 1000 1000 1000 1000
average MPCE (Rs) 721.04 937.66 526.95 890.14 795.70 estd. no. of persons 4460764 4124774 1123173 522172 10230883 no. of sample hhs 841 772 183 189 1985
(Contd.)

Appendix Tables
NSS Report No.472: Differences in Level of Consumption among Socio-Economic Groups, 1999-2000
A-28
Table 1U: Per 1000 distribution of persons by MPCE class and average MPCE separately for different household types in urban India, by State/UT
Urban
household type MPCE class
(Rs) self-employed regular
wage/salary earning
casual labour
others all
(1) (2) (3) (4) (5) (6)
Sikkim
0-300 0 22 197 0 26 300-350 3 12 235 0 23 350-425 48 13 232 0 38 425-500 50 62 0 182 59 500-575 86 79 106 0 79 575-665 142 82 164 22 103 665-775 185 130 19 203 143 775-915 198 125 23 0 139
915-1120 104 156 0 125 127 1120-1500 122 203 21 280 168 1500-1925 52 78 0 178 69 1925-mo re 9 39 4 11 26 all classes 1000 1000 1000 1000 1000
average MPCE (Rs) 843.85 980.47 444.38 1040.04 905.42 estd. no. of persons 13548 24116 2832 1992 42703 no. of sample hhs 73 177 17 19 288
Tamil Nadu
0-300 35 11 104 46 38 300-350 30 18 82 20 34 350-425 81 51 187 39 87 425-500 97 70 147 61 93 500-575 113 66 129 61 93 575-665 124 93 115 115 108 665-775 102 127 91 77 109 775-915 118 99 64 182 104
915-1120 117 144 48 97 114 1120-1500 96 154 18 113 107 1500-1925 40 103 11 74 63 1925-more 47 63 5 116 50 all classes 1000 1000 1000 1000 1000
average MPCE (Rs) 957.25 1020.91 837.06 1129.31 971.34 estd. no. of persons 6604347 8599699 3793930 1187719 20227575 no. of sample hhs 1374 1745 703 379 4212
(Contd.)

Appendix Tables
NSS Report No.472: Differences in Level of Consumption among Socio-Economic Groups, 1999-2000
A-29
Table 1U: Per 1000 distribution of persons by MPCE class and average MPCE separately for different household types in urban India, by State/UT
Urban
household type MPCE class
(Rs) self-employed regular
wage/salary earning
casual labour
others all
(1) (2) (3) (4) (5) (6)
Tripura
0-300 10 7 36 0 11 300-350 10 1 75 1 13 350-425 100 38 302 72 94 425-500 91 63 218 101 95 500-575 104 150 151 207 141 575-665 116 74 112 67 90 665-775 121 99 86 137 107 775-915 139 97 12 59 96
915-1120 147 142 2 169 128 1120-1500 79 120 1 133 94 1500-1925 73 103 5 43 76 1925-more 8 105 0 10 54 all classes 1000 1000 1000 1000 1000
average MPCE (Rs) 808.20 1034.05 487.77 821.98 876.30 estd. no. of persons 112317 182154 48604 36244 380395 no. of sample hhs 183 237 71 75 569
Uttar Pradesh
0-300 100 30 328 65 101 300-350 94 42 182 61 86 350-425 167 91 182 82 138 425-500 130 102 107 119 118 500-575 109 123 77 70 106 575-665 100 105 49 110 96 665-775 78 107 32 90 83 775-915 76 93 16 87 75
915-1120 55 124 8 77 73 1120-1500 53 88 16 108 65 1500-1925 18 49 0 82 30 1925-more 19 48 2 49 28 all classes 1000 1000 1000 1000 1000
average MPCE (Rs) 626.33 849.81 406.16 869.81 690.07 estd. no. of persons 16115994 10006571 3526664 2578592 32418322 no. of sample hhs 2263 1367 473 510 4638
(Contd.)

Appendix Tables
NSS Report No.472: Differences in Level of Consumption among Socio-Economic Groups, 1999-2000
A-30
Table 1U: Per 1000 distribution of persons by MPCE class and average MPCE separately for different household types in urban India, by State/UT
Urban
household type MPCE class
(Rs) self-employed regular
wage/salary earning
casual labour
others all
(1) (2) (3) (4) (5) (6)
West Bengal
0-300 40 13 100 6 33 300-350 39 17 135 4 39 350-425 145 32 192 38 97 425-500 167 70 208 51 124 500-575 108 109 153 93 113 575-665 98 101 82 101 98 665-775 100 111 46 82 97 775-915 72 130 40 135 96
915-1120 89 117 12 126 94 1120-1500 79 162 28 212 115 1500-1925 32 70 3 50 46 1925-more 32 67 0 99 47 all classes 1000 1000 1000 1000 1000
average MPCE (Rs) 808.19 982.26 490.89 1165.31 866.32 estd. no. of persons 6483538 6353192 1726536 990537 15607498 no. of sample hhs 1289 1428 366 336 3432
A. & N. Islands
0-300 0 0 0 0 0 300-350 0 0 0 0 0 350-425 0 8 0 0 5 425-500 0 0 167 0 21 500-575 75 55 0 0 50 575-665 204 46 168 49 90 665-775 110 142 189 50 139 775-915 123 154 281 266 168
915-1120 132 168 17 325 148 1120-1500 182 214 170 110 199 1500-1925 99 159 9 135 128 1925-more 74 53 0 65 50 all classes 1000 1000 1000 1000 1000
average MPCE (Rs) 1146.31 1161.85 816.25 1116.86 1114.04 estd. no. of persons 14383 51583 9865 2615 78445 no. of sample hhs 29 133 21 8 191
(Contd.)

Appendix Tables
NSS Report No.472: Differences in Level of Consumption among Socio-Economic Groups, 1999-2000
A-31
Table 1U: Per 1000 distribution of persons by MPCE class and average MPCE separately for different household types in urban India, by State/UT
Urban
household type MPCE class
(Rs) self-employed regular
wage/salary earning
casual labour
others all
(1) (2) (3) (4) (5) (6)
Chandigarh
0-300 12 13 52 0 13 300-350 15 3 270 0 14 350-425 36 5 73 0 17 425-500 36 17 231 0 28 500-575 61 36 72 0 43 575-665 70 74 28 0 68 665-775 144 45 93 50 78 775-915 86 85 25 106 84
915-1120 136 104 73 71 112 1120-1500 202 197 32 133 194 1500-1925 64 176 30 197 136 1925-more 139 244 20 444 212 all classes 1000 1000 1000 1000 1000
average MPCE (Rs) 1191.69 1558.49 592.56 2095.10 1435.19 estd . no. of persons 203245 385442 16805 24493 631845 no. of sample hhs 204 477 28 54 765
Dadra & Nagar Haveli
0-300 0 0 0 0 0 300-350 0 0 0 0 0 350-425 0 0 77 300 20 425-500 82 37 356 638 103 500-575 19 30 0 0 23 575-665 136 11 149 0 55 665-775 113 56 62 0 69 775-915 187 90 0 0 103
915-1120 248 67 113 0 115 1120-1500 87 318 0 0 217 1500-1925 7 314 243 62 218 1925-more 120 78 0 0 78 all classes 1000 1000 1000 1000 1000
average MPCE (Rs) 1099.34 1358.21 811.74 523.27 1207.24 estd. no. of persons 4037 9649 1384 693 15763 no. of sample hhs 21 61 9 5 96
(Contd.)

Appendix Tables
NSS Report No.472: Differences in Level of Consumption among Socio-Economic Groups, 1999-2000
A-32
Table 1U: Per 1000 distribution of persons by MPCE class and average MPCE separately for different household types in urban India, by State/UT
Urban
household type MPCE class
(Rs) self-employed regular
wage/salary earning
casual labour
others all
(1) (2) (3) (4) (5) (6)
Daman & Diu
0-300 0 0 134 0 7 300-350 0 0 0 0 0 350-425 40 0 38 55 24 425-500 46 33 161 0 42 500-575 30 62 276 103 64 575-665 109 74 110 81 91 665-775 165 198 195 46 170 775-915 230 188 85 205 202
915-1120 119 208 0 36 144 1120-1500 108 142 0 81 115 1500-1925 142 68 0 47 93 1925-more 11 28 0 347 49 all classes 1000 1000 1000 1000 1000
average MPCE (Rs) 980.57 961.59 553.70 1295.53 979.33 estd. no. of persons 18674 19788 2312 4148 44921 no. of sample hhs 65 98 11 18 192
Delhi
0-300 2 0 0 0 1 300-350 4 11 0 29 8 350-425 37 28 225 27 41 425-500 43 26 189 0 40 500-575 50 52 254 6 58 575-665 58 68 131 65 66 665-775 58 86 50 57 72 775-915 116 159 50 138 134
915-1120 105 142 36 76 117 1120-1500 160 139 66 268 152 1500-1925 128 121 0 130 119 1925-more 239 167 0 203 193 all classes 1000 1000 1000 1000 1000
average MPCE (Rs) 1535.90 1311.42 587.77 1399.70 1383.19 estd. no. of persons 4194613 4155823 416785 340585 9181794 no. of sample hhs 431 532 51 59 1081
(Contd.)

Appendix Tables
NSS Report No.472: Differences in Level of Consumption among Socio-Economic Groups, 1999-2000
A-33
Table 1U: Per 1000 distribution of persons by MPCE class and average MPCE separately for different household types in urban India, by State/UT
Urban
household type MPCE class
(Rs) self-employed regular
wage/salary earning
casual labour
others all
(1) (2) (3) (4) (5) (6)
Lakshadweep
0-300 0 0 0 0 0 300-350 0 0 9 0 1 350-425 0 26 0 0 10 425-500 49 0 75 0 27 500-575 49 33 14 0 34 575-665 180 95 333 0 143 665-775 166 80 142 250 137 775-915 105 279 124 259 193
915-1120 191 139 197 5 152 1120-1500 204 204 45 178 186 1500-1925 44 46 21 198 58 1925-more 12 97 41 110 59 all classes 1000 1000 1000 1000 1000
average MPCE (Rs) 924.26 1113.43 831.93 1181.29 1018.12 estd. no. of persons 10568 10872 2651 2752 26843 no. of sample hhs 74 82 21 15 192
Pondicherry
0-300 13 46 138 84 67 300-350 46 18 133 0 52 350-425 82 18 114 0 56 425-500 90 82 54 15 69 500-575 90 128 204 74 135 575-665 145 155 166 122 152 665-775 53 105 23 74 69 775-915 117 107 102 119 109
915-1120 158 170 32 152 129 1120-1500 96 109 20 167 88 1500-1925 70 39 6 88 42 1925-more 39 24 8 105 31 all classes 1000 1000 1000 1000 1000
average MPCE (Rs) 867.79 819.33 541.44 1091.12 784.16 estd. no. of persons 102781 199953 127137 49616 479487 no. of sample hhs 79 159 85 61 384
(Contd.)

Appendix Tables
NSS Report No.472: Differences in Level of Consumption among Socio-Economic Groups, 1999-2000
A-34
Table 1U: Per 1000 distribution of persons by MPCE class and average MPCE separately for different household types in urban India, by State/UT
Urban
household type MPCE class
(Rs) self-employed regular
wage/salary earning
casual labour
others all
(1) (2) (3) (4) (5) (6)
all-India 0-300 52 15 157 34 52
300-350 56 24 110 40 50 350-425 114 54 177 63 96 425-500 110 75 160 80 101 500-575 108 86 122 68 99 575-665 105 97 95 103 100 665-775 99 117 66 95 101 775-915 97 121 48 99 100
915-1120 87 132 35 124 100 1120-1500 85 141 21 125 101 1500-1925 40 71 6 79 50 1925-more 45 66 2 90 50 all classes 1000 1000 1000 1000 1000
average MPCE (Rs) 812.96 981.49 540.66 1030.82 854.70 estd. no. of persons 90834455 92631036 33174213 14910134 232393066 no. of sample hhs 17626 20359 6024 4750 48924

Appendix Tables
(Contd.) NSS Report No.472: Differences in Level of Consumption among Socio-Economic Groups, 1999-2000
A-35
Table 2R: Per 1000 distribution of persons by MPCE class and average MPCE separately for different social groups and by State/UT
Rural social group
MPCE class
(Rs) ST SC other
backward classes
others all
(1) (2) (3) (4) (5) (6) Andhra Prade sh
0-225 115 78 39 19 48 225-255 96 61 47 12 45 255-300 154 147 102 56 104 300-340 140 153 129 54 117 340-380 102 161 121 108 125 380-420 90 122 132 110 121 420-470 97 77 116 125 108 470-525 64 70 104 108 95 525-615 66 71 91 141 98 615-775 36 33 68 115 70 775-950 13 21 29 60 34
950-more 26 6 23 92 37 all classes 1000 1000 1000 1000 1000
average MPCE (Rs) 382.96 381.68 438.76 564.35 453.47 estd.no.of persons 3694601 11652155 23620350 13039962 52062761 no.of sample hhs 441 943 2301 1490 5181
Arunachal Pradesh
0-225 18 - - 22 19 225-255 18 - - 27 20 255-300 57 - - 30 50 300-340 86 - - 91 87 340-380 75 - - 64 72 380-420 66 - - 91 69 420-470 71 - - 141 86 470-525 81 - - 66 76 525-615 117 - - 166 129 615-775 139 - - 131 143 775-950 129 - - 96 119
950-more 144 - - 75 131 all classes 1000 - - 1000 1000
average MPCE (Rs) 658.62 - - 574.46 647.52 estd.no.of persons 584084 - - 166305 768630 no.of sample hhs 602 - - 201 827

Appendix Tables
(Contd.) NSS Report No.472: Differences in Level of Consumption among Socio-Economic Groups, 1999-2000
A-36
Table 2R: Per 1000 distribution of persons by MPCE class and average MPCE separately for different social groups and by State/UT
Rural social group
MPCE class
(Rs) ST SC other
backward classes
others all
(1) (2) (3) (4) (5) (6) Assam
0-225 21 35 61 72 58 225-255 51 66 61 48 53 255-300 111 85 100 95 97 300-340 135 151 79 108 112 340-380 109 162 147 121 129 380-420 101 135 104 126 119 420-470 141 91 118 128 124 470-525 107 94 84 98 96 525-615 111 75 111 108 106 615-775 84 68 88 63 72 775-950 21 36 31 21 24
950-more 8 2 15 12 11 all classes 1000 1000 1000 1000 1000
average MPCE (Rs) 437.39 414.19 435.57 421.58 425.90 estd.no.of persons 3198068 2248349 3776126 10982044 20234911 no.of sample hhs 604 332 691 1826 3462
Bihar
0-225 140 144 61 39 79 225-255 134 119 80 42 84 255-300 174 197 166 83 156 300-340 180 167 148 122 149 340-380 125 120 144 115 132 380-420 63 77 102 128 100 420-470 62 74 97 137 98 470-525 41 44 74 84 67 525-615 35 38 59 112 64 615-775 36 17 44 73 44 775-950 4 2 15 35 16
950-more 5 1 8 30 11 all classes 1000 1000 1000 1000 1000
average MPCE (Rs) 337.16 329.32 384.66 457.59 384.45 estd.no.of persons 5700661 16649164 40817909 15932455 79401995 no.of sample hhs 673 1486 3598 1526 7311

Appendix Tables
(Contd.) NSS Report No.472: Differences in Level of Consumption among Socio-Economic Groups, 1999-2000
A-37
Table 2R: Per 1000 distribution of persons by MPCE class and average MPCE separately for different social groups and by State/UT
Rural social group
MPCE class
(Rs) ST SC other
backward classes
others all
(1) (2) (3) (4) (5) (6) Goa
0-225 - - - 0 0 225-255 - - - 0 0 255-300 - - - 0 0 300-340 - - - 31 29 340-380 - - - 11 24 380-420 - - - 26 26 420-470 - - - 83 100 470-525 - - - 38 41 525-615 - - - 147 144 615-775 - - - 172 168 775-950 - - - 159 149
950-more - - - 332 319 all classes - - - 1000 1000
average MPCE (Rs) - - - 886.20 868.66 estd.no.of persons - - - 653051 698471 no.of sample hhs - - - 178 192
Gujarat
0-225 69 19 20 4 23 225-255 32 30 34 6 23 255-300 130 78 35 21 53 300-340 127 107 59 36 69 340-380 124 126 76 49 81 380-420 87 101 67 66 74 420-470 108 145 147 93 119 470-525 90 116 151 120 124 525-615 105 142 170 161 151 615-775 64 106 138 213 148 775-950 41 15 60 98 65
950-more 23 15 43 134 70 all classes 1000 1000 1000 1000 1000
average MPCE (Rs) 438.21 459.46 530.09 655.44 551.24 estd.no.of persons 5696347 3209464 9561554 10946016 29413381 no.of sample hhs 499 258 790 932 2479

Appendix Tables
(Contd.) NSS Report No.472: Differences in Level of Consumption among Socio-Economic Groups, 1999-2000
A-38
Table 2R: Per 1000 distribution of persons by MPCE class and average MPCE separately for different social groups and by State/UT
Rural social group
MPCE class
(Rs) ST SC other
backward classes
others all
(1) (2) (3) (4) (5) (6) Haryana
0-225 - 12 9 3 7 225-255 - 21 1 0 5 255-300 - 26 32 1 15 300-340 - 76 35 5 30 340-380 - 97 74 5 45 380-420 - 49 77 34 50 420-470 - 151 59 69 86 470-525 - 136 121 74 101 525-615 - 160 167 109 137 615-775 - 164 172 245 206 775-950 - 63 151 183 145
950-more - 45 103 272 174 all classes - 1000 1000 1000 1000
average MPCE (Rs) - 543.24 641.26 834.48 714.16 estd.no.of persons - 3326851 3484020 6915565 13797403 no.of sample hhs - 224 344 555 1132
Himachal Pradesh
0-225 0 0 0 3 2 225-255 5 10 0 1 3 255-300 13 43 13 13 20 300-340 18 25 13 16 18 340-380 31 78 64 43 53 380-420 48 87 44 68 70 420-470 12 139 86 75 89 470-525 128 142 105 105 114 525-615 290 161 130 155 159 615-775 236 172 264 229 219 775-950 69 60 171 112 105
950-more 148 83 110 180 148 all classes 1000 1000 1000 1000 1000
average MPCE (Rs) 659.11 588.82 683.26 722.94 684.29 estd.no.of persons 183250 1170494 537855 3055210 4950789 no.of sample hhs 95 360 178 1000 1634

Appendix Tables
(Contd.) NSS Report No.472: Differences in Level of Consumption among Socio-Economic Groups, 1999-2000
A-39
Table 2R: Per 1000 distribution of persons by MPCE class and average MPCE separately for different social groups and by State/UT
Rural social group
MPCE class
(Rs) ST SC other
backward classes
others all
(1) (2) (3) (4) (5) (6) Jammu & Kashmir
0-225 4 6 0 0 0 225-255 5 0 3 2 2 255-300 2 20 10 5 7 300-340 79 49 8 13 17 340-380 137 51 12 16 20 380-420 27 185 37 26 38 420-470 76 144 120 54 67 470-525 2 124 93 186 169 525-615 560 76 207 143 152 615-775 94 220 276 319 303 775-950 0 53 135 130 125
950-more 14 72 100 105 100 all classes 1000 1000 1000 1000 1000
average MPCE (Rs) 529.40 574.75 658.93 691.11 676.99 estd.no.of persons 126193 428630 543903 4891122 6006439 no.of sample hhs 20 153 183 1113 1472
Karnataka
0-225 21 55 25 14 27 225-255 66 49 45 20 39 255-300 142 127 73 64 86 300-340 108 130 75 82 90 340-380 163 143 90 104 111 380-420 166 115 86 95 101 420-470 85 118 131 108 117 470-525 77 66 116 110 101 525-615 111 95 134 134 125 615-775 45 59 121 106 98 775-950 13 17 64 73 54
950-more 6 26 39 90 51 all classes 1000 1000 1000 1000 1000
average MPCE (Rs) 404.28 419.39 507.45 560.08 499.60 estd.no.of persons 2702737 6780346 13508101 11491500 34502633 no.of sample hhs 194 480 1063 1024 2763

Appendix Tables
(Contd.) NSS Report No.472: Differences in Level of Consumption among Socio-Economic Groups, 1999-2000
A-40
Table 2R: Per 1000 distribution of persons by MPCE class and average MPCE separately for different social groups and by State/UT
Rural social group
MPCE class
(Rs) ST SC other
backward classes
others all
(1) (2) (3) (4) (5) (6) Kerala
0-225 18 17 6 2 6 225-255 0 8 8 4 6 255-300 58 18 16 10 15 300-340 106 33 40 18 32 340-380 69 81 44 23 40 380-420 35 101 52 44 53 420-470 49 103 94 68 85 470-525 60 94 115 89 103 525-615 81 137 140 99 123 615-775 205 264 174 205 195 775-950 126 54 138 160 138
950-more 193 92 173 278 204 all classes 1000 1000 1000 1000 1000
average MPCE (Rs) 674.11 597.03 724.28 870.77 765.57 estd.no.of persons 343405 1990902 10325264 7548992 20212310 no.of sample hhs 46 215 1326 1016 2604
Madhya Pradesh
0-225 179 115 81 19 103 225-255 130 102 83 28 90 255-300 215 163 128 53 145 300-340 136 116 117 78 116 340-380 106 147 117 116 118 380-420 69 86 114 73 91 420-470 51 69 88 193 91 470-525 37 69 83 122 75 525-615 39 68 68 128 69 615-775 26 36 65 97 55 775-950 7 16 30 46 24
950-more 5 13 26 47 22 all classes 1000 1000 1000 1000 1000
average MPCE (Rs) 325.38 374.74 417.54 516.20 401.33 estd.no.of persons 16714833 8657242 24792459 9557934 59735574 no.of sample hhs 1400 772 2134 836 5144

Appendix Tables
(Contd.) NSS Report No.472: Differences in Level of Consumption among Socio-Economic Groups, 1999-2000
A-41
Table 2R: Per 1000 distribution of persons by MPCE class and average MPCE separately for different social groups and by State/UT
Rural social group
MPCE class
(Rs) ST SC other
backward classes
others all
(1) (2) (3) (4) (5) (6) Maharashtra
0-225 131 55 38 16 47 225-255 90 83 40 26 49 255-300 161 130 94 62 97 300-340 115 139 107 69 97 340-380 96 117 96 66 87 380-420 93 72 104 90 92 420-470 103 91 103 118 107 470-525 73 91 102 117 102 525-615 41 94 121 120 104 615-775 44 68 95 152 106 775-950 41 38 58 79 61
950-more 12 21 41 85 51 all classes 1000 1000 1000 1000 1000
average MPCE (Rs) 384.33 429.45 489.74 569.99 496.62 estd.no.of persons 9147278 7156781 16651883 22003023 55015485 no.of sample hhs 676 497 1198 1747 4121
Manipur
0-225 16 0 0 0 7 225-255 3 0 0 0 2 255-300 71 0 0 8 35 300-340 49 0 7 53 40 340-380 110 114 23 141 104 380-420 178 150 62 132 141 420-470 120 41 152 145 129 470-525 61 0 155 165 108 525-615 121 392 190 184 167 615-775 158 239 259 122 171 775-950 48 40 90 37 51
950-more 64 25 62 13 46 all classes 1000 1000 1000 1000 1000
average MPCE (Rs) 522.87 560.15 625.44 502.99 537.46 estd.no.of persons 567866 63579 229564 396905 1260775 no.of sample hhs 352 36 132 215 738

Appendix Tables
(Contd.) NSS Report No.472: Differences in Level of Consumption among Socio-Economic Groups, 1999-2000
A-42
Table 2R: Per 1000 distribution of persons by MPCE class and average MPCE separately for different social groups and by State/UT
Rural social group
MPCE class
(Rs) ST SC other
backward classes
others all
(1) (2) (3) (4) (5) (6) Meghalaya
0-225 0 - - 3 0 225-255 0 - - 0 0 255-300 4 - - 41 6 300-340 22 - - 34 24 340-380 55 - - 0 51 380-420 77 - - 1 77 420-470 139 - - 151 141 470-525 170 - - 292 176 525-615 249 - - 195 244 615-775 199 - - 193 196 775-950 46 - - 27 45
950-more 39 - - 62 40 all classes 1000 - - 1000 1000
average MPCE (Rs) 563.36 - - 575.20 563.24 estd.no.of persons 1368749 - - 69024 1462901 no.of sample hhs 873 - - 44 933
Mizoram
0-225 0 - - - 0 225-255 0 - - - 0 255-300 5 - - - 4 300-340 6 - - - 6 340-380 21 - - - 20 380-420 49 - - - 49 420-470 41 - - - 43 470-525 116 - - - 122 525-615 149 - - - 153 615-775 254 - - - 257 775-950 208 - - - 200
950-more 151 - - - 145 all classes 1000 - - - 1000
average MPCE (Rs) 726.69 - - - 721.54 estd.no.of persons 320672 - - - 337888 no.of sample hhs 404 - - - 428

Appendix Tables
(Contd.) NSS Report No.472: Differences in Level of Consumption among Socio-Economic Groups, 1999-2000
A-43
Table 2R: Per 1000 distribution of persons by MPCE class and average MPCE separately for different social groups and by State/UT
Rural social group
MPCE class
(Rs) ST SC other
backward classes
others all
(1) (2) (3) (4) (5) (6) Nagaland
0-225 0 - - - 0 225-255 0 - - - 0 255-300 0 - - - 0 300-340 0 - - - 2 340-380 0 - - - 1 380-420 6 - - - 8 420-470 4 - - - 4 470-525 25 - - - 28 525-615 50 - - - 50 615-775 255 - - - 258 775-950 249 - - - 246
950-mo re 410 - - - 403 all classes 1000 - - - 1000
average MPCE (Rs) 943.01 - - - 941.03 estd.no.of persons 452469 - - - 479466 no.of sample hhs 445 - - - 480
Orissa
0-225 319 156 109 38 162 225-255 179 112 75 33 102 255-300 163 160 136 92 139 300-340 131 151 126 119 131 340-380 59 96 126 116 99 380-420 51 99 102 112 89 420-470 40 75 83 113 76 470-525 17 61 74 90 59 525-615 20 39 69 84 52 615-775 13 34 63 102 51 775-950 7 9 17 46 19
950-more 1 8 19 55 19 all classes 1000 1000 1000 1000 1000
average MPCE (Rs) 284.55 351.10 394.96 480.04 372.95 estd.no.of persons 7931162 6146702 9264782 5967913 29365462 no.of sample hhs 861 747 1069 795 3477

Appendix Tables
(Contd.) NSS Report No.472: Differences in Level of Consumption among Socio-Economic Groups, 1999-2000
A-44
Table 2R: Per 1000 distribution of persons by MPCE class and average MPCE separately for different social groups and by State/UT
Rural social group
MPCE class
(Rs) ST SC other
backward classes
others all
(1) (2) (3) (4) (5) (6) Punjab
0-225 0 2 1 0 1 225-255 0 13 0 0 5 255-300 84 18 19 2 12 300-340 42 41 27 3 22 340-380 95 88 47 4 43 380-420 176 71 63 13 44 420-470 80 103 126 36 75 470-525 174 146 105 66 104 525-615 91 201 122 112 147 615-775 137 177 227 240 213 775-950 40 68 153 202 142
950-more 81 71 108 323 192 all classes 1000 1000 1000 1000 1000
average MPCE (Rs) 548.08 581.66 652.45 909.19 742.29 estd.no.of persons 160016 5745679 2207887 6920491 15047420 no.of sample hhs 26 741 291 1092 2152
Rajasthan
0-225 24 25 2 2 10 225-255 36 14 5 4 12 255-300 112 55 31 17 47 300-340 71 93 56 36 60 340-380 96 91 83 37 74 380-420 118 112 92 81 97 420-470 129 167 124 103 127 470-525 123 117 140 134 131 525-615 127 132 162 182 156 615-775 111 117 189 222 171 775-950 39 37 65 89 62
950-more 14 41 52 93 54 all classes 1000 1000 1000 1000 1000
average MPCE (Rs) 465.89 501.41 560.04 621.50 548.77 estd.no.of persons 7203608 5947732 13210158 10035993 36397491 no.of sample hhs 585 514 1153 977 3229

Appendix Tables
(Contd.) NSS Report No.472: Differences in Level of Consumption among Socio-Economic Groups, 1999-2000
A-45
Table 2R: Per 1000 distribution of persons by MPCE class and average MPCE separately for different social groups and by State/UT
Rural social group
MPCE class
(Rs) ST SC other
backward classes
others all
(1) (2) (3) (4) (5) (6) Sikkim
0-225 7 51 13 4 11 225-255 13 0 8 11 10 255-300 62 52 47 34 47 300-340 31 167 135 70 92 340-380 83 111 97 62 84 380-420 123 121 119 208 146 420-470 123 107 134 153 135 470-525 82 70 109 97 96 525-615 167 86 138 104 133 615-775 186 192 100 125 134 775-950 46 19 65 42 51
950-more 77 25 35 89 60 all classes 1000 1000 1000 1000 1000
average MPCE (Rs) 570.59 482.73 504.96 545.01 531.45 estd.no.of persons 99335 23105 155507 105545 384147 no.of sample hhs 283 59 416 296 1056
Tamil Nadu
0-225 255 77 30 44 48 225-255 32 75 32 26 45 255-300 120 150 70 37 93 300-340 131 125 93 55 102 340-380 29 126 84 51 94 380-420 57 85 91 116 90 420-470 125 88 114 44 104 470-525 47 67 104 118 92 525-615 40 80 121 82 106 615-775 130 58 130 181 110 775-950 26 36 71 99 61
950-more 7 32 61 147 55 all classes 1000 1000 1000 1000 1000
average MPCE (Rs) 384.46 427.01 547.56 651.01 513.75 estd.no.of persons 449091 11564308 23840338 1818796 37785559 no.of sample hhs 53 1016 2887 209 4173

Appendix Tables
(Contd.) NSS Report No.472: Differences in Level of Consumption among Socio-Economic Groups, 1999-2000
A-46
Table 2R: Per 1000 distribution of persons by MPCE class and average MPCE separately for different social groups and by State/UT
Rural social group
MPCE class
(Rs) ST SC other
backward classes
others all
(1) (2) (3) (4) (5) (6) Tripura
0-225 60 0 9 9 11 225-255 43 2 0 2 5 255-300 72 36 36 36 40 300-340 88 67 37 87 69 340-380 127 73 79 69 77 380-420 94 71 154 106 107 420-470 135 189 123 128 146 470-525 133 117 148 140 135 525-615 100 245 178 141 175 615-775 73 111 161 162 139 775-950 59 75 46 81 68
950-more 16 14 29 41 28 all classes 1000 1000 1000 1000 1000
average MPCE (Rs) 457.43 531.66 529.53 541.96 528.09 estd.no.of persons 217983 644753 610539 941431 2426079 no.of sample hhs 112 265 236 414 1031
Uttar Pradesh
0-225 59 79 38 23 44 225-255 107 71 56 24 51 255-300 111 151 125 62 113 300-340 69 147 122 74 113 340-380 160 121 121 99 115 380-420 96 110 113 95 107 420-470 79 91 103 97 98 470-525 72 74 89 98 88 525-615 144 72 97 132 102 615-775 52 46 80 148 91 775-950 20 20 37 72 43
950-more 29 18 21 76 36 all classes 1000 1000 1000 1000 1000
average MPCE (Rs) 425.38 399.13 441.94 562.78 466.44 estd.no.of persons 1553258 31771226 57632425 37513124 128656471 no.of sample hhs 105 2249 4035 3031 9432

Appendix Tables
(Contd.) NSS Report No.472: Differences in Level of Consumption among Socio-Economic Groups, 1999-2000
A-47
Table 2R: Per 1000 distribution of persons by MPCE class and average MPCE separately for different social groups and by State/UT
Rural social group
MPCE class
(Rs) ST SC other
backward classes
others all
(1) (2) (3) (4) (5) (6) West Bengal
0-225 54 49 53 37 43 225-255 75 63 20 37 46 255-300 199 100 46 112 109 300-340 143 108 68 81 91 340-380 115 122 66 118 115 380-420 122 120 127 127 124 420-470 133 119 135 112 117 470-525 47 110 114 109 106 525-615 57 103 129 107 104 615-775 39 68 127 88 82 775-950 13 21 65 41 35
950-more 5 17 51 31 27 all classes 1000 1000 1000 1000 1000
average MPCE (Rs) 375.68 439.38 516.33 463.14 454.24 estd.no.of persons 3848365 15601405 3887921 33901929 57424711 no.of sample hhs 354 1236 346 2601 4550
A. & N. Islands
0-225 0 - - 0 0 225-255 0 - - 0 0 255-300 0 - - 0 0 300-340 62 - - 0 11 340-380 25 - - 0 5 380-420 55 - - 18 24 420-470 64 - - 71 67 470-525 49 - - 99 92 525-615 252 - - 151 170 615-775 204 - - 305 293 775-950 152 - - 171 161
950-more 137 - - 184 178 all classes 1000 - - 1000 1000
average MPCE (Rs) 686.55 - - 801.54 780.07 estd.no.of persons 36082 - - 153566 197924 no.of sample hhs 98 - - 166 273
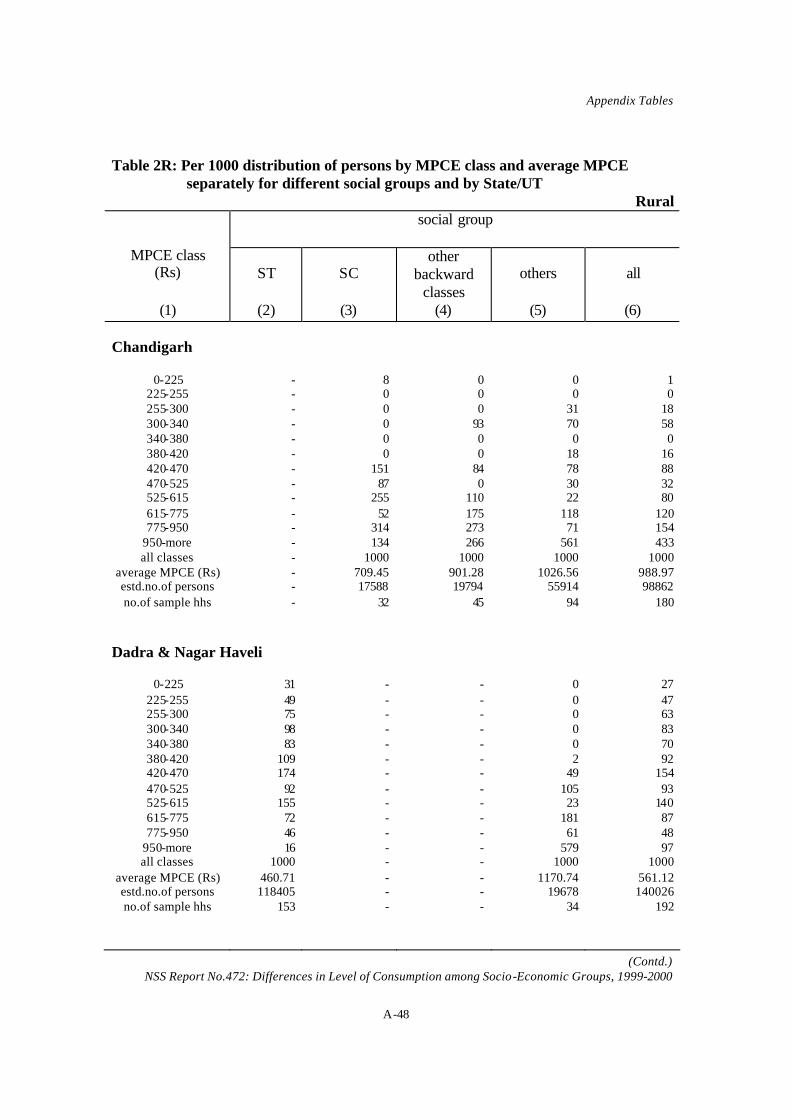
Appendix Tables
(Contd.) NSS Report No.472: Differences in Level of Consumption among Socio-Economic Groups, 1999-2000
A-48
Table 2R: Per 1000 distribution of persons by MPCE class and average MPCE separately for different social groups and by State/UT
Rural social group
MPCE class
(Rs) ST SC other
backward classes
others all
(1) (2) (3) (4) (5) (6) Chandigarh
0-225 - 8 0 0 1 225-255 - 0 0 0 0 255-300 - 0 0 31 18 300-340 - 0 93 70 58 340-380 - 0 0 0 0 380-420 - 0 0 18 16 420-470 - 151 84 78 88 470-525 - 87 0 30 32 525-615 - 255 110 22 80 615-775 - 52 175 118 120 775-950 - 314 273 71 154
950-more - 134 266 561 433 all classes - 1000 1000 1000 1000
average MPCE (Rs) - 709.45 901.28 1026.56 988.97 estd.no.of persons - 17588 19794 55914 98862 no.of sample hhs - 32 45 94 180
Dadra & Nagar Haveli
0-225 31 - - 0 27 225-255 49 - - 0 47 255-300 75 - - 0 63 300-340 98 - - 0 83 340-380 83 - - 0 70 380-420 109 - - 2 92 420-470 174 - - 49 154 470-525 92 - - 105 93 525-615 155 - - 23 140 615-775 72 - - 181 87 775-950 46 - - 61 48
950-more 16 - - 579 97 all classes 1000 - - 1000 1000
average MPCE (Rs) 460.71 - - 1170.74 561.12 estd.no.of persons 118405 - - 19678 140026 no.of sample hhs 153 - - 34 192

Appendix Tables
(Contd.) NSS Report No.472: Differences in Level of Consumption among Socio-Economic Groups, 1999-2000
A-49
Table 2R: Per 1000 distribution of persons by MPCE class and average MPCE separately for different social groups and by State/UT
Rural social group
MPCE class
(Rs) ST SC other
backward classes
others all
(1) (2) (3) (4) (5) (6) Daman & Diu
0-225 0 - - 0 0 225-255 0 - - 0 0 255-300 0 - - 0 0 300-340 54 - - 0 23 340-380 51 - - 0 22 380-420 0 - - 0 0 420-470 127 - - 19 62 470-525 73 - - 0 39 525-615 206 - - 26 98 615-775 282 - - 199 207 775-950 154 - - 191 173
950-more 54 - - 565 376 all classes 1000 - - 1000 1000
average MPCE (Rs) 650.65 - - 1093.83 901.38 estd.no.of persons 26307 - - 25256 61923 no.of sample hhs 70 - - 85 180
Delhi
0-225 - 0 0 0 0 225-255 - 0 0 0 0 255-300 - 0 0 0 0 300-340 - 0 0 0 0 340-380 - 60 0 0 7 380-420 - 42 0 2 6 420-470 - 46 0 0 6 470-525 - 62 51 35 41 525-615 - 297 85 54 93 615-775 - 177 93 241 208 775-950 - 66 163 273 225
950-more - 250 608 397 415 all classes - 1000 1000 1000 1000
average MPCE (Rs) - 731.05 989.84 932.83 916.85 estd.no.of persons - 373489 582147 2123500 3111293 no.of sample hhs - 34 25 123 187

Appendix Tables
(Contd.) NSS Report No.472: Differences in Level of Consumption among Socio-Economic Groups, 1999-2000
A-50
Table 2R: Per 1000 distribution of persons by MPCE class and average MPCE separately for different social groups and by State/UT
Rural social group
MPCE class
(Rs) ST SC other
backward classes
others all
(1) (2) (3) (4) (5) (6) Lakshadweep
0-225 0 - - - 0 225-255 0 - - - 0 255-300 0 - - - 0 300-340 0 - - - 0 340-380 0 - - - 0 380-420 0 - - - 0 420-470 39 - - - 39 470-525 97 - - - 95 525-615 154 - - - 151 615-775 157 - - - 154 775-950 248 - - - 243
950-more 305 - - - 319 all classes 1000 - - - 1000
average MPCE (Rs) 850.06 - - - 876.13 estd.no.of persons 32185 - - - 32880 no.of sample hhs 76 - - - 84
Pondicherry
0-225 - 55 13 - 25 225-255 - 75 14 - 32 255-300 - 48 55 - 51 300-340 - 91 31 - 49 340-380 - 135 81 - 95 380-420 - 77 49 - 61 420-470 - 164 80 - 103 470-525 - 91 102 - 96 525-615 - 131 129 - 126 615-775 - 73 141 - 117 775-950 - 30 134 - 104
950-more - 32 172 - 141 all classes - 1000 1000 - 1000
average MPCE (Rs) - 453.89 649.37 - 597.48 estd.no.of persons - 94262 209232 - 311565 no.of sample hhs - 81 196 - 288

Appendix Tables
NSS Report No.472: Differences in level of Consumption among Socio -Economic Groups
A-51
Table 2R: Per 1000 distribution of persons by MPCE class and average MPCE separately for different social groups and by State/UT
Rural social group
MPCE class (Rs) ST SC
other backward
clases others all
(1) (2) (3) (4) (5) (6) all-India
0-225 125 75 43 23 52 225-255 94 69 51 23 50 255-300 156 130 103 60 100 300-340 121 128 107 67 100 340-380 102 122 109 84 103 380-420 86 99 102 93 97 420-470 85 97 106 107 102 470-525 64 82 97 105 93 525-615 70 87 103 124 103 615-775 55 64 95 143 99 775-950 24 25 47 77 50
950-more 17 22 38 95 50 all classes 1000 1000 1000 1000 1000
average MPCE (Rs) 387.69 418.51 473.65 577.22 485.88 estd.no.of persons 72580081 141286506 259563575 217263270 691783624 no.of sample hhs 10124 12755 24721 23668 71385

Appendix tables
(Contd.) NSS Report No.472: Differences in Level of Consumption among Socio-Economic Groups, 1999-2000
A-52
Table 2U: Per 1000 distribution of persons by MPCE class and average MPCE separately for different social groups and by State/UT
Urban social group
MPCE class (Rs)
ST SC other
backward classes
others all
(1) (2) (3) (4) (5) (6) Andhra Pradesh
0-300 86 60 62 33 49 300-350 35 103 55 37 52 350-425 271 176 130 68 112 425-500 134 174 142 89 121 500-575 97 106 113 110 110 575-665 63 58 103 109 99 665-775 85 116 107 100 104 775-915 54 70 70 110 88 915-1120 83 48 84 114 93
1120-1500 54 37 71 137 96 1500-1925 23 48 34 46 41 1925-more 16 5 29 47 34 all classes 1000 1000 1000 1000 1000
average MPCE (Rs) 634.73 613.86 712.44 878.04 773.34 estd.no.of persons 638315 2741287 8037959 9795050 21241239 no.of sample hhs 121 426 1326 1928 3806
Arunachal Pradesh
0-300 28 - - 39 50 300-350 0 - - 0 0 350-425 112 - - 130 119 425-500 120 - - 118 115 500-575 45 - - 165 110 575-665 131 - - 96 102 665-775 95 - - 126 113 775-915 207 - - 134 163 915-1120 70 - - 73 70
1120-1500 95 - - 66 84 1500-1925 62 - - 25 45 1925-more 35 - - 27 28 all classes 1000 - - 1000 1000
average MPCE (Rs) 823.29 - - 723.41 762.20 estd.no.of persons 24772 - - 36502 66949 no.of sample hhs 82 - - 130 233

Appendix tables
(Contd.) NSS Report No.472: Differences in Level of Consumption among Socio-Economic Groups, 1999-2000
A-53
Table 2U: Per 1000 distribution of persons by MPCE class and average MPCE separately for different social groups and by State/UT
Urban social group
MPCE class (Rs)
ST SC other
backward classes
others all
(1) (2) (3) (4) (5) (6) Assam
0-300 12 119 147 15 43 300-350 17 92 30 30 36 350-425 98 151 88 76 87 425-500 160 151 102 180 165 500-575 122 94 98 60 72 575-665 167 156 92 98 107 665-775 94 81 89 91 89 775-915 74 70 58 106 94 915-1120 88 54 111 106 100
1120-1500 127 15 115 142 124 1500-1925 26 12 56 41 39 1925-more 15 6 14 57 43 all classes 1000 1000 1000 1000 1000
average MPCE (Rs) 749.73 557.30 737.07 872.29 813.82 estd.no.of persons 139016 234593 314479 1605921 2296657 no.of sample hhs 111 79 112 548 852
Bihar
0-300 251 258 140 55 132 300-350 104 165 181 60 132 350-425 100 242 183 124 165 425-500 176 81 125 108 117 500-575 89 55 111 80 92 575-665 105 79 86 85 86 665-775 51 35 61 112 75 775-915 26 37 38 98 58 915-1120 19 26 38 84 51
1120-1500 29 17 32 94 51 1500-1925 44 1 2 56 23 1925-more 5 3 3 43 17 all classes 1000 1000 1000 1000 1000
average MPCE (Rs) 524.74 440.88 499.52 808.03 601.58 estd.no.of persons 723743 1438092 5601571 4182020 11975995 no.of sample hhs 142 287 950 895 2279

Appendix tables
(Contd.) NSS Report No.472: Differences in Level of Consumption among Socio-Economic Groups, 1999-2000
A-54
Table 2U: Per 1000 distribution of persons by MPCE class and average MPCE separately for different social groups and by State/UT
Urban social group
MPCE class (Rs)
ST SC other
backward classes
others all
(1) (2) (3) (4) (5) (6) Goa
0-300 - - - 1 1 300-350 - - - 0 0 350-425 - - - 32 36 425-500 - - - 18 17 500-575 - - - 34 42 575-665 - - - 93 87 665-775 - - - 91 100 775-915 - - - 181 176 915-1120 - - - 188 179
1120-1500 - - - 165 163 1500-1925 - - - 116 114 1925-more - - - 81 84 all classes - - - 1000 1000
average MPCE (Rs) - - - 1161.57 1155.35 estd.no.of persons - - - 599679 638229 no.of sample hhs - - - 261 284
Gujarat
0-300 53 27 9 6 11 300-350 24 71 38 8 25 350-425 146 78 96 24 54 425-500 218 175 158 50 100 500-575 137 136 165 74 107 575-665 91 113 153 98 113 665-775 71 134 138 123 126 775-915 81 134 97 134 123 915-1120 49 60 69 154 116
1120-1500 93 60 56 174 127 1500-1925 16 9 10 84 53 1925-more 19 3 11 72 45 all classes 1000 1000 1000 1000 1000
average MPCE (Rs) 662.15 652.00 671.31 1056.78 891.59 estd.no.of persons 571794 1984178 3224434 7968583 13750406 no.of sample hhs 109 331 618 1705 2764

Appendix tables
(Contd.) NSS Report No.472: Differences in Level of Consumption among Socio-Economic Groups, 1999-2000
A-55
Table 2U: Per 1000 distribution of persons by MPCE class and average MPCE separately for different social groups and by State/UT
Urban social group
MPCE class (Rs)
ST SC other
backward classes
others all
(1) (2) (3) (4) (5) (6) Haryana
0-300 - 85 16 3 30 300-350 - 20 4 10 10 350-425 - 159 50 34 64 425-500 - 116 66 34 57 500-575 - 185 185 65 114 575-665 - 132 131 82 103 665-775 - 104 61 121 103 775-915 - 89 111 155 131 915-1120 - 76 175 160 145
1120-1500 - 18 169 176 142 1500-1925 - 9 18 75 48 1925-more - 7 13 85 52 all classes - 1000 1000 1000 1000
average MPCE (Rs) - 602.04 818.83 1069.97 911.82 estd.no.of persons - 1065767 1116350 2902072 5199597 no.of sample hhs - 112 149 487 758
Himachal Pradesh
0-300 - 0 0 0 0 300-350 - 0 219 9 22 350-425 - 72 77 10 26 425-500 - 74 129 3 25 500-575 - 128 37 18 40 575-665 - 140 96 45 68 665-775 - 177 113 57 82 775-915 - 126 113 133 130 915-1120 - 90 0 212 175
1120-1500 - 70 176 215 186 1500-1925 - 95 15 109 100 1925-more - 28 26 189 147 all classes - 1000 1000 1000 1000
average MPCE (Rs) - 850.93 752.74 1385.87 1242.71 estd.no.of persons - 87277 34171 354354 480554 no.of sample hhs - 150 50 737 947

Appendix tables
(Contd.) NSS Report No.472: Differences in Level of Consumption among Socio-Economic Groups, 1999-2000
A-56
Table 2U: Per 1000 distribution of persons by MPCE class and average MPCE separately for different social groups and by State/UT
Urban social group
MPCE class (Rs)
ST SC other
backward classes
others all
(1) (2) (3) (4) (5) (6) Jammu & Kashmir
0-300 - 0 0 0 0 300-350 - 0 0 3 3 350-425 - 104 38 8 18 425-500 - 122 100 37 45 500-575 - 80 82 64 65 575-665 - 185 201 96 106 665-775 - 122 112 154 149 775-915 - 123 123 212 202 915-1120 - 108 194 192 184
1120-1500 - 123 149 133 134 1500-1925 - 26 0 63 58 1925-more - 8 0 38 34 all classes - 1000 1000 1000 1000
average MPCE (Rs) - 772.65 786.82 973.85 952.55 estd.no.of persons - 124774 39735 1356267 1528457 no.of sample hhs - 113 45 841 1008
Karnataka
0-300 117 144 28 9 34 300-350 144 56 30 15 30 350-425 108 108 121 60 86 425-500 129 140 84 76 88 500-575 103 145 108 76 95 575-665 102 161 121 85 105 665-775 60 51 114 103 99 775-915 86 94 93 100 97 915-1120 80 15 104 148 117
1120-1500 29 70 118 169 136 1500-1925 31 10 37 80 57 1925-more 10 7 42 78 56 all classes 1000 1000 1000 1000 1000
average MPCE (Rs) 634.20 592.72 829.05 1044.02 910.78 estd.no.of persons 604705 1448260 4115221 7252973 13427101 no.of sample hhs 116 237 728 1387 2470

Appendix tables
(Contd.) NSS Report No.472: Differences in Level of Consumption among Socio-Economic Groups, 1999-2000
A-57
Table 2U: Per 1000 distribution of persons by MPCE class and average MPCE separately for different social groups and by State/UT
Urban social group
MPCE class (Rs)
ST SC other
backward classes
others all
(1) (2) (3) (4) (5) (6) Kerala
0-300 - 34 27 12 23 300-350 - 24 36 17 28 350-425 - 128 100 73 92 425-500 - 80 102 62 86 500-575 - 103 96 72 87 575-665 - 61 125 62 98 665-775 - 147 109 113 113 775-915 - 137 101 98 101 915-1120 - 128 111 124 116
1120-1500 - 94 103 166 126 1500-1925 - 24 53 75 59 1925-more - 40 37 126 71 all classes - 1000 1000 1000 1000
average MPCE (Rs) - 796.75 834.27 1100.20 932.48 estd.no.of persons - 458788 3978911 2696984 7192382 no.of sample hhs - 116 1076 811 2015
Madhya Pradesh
0-300 190 137 99 32 83 300-350 100 111 107 44 80 350-425 180 172 152 84 128 425-500 74 162 156 95 125 500-575 81 120 111 84 98 575-665 93 105 109 110 108 665-775 55 95 88 130 105 775-915 82 31 72 136 95 915-1120 78 28 49 93 67
1120-1500 53 21 31 105 63 1500-1925 8 12 16 47 28 1925-more 6 4 10 39 21 all classes 1000 1000 1000 1000 1000
average MPCE (Rs) 567.17 526.25 586.41 860.86 693.36 estd.no.of persons 1243799 2333231 6197882 7211763 16994867 no.of sample hhs 217 395 1025 1506 3145

Appendix tables
(Contd.) NSS Report No.472: Differences in Level of Consumption among Socio-Economic Groups, 1999-2000
A-58
Table 2U: Per 1000 distribution of persons by MPCE class and average MPCE separately for different social groups and by State/UT
Urban social group
MPCE class (Rs)
ST SC other
backward classes
others all
(1) (2) (3) (4) (5) (6) Maharashtra
0-300 122 73 47 28 41 300-350 33 48 37 31 35 350-425 83 97 98 58 72 425-500 124 121 87 61 75 500-575 128 113 114 73 87 575-665 132 108 110 84 93 665-775 91 151 129 100 112 775-915 105 102 111 106 106 915-1120 37 68 126 131 119
1120-1500 58 66 82 142 119 1500-1925 58 35 34 83 67 1925-more 29 16 23 102 74 all classes 1000 1000 1000 1000 1000
average MPCE (Rs) 723.77 704.58 779.72 1095.18 973.16 estd.no.of persons 1079493 4550335 6377228 22424787 34487488 no.of sample hhs 165 622 960 3478 5234
Manipur
0-300 0 - 0 0 0 300-350 0 - 11 0 5 350-425 67 - 13 116 68 425-500 173 - 118 191 157 500-575 307 - 149 161 162 575-665 138 - 174 181 178 665-775 117 - 269 157 205 775-915 110 - 114 81 97 915-1120 28 - 63 28 44
1120-1500 60 - 69 71 69 1500-1925 0 - 1 13 7 1925-more 1 - 18 0 8 all classes 1000 - 1000 1000 1000
average MPCE (Rs) 640.06 - 775.31 654.88 707.43 estd.no.of persons 19622 - 183194 209980 414351 no.of sample hhs 100 - 259 302 665

Appendix tables
(Contd.) NSS Report No.472: Differences in Level of Consumption among Socio-Economic Groups, 1999-2000
A-59
Table 2U: Per 1000 distribution of persons by MPCE class and average MPCE separately for different social groups and by State/UT
Urban social group
MPCE class (Rs)
ST SC other
backward classes
others all
(1) (2) (3) (4) (5) (6) Meghalaya
0-300 0 - - 0 0 300-350 0 - - 0 0 350-425 8 - - 0 6 425-500 11 - - 30 14 500-575 79 - - 36 73 575-665 99 - - 62 90 665-775 153 - - 226 165 775-915 271 - - 174 264 915-1120 120 - - 160 122
1120-1500 149 - - 213 159 1500-1925 93 - - 27 78 1925-more 16 - - 73 28 all classes 1000 - - 1000 1000
average MPCE (Rs) 960.05 - - 1036.66 971.64 estd.no.of persons 224209 - - 55739 295653 no.of sample hhs 255 - - 105 384
Mizoram
0-300 0 - - - 0 300-350 0 - - - 0 350-425 18 - - - 17 425-500 21 - - - 29 500-575 39 - - - 37 575-665 97 - - - 97 665-775 114 - - - 113 775-915 175 - - - 171 915-1120 203 - - - 204
1120-1500 204 - - - 204 1500-1925 59 - - - 59 1925-more 70 - - - 69 all classes 1000 - - - 1000
average MPCE (Rs) 1057.13 - - - 1056.27 estd.no.of persons 216361 - - - 226049 no.of sample hhs 812 - - - 858

Appendix tables
(Contd.) NSS Report No.472: Differences in Level of Consumption among Socio-Economic Groups, 1999-2000
A-60
Table 2U: Per 1000 distribution of persons by MPCE class and average MPCE separately for different social groups and by State/UT
Urban social group
MPCE class (Rs)
ST SC other
backward classes
others all
(1) (2) (3) (4) (5) (6) Nagaland
0-300 0 - - 0 0 300-350 0 - - 0 0 350-425 0 - - 39 4 425-500 0 - - 22 2 500-575 5 - - 0 4 575-665 78 - - 0 70 665-775 46 - - 133 66 775-915 145 - - 70 139 915-1120 201 - - 174 198
1120-1500 263 - - 429 271 1500-1925 160 - - 92 153 1925-mo re 103 - - 41 91 all classes 1000 - - 1000 1000
average MPCE (Rs) 1268.15 - - 1140.76 1242.11 estd.no.of persons 175598 - - 21130 211103 no.of sample hhs 205 - - 35 264
Orissa
0-300 195 210 131 59 117 300-350 125 168 70 72 94 350-425 129 215 115 113 133 425-500 229 176 148 96 136 500-575 44 68 151 137 118 575-665 139 67 104 77 88 665-775 37 46 86 137 98 775-915 55 17 83 92 73 915-1120 12 10 55 93 63
1120-1500 29 20 46 76 54 1500-1925 0 4 7 24 14 1925-more 6 1 3 25 13 all classes 1000 1000 1000 1000 1000
average MPCE (Rs) 489.74 440.67 579.80 727.94 618.22 estd.no.of persons 627371 1010067 1313045 2792324 5757632 no.of sample hhs 122 157 251 517 1050

Appendix tables
(Contd.) NSS Report No.472: Differences in Level of Consumption among Socio-Economic Groups, 1999-2000
A-61
Table 2U: Per 1000 distribution of persons by MPCE class and average MPCE separately for different social groups and by State/UT
Urban social group
MPCE class (Rs)
ST SC other
backward classes
others all
(1) (2) (3) (4) (5) (6) Punjab
0-300 0 20 27 0 9 300-350 41 32 47 7 20 350-425 174 120 40 28 57 425-500 102 165 114 80 108 500-575 0 127 139 73 96 575-665 339 139 103 92 110 665-775 97 136 123 121 125 775-915 192 117 152 151 142 915-1120 12 68 101 156 123
1120-1500 39 53 127 127 105 1500-1925 1 9 18 78 50 1925-more 3 14 8 87 55 all classes 1000 1000 1000 1000 1000
average MPCE (Rs) 654.39 666.78 762.80 1047.52 898.59 estd.no.of persons 92356 1899096 914900 3931487 6841883 no.of sample hhs 23 480 268 1110 1883
Rajasthan
0-300 50 32 7 12 16 300-350 6 123 38 15 41 350-425 54 147 74 53 76 425-500 178 213 167 57 120 500-575 195 120 176 102 129 575-665 160 88 174 129 135 665-775 80 75 102 115 103 775-915 127 108 91 140 120 915-1120 50 43 78 149 107
1120-1500 78 25 57 111 80 1500-1925 15 15 25 80 51 1925-more 7 9 12 37 24 all classes 1000 1000 1000 1000 1000
average MPCE (Rs) 679.26 587.75 720.21 918.45 795.70 estd.no.of persons 384941 1883911 2727814 5234217 10230883 no.of sample hhs 81 277 470 1157 1985

Appendix tables
(Contd.) NSS Report No.472: Differences in Level of Consumption among Socio-Economic Groups, 1999-2000
A-62
Table 2U: Per 1000 distribution of persons by MPCE class and average MPCE separately for different social groups and by State/UT
Urban social group
MPCE class (Rs)
ST SC other
backward classes
others all
(1) (2) (3) (4) (5) (6) Sikkim
0-300 64 74 0 10 26 300-350 0 35 60 12 23 350-425 0 142 65 14 38 425-500 27 166 72 40 59 500-575 39 101 144 58 79 575-665 66 4 129 132 103 665-775 165 65 145 153 143 775-915 111 177 103 153 139 915-1120 157 92 128 124 127
1120-1500 227 131 81 198 168 1500-1925 115 11 69 64 69 1925-more 29 2 5 42 26 all classes 1000 1000 1000 1000 1000
average MPCE (Rs) 1021.25 690.27 768.39 979.39 905.42 estd.no.of persons 8378 4867 9991 19271 42703 no.of sample hhs 63 33 50 140 288
Tamil Nadu
0-300 9 112 31 15 38 300-350 0 93 28 18 34 350-425 0 156 93 18 87 425-500 64 131 99 43 93 500-575 104 100 96 76 93 575-665 140 89 126 53 108 665-775 109 113 118 73 109 775-915 73 82 107 108 104 915-1120 116 56 123 119 114
1120-1500 100 42 96 196 107 1500-1925 261 21 48 141 63 1925-more 23 5 35 139 50 all classes 1000 1000 1000 1000 1000
average MPCE (Rs) 1075.91 591.69 958.95 1276.84 971.34 estd.no.of persons 172500 2561440 13781694 3676316 20227575 no.of sample hhs 33 458 2933 779 4212

Appendix tables
(Contd.) NSS Report No.472: Differences in Level of Consumption among Socio-Economic Groups, 1999-2000
A-63
Table 2U: Per 1000 distribution of persons by MPCE class and average MPCE separately for different social groups and by State/UT
Urban social group
MPCE class (Rs)
ST SC other
backward classes
others all
(1) (2) (3) (4) (5) (6) Tripura
0-300 0 44 0 3 11 300-350 0 56 8 1 13 350-425 0 224 60 67 94 425-500 0 77 43 121 95 500-575 277 155 70 131 141 575-665 7 73 145 94 90 665-775 70 53 208 115 107 775-915 130 83 90 99 96 915-1120 156 136 196 112 128
1120-1500 74 47 120 108 94 1500-1925 163 43 34 84 76 1925-more 124 9 25 66 54 all classes 1000 1000 1000 1000 1000
average MPCE (Rs) 1072.69 682.95 853.20 925.06 876.30 estd.no.of persons 27396 80357 37093 234026 380395 no.of sample hhs 26 115 76 350 569
Uttar Pradesh
0-300 9 144 98 92 101 300-350 0 117 123 56 86 350-425 140 197 169 101 138 425-500 278 131 146 93 118 500-575 11 96 108 111 106 575-665 91 83 111 91 96 665-775 81 66 72 94 83 775-915 53 57 58 92 75 915-1120 176 67 49 87 73
1120-1500 83 26 42 90 65 1500-1925 29 6 16 47 30 1925-more 49 10 8 46 28 all classes 1000 1000 1000 1000 1000
average MPCE (Rs) 898.80 553.05 575.67 796.91 690.07 estd.no.of persons 305203 5063551 10132947 16827958 32418322 no.of sample hhs 49 703 1453 2419 4638

Appendix tables
(Contd.) NSS Report No.472: Differences in Level of Consumption among Socio-Economic Groups, 1999-2000
A-64
Table 2U: Per 1000 distribution of persons by MPCE class and average MPCE separately for different social groups and by State/UT
Urban social group
MPCE class (Rs)
ST SC other
backward classes
others all
(1) (2) (3) (4) (5) (6) West Bengal
0-300 127 53 38 26 33 300-350 116 99 79 19 39 350-425 96 164 115 79 97 425-500 186 190 83 111 124 500-575 113 141 173 102 113 575-665 87 89 98 101 98 665-775 41 95 160 93 97 775-915 114 65 76 106 96 915-1120 78 29 65 112 94
1120-1500 33 44 62 139 115 1500-1925 2 20 23 55 46 1925-more 8 11 27 59 47 all classes 1000 1000 1000 1000 1000
average MPCE (Rs) 573.87 591.40 684.41 955.50 866.32 estd.no.of persons 299131 2785917 958118 11527653 15607498 no.of sample hhs 76 556 216 2568 3432
A. & N. Islands
0-300 - - - 0 0 300-350 - - - 0 0 350-425 - - - 6 5 425-500 - - - 24 21 500-575 - - - 57 50 575-665 - - - 75 90 665-775 - - - 137 139 775-915 - - - 155 168 915-1120 - - - 167 148
1120-1500 - - - 219 199 1500-1925 - - - 108 128 1925-more - - - 52 50 all classes - - - 1000 1000
average MPCE (Rs) - - - 1112.28 1114.04 estd.no.of persons - - - 69391 78445 no.of sample hhs - - - 174 191

Appendix tables
(Contd.) NSS Report No.472: Differences in Level of Consumption among Socio-Economic Groups, 1999-2000
A-65
Table 2U: Per 1000 distribution of persons by MPCE class and average MPCE separately for different social groups and by State/UT
Urban social group
MPCE class (Rs)
ST SC other
backward classes
others all
(1) (2) (3) (4) (5) (6) Chandigarh
0-300 - 70 1 4 13 300-350 - 74 0 5 14 350-425 - 43 49 7 17 425-500 - 69 20 22 28 500-575 - 71 80 31 43 575-665 - 105 51 61 68 665-775 - 122 64 73 78 775-915 - 92 102 79 84 915-1120 - 118 235 93 112
1120-1500 - 166 188 201 194 1500-1925 - 32 144 155 136 1925-more - 38 67 266 212 all classes - 1000 1000 1000 1000
average MPCE (Rs) - 881.55 1156.76 1571.41 1435.19 estd.no.of persons - 89020 65214 465319 631845 no.of sample hhs - 94 68 583 765
Dadra & Nagar Haveli
0-300 0 - - 0 0 300-350 0 - - 0 0 350-425 71 - - 0 20 425-500 340 - - 0 103 500-575 45 - - 0 23 575-665 70 - - 41 55 665-775 55 - - 41 69 775-915 160 - - 78 103 915-1120 183 - - 117 115
1120-1500 74 - - 302 217 1500-1925 0 - - 305 218 1925-more 2 - - 117 78 all classes 1000 - - 1000 1000
average MPCE (Rs) 722.17 - - 1439.84 1207.24 estd.no.of persons 4403 - - 8588 15763 no.of sample hhs 28 - - 50 96

Appendix tables
(Contd.) NSS Report No.472: Differences in Level of Consumption among Socio-Economic Groups, 1999-2000
A-66
Table 2U: Per 1000 distribution of persons by MPCE class and average MPCE separately for different social groups and by State/UT
Urban social group
MPCE class (Rs)
ST SC other
backward classes
others all
(1) (2) (3) (4) (5) (6) Daman & Diu
0-300 - - 0 0 7 300-350 - - 0 0 0 350-425 - - 16 32 24 425-500 - - 40 0 42 500-575 - - 105 28 64 575-665 - - 152 61 91 665-775 - - 254 152 170 775-915 - - 190 204 202 915-1120 - - 129 158 144
1120-1500 - - 52 158 115 1500-1925 - - 31 145 93 1925-more - - 31 62 49 all classes - - 1000 1000 1000
average MPCE (Rs) - - 823.28 1109.09 979.33 estd.no.of persons - - 13922 26047 44921 no.of sample hhs - - 65 104 192
Delhi
0-300 - 5 0 0 1 300-350 - 31 8 3 8 350-425 - 100 67 23 41 425-500 - 89 88 23 40 500-575 - 88 108 40 58 575-665 - 115 167 41 66 665-775 - 146 37 63 72 775-915 - 178 172 120 134 915-1120 - 85 130 122 117
1120-1500 - 129 117 157 152 1500-1925 - 14 73 150 119 1925-more - 19 32 258 193 all classes - 1000 1000 1000 1000
average MPCE (Rs) - 778.03 907.06 1595.03 1383.19 estd.no.of persons - 1447752 978949 6602927 9181794 no.of sample hhs - 143 144 771 1081

Appendix tables
(Contd.) NSS Report No.472: Differences in Level of Consumption among Socio-Economic Groups, 1999-2000
A-67
Table 2U: Per 1000 distribution of persons by MPCE class and average MPCE separately for different social groups and by State/UT
Urban social group
MPCE class (Rs)
ST SC other
backward classes
others all
(1) (2) (3) (4) (5) (6) Lakshadweep
0-300 0 - - - 0 300-350 0 - - - 1 350-425 11 - - - 10 425-500 28 - - - 27 500-575 34 - - - 34 575-665 148 - - - 143 665-775 143 - - - 137 775-915 201 - - - 193 915-1120 153 - - - 152
1120-1500 180 - - - 186 1500-1925 53 - - - 58 1925-more 49 - - - 59 all classes 1000 - - - 1000
average MPCE (Rs) 988.18 - - - 1018.12 estd.no.of persons 25760 - - - 26843 no.of sample hhs 170 - - - 192
Pondicherry
0-300 - 28 59 170 67 300-350 - 92 53 18 52 350-425 - 136 52 24 56 425-500 - 135 68 34 69 500-575 - 87 142 118 135 575-665 - 95 166 97 152 665-775 - 50 68 100 69 775-915 - 196 109 18 109 915-1120 - 68 139 61 129
1120-1500 - 89 78 180 88 1500-1925 - 23 36 106 42 1925-more - 0 29 75 31 all classes - 1000 1000 1000 1000
average MPCE (Rs) - 684.61 774.53 927.97 784.16 estd.no.of persons - 36804 391905 47486 479487 no.of sample hhs - 32 292 57 384

Appendix tables
NSS Report No.472: Differences in Level of Consumption among Socio-Economic Groups, 1999-2000
A-68
Table 2U: Per 1000 distribution of persons by MPCE class and average MPCE separately for different social groups and by State/UT
Urban social group
MPCE class (Rs)
ST SC
other backward
classes others all social
groups
(1) (2) (3) (4) (5) (6) all-India
0-300 114 92 60 31 52 300-350 61 87 67 29 50 350-425 121 150 121 65 96 425-500 135 146 121 75 101 500-575 96 112 115 85 99 575-665 110 99 118 90 100 665-775 70 102 102 103 101 775-915 90 84 86 113 100 915-1120 73 54 87 121 100
1120-1500 75 46 72 135 101 1500-1925 36 18 30 72 50 1925-more 20 10 22 80 50 all classes 1000 1000 1000 1000 1000
average MPCE (Rs) 690.52 608.79 734.82 1004.75 854.70 estd.no.of persons 7900028 33355300 70601922 120141185 232393066 no.of sample hhs 3202 5985 13668 25966 48924

Appendix Tables
NSS Report No.472: Differences in Level of Consumption among Socio-Economic Groups, 1999-2000
A-69
Table 3R: Per 1000 distribution of persons by MPCE class and average MPCE of rural households in different size classes of land possessed and by State/UT
Rural size of land possessed (hectares)
MPCE class (Rs) <0.01 0.01- 0.40 0.41-1.00 1.01-
2.00 2.01-4.00
4.01 & above
all size classes
(1) (2) (3) (4) (5) (6) (7) (8) Andhra Pradesh 0-225 54 58 44 32 35 12 48 225-255 27 46 55 35 38 41 45 255-300 83 114 111 87 96 43 104 300-340 81 116 133 139 101 54 117 340-380 150 132 124 108 130 56 125 380-420 142 121 122 135 108 86 121 420-470 118 105 119 116 97 81 108 470-525 136 97 80 105 73 109 95 525-615 100 90 114 99 89 119 98 615-775 75 61 56 74 101 158 70 775-950 8 29 21 46 64 75 34 950-more 26 31 22 23 67 166 37 all classes 1000 1000 1000 1000 1000 1000 1000 average MPCE (Rs) 441.00 439.02 429.59 458.81 505.03 637.51 453.47 estd. no. of persons 2061038 26781976 10328027 6335342 4389123 2167256 52062761 no. of sample hhs 235 2656 914 581 433 362 5181 Arunachal Pradesh 0-225 0 0 21 16 9 74 19 225-255 0 47 7 17 16 35 20 255-300 0 7 65 47 53 118 50 300-340 67 24 40 85 146 182 87 340-380 15 38 84 53 95 138 72 380-420 45 114 35 50 119 48 69 420-470 223 46 48 78 75 117 86 470-525 22 51 72 131 98 45 76 525-615 178 116 155 174 99 37 129 615-775 187 157 185 163 58 114 143 775-950 90 163 131 144 103 49 119 950-more 175 237 158 41 129 44 131 all classes 1000 1000 1000 1000 1000 1000 1000 average MPCE (Rs) 735.47 810.74 713.22 571.93 577.87 458.60 647.52 estd. no. of persons 82820 125541 174113 143253 146729 96173 768630 no. of sample hhs 110 138 151 157 146 125 827 (Contd.)

Appendix Tables
NSS Report No.472: Differences in Level of Consumption among Socio-Economic Groups, 1999-2000
A-70
Table 3R: Per 1000 distribution of persons by MPCE class and average MPCE of rural households in different size classes of land possessed and by State/UT
Rural size of land possessed (hectares)
MPCE class (Rs) <0.01 0.01- 0.40 0.41-1.00 1.01-
2.00 2.01-4.00
4.01 & above
all size classes
(1) (2) (3) (4) (5) (6) (7) (8) Assam 0-225 260 82 29 26 7 0 58 225-255 156 70 50 14 0 128 53 255-300 145 126 78 70 32 68 97 300-340 111 139 95 85 64 89 112 340-380 104 137 121 137 96 52 129 380-420 50 112 139 127 113 66 119 420-470 22 98 146 154 185 104 124 470-525 54 74 115 122 130 95 96 525-615 46 84 108 137 183 72 106 615-775 15 51 86 86 129 161 72 775-950 23 18 29 25 32 127 24 950-more 15 9 4 16 27 39 11 all classes 1000 1000 1000 1000 1000 1000 1000 average MPCE (Rs) 324.69 393.72 439.32 466.27 507.43 521.01 425.90 estd. no. of persons 556118 9488438 4494552 4040518 1413188 242096 20234911 no. of sample hhs 119 1630 765 643 225 80 3462 Bihar 0-225 142 95 38 57 12 33 79 225-255 136 97 52 69 29 31 84 255-300 177 177 143 111 65 92 156 300-340 173 157 160 109 114 27 149 340-380 126 139 121 135 122 90 132 380-420 72 94 110 127 123 80 100 420-470 66 81 140 116 162 68 98 470-525 46 63 81 72 72 115 67 525-615 38 46 86 98 122 129 64 615-775 12 36 46 59 86 180 44 775-950 6 6 14 39 61 88 16 950-more 6 9 9 8 30 66 11 all classes 1000 1000 1000 1000 1000 1000 1000 average MPCE (Rs) 332.29 364.71 404.29 418.70 481.67 557.85 384.45 estd. no. of persons 7570674 42557823 14995182 8979881 3793896 1504540 79401995 no. of sample hhs 767 3901 1265 740 331 307 7311 (Contd.)

Appendix Tables
NSS Report No.472: Differences in Level of Consumption among Socio-Economic Groups, 1999-2000
A-71
Table 3R: Per 1000 distribution of persons by MPCE class and average MPCE of rural households in different size classes of land possessed and by State/UT
Rural size of land possessed (hectares)
MPCE class (Rs) <0.01 0.01- 0.40 0.41-1.00 1.01-
2.00 2.01-4.00
4.01 & above
all size classes
(1) (2) (3) (4) (5) (6) (7) (8) Goa 0-225 - 0 - - - - 0 225-255 - 0 - - - - 0 255-300 - 0 - - - - 0 300-340 - 35 - - - - 29 340-380 - 28 - - - - 24 380-420 - 7 - - - - 26 420-470 - 86 - - - - 100 470-525 - 49 - - - - 41 525-615 - 147 - - - - 144 615-775 - 181 - - - - 168 775-950 - 158 - - - - 149 950-more - 307 - - - - 319 all classes - 1000 - - - - 1000 Average MPCE (Rs 0.00) - 868.64 - - - - 868.66 estd. No. of persons - 582183 - - - - 698471 no. of sample hhs - 152 - - - - 192 Gujarat 0-225 32 31 40 8 0 0 23 225-255 22 33 26 17 5 0 23 255-300 42 85 46 29 15 13 53 300-340 84 75 110 66 25 7 69 340-380 103 90 107 75 54 6 81 380-420 87 89 45 95 59 26 74 420-470 167 120 144 118 62 79 119 470-525 136 136 79 126 140 105 124 525-615 145 133 136 162 213 175 151 615-775 81 125 127 177 195 273 148 775-950 51 47 78 56 97 127 65 950-more 51 36 62 71 133 189 70 all classes 1000 1000 1000 1000 1000 1000 1000 average MPCE (Rs) 505.38 499.47 530.92 569.42 648.87 739.67 551.24 estd. no. of persons 3332936 12072031 4367452 4029746 2908583 2702632 29413381 no. of sample hhs 301 980 343 316 264 275 2479 (Contd.)

Appendix Tables
NSS Report No.472: Differences in Level of Consumption among Socio-Economic Groups, 1999-2000
A-72
Table 3R: Per 1000 distribution of persons by MPCE class and average MPCE of rural households in different size classes of land possessed and by State/UT
Rural size of land possessed (hectares)
MPCE class (Rs) <0.01 0.01- 0.40 0.41-1.00 1.01-
2.00 2.01-4.00
4.01 & above
all size classes
(1) (2) (3) (4) (5) (6) (7) (8) Haryana 0-225 0 14 0 0 0 0 7 225-255 0 11 0 0 0 0 5 255-300 0 30 0 0 0 0 15 300-340 0 53 13 18 0 0 30 340-380 85 73 32 13 0 0 45 380-420 118 51 26 65 44 38 50 420-470 57 113 77 32 76 51 86 470-525 86 124 86 93 70 59 101 525-615 190 139 119 151 127 123 137 615-775 245 173 228 270 244 203 206 775-950 202 98 198 187 167 215 145 950-more 17 122 221 171 272 312 174 all classes 1000 1000 1000 1000 1000 1000 1000 average MPCE (Rs) 621.27 631.67 806.95 739.76 809.08 895.98 714.16 estd. no. of persons 579403 6782368 1571755 1639237 1851568 1373072 13797403 no. of sample hhs 55 505 141 139 157 135 1132 Himachal Pradesh 0-225 0 3 3 0 0 0 2 225-255 0 5 2 0 0 0 3 255-300 0 33 10 2 22 0 20 300-340 29 14 15 22 64 0 18 340-380 40 68 38 17 50 167 53 380-420 35 79 86 28 48 16 70 420-470 15 78 127 86 55 58 89 470-525 128 102 133 119 117 111 114 525-615 92 160 139 211 157 133 159 615-775 154 208 219 281 234 105 219 775-950 136 116 78 95 69 295 105 950-more 372 136 151 139 182 115 148 all classes 1000 1000 1000 1000 1000 1000 1000 average MPCE (Rs) 933.96 670.80 666.51 701.44 728.77 723.91 684.29 estd. no. of persons 114600 2432018 1340114 687556 270970 105530 4950789 no. of sample hhs 61 830 429 200 88 26 1634 (Contd.)

Appendix Tables
NSS Report No.472: Differences in Level of Consumption among Socio-Economic Groups, 1999-2000
A-73
Table 3R: Per 1000 distribution of persons by MPCE class and average MPCE of rural households in different size classes of land possessed and by State/UT
Rural size of land possessed (hectares)
MPCE class (Rs) <0.01 0.01- 0.40 0.41-1.00 1.01-
2.00 2.01-4.00
4.01 & above
all size classes
(1) (2) (3) (4) (5) (6) (7) (8) Jammu & Kashmir 0-225 - 1 0 0 0 - 0 225-255 - 1 2 6 0 - 2 255-300 - 10 8 0 10 - 7 300-340 - 22 6 18 63 - 17 340-380 - 31 22 2 19 - 20 380-420 - 54 30 54 5 - 38 420-470 - 63 62 79 142 - 67 470-525 - 101 69 238 101 - 169 525-615 - 150 190 151 119 - 152 615-775 - 350 329 230 384 - 303 775-950 - 141 172 80 19 - 125 950-more - 76 110 142 138 - 100 all classes - 1000 1000 1000 1000 - 1000 average MPCE (Rs) - 681.38 702.09 671.04 684.22 - 676.99 estd. no. of persons - 2029626 2195467 947944 419466 - 6006439 no. of sample hhs - 597 573 194 74 - 1472 Karnataka 0-225 20 28 39 38 11 7 27 225-255 5 57 36 35 33 13 39 255-300 48 93 106 64 86 70 86 300-340 100 85 97 102 94 72 90 340-380 131 104 122 81 104 163 111 380-420 119 99 99 115 85 97 101 420-470 118 127 138 109 115 62 117 470-525 59 97 75 122 150 85 101 525-615 214 115 124 140 94 146 125 615-775 74 88 104 95 88 144 98 775-950 26 59 40 62 57 58 54 950-more 85 49 22 38 84 82 51 all classes 1000 1000 1000 1000 1000 1000 1000 average MPCE (Rs) 517.98 496.25 462.05 491.96 530.85 550.04 499.60 estd. no. of persons 1126678 12313411 6975594 5882194 4498091 3706666 34502633 no. of sample hhs 102 1081 502 419 321 338 2763 (Contd.)

Appendix Tables
NSS Report No.472: Differences in Level of Consumption among Socio-Economic Groups, 1999-2000
A-74
Table 3R: Per 1000 distribution of persons by MPCE class and average MPCE of rural households in different size classes of land possessed and by State/UT
Rural size of land possessed (hectares)
MPCE class (Rs) <0.01 0.01- 0.40 0.41-1.00 1.01-
2.00 2.01-4.00
4.01 & above
all size classes
(1) (2) (3) (4) (5) (6) (7) (8) Kerala 0-225 0 7 0 0 0 - 6 225-255 12 6 10 0 0 - 6 255-300 0 17 4 10 0 - 15 300-340 0 38 13 0 0 - 32 340-380 27 48 5 0 0 - 40 380-420 0 58 30 62 0 - 53 420-470 0 90 63 69 64 - 85 470-525 92 111 66 44 114 - 103 525-615 123 127 111 134 39 - 123 615-775 246 190 237 180 203 - 195 775-950 100 135 151 154 175 - 138 950-more 401 173 310 347 403 - 204 all classes 1000 1000 1000 1000 1000 - 1000 average MPCE (Rs) 1100.90 720.14 928.22 927.45 1057.75 - 765.57 estd. no. of persons 195707 16428085 2187501 1000414 350332 - 20212310 no. of sample hhs 46 1996 318 164 62 - 2604 Madhya Pradesh 0-225 100 148 135 88 70 38 103 225-255 105 112 103 93 68 47 90 255-300 179 164 169 140 131 83 145 300-340 96 116 121 139 130 57 116 340-380 81 105 117 145 144 77 118 380-420 73 70 106 100 105 85 91 420-470 84 110 77 81 81 112 91 470-525 79 59 54 85 76 117 75 525-615 78 45 52 51 94 137 69 615-775 82 32 40 42 63 122 55 775-950 24 17 16 22 23 57 24 950-more 19 20 10 14 16 68 22 all classes 1000 1000 1000 1000 1000 1000 1000 average MPCE (Rs) 402.42 371.37 363.11 387.05 412.67 531.21 401.33 estd. no. of persons 3360898 14970311 11150633 12035719 11164952 7053060 59735574 no. of sample hhs 349 1307 952 914 835 787 5144 (Contd.)

Appendix Tables
NSS Report No.472: Differences in Level of Consumption among Socio-Economic Groups, 1999-2000
A-75
Table 3R: Per 1000 distribution of persons by MPCE class and average MPCE of rural households in different size classes of land possessed and by State/UT
Rural size of land possessed (hectares)
MPCE class (Rs) <0.01 0.01- 0.40 0.41-1.00 1.01-
2.00 2.01-4.00
4.01 & above
all size classes
(1) (2) (3) (4) (5) (6) (7) (8) Maharashtra 0-225 56 52 61 48 26 9 47 225-255 27 57 50 43 49 44 49 255-300 107 123 77 85 95 36 97 300-340 71 102 104 104 106 71 97 340-380 60 92 92 83 91 86 87 380-420 79 90 125 99 72 71 92 420-470 92 98 99 106 148 126 107 470-525 72 94 99 111 122 137 102 525-615 120 85 100 139 84 137 104 615-775 121 97 120 108 93 112 106 775-950 105 63 49 33 58 80 61 950-more 90 47 25 40 57 91 51 all classes 1000 1000 1000 1000 1000 1000 1000 average MPCE (Rs) 565.11 481.66 466.37 484.42 492.66 570.81 496.62 estd. no. of persons 5767656 20110211 9238966 8633663 6979411 4285577 55015485 no. of sample hhs 390 1547 629 603 508 444 4121 Manipur 0-225 - 11 1 11 0 - 7 225-255 - 3 1 0 0 - 2 255-300 - 12 33 25 194 - 35 300-340 - 12 42 83 35 - 40 340-380 - 83 125 134 52 - 104 380-420 - 139 152 167 25 - 141 420-470 - 94 168 163 79 - 129 470-525 - 130 93 71 173 - 108 525-615 - 174 174 131 182 - 167 615-775 - 225 100 167 223 - 171 775-950 - 53 65 26 28 - 51 950-more - 63 46 21 8 - 46 all classes - 1000 1000 1000 1000 - 1000 average MPCE (Rs) - 571.29 521.72 505.43 501.32 - 537.46 estd. no. of persons - 494728 404575 257321 83753 - 1260775 no. of sample hhs - 282 238 148 53 - 738 (Contd.)

Appendix Tables
NSS Report No.472: Differences in Level of Consumption among Socio-Economic Groups, 1999-2000
A-76
Table 3R: Per 1000 distribution of persons by MPCE class and average MPCE of rural households in different size classes of land possessed and by State/UT
Rural size of land possessed (hectares)
MPCE class (Rs) <0.01 0.01- 0.40 0.41-1.00 1.01-
2.00 2.01-4.00
4.01 & above
all size classes
(1) (2) (3) (4) (5) (6) (7) (8) Meghalaya 0-225 0 1 0 0 0 - 0 225-255 0 0 0 0 0 - 0 255-300 0 19 5 0 6 - 6 300-340 58 60 17 15 0 - 24 340-380 0 104 56 30 30 - 51 380-420 92 86 91 44 70 - 77 420-470 125 110 150 155 158 - 141 470-525 33 121 225 224 113 - 176 525-615 95 192 303 244 239 - 244 615-775 253 237 116 186 284 - 196 775-950 282 39 26 36 45 - 45 950-more 62 32 11 65 56 - 40 all classes 1000 1000 1000 1000 1000 - 1000 average MPCE (Rs) 671.50 543.05 527.24 581.41 595.84 - 563.24 estd. no. of persons 55734 289529 463834 405016 222333 - 1462901 no. of sample hhs 39 191 324 235 125 - 933 Mizoram 0-225 - 0 0 0 0 - 0 225-255 - 0 0 0 0 - 0 255-300 - 9 8 0 0 - 4 300-340 - 16 0 11 0 - 6 340-380 - 0 22 37 5 - 20 380-420 - 46 70 41 18 - 49 420-470 - 46 46 39 21 - 43 470-525 - 69 132 150 107 - 122 525-615 - 56 146 235 105 - 153 615-775 - 225 239 232 401 - 257 775-950 - 186 209 209 194 - 200 950-more - 348 129 46 148 - 145 all classes - 1000 1000 1000 1000 - 1000 average MPCE (Rs) - 851.87 698.44 661.98 743.69 - 721.54 estd. no. of persons - 49017 133995 98248 50643 - 337888 no. of sample hhs - 85 186 99 47 - 428 (Contd.)

Appendix Tables
NSS Report No.472: Differences in Level of Consumption among Socio-Economic Groups, 1999-2000
A-77
Table 3R: Per 1000 distribution of persons by MPCE class and average MPCE of rural households in different size classes of land possessed and by State/UT
Rural size of land possessed (hectares)
MPCE class (Rs) <0.01 0.01- 0.40 0.41-1.00 1.01-
2.00 2.01-4.00
4.01 & above
all size classes
(1) (2) (3) (4) (5) (6) (7) (8) Nagaland 0-225 - 0 0 0 0 0 0 225-255 - 0 0 0 0 0 0 255-300 - 0 0 0 0 0 0 300-340 - 0 18 0 0 0 2 340-380 - 6 0 0 0 0 1 380-420 - 18 0 0 14 0 8 420-470 - 0 0 12 3 0 4 470-525 - 29 12 37 28 21 28 525-615 - 36 60 70 26 102 50 615-775 - 229 306 198 291 251 258 775-950 - 289 168 347 222 159 246 950-more - 393 436 336 417 466 403 all classes - 1000 1000 1000 1000 1000 1000 average MPCE (Rs) - 910.36 963.21 890.05 946.86 1025.48 941.03 estd. no. of persons - 49478 54158 119091 200120 55699 479466 no. of sample hhs - 51 56 112 183 72 480 Orissa 0-225 229 177 162 99 170 188 162 225-255 0 95 130 112 64 29 102 255-300 76 154 131 149 99 28 139 300-340 144 139 132 126 83 140 131 340-380 28 103 115 64 118 24 99 380-420 0 81 89 83 155 133 89 420-470 83 75 76 70 86 84 76 470-525 6 51 46 114 59 62 59 525-615 108 49 44 66 46 130 52 615-775 46 44 43 74 78 72 51 775-950 65 16 14 22 25 66 19 950-more 216 16 17 20 17 43 19 all classes 1000 1000 1000 1000 1000 1000 1000 average MPCE (Rs) 600.44 360.56 361.04 402.50 390.17 453.46 372.95 estd. no. of persons 262219 14253680 7996551 4031931 2117692 703389 29365462 no. of sample hhs 56 1825 835 430 208 123 3477 (Contd.)

Appendix Tables
NSS Report No.472: Differences in Level of Consumption among Socio-Economic Groups, 1999-2000
A-78
Table 3R: Per 1000 distribution of persons by MPCE class and average MPCE of rural households in different size classes of land possessed and by State/UT
Rural size of land possessed (hectares)
MPCE class (Rs) <0.01 0.01- 0.40 0.41-1.00 1.01-
2.00 2.01-4.00
4.01 & above
all size classes
(1) (2) (3) (4) (5) (6) (7) (8) Punjab 0-225 0 2 0 0 0 0 1 225-255 0 9 0 0 0 0 5 255-300 12 19 0 8 0 0 12 300-340 17 34 0 3 0 22 22 340-380 83 68 11 0 0 1 43 380-420 50 68 40 6 7 0 44 420-470 74 102 59 38 12 49 75 470-525 124 132 96 98 33 34 104 525-615 189 164 106 132 175 48 147 615-775 151 200 223 291 244 211 213 775-950 154 100 211 155 221 187 142 950-more 147 101 254 269 308 447 192 all classes 1000 1000 1000 1000 1000 1000 1000 average MPCE (Rs) 660.82 628.04 827.51 811.48 971.14 1004.89 742.29 estd. no. of persons 1110371 7963796 1397589 1373433 1622498 1579733 15047420 no. of sample hhs 176 1090 188 187 229 282 2152 Rajasthan 0-225 0 14 22 12 2 0 10 225-255 7 15 27 13 6 1 12 255-300 116 62 54 55 24 31 47 300-340 48 69 74 52 57 45 60 340-380 100 86 93 80 60 50 74 380-420 101 118 99 123 87 61 97 420-470 289 132 113 126 122 124 127 470-525 49 118 142 130 130 143 131 525-615 117 127 180 137 159 180 156 615-775 101 147 132 177 216 197 171 775-950 47 61 33 52 78 84 62 950-more 24 50 31 43 59 83 54 all classes 1000 1000 1000 1000 1000 1000 1000 average MPCE (Rs) 493.04 527.89 501.69 533.59 576.86 605.35 548.77 estd. no. of persons 503153 8750001 6754236 6406746 5795888 8187466 36397491 no. of sample hhs 57 876 577 534 490 695 3229 (Contd.)

Appendix Tables
NSS Report No.472: Differences in Level of Consumption among Socio-Economic Groups, 1999-2000
A-79
Table 3R: Per 1000 distribution of persons by MPCE class and average MPCE of rural households in different size classes of land possessed and by State/UT
Rural size of land possessed (hectares)
MPCE class (Rs) <0.01 0.01- 0.40 0.41-1.00 1.01-
2.00 2.01-4.00
4.01 & above
all size classes
(1) (2) (3) (4) (5) (6) (7) (8) Sikkim 0-225 0 20 11 6 22 0 11 225-255 0 3 17 3 33 0 10 255-300 10 46 84 21 35 0 47 300-340 17 92 145 79 45 0 92 340-380 37 115 92 75 53 75 84 380-420 44 78 164 253 176 145 146 420-470 71 99 149 167 214 99 135 470-525 28 72 102 159 63 226 96 525-615 213 117 114 126 159 124 133 615-775 288 158 89 67 168 183 134 775-950 43 110 26 30 21 105 51 950-more 250 89 9 15 11 44 60 all classes 1000 1000 1000 1000 1000 1000 1000 average MPCE (Rs) 758.16 568.03 459.74 475.17 493.89 592.97 531.45 estd. no. of persons 46742 94528 128023 75332 30964 8558 384147 no. of sample hhs 175 252 334 175 87 33 1056 Tamil Nadu 0-225 36 48 71 40 1 3 48 225-255 45 50 40 27 26 0 45 255-300 78 106 76 78 21 0 93 300-340 98 98 116 116 107 52 102 340-380 80 100 89 63 107 88 94 380-420 74 96 100 55 43 65 90 420-470 92 105 111 100 111 46 104 470-525 101 89 84 144 84 46 92 525-615 107 105 89 81 193 215 106 615-775 111 103 118 151 100 167 110 775-950 70 56 61 90 79 86 61 950-more 110 43 45 53 127 231 55 all classes 1000 1000 1000 1000 1000 1000 1000 average MPCE (Rs) 546.81 501.21 487.93 529.80 622.67 844.57 513.75 estd. no. of persons 3282118 24544269 5795243 2388816 1246069 529044 37785559 no. of sample hhs 356 2540 630 296 212 139 4173 (Contd.)

Appendix Tables
NSS Report No.472: Differences in Level of Consumption among Socio-Economic Groups, 1999-2000
A-80
Table 3R: Per 1000 distribution of persons by MPCE class and average MPCE of rural households in different size classes of land possessed and by State/UT
Rural size of land possessed (hectares)
MPCE class (Rs) <0.01 0.01- 0.40 0.41-1.00 1.01-
2.00 2.01-4.00
4.01 & above
all size classes
(1) (2) (3) (4) (5) (6) (7) (8) Tripura 0-225 - 17 0 0 0 - 11 225-255 - 8 0 0 0 - 5 255-300 - 53 17 0 0 - 40 300-340 - 94 15 35 0 - 69 340-380 - 102 34 35 0 - 77 380-420 - 115 96 109 0 - 107 420-470 - 149 132 151 406 - 146 470-525 - 117 192 117 28 - 135 525-615 - 152 222 262 226 - 175 615-775 - 99 215 203 7 - 139 775-950 - 63 64 45 126 - 68 950-more - 32 13 43 207 - 28 all classes - 1000 1000 1000 1000 - 1000 average MPCE (Rs) - 505.02 560.57 563.14 742.80 - 528.09 estd. no. of persons - 1591995 580699 164646 16885 - 2426079 no. of sample hhs - 689 243 53 20 - 1031 Uttar Pradesh 0-225 60 64 37 25 2 3 44 225-255 35 71 38 38 29 10 51 255-300 105 145 108 84 40 40 113 300-340 111 130 112 108 75 17 113 340-380 102 121 128 117 72 50 115 380-420 98 102 123 116 82 63 107 420-470 100 89 118 83 106 106 98 470-525 105 79 91 88 109 123 88 525-615 108 84 93 117 167 157 102 615-775 83 65 84 128 159 159 91 775-950 44 24 41 57 91 114 43 950-more 50 25 27 40 68 157 36 all classes 1000 1000 1000 1000 1000 1000 1000 average MPCE (Rs) 475.77 424.34 456.00 497.42 579.56 680.86 466.44 estd. no. of persons 4674394 56489481 32479920 20428608 10728566 38555 01 128656471 no. of sample hhs 437 4280 2155 1320 820 420 9432 (Contd.)

Appendix Tables
NSS Report No.472: Differences in Level of Consumption among Socio-Economic Groups, 1999-2000
A-81
Table 3R: Per 1000 distribution of persons by MPCE class and average MPCE of rural households in different size classes of land possessed and by State/UT
Rural size of land possessed (hectares)
MPCE class (Rs) <0.01 0.01- 0.40 0.41-1.00 1.01-
2.00 2.01-4.00
4.01 & above
all size classes
(1) (2) (3) (4) (5) (6) (7) (8) West Bengal 0-225 41 43 29 48 136 64 43 225-255 27 48 38 61 0 63 46 255-300 100 127 68 57 89 78 109 300-340 83 97 78 80 80 6 91 340-380 166 130 86 51 50 61 115 380-420 91 141 89 101 33 78 124 420-470 91 116 123 132 101 67 117 470-525 93 102 109 125 127 99 106 525-615 133 81 165 155 150 84 104 615-775 103 66 136 88 109 216 82 775-950 40 29 41 62 52 102 35 950-more 32 21 37 39 72 80 27 all classes 1000 1000 1000 1000 1000 1000 1000 average MPCE (Rs) 467.72 435.10 500.96 491.54 516.41 568.23 454.24 estd. no. of persons 2112812 39679583 9345282 4542523 1431310 313200 57424711 no. of sample hhs 231 2955 740 391 166 67 4550 A. & N. Islands 0-225 0 0 0 0 0 - 0 225-255 0 0 0 0 0 - 0 255-300 0 0 0 0 0 - 0 300-340 21 0 0 60 0 - 11 340-380 0 4 27 0 0 - 5 380-420 24 25 44 40 0 - 24 420-470 6 23 13 152 122 - 67 470-525 136 71 103 5 134 - 92 525-615 205 85 224 302 286 - 170 615-775 156 384 180 249 226 - 293 775-950 110 209 116 127 145 - 161 950-more 342 199 294 66 87 - 178 all classes 1000 1000 1000 1000 1000 - 1000 average MPCE (Rs) 906.77 865.82 763.61 633.61 678.46 - 780.07 estd. no. of persons 23741 79964 23037 28878 28706 - 197924 no. of sample hhs 40 110 42 43 32 - 273 (Contd.)

Appendix Tables
NSS Report No.472: Differences in Level of Consumption among Socio-Economic Groups, 1999-2000
A-82
Table 3R: Per 1000 distribution of persons by MPCE class and average MPCE of rural households in different size classes of land possessed and by State/UT
Rural size of land possessed (hectares)
MPCE class (Rs) <0.01 0.01- 0.40 0.41-1.00 1.01-
2.00 2.01-4.00
4.01 & above
all size classes
(1) (2) (3) (4) (5) (6) (7) (8) Chandigarh 0-225 0 5 - - - - 1 225-255 0 0 - - - - 0 255-300 34 0 - - - - 18 300-340 22 162 - - - - 58 340-380 0 0 - - - - 0 380-420 19 20 - - - - 16 420-470 119 86 - - - - 88 470-525 32 54 - - - - 32 525-615 56 175 - - - - 80 615-775 154 136 - - - - 120 775-950 153 199 - - - - 154 950-more 410 164 - - - - 433 all classes 1000 1000 - - - - 1000 average MPCE (Rs) 992.87 733.04 - - - - 988.97 estd. no. of persons 52226 28333 - - - - 98862 no. of sample hhs 114 52 - - - - 180 Dadra & Nagar Haveli 0-225 - 42 6 0 - - 27 225-255 - 63 46 49 - - 47 255-300 - 49 84 72 - - 63 300-340 - 82 122 0 - - 83 340-380 - 27 58 250 - - 70 380-420 - 61 135 66 - - 92 420-470 - 46 216 296 - - 154 470-525 - 131 108 0 - - 93 525-615 - 181 117 147 - - 140 615-775 - 132 46 55 - - 87 775-950 - 76 42 23 - - 48 950-more - 110 21 42 - - 97 all classes - 1000 1000 1000 - - 1000 average MPCE (Rs) - 572.77 455.99 468.12 - - 561.12 estd. no. of persons - 42643 66263 17012 - - 140026 no. of sample hhs - 67 78 24 - - 192 (Contd.)

Appendix Tables
NSS Report No.472: Differences in Level of Consumption among Socio-Economic Groups, 1999-2000
A-83
Table 3R: Per 1000 distribution of persons by MPCE class and average MPCE of rural households in different size classes of land possessed and by State/UT
Rural size of land possessed (hectares)
MPCE class (Rs) <0.01 0.01- 0.40 0.41-1.00 1.01-
2.00 2.01-4.00
4.01 & above
all size classes
(1) (2) (3) (4) (5) (6) (7) (8) Daman & Diu 0-225 - 0 0 - - - 0 225-255 - 0 0 - - - 0 255-300 - 0 0 - - - 0 300-340 - 32 0 - - - 23 340-380 - 30 0 - - - 22 380-420 - 0 0 - - - 0 420-470 - 86 0 - - - 62 470-525 - 42 51 - - - 39 525-615 - 82 220 - - - 98 615-775 - 196 270 - - - 207 775-950 - 150 195 - - - 173 950-more - 380 264 - - - 376 all classes - 1000 1000 - - - 1000 average MPCE (Rs) - 902.80 823.86 - - - 901.38 estd. no. of persons - 44437 10904 - - - 61923 no. of sample hhs - 134 30 - - - 180 Delhi 0-225 0 0 - - - - 0 225-255 0 0 - - - - 0 255-300 0 0 - - - - 0 300-340 0 0 - - - - 0 340-380 5 15 - - - - 7 380-420 8 0 - - - - 6 420-470 0 23 - - - - 6 470-525 27 71 - - - - 41 525-615 84 141 - - - - 93 615-775 226 164 - - - - 208 775-950 273 77 - - - - 225 950-more 377 510 - - - - 415 all classes 1000 1000 - - - - 1000 average MPCE (Rs) 891.11 955.94 - - - - 916.85 estd. no. of persons 2206331 746940 - - - - 3111293 no. of sample hhs 84 77 - - - - 187 (Contd.)

Appendix Tables
NSS Report No.472: Differences in Level of Consumption among Socio-Economic Groups, 1999-2000
A-84
Table 3R: Per 1000 distribution of persons by MPCE class and average MPCE of rural households in different size classes of land possessed and by State/UT
Rural size of land possessed (hectares)
MPCE class (Rs) <0.01 0.01- 0.40 0.41-1.00 1.01-
2.00 2.01-4.00
4.01 & above
all size classes
(1) (2) (3) (4) (5) (6) (7) (8) Lakshadweep 0-225 - 0 - - - - 0 225-255 - 0 - - - - 0 255-300 - 0 - - - - 0 300-340 - 0 - - - - 0 340-380 - 0 - - - - 0 380-420 - 0 - - - - 0 420-470 - 41 - - - - 39 470-525 - 80 - - - - 95 525-615 - 160 - - - - 151 615-775 - 158 - - - - 154 775-950 - 257 - - - - 243 950-more - 304 - - - - 319 all classes - 1000 - - - - 1000 average MPCE (Rs) - 866.96 - - - - 876.13 estd. no. of persons - 30996 - - - - 32880 no. of sample hhs - 73 - - - - 84 Pondicherry 0-225 - 30 0 - - - 25 225-255 - 35 27 - - - 32 255-300 - 61 0 - - - 51 300-340 - 50 31 - - - 49 340-380 - 105 0 - - - 95 380-420 - 68 0 - - - 61 420-470 - 122 0 - - - 103 470-525 - 83 156 - - - 96 525-615 - 132 73 - - - 126 615-775 - 119 119 - - - 117 775-950 - 88 217 - - - 104 950-more - 107 376 - - - 141 all classes - 1000 1000 - - - 1000 average MPCE (Rs) - 561.38 797.11 - - - 597.48 estd. no. of persons - 262977 20328 - - - 311565 no. of sample hhs - 219 22 - - - 288 (Contd.)

Appendix Tables
NSS Report No.472: Differences in Level of Consumption among Socio-Economic Groups, 1999-2000
A-85
Table 3R: Per 1000 distribution of persons by MPCE class and average MPCE of rural households in different size classes of land possessed and by State/UT
Rural size of land possessed (hectares) MPCE class
(Rs) <0.01 0.01- 0.40 0.41-1.00 1.01-2.00
2.01-4.00
4.01 & above
all classes
(1) (2) (3) (4) (5) (6) (7) (8) all-India 0-225 68 61 52 41 29 15 52 225-255 54 59 49 46 33 21 50 255-300 103 119 98 83 69 45 100 300-340 96 107 107 100 85 46 100 340-380 95 110 107 99 92 65 103 380-420 79 99 105 106 86 67 97 420-470 91 100 113 100 106 97 102 470-525 82 89 88 104 101 121 93 525-615 102 89 105 115 126 144 103 615-775 91 85 96 111 129 164 99 775-950 64 41 43 52 69 91 50 950-more 74 41 37 44 74 124 50 all classes 1000 1000 1000 1000 1000 1000 1000 average MPCE 499.91 462.07 468.42 491.06 541.79 627.53 485.88 estd. no. of persons 39224267 322160397 134781852 94815362 61800018 39001727 691783624 no. of sample hhs 4419 33168 13691 9157 6142 4808 71385

Appendix Tables
NSS Report No. 472: Differences in Level of Consumption among Socio-Economic Groups,1999-2000 A-86
Table 4R : Average MPCE of rural households classified by household type, social group and area of land possessed and by State/UT Rural
average MPCE (Rs) of households of number of sample households of social group social group household
type
size of land
possessed (hectares) ST SC OBC others all ST SC OBC others all
(1) (2) (3) (4) (5) (6) (7) (8) (9) (10) (11) (12)
Andhra Pradesh < 0.01 - - 447.74 - 443.14 - - 25 - 38
0.01 - 0.40 504.85 408.67 445.29 520.38 467.58 26 59 320 216 6210.41 - 1.00 - - 412.32 564.61 439.98 - - 55 23 911.01 - 2.00 - - 392.26 - 430.06 - - 20 - 392.01 - 4.00 - - - - 592.01 - - - - 24
4.01 + - - - - - - - - - -
self-employed
in non- agriculture
all sizes 464.07 408.10 442.67 529.16 466.95 30 75 440 281 826< 0.01 - 380.84 478.85 414.75 422.22 - 32 30 37 102
0.01 - 0.40 355.24 364.92 406.65 426.55 390.39 101 475 562 202 13400.41 - 1.00 389.32 360.84 409.09 457.73 395.93 53 124 173 52 4021.01 - 2.00 - 374.86 352.61 - 377.17 - 24 52 - 1052.01 - 4.00 - - - - 318.25 - - - - 32
4.01 + - - - - - - - - - -
agricultural labour
all sizes 359.72 364.79 403.27 434.56 390.93 173 661 834 313 1981< 0.01 - - - - - - - - - -
0.01 - 0.40 - 409.99 439.35 439.99 432.59 - 41 126 42 2150.41 - 1.00 - - - - 421.82 - - - - 291.01 - 2.00 - - - - - - - - - -2.01 - 4.00 - - - - - - - - - -
4.01 + - - - - - - - - - -
other labour
all sizes - 425.39 435.89 436.00 434.68 - 51 157 56 272< 0.01 - - - - - - - - - -
0.01 - 0.40 - - 423.65 557.77 447.44 - - 72 26 1190.41 - 1.00 354.18 377.39 472.80 505.55 455.19 39 32 192 82 3451.01 - 2.00 384.68 432.99 473.45 564.33 488.65 69 27 172 127 3952.01 - 4.00 356.86 - 472.13 626.98 520.44 57 - 123 153 346
4.01 + 445.98 - 504.12 703.99 625.26 24 - 81 207 320
self-employed
in agriculture
all sizes 373.86 403.73 470.06 606.50 502.68 204 88 643 596 1532< 0.01 - - 510.66 594.89 503.53 - - 26 22 68
0.01 - 0.40 - 537.41 551.94 859.65 678.13 - 41 152 152 3580.41 - 1.00 - - 556.62 - 614.24 - - 24 - 461.01 - 2.00 - - - - 532.14 - - - - 322.01 - 4.00 - - - - 578.31 - - - - 27
4.01 + - - - - 715.18 - - - - 28
other households
all sizes 575.62 508.08 536.94 789.40 645.50 25 66 225 243 559< 0.01 - 376.83 470.61 459.43 441.00 - 55 89 77 235
0.01 - 0.40 393.56 381.41 432.07 544.73 439.02 158 627 1233 638 26560.41 - 1.00 378.44 366.07 439.81 507.94 429.59 98 172 463 181 9141.01 - 2.00 368.39 407.03 438.19 556.49 458.81 84 57 263 177 5812.01 - 4.00 354.65 427.31 449.73 620.66 505.03 64 23 162 183 433
4.01 + 474.41 - 502.97 716.26 637.51 27 - 91 234 362
all households
all sizes 382.96 381.68 438.76 564.35 453.47 441 943 2301 1490 5181 (Contd.)

Appendix Tables
NSS Report No. 472: Differences in Level of Consumption among Socio-Economic Groups,1999-2000 A-87
Table 4R : Average MPCE of rural households classified by household type, social group and area of land possessed and by State/UT Rural
average MPCE (Rs) of households of number of sample households of social group social group household
type
size of land
possessed (hectares) ST SC OBC others all ST SC OBC others all
(1) (2) (3) (4) (5) (6) (7) (8) (9) (10) (11) (12)
Arunachal Pradesh < 0.01 - - - 617.32 619.97 - - - 21 22
0.01 - 0.40 - - - - 895.90 - - - - 260.41 - 1.00 - - - - - - - - - -1.01 - 2.00 - - - - - - - - - -2.01 - 4.00 - - - - - - - - - -
4.01 + - - - - - - - - - -
self-employed
in non- agriculture
all sizes 1813.88 - - 602.75 911.76 22 - - 39 63< 0.01 - - - - - - - - - -
0.01 - 0.40 - - - - - - - - - -0.41 - 1.00 - - - - - - - - - -1.01 - 2.00 - - - - - - - - - -2.01 - 4.00 - - - - - - - - - -
4.01 + - - - - - - - - - -
agricultural labour
all sizes 602.26 - - - 572.91 21 - - - 26< 0.01 - - - - - - - - - -
0.01 - 0.40 - - - - - - - - - -0.41 - 1.00 - - - - - - - - - -1.01 - 2.00 - - - - - - - - - -2.01 - 4.00 - - - - - - - - - -
4.01 + - - - - - - - - - -
other labour
all sizes - - - - 778.31 - - - - 30< 0.01 - - - - - - - - - -
0.01 - 0.40 624.93 - - - 607.46 51 - - - 580.41 - 1.00 716.12 - - - 695.65 81 - - - 921.01 - 2.00 591.08 - - 412.37 548.83 97 - - 27 1272.01 - 4.00 572.34 - - - 543.67 89 - - - 103
4.01 + 660.07 - - - 653.35 50 - - - 52
self-employed
in agriculture
all sizes 637.57 - - 403.93 606.22 370 - - 55 434< 0.01 - - - 756.63 889.52 - - - 56 76
0.01 - 0.40 891.75 - - - 904.76 20 - - - 340.41 - 1.00 607.19 - - - 558.30 25 - - - 401.01 - 2.00 561.96 - - - 561.96 23 - - - 232.01 - 4.00 574.14 - - - 574.04 27 - - - 28
4.01 + 419.03 - - - 419.03 67 - - - 67
other households
all sizes 584.79 - - 721.06 639.46 176 - - 83 268< 0.01 - - - 646.11 735.47 - - - 84 110
0.01 - 0.40 849.12 - - 698.21 810.74 90 - - 42 1380.41 - 1.00 755.54 - - 531.36 713.22 117 - - 31 1511.01 - 2.00 606.83 - - 412.37 571.93 127 - - 27 1572.01 - 4.00 600.70 - - - 577.87 130 - - - 146
4.01 + 449.58 - - - 458.60 121 - - - 125
all households
all sizes 658.62 - - 574.46 647.52 602 - - 201 827 (Contd.)

Appendix Tables
NSS Report No. 472: Differences in Level of Consumption among Socio-Economic Groups,1999-2000 A-88
Table 4R : Average MPCE of rural households classified by household type, social group and area of land possessed and by State/UT Rural
average MPCE (Rs) of households of number of sample households of social group social group household
type
size of land
possessed (hectares) ST SC OBC others all ST SC OBC others all
(1) (2) (3) (4) (5) (6) (7) (8) (9) (10) (11) (12)
Assam < 0.01 - - - 343.66 350.78 - - - 26 29
0.01 - 0.40 376.77 413.30 421.42 425.82 420.58 22 61 43 263 3890.41 - 1.00 - - - 430.76 444.34 - - - 57 861.01 - 2.00 - - - 498.88 510.17 - - - 20 372.01 - 4.00 - - - - - - - - - -
4.01 + - - - - - - - - - -
self-employed
in non- agriculture
all sizes 441.03 425.06 458.59 427.43 432.58 33 79 73 374 560< 0.01 - - - - - - - - - -
0.01 - 0.40 341.33 310.62 294.84 339.29 327.59 60 36 131 245 4730.41 - 1.00 - - - - 367.36 - - - - 421.01 - 2.00 - - - - - - - - - -2.01 - 4.00 - - - - - - - - - -
4.01 + - - - - - - - - - -
agricultural labour
all sizes 338.20 316.60 301.29 338.68 329.03 72 42 143 278 536< 0.01 - - - 257.87 266.06 - - - 40 49
0.01 - 0.40 360.44 350.94 366.61 364.92 363.63 39 33 120 228 4200.41 - 1.00 - - - - 363.94 - - - - 361.01 - 2.00 - - - - - - - - - -2.01 - 4.00 - - - - - - - - - -
4.01 + - - - - - - - - - -
other labour
all sizes 343.19 344.89 379.12 351.44 356.88 47 43 133 293 516< 0.01 - - - - - - - - - -
0.01 - 0.40 - - - 407.90 426.77 - - - 46 740.41 - 1.00 421.11 405.00 477.22 418.82 426.81 124 39 77 234 4741.01 - 2.00 423.22 417.01 505.96 440.09 442.18 176 45 89 201 5122.01 - 4.00 440.14 - 504.38 514.43 486.90 56 - 40 65 176
4.01 + - - - 478.62 499.44 - - - 34 70
self-employed
in agriculture
all sizes 429.71 432.43 493.14 438.60 444.13 391 108 227 580 1307< 0.01 - - - - 548.70 - - - - 23
0.01 - 0.40 515.38 438.76 497.31 540.66 511.74 21 38 43 167 2690.41 - 1.00 - - 517.14 547.67 536.87 - - 36 61 1221.01 - 2.00 - - - 624.53 643.31 - - - 45 802.01 - 4.00 - - - - 632.42 - - - - 30
4.01 + - - - - - - - - - -
other households
all sizes 671.78 474.35 508.40 554.90 545.27 60 59 112 299 530< 0.01 - - - 306.08 324.69 - - - 90 119
0.01 - 0.40 374.33 390.25 375.34 403.32 393.72 158 172 347 951 16300.41 - 1.00 431.83 422.27 475.44 431.57 439.32 155 66 152 390 7651.01 - 2.00 468.50 435.32 498.91 459.67 466.27 193 57 116 274 6432.01 - 4.00 471.07 - 525.23 525.28 507.43 68 - 54 84 225
4.01 + 528.92 - - 492.77 521.01 22 - - 37 80
all households
all sizes 437.39 414.19 435.57 421.58 425.90 604 332 691 1826 3462 (Contd.)

Appendix Tables
NSS Report No. 472: Differences in Level of Consumption among Socio-Economic Groups,1999-2000 A-89
Table 4R : Average MPCE of rural households classified by household type, social group and area of land possessed and by State/UT Rural
average MPCE (Rs) of households of number of sample households of social group social group household
type
size of land
possessed (hectares) ST SC OBC others all ST SC OBC others all
(1) (2) (3) (4) (5) (6) (7) (8) (9) (10) (11) (12)
Bihar < 0.01 - 365.96 394.01 345.67 377.28 - 46 68 25 148
0.01 - 0.40 318.05 356.36 389.51 407.04 383.73 29 137 511 134 8120.41 - 1.00 - - 411.53 534.60 423.33 - - 82 32 1321.01 - 2.00 - - - - 416.75 - - - - 262.01 - 4.00 - - - - - - - - - -
4.01 + - - - - - - - - - -
self-employed
in non- agriculture
all sizes 338.17 357.53 399.03 420.68 391.96 49 195 694 211 1156< 0.01 - 306.31 307.10 359.02 309.07 - 256 181 22 471
0.01 - 0.40 328.06 316.72 344.64 359.18 335.68 115 629 874 220 18400.41 - 1.00 283.78 326.01 373.41 - 328.39 41 20 28 - 1021.01 - 2.00 - - - - - - - - - -2.01 - 4.00 - - - - - - - - - -
4.01 + - - - - - - - - - -
agricultural labour
all sizes 311.71 314.35 341.03 360.08 331.31 180 905 1094 258 2439< 0.01 - 280.84 - - 294.38 - 35 - - 48
0.01 - 0.40 313.60 293.38 328.40 - 316.18 50 75 95 - 2380.41 - 1.00 - - - - - - - - - -1.01 - 2.00 - - - - - - - - - -2.01 - 4.00 - - - - - - - - - -
4.01 + - - - - - - - - - -
other labour
all sizes 315.18 291.29 324.75 370.89 313.70 55 116 119 21 311< 0.01 - - - - - - - - - -
0.01 - 0.40 451.29 383.25 379.32 449.71 397.55 22 48 299 116 4870.41 - 1.00 344.39 361.01 397.69 453.15 405.22 134 60 459 229 8831.01 - 2.00 329.59 394.40 418.63 466.24 419.41 118 34 288 194 6372.01 - 4.00 355.43 - 465.22 511.12 473.08 43 - 105 119 280
4.01 + - - 565.53 615.42 585.90 - - 103 135 253
self-employed
in agriculture
all sizes 346.03 385.69 409.03 477.50 422.45 328 161 1259 793 2551< 0.01 - - 437.80 456.68 426.84 - - 38 28 85
0.01 - 0.40 444.91 367.64 398.15 559.62 443.70 21 69 274 148 5130.41 - 1.00 377.55 - 473.98 493.25 455.76 20 - 63 28 1271.01 - 2.00 - - 418.44 - 446.30 - - 31 - 572.01 - 4.00 - - - - 522.92 - - - - 30
4.01 + - - - - - - - - - -
other households
all sizes 396.36 377.21 418.34 545.61 448.68 55 108 425 240 829< 0.01 - 313.87 338.74 391.76 332.29 - 360 304 76 767
0.01 - 0.40 344.82 325.69 365.86 428.80 364.71 237 959 2059 637 39010.41 - 1.00 333.25 359.84 403.36 454.99 404.29 207 111 639 305 12651.01 - 2.00 325.28 376.77 418.76 474.27 418.70 135 36 350 216 7402.01 - 4.00 348.27 - 477.29 521.09 481.67 50 - 126 140 331
4.01 + 335.53 - 561.39 614.13 557.85 26 - 120 152 307
all households
all sizes 337.16 329.32 384.66 457.59 384.45 673 1486 3598 1526 7311 (Contd.)

Appendix Tables
NSS Report No. 472: Differences in Level of Consumption among Socio-Economic Groups,1999-2000 A-90
Table 4R : Average MPCE of rural households classified by household type, social group and area of land possessed and by State/UT Rural
average MPCE (Rs) of households of number of sample households of social group social group household
type
size of land
possessed (hectares) ST SC OBC others all ST SC OBC others all
(1) (2) (3) (4) (5) (6) (7) (8) (9) (10) (11) (12)
Goa < 0.01 - - - - - - - - - -
0.01 - 0.40 - - - 926.59 940.16 - - - 22 250.41 - 1.00 - - - - - - - - - -1.01 - 2.00 - - - - - - - - - -2.01 - 4.00 - - - - - - - - - -
4.01 + - - - - - - - - - -
self-employed
in non- agriculture
all sizes - - - 988.28 996.92 - - - 27 30< 0.01 - - - - - - - - - -
0.01 - 0.40 - - - - 614.36 - - - - 230.41 - 1.00 - - - - - - - - - -1.01 - 2.00 - - - - - - - - - -2.01 - 4.00 - - - - - - - - - -
4.01 + - - - - - - - - - -
agricultural labour
all sizes - - - 664.53 613.79 - - - 23 29< 0.01 - - - - - - - - - -
0.01 - 0.40 - - - 735.46 722.76 - - - 29 300.41 - 1.00 - - - - - - - - - -1.01 - 2.00 - - - - - - - - - -2.01 - 4.00 - - - - - - - - - -
4.01 + - - - - - - - - - -
other labour
all sizes - - - 758.12 753.10 - - - 32 34< 0.01 - - - - - - - - - -
0.01 - 0.40 - - - - - - - - - -0.41 - 1.00 - - - - - - - - - -1.01 - 2.00 - - - - - - - - - -2.01 - 4.00 - - - - - - - - - -
4.01 + - - - - - - - - - -
self-employed
in agriculture
all sizes - - - - - - - - - -< 0.01 - - - - - - - - - -
0.01 - 0.40 - - - 1082.78 1082.78 - - - 62 620.41 - 1.00 - - - - - - - - - -1.01 - 2.00 - - - - - - - - - -2.01 - 4.00 - - - - - - - - - -
4.01 + - - - - - - - - - -
other households
all sizes - - - 1041.85 1046.78 - - - 79 80< 0.01 - - - - - - - - - -
0.01 - 0.40 - - - 890.95 868.64 - - - 142 1520.41 - 1.00 - - - - - - - - - -1.01 - 2.00 - - - - - - - - - -2.01 - 4.00 - - - - - - - - - -
4.01 + - - - - - - - - - -
all households
all sizes - - - 886.20 868.66 - - - 178 192 (Contd.)
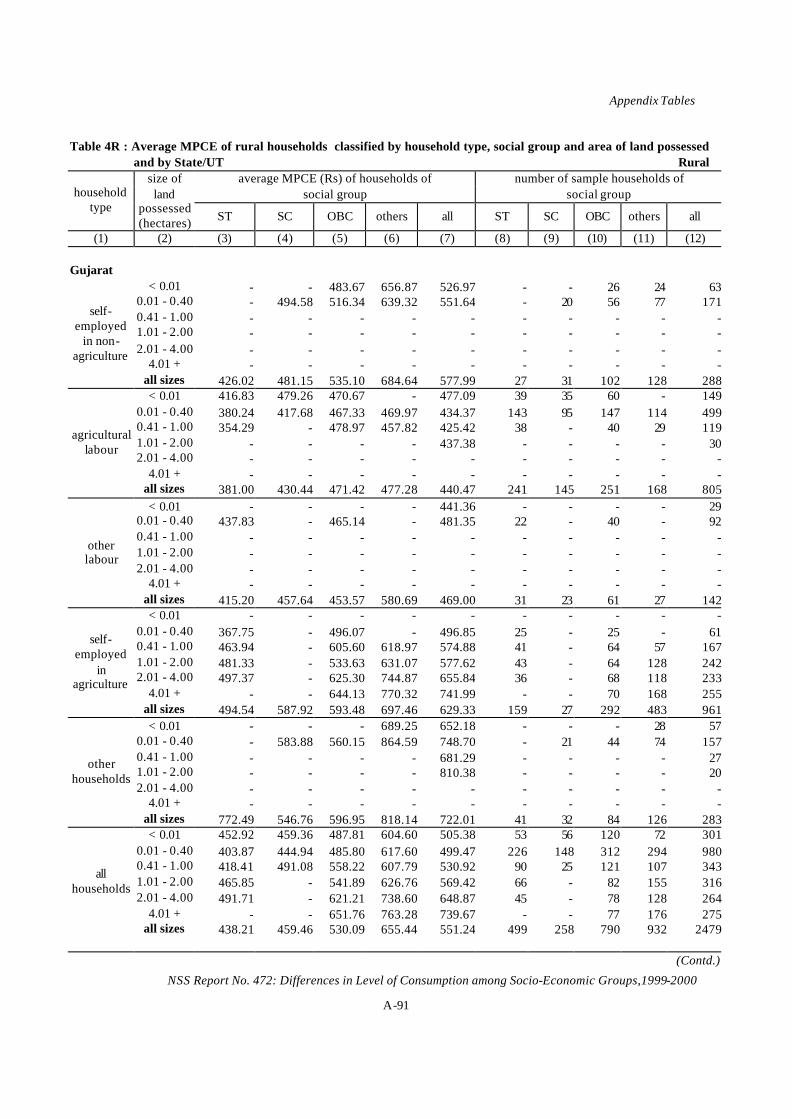
Appendix Tables
NSS Report No. 472: Differences in Level of Consumption among Socio-Economic Groups,1999-2000 A-91
Table 4R : Average MPCE of rural households classified by household type, social group and area of land possessed and by State/UT Rural
average MPCE (Rs) of households of number of sample households of social group social group household
type
size of land
possessed (hectares) ST SC OBC others all ST SC OBC others all
(1) (2) (3) (4) (5) (6) (7) (8) (9) (10) (11) (12)
Gujarat < 0.01 - - 483.67 656.87 526.97 - - 26 24 63
0.01 - 0.40 - 494.58 516.34 639.32 551.64 - 20 56 77 1710.41 - 1.00 - - - - - - - - - -1.01 - 2.00 - - - - - - - - - -2.01 - 4.00 - - - - - - - - - -
4.01 + - - - - - - - - - -
self-employed
in non- agriculture
all sizes 426.02 481.15 535.10 684.64 577.99 27 31 102 128 288< 0.01 416.83 479.26 470.67 - 477.09 39 35 60 - 149
0.01 - 0.40 380.24 417.68 467.33 469.97 434.37 143 95 147 114 4990.41 - 1.00 354.29 - 478.97 457.82 425.42 38 - 40 29 1191.01 - 2.00 - - - - 437.38 - - - - 302.01 - 4.00 - - - - - - - - - -
4.01 + - - - - - - - - - -
agricultural labour
all sizes 381.00 430.44 471.42 477.28 440.47 241 145 251 168 805< 0.01 - - - - 441.36 - - - - 29
0.01 - 0.40 437.83 - 465.14 - 481.35 22 - 40 - 920.41 - 1.00 - - - - - - - - - -1.01 - 2.00 - - - - - - - - - -2.01 - 4.00 - - - - - - - - - -
4.01 + - - - - - - - - - -
other labour
all sizes 415.20 457.64 453.57 580.69 469.00 31 23 61 27 142< 0.01 - - - - - - - - - -
0.01 - 0.40 367.75 - 496.07 - 496.85 25 - 25 - 610.41 - 1.00 463.94 - 605.60 618.97 574.88 41 - 64 57 1671.01 - 2.00 481.33 - 533.63 631.07 577.62 43 - 64 128 2422.01 - 4.00 497.37 - 625.30 744.87 655.84 36 - 68 118 233
4.01 + - - 644.13 770.32 741.99 - - 70 168 255
self-employed
in agriculture
all sizes 494.54 587.92 593.48 697.46 629.33 159 27 292 483 961< 0.01 - - - 689.25 652.18 - - - 28 57
0.01 - 0.40 - 583.88 560.15 864.59 748.70 - 21 44 74 1570.41 - 1.00 - - - - 681.29 - - - - 271.01 - 2.00 - - - - 810.38 - - - - 202.01 - 4.00 - - - - - - - - - -
4.01 + - - - - - - - - - -
other households
all sizes 772.49 546.76 596.95 818.14 722.01 41 32 84 126 283< 0.01 452.92 459.36 487.81 604.60 505.38 53 56 120 72 301
0.01 - 0.40 403.87 444.94 485.80 617.60 499.47 226 148 312 294 9800.41 - 1.00 418.41 491.08 558.22 607.79 530.92 90 25 121 107 3431.01 - 2.00 465.85 - 541.89 626.76 569.42 66 - 82 155 3162.01 - 4.00 491.71 - 621.21 738.60 648.87 45 - 78 128 264
4.01 + - - 651.76 763.28 739.67 - - 77 176 275
all households
all sizes 438.21 459.46 530.09 655.44 551.24 499 258 790 932 2479 (Contd.)

Appendix Tables
NSS Report No. 472: Differences in Level of Consumption among Socio-Economic Groups,1999-2000 A-92
Table 4R : Average MPCE of rural households classified by household type, social group and area of land possessed and by State/UT Rural
average MPCE (Rs) of households of number of sample households of social group social group household
type
size of land
possessed (hectares) ST SC OBC others all ST SC OBC others all
(1) (2) (3) (4) (5) (6) (7) (8) (9) (10) (11) (12)
Haryana < 0.01 - - - - - - - - - -
0.01 - 0.40 - 519.14 665.34 759.62 659.97 - 23 70 37 1310.41 - 1.00 - - - - - - - - - -1.01 - 2.00 - - - - - - - - - -2.01 - 4.00 - - - - - - - - - -
4.01 + - - - - - - - - - -
self-employedo
yed in non-
agriculture all sizes - 538.69 649.80 763.95 664.00 - 27 82 51 161< 0.01 - - - - 588.87 - - - - 22
0.01 - 0.40 - 494.25 488.10 - 506.19 - 83 34 - 1340.41 - 1.00 - - - - - - - - - -1.01 - 2.00 - - - - - - - - - -2.01 - 4.00 - - - - - - - - - -
4.01 + - - - - - - - - - -
agricultural labour
all sizes - 510.97 510.42 737.02 543.08 - 93 50 29 174< 0.01 - - - - - - - - - -
0.01 - 0.40 - 494.86 490.33 - 534.80 - 35 32 - 810.41 - 1.00 - - - - - - - - - -1.01 - 2.00 - - - - - - - - - -2.01 - 4.00 - - - - - - - - - -
4.01 + - - - - - - - - - -
other labour
all sizes - 519.75 499.77 - 544.75 - 51 41 - 108< 0.01 - - - - - - - - - -
0.01 - 0.40 - - - - 882.24 - - - - 220.41 - 1.00 - - 703.09 858.65 815.87 - - 21 51 771.01 - 2.00 - - 696.62 753.75 737.90 - - 33 86 1222.01 - 4.00 - - 641.89 853.80 821.11 - - 29 110 144
4.01 + - - 886.37 850.22 852.09 - - 22 100 125
self-employed
in agriculture
all sizes - - 727.55 833.76 808.05 - - 108 363 490< 0.01 - - - - - - - - - -
0.01 - 0.40 - 661.19 743.35 855.59 772.16 - 30 44 61 1350.41 - 1.00 - - - 970.70 996.75 - - - 21 321.01 - 2.00 - - - - - - - - - -2.01 - 4.00 - - - - - - - - - -
4.01 + - - - - - - - - - -
other households
all sizes - 671.77 779.63 910.50 821.71 - 35 63 96 195< 0.01 - 683.29 559.96 - 621.27 - 23 20 - 55
0.01 - 0.40 - 522.57 613.06 828.11 631.67 - 175 183 144 5050.41 - 1.00 - - 703.90 861.39 806.95 - - 43 85 1411.01 - 2.00 - - 650.43 766.95 739.76 - - 40 93 1392.01 - 4.00 - - 648.67 839.23 809.08 - - 34 117 157
4.01 + - - 884.94 903.33 895.98 - - 24 108 135
all households
all sizes - 543.24 641.26 834.48 714.16 - 224 344 555 1132 (Contd.)

Appendix Tables
NSS Report No. 472: Differences in Level of Consumption among Socio-Economic Groups,1999-2000 A-93
Table 4R : Average MPCE of rural households classified by household type, social group and area of land possessed and by State/UT Rural
average MPCE (Rs) of households of number of sample households of social group social group household
type
size of land
possessed (hectares) ST SC OBC others all ST SC OBC others all
(1) (2) (3) (4) (5) (6) (7) (8) (9) (10) (11) (12)
Himachal Pradesh < 0.01 - - - - - - - - - -
0.01 - 0.40 - 590.67 656.86 744.15 664.27 - 49 23 58 1390.41 - 1.00 - - - 874.73 719.01 - - - 25 441.01 - 2.00 - - - - - - - - - -2.01 - 4.00 - - - - - - - - - -
4.01 + - - - - - - - - - -
self-employed
in non- agriculture
all sizes - 574.72 648.82 803.14 701.33 - 65 26 113 216< 0.01 - - - - - - - - - -
0.01 - 0.40 - 515.78 - - 547.59 - 32 - - 550.41 - 1.00 - - - - - - - - - -1.01 - 2.00 - - - - - - - - - -2.01 - 4.00 - - - - - - - - - -
4.01 + - - - - - - - - - -
agricultural labour
all sizes - 514.27 - - 541.00 - 34 - - 63< 0.01 - - - - - - - - - -
0.01 - 0.40 - 507.55 622.16 556.75 549.83 - 73 28 81 1870.41 - 1.00 - - - - 593.96 - - - - 301.01 - 2.00 - - - - - - - - - -2.01 - 4.00 - - - - - - - - - -
4.01 + - - - - - - - - - -
other labour
all sizes - 518.57 621.44 578.55 562.23 - 90 32 106 233< 0.01 - - - - - - - - - -
0.01 - 0.40 - 581.45 681.76 665.68 645.83 - 50 36 144 2430.41 - 1.00 708.78 509.69 574.57 681.17 648.14 31 42 22 203 2981.01 - 2.00 - - - 705.96 691.90 - - - 125 1562.01 - 4.00 - - - 685.43 679.67 - - - 52 64
4.01 + - - - 707.59 697.10 - - - 21 22
self-employed
in agriculture
all sizes 641.44 552.36 646.18 685.60 661.23 69 106 64 545 784< 0.01 - - - 1304.02 1162.55 - - - 33 41
0.01 - 0.40 - 871.45 790.10 953.52 893.93 - 44 38 122 2060.41 - 1.00 - - - 749.50 771.33 - - - 32 531.01 - 2.00 - - - - 817.13 - - - - 212.01 - 4.00 - - - - - - - - - -
4.01 + - - - - - - - - - -
other households
all sizes - 840.96 794.98 918.61 877.12 - 65 51 217 337< 0.01 - - - 1100.57 933.96 - - - 44 61
0.01 - 0.40 677.24 593.17 695.10 713.89 670.80 32 248 130 419 8300.41 - 1.00 673.55 563.63 618.84 702.53 666.51 37 78 34 280 4291.01 - 2.00 - - - 720.92 701.44 - - - 163 2002.01 - 4.00 - - - 731.48 728.77 - - - 69 88
4.01 + - - - 734.16 723.91 - - - 25 26
all households
all sizes 659.11 588.82 683.26 722.94 684.29 95 360 178 1000 1634 (Contd.)

Appendix Tables
NSS Report No. 472: Differences in Level of Consumption among Socio-Economic Groups,1999-2000 A-94
Table 4R : Average MPCE of rural households classified by household type, social group and area of land possessed and by State/UT Rural
average MPCE (Rs) of households of number of sample households of social group social group household
type
size of land
possessed (hectares) ST SC OBC others all ST SC OBC others all
(1) (2) (3) (4) (5) (6) (7) (8) (9) (10) (11) (12)
Jammu & Kashmir < 0.01 - - - - - - - - - -
0.01 - 0.40 - - 718.92 618.58 626.22 - - 23 76 1180.41 - 1.00 - - - 793.26 771.42 - - - 62 741.01 - 2.00 - - - - - - - - - -2.01 - 4.00 - - - - - - - - - -
4.01 + - - - - - - - - - -
self-employed
in non- agriculture
all sizes - 500.02 700.01 696.52 683.61 - 22 34 153 209< 0.01 - - - - - - - - - -
0.01 - 0.40 - - 504.69 603.29 565.82 - - 25 43 860.41 - 1.00 - - - - - - - - - -1.01 - 2.00 - - - - - - - - - -2.01 - 4.00 - - - - - - - - - -
4.01 + - - - - - - - - - -
agricultural labour
all sizes - - 508.42 631.72 595.33 - - 26 54 100< 0.01 - - - - - - - - - -
0.01 - 0.40 - - - 558.90 543.48 - - - 34 710.41 - 1.00 - - - - - - - - - -1.01 - 2.00 - - - - - - - - - -2.01 - 4.00 - - - - - - - - - -
4.01 + - - - - - - - - - -
other labour
all sizes - 443.38 585.56 568.97 545.32 - 24 20 42 87< 0.01 - - - - - - - - - -
0.01 - 0.40 - - - 675.36 674.60 - - - 129 1530.41 - 1.00 - 568.55 649.63 712.32 696.85 - 29 51 299 3821.01 - 2.00 - - - 662.56 654.80 - - - 123 1542.01 - 4.00 - - - 661.87 657.10 - - - 51 61
4.01 + - - - - - - - - - -
self-employed
in agriculture
all sizes - 582.56 655.08 664.96 659.55 - 59 76 613 764< 0.01 - - - - - - - - - -
0.01 - 0.40 - 747.07 - 850.10 832.75 - 22 - 128 1690.41 - 1.00 - - - 737.45 716.08 - - - 80 931.01 - 2.00 - - - 782.27 804.50 - - - 24 272.01 - 4.00 - - - - - - - - - -
4.01 + - - - - - - - - - -
other households
all sizes - 729.78 795.85 804.75 791.73 - 29 27 251 311< 0.01 - - - - - - - - - -
0.01 - 0.40 - 568.87 647.13 705.13 681.38 - 91 86 410 5970.41 - 1.00 - 561.64 667.35 724.61 702.09 - 44 66 457 5731.01 - 2.00 - - - 674.09 671.04 - - - 159 1942.01 - 4.00 - - - 693.05 684.22 - - - 62 74
4.01 + - - - - - - - - - -
all households
all sizes 529.40 574.75 658.93 691.11 676.99 20 153 183 1113 1472 (Contd.)
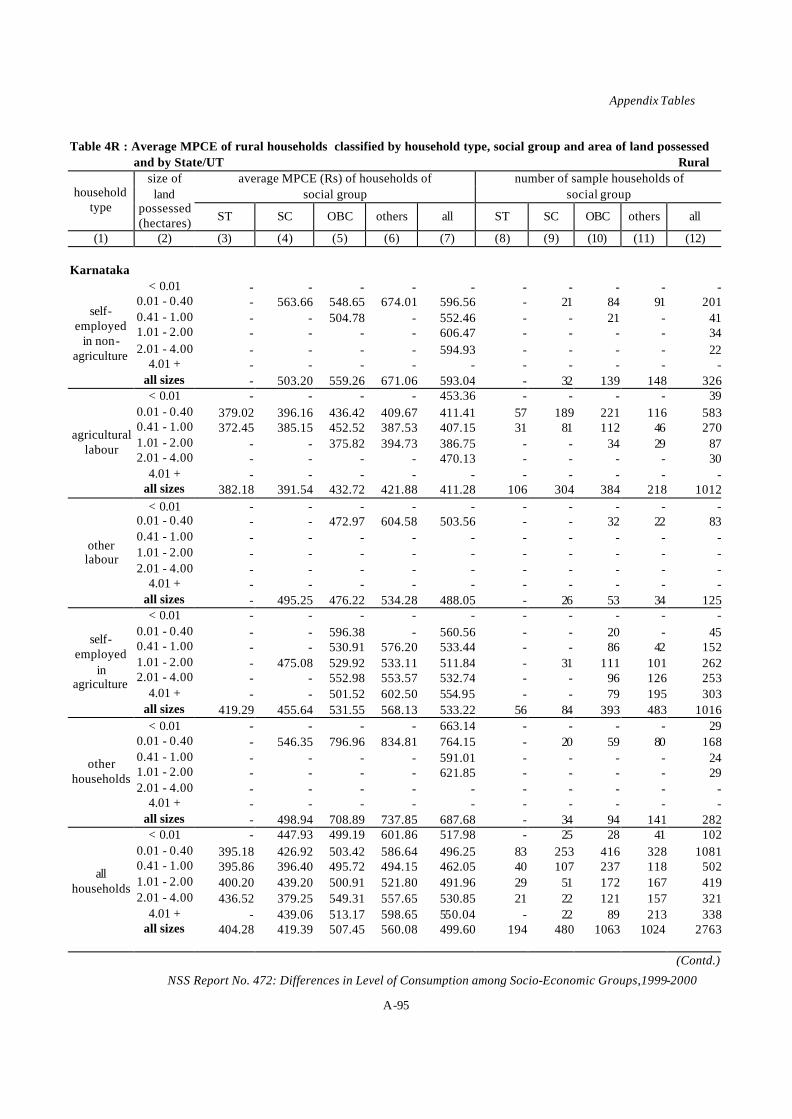
Appendix Tables
NSS Report No. 472: Differences in Level of Consumption among Socio-Economic Groups,1999-2000 A-95
Table 4R : Average MPCE of rural households classified by household type, social group and area of land possessed and by State/UT Rural
average MPCE (Rs) of households of number of sample households of social group social group household
type
size of land
possessed (hectares) ST SC OBC others all ST SC OBC others all
(1) (2) (3) (4) (5) (6) (7) (8) (9) (10) (11) (12)
Karnataka < 0.01 - - - - - - - - - -
0.01 - 0.40 - 563.66 548.65 674.01 596.56 - 21 84 91 2010.41 - 1.00 - - 504.78 - 552.46 - - 21 - 411.01 - 2.00 - - - - 606.47 - - - - 342.01 - 4.00 - - - - 594.93 - - - - 22
4.01 + - - - - - - - - - -
self-employed
in non- agriculture
all sizes - 503.20 559.26 671.06 593.04 - 32 139 148 326< 0.01 - - - - 453.36 - - - - 39
0.01 - 0.40 379.02 396.16 436.42 409.67 411.41 57 189 221 116 5830.41 - 1.00 372.45 385.15 452.52 387.53 407.15 31 81 112 46 2701.01 - 2.00 - - 375.82 394.73 386.75 - - 34 29 872.01 - 4.00 - - - - 470.13 - - - - 30
4.01 + - - - - - - - - - -
agricultural labour
all sizes 382.18 391.54 432.72 421.88 411.28 106 304 384 218 1012< 0.01 - - - - - - - - - -
0.01 - 0.40 - - 472.97 604.58 503.56 - - 32 22 830.41 - 1.00 - - - - - - - - - -1.01 - 2.00 - - - - - - - - - -2.01 - 4.00 - - - - - - - - - -
4.01 + - - - - - - - - - -
other labour
all sizes - 495.25 476.22 534.28 488.05 - 26 53 34 125< 0.01 - - - - - - - - - -
0.01 - 0.40 - - 596.38 - 560.56 - - 20 - 450.41 - 1.00 - - 530.91 576.20 533.44 - - 86 42 1521.01 - 2.00 - 475.08 529.92 533.11 511.84 - 31 111 101 2622.01 - 4.00 - - 552.98 553.57 532.74 - - 96 126 253
4.01 + - - 501.52 602.50 554.95 - - 79 195 303
self-employed
in agriculture
all sizes 419.29 455.64 531.55 568.13 533.22 56 84 393 483 1016< 0.01 - - - - 663.14 - - - - 29
0.01 - 0.40 - 546.35 796.96 834.81 764.15 - 20 59 80 1680.41 - 1.00 - - - - 591.01 - - - - 241.01 - 2.00 - - - - 621.85 - - - - 292.01 - 4.00 - - - - - - - - - -
4.01 + - - - - - - - - - -
other households
all sizes - 498.94 708.89 737.85 687.68 - 34 94 141 282< 0.01 - 447.93 499.19 601.86 517.98 - 25 28 41 102
0.01 - 0.40 395.18 426.92 503.42 586.64 496.25 83 253 416 328 10810.41 - 1.00 395.86 396.40 495.72 494.15 462.05 40 107 237 118 5021.01 - 2.00 400.20 439.20 500.91 521.80 491.96 29 51 172 167 4192.01 - 4.00 436.52 379.25 549.31 557.65 530.85 21 22 121 157 321
4.01 + - 439.06 513.17 598.65 550.04 - 22 89 213 338
all households
all sizes 404.28 419.39 507.45 560.08 499.60 194 480 1063 1024 2763 (Contd.)

Appendix Tables
NSS Report No. 472: Differences in Level of Consumption among Socio-Economic Groups,1999-2000 A-96
Table 4R : Average MPCE of rural households classified by household type, social group and area of land possessed and by State/UT Rural
average MPCE (Rs) of households of number of sample households of social group social group household
type
size of land
possessed (hectares) ST SC OBC others all ST SC OBC others all
(1) (2) (3) (4) (5) (6) (7) (8) (9) (10) (11) (12)
Kerala < 0.01 - - - - - - - - - -
0.01 - 0.40 - - 757.02 806.48 771.50 - - 238 126 3830.41 - 1.00 - - 824.57 1048.12 934.62 - - 33 35 681.01 - 2.00 - - - - 910.54 - - - - 212.01 - 4.00 - - - - - - - - - -
4.01 + - - - - - - - - - -
self-employed
in non- agriculture
all sizes - - 780.60 839.97 799.56 - - 291 177 487< 0.01 - - - - - - - - - -
0.01 - 0.40 - 559.31 572.36 556.98 561.79 - 111 224 115 4670.41 - 1.00 - - - - 635.83 - - - - 271.01 - 2.00 - - - - - - - - - -2.01 - 4.00 - - - - - - - - - -
4.01 + - - - - - - - - - -
agricultural labour
all sizes 494.18 568.01 576.66 568.64 569.50 21 117 241 127 506< 0.01 - - - - - - - - - -
0.01 - 0.40 - 616.97 613.24 711.24 645.49 - 54 313 155 5260.41 - 1.00 - - - - - - - - - -1.01 - 2.00 - - - - - - - - - -2.01 - 4.00 - - - - - - - - - -
4.01 + - - - - - - - - - -
other labour
all sizes - 618.58 623.16 724.87 655.77 - 55 332 169 560< 0.01 - - - - - - - - - -
0.01 - 0.40 - - 888.73 899.59 878.55 - - 155 116 2790.41 - 1.00 - - 983.18 989.59 966.50 - - 64 84 1561.01 - 2.00 - - 886.25 938.02 907.81 - - 39 67 1112.01 - 4.00 - - - 1073.42 1071.62 - - - 32 43
4.01 + - - - - - - - - - -
self-employed
in agriculture
all sizes - - 920.96 958.19 925.46 - - 271 309 602< 0.01 - - - - 1490.90 - - - - 22
0.01 - 0.40 - - 799.84 1135.37 975.98 - - 153 172 3390.41 - 1.00 - - - 1219.31 1075.79 - - - 29 481.01 - 2.00 - - - - 1195.24 - - - - 232.01 - 4.00 - - - - - - - - - -
4.01 + - - - - - - - - - -
other households
all sizes - - 846.22 1166.59 1016.30 - - 190 234 446< 0.01 - - 973.19 - 1100.90 - - 26 - 46
0.01 - 0.40 595.48 591.32 689.10 817.53 720.14 29 199 1083 684 19960.41 - 1.00 - - 869.40 1017.47 928.22 - - 135 164 3181.01 - 2.00 - - 973.96 925.54 927.45 - - 60 96 1642.01 - 4.00 - - - 1039.16 1057.75 - - - 43 62
4.01 + - - - - - - - - - -
all households
all sizes 674.11 597.03 724.28 870.77 765.57 46 215 1326 1016 2604 (Contd.)

Appendix Tables
NSS Report No. 472: Differences in Level of Consumption among Socio-Economic Groups,1999-2000 A-97
Table 4R : Average MPCE of rural households classified by household type, social group and area of land possessed and by State/UT Rural
average MPCE (Rs) of households of number of sample households of social group social group household
type
size of land
possessed (hectares) ST SC OBC others all ST SC OBC others all
(1) (2) (3) (4) (5) (6) (7) (8) (9) (10) (11) (12)
Madhya Pradesh < 0.01 - - 496.95 - 445.69 - - 29 - 61
0.01 - 0.40 336.02 358.16 418.72 571.56 439.30 23 27 90 59 1990.41 - 1.00 - - 364.77 - 410.43 - - 34 - 741.01 - 2.00 - - 449.96 - 407.80 - - 27 - 452.01 - 4.00 - - - - 730.98 - - - - 24
4.01 + - - - - - - - - - -
self-employed
in non- agriculture
all sizes 329.78 390.05 435.64 589.30 448.50 50 58 196 114 418< 0.01 314.95 356.01 349.96 - 341.35 55 52 52 - 164
0.01 - 0.40 297.80 349.72 320.27 370.52 322.91 268 198 307 54 8270.41 - 1.00 308.44 330.04 341.49 443.83 331.38 210 106 204 28 5481.01 - 2.00 329.27 349.68 328.88 - 333.23 78 36 76 - 1982.01 - 4.00 - - 356.94 - 328.25 - - 21 - 41
4.01 + - - - - - - - - - -
agricultural labour
all sizes 306.01 344.97 331.25 393.75 328.56 627 398 662 100 1788< 0.01 - - - - 413.31 - - - - 28
0.01 - 0.40 280.96 - 309.27 - 366.79 35 - 31 - 900.41 - 1.00 284.47 - - - 318.47 28 - - - 461.01 - 2.00 - - - - - - - - - -2.01 - 4.00 - - - - - - - - - -
4.01 + - - - - - - - - - -
other labour
all sizes 292.79 331.27 335.24 620.58 351.86 80 22 62 22 186< 0.01 - - - - - - - - - -
0.01 - 0.40 - - 448.20 - 458.58 - - 20 - 380.41 - 1.00 304.50 425.00 439.91 475.23 410.40 63 45 99 46 2531.01 - 2.00 349.94 393.71 418.30 469.69 404.36 168 79 279 94 6202.01 - 4.00 328.73 382.19 442.14 484.52 410.56 217 66 311 140 734
4.01 + 372.97 473.81 561.04 597.39 532.95 124 42 368 213 748
self-employed
in agriculture
all sizes 339.46 411.13 465.51 518.76 438.90 576 239 1082 504 2402< 0.01 - - 598.55 589.67 544.64 - - 32 23 86
0.01 - 0.40 546.35 413.34 562.97 498.31 504.64 30 30 49 43 1520.41 - 1.00 - - - - 561.40 - - - - 311.01 - 2.00 - - - - 504.94 - - - - 352.01 - 4.00 - - - - 455.63 - - - - 30
4.01 + - - - - - - - - - -
other households
all sizes 461.40 456.84 547.67 527.23 514.01 67 55 131 95 348< 0.01 332.12 377.32 429.79 541.57 402.42 84 88 131 46 349
0.01 - 0.40 315.46 355.10 359.75 501.11 371.37 358 270 498 181 13070.41 - 1.00 309.92 369.04 372.84 489.48 363.11 319 170 361 102 9521.01 - 2.00 338.56 383.95 402.29 451.54 387.05 264 127 405 118 9142.01 - 4.00 322.75 383.04 442.60 510.14 412.67 245 75 354 160 835
4.01 + 365.51 473.81 559.97 601.86 531.21 130 42 385 229 787
all households
all sizes 325.38 374.74 417.54 516.20 401.33 1400 772 2134 836 5144 (Contd.)

Appendix Tables
NSS Report No. 472: Differences in Level of Consumption among Socio-Economic Groups,1999-2000 A-98
Table 4R : Average MPCE of rural households classified by household type, social group and area of land possessed and by State/UT Rural
average MPCE (Rs) of households of number of sample households of social group social group household
type
size of land
possessed (hectares) ST SC OBC others all ST SC OBC others all
(1) (2) (3) (4) (5) (6) (7) (8) (9) (10) (11) (12)
Maharashtra < 0.01 - - - 786.78 668.58 - - - 21 44
0.01 - 0.40 - 583.41 516.59 622.89 568.67 - 35 63 109 2220.41 - 1.00 - - 531.56 589.89 569.70 - - 23 27 611.01 - 2.00 - - - 677.50 532.47 - - - 27 492.01 - 4.00 - - - - 600.29 - - - - 28
4.01 + - - - - 809.74 - - - - 20
self-employed
in non- agriculture
all sizes 492.14 551.60 522.94 641.35 583.74 32 54 122 215 424< 0.01 377.53 367.15 418.05 399.30 393.24 37 37 56 48 178
0.01 - 0.40 344.36 367.43 377.67 453.65 386.57 217 179 204 243 8430.41 - 1.00 326.57 390.67 406.58 440.28 397.90 67 35 108 94 3051.01 - 2.00 350.89 371.49 407.11 407.91 390.92 49 25 75 60 2092.01 - 4.00 - - - 461.84 402.74 - - - 28 70
4.01 + - - - - - - - - - -
agricultural labour
all sizes 344.99 371.09 395.44 440.49 391.15 384 289 462 474 1610< 0.01 - - - 884.85 635.09 - - - 23 53
0.01 - 0.40 403.99 - 643.28 596.05 556.73 22 - 38 60 1390.41 - 1.00 - - - - 474.55 - - - - 221.01 - 2.00 - - - - - - - - - -2.01 - 4.00 - - - - - - - - - -
4.01 + - - - - - - - - - -
other labour
all sizes 390.51 438.79 643.35 663.36 581.06 35 33 61 97 226< 0.01 - - - - - - - - - -
0.01 - 0.40 - - 371.80 611.12 517.21 - - 26 44 850.41 - 1.00 - - 438.04 553.83 517.22 - - 44 114 1811.01 - 2.00 453.41 - 508.35 554.03 524.61 37 - 93 150 2932.01 - 4.00 391.19 - 447.90 554.90 488.94 67 - 107 176 368
4.01 + 463.89 - 538.75 617.01 561.20 41 - 138 193 390
self-employed
in agriculture
all sizes 436.67 468.51 483.30 570.52 520.86 166 67 408 678 1319< 0.01 448.88 - 821.90 801.74 747.85 29 - 29 41 112
0.01 - 0.40 726.95 668.25 802.68 699.23 725.06 20 25 67 146 2580.41 - 1.00 - - - 774.08 617.03 - - - 32 601.01 - 2.00 - - - 580.36 615.39 - - - 23 442.01 - 4.00 - - - 774.73 732.40 - - - 28 39
4.01 + - - - - 708.72 - - - - 27
other households
all sizes 531.31 627.62 763.12 723.65 707.39 59 54 144 283 540< 0.01 407.60 437.49 568.75 711.62 565.11 77 65 113 134 390
0.01 - 0.40 371.14 427.79 483.31 565.14 481.66 280 267 398 602 15470.41 - 1.00 370.33 428.01 440.23 531.33 466.37 96 63 192 277 6291.01 - 2.00 386.98 409.08 489.34 525.57 484.42 94 44 203 261 6032.01 - 4.00 386.47 429.95 448.02 562.02 492.66 83 37 137 251 508
4.01 + 464.36 479.80 551.36 629.04 570.81 46 21 155 222 444
all households
all sizes 384.33 429.45 489.74 569.99 496.62 676 497 1198 1747 4121 (Contd.)

Appendix Tables
NSS Report No. 472: Differences in Level of Consumption among Socio-Economic Groups,1999-2000 A-99
Table 4R : Average MPCE of rural households classified by household type, social group and area of land possessed and by State/UT Rural
average MPCE (Rs) of households of number of sample households of social group social group household
type
size of land
possessed (hectares) ST SC OBC others all ST SC OBC others all
(1) (2) (3) (4) (5) (6) (7) (8) (9) (10) (11) (12)
Manipur < 0.01 - - - - - - - - - -
0.01 - 0.40 - - - 521.41 577.40 - - - 20 440.41 - 1.00 - - - - - - - - - -1.01 - 2.00 - - - - - - - - - -2.01 - 4.00 - - - - - - - - - -
4.01 + - - - - - - - - - -
self-employed
in non- agriculture
all sizes - - 643.58 541.29 582.20 - - 25 30 68< 0.01 - - - - - - - - - -
0.01 - 0.40 - - - - 442.30 - - - - 410.41 - 1.00 - - - - - - - - - -1.01 - 2.00 - - - - - - - - - -2.01 - 4.00 - - - - - - - - - -
4.01 + - - - - - - - - - -
agricultural labour
all sizes - - - 472.50 441.32 - - - 21 44< 0.01 - - - - - - - - - -
0.01 - 0.40 - - - - - - - - - -0.41 - 1.00 - - - - - - - - - -1.01 - 2.00 - - - - - - - - - -2.01 - 4.00 - - - - - - - - - -
4.01 + - - - - - - - - - -
other labour
all sizes - - - - 505.25 - - - - 20< 0.01 - - - - - - - - - -
0.01 - 0.40 623.13 - - 482.62 589.27 75 - - 23 1060.41 - 1.00 519.91 - - 453.81 502.10 139 - - 40 1981.01 - 2.00 422.40 - - 435.04 463.73 70 - - 22 1162.01 - 4.00 - - - - 483.30 - - - - 35
4.01 + - - - - - - - - - -
self-employed
in agriculture
all sizes 515.26 562.66 578.10 459.08 508.61 302 25 35 95 458< 0.01 - - - - - - - - - -
0.01 - 0.40 - - 660.15 580.08 621.33 - - 33 29 740.41 - 1.00 - - - - 616.40 - - - - 261.01 - 2.00 - - - - 677.51 - - - - 262.01 - 4.00 - - - - - - - - - -
4.01 + - - - - - - - - - -
other households
all sizes 651.74 - 690.21 566.98 626.67 28 - 51 63 146< 0.01 - - - - - - - - - -
0.01 - 0.40 596.24 - 612.74 519.58 571.29 97 - 80 97 2820.41 - 1.00 523.38 - 588.63 504.76 521.72 147 - 24 61 2381.01 - 2.00 441.07 - 706.07 460.88 505.43 80 - 20 32 1482.01 - 4.00 475.23 - - - 501.32 23 - - - 53
4.01 + - - - - - - - - - -
all households
all sizes 522.87 560.15 625.44 502.99 537.46 352 36 132 215 738 (Contd.)

Appendix Tables
NSS Report No. 472: Differences in Level of Consumption among Socio-Economic Groups,1999-2000 A-100
Table 4R : Average MPCE of rural households classified by household type, social group and area of land possessed and by State/UT Rural
average MPCE (Rs) of households of number of sample households of social group social group household
type
size of land
possessed (hectares) ST SC OBC others all ST SC OBC others all
(1) (2) (3) (4) (5) (6) (7) (8) (9) (10) (11) (12)
Meghalaya < 0.01 - - - - - - - - - -
0.01 - 0.40 607.99 - - - 605.94 23 - - - 270.41 - 1.00 - - - - - - - - - -1.01 - 2.00 - - - - - - - - - -2.01 - 4.00 - - - - - - - - - -
4.01 + - - - - - - - - - -
self-employed
in non- agriculture
all sizes 636.91 - - - 632.40 59 - - - 67< 0.01 - - - - - - - - - -
0.01 - 0.40 460.15 - - - 452.77 58 - - - 660.41 - 1.00 607.28 - - - 607.53 27 - - - 281.01 - 2.00 - - - - - - - - - -2.01 - 4.00 - - - - - - - - - -
4.01 + - - - - - - - - - -
agricultural labour
all sizes 512.78 - - - 500.04 92 - - - 103< 0.01 - - - - - - - - - -
0.01 - 0.40 - - - - - - - - - -0.41 - 1.00 - - - - - - - - - -1.01 - 2.00 - - - - - - - - - -2.01 - 4.00 - - - - - - - - - -
4.01 + - - - - - - - - - -
other labour
all sizes 539.20 - - - 529.84 25 - - - 27< 0.01 - - - - - - - - - -
0.01 - 0.40 539.88 - - - 535.77 54 - - - 580.41 - 1.00 509.00 - - - 511.34 250 - - - 2561.01 - 2.00 547.82 - - - 549.69 182 - - - 1942.01 - 4.00 585.38 - - - 586.09 104 - - - 107
4.01 + - - - - - - - - - -
self-employed
in agriculture
all sizes 542.55 - - 582.57 543.91 604 - - 22 631< 0.01 - - - - - - - - - -
0.01 - 0.40 634.83 - - - 632.86 26 - - - 270.41 - 1.00 603.21 - - - 603.83 20 - - - 211.01 - 2.00 748.39 - - - 748.39 23 - - - 232.01 - 4.00 - - - - - - - - - -
4.01 + - - - - - - - - - -
other households
all sizes 681.39 - - - 689.79 93 - - - 103< 0.01 655.85 - - - 671.50 29 - - - 39
0.01 - 0.40 552.37 - - - 543.05 172 - - - 1910.41 - 1.00 524.76 - - - 527.24 315 - - - 3241.01 - 2.00 581.57 - - - 581.41 222 - - - 2352.01 - 4.00 595.37 - - - 595.84 121 - - - 125
4.01 + - - - - - - - - - -
all households
all sizes 563.36 - - 575.20 563.24 873 - - 44 933 (Contd.)

Appendix Tables
NSS Report No. 472: Differences in Level of Consumption among Socio-Economic Groups,1999-2000 A-101
Table 4R : Average MPCE of rural households classified by household type, social group and area of land possessed and by State/UT Rural
average MPCE (Rs) of households of number of sample households of social group social group household
type
size of land
possessed (hectares) ST SC OBC others all ST SC OBC others all
(1) (2) (3) (4) (5) (6) (7) (8) (9) (10) (11) (12)
Mizoram < 0.01 - - - - - - - - - -
0.01 - 0.40 - - - - - - - - - -0.41 - 1.00 - - - - - - - - - -1.01 - 2.00 - - - - - - - - - -2.01 - 4.00 - - - - - - - - - -
4.01 + - - - - - - - - - -
self-employed
in non- agriculture
all sizes 1002.09 - - - 961.68 41 - - - 44< 0.01 - - - - - - - - - -
0.01 - 0.40 - - - - - - - - - -0.41 - 1.00 - - - - - - - - - -1.01 - 2.00 - - - - - - - - - -2.01 - 4.00 - - - - - - - - - -
4.01 + - - - - - - - - - -
agricultural labour
all sizes - - - - - - - - - -< 0.01 - - - - - - - - - -
0.01 - 0.40 - - - - - - - - - -0.41 - 1.00 - - - - - - - - - -1.01 - 2.00 - - - - - - - - - -2.01 - 4.00 - - - - - - - - - -
4.01 + - - - - - - - - - -
other labour
all sizes - - - - - - - - - -< 0.01 - - - - - - - - - -
0.01 - 0.40 - - - - - - - - - -0.41 - 1.00 662.22 - - - 659.23 135 - - - 1431.01 - 2.00 603.81 - - - 600.63 78 - - - 832.01 - 4.00 693.64 - - - 693.64 32 - - - 32
4.01 + - - - - - - - - - -
self-employed
in agriculture
all sizes 644.76 - - - 641.33 262 - - - 276< 0.01 - - - - - - - - - -
0.01 - 0.40 963.00 - - - 963.00 29 - - - 290.41 - 1.00 817.62 - - - 825.80 21 - - - 221.01 - 2.00 - - - - - - - - - -2.01 - 4.00 - - - - - - - - - -
4.01 + - - - - - - - - - -
other households
all sizes 890.89 - - - 892.55 75 - - - 79< 0.01 - - - - - - - - - -
0.01 - 0.40 867.24 - - - 851.87 80 - - - 850.41 - 1.00 701.41 - - - 698.44 177 - - - 1861.01 - 2.00 669.25 - - - 661.98 93 - - - 992.01 - 4.00 743.69 - - - 743.69 47 - - - 47
4.01 + - - - - - - - - - -
all households
all sizes 726.69 - - - 721.54 404 - - - 428 (Contd.)

Appendix Tables
NSS Report No. 472: Differences in Level of Consumption among Socio-Economic Groups,1999-2000 A-102
Table 4R : Average MPCE of rural households classified by household type, social group and area of land possessed and by State/UT Rural
average MPCE (Rs) of households of number of sample households of social group social group household
type
size of land
possessed (hectares) ST SC OBC others all ST SC OBC others all
(1) (2) (3) (4) (5) (6) (7) (8) (9) (10) (11) (12)
Nagaland < 0.01 - - - - - - - - - -
0.01 - 0.40 - - - - - - - - - -0.41 - 1.00 - - - - - - - - - -1.01 - 2.00 - - - - - - - - - -2.01 - 4.00 - - - - - - - - - -
4.01 + - - - - - - - - - -
self-employed
in non- agriculture
all sizes 1301.36 - - - 1223.65 31 - - - 42< 0.01 - - - - - - - - - -
0.01 - 0.40 - - - - - - - - - -0.41 - 1.00 - - - - - - - - - -1.01 - 2.00 - - - - - - - - - -2.01 - 4.00 - - - - - - - - - -
4.01 + - - - - - - - - - -
agricultural labour
all sizes - - - - - - - - - -< 0.01 - - - - - - - - - -
0.01 - 0.40 - - - - - - - - - -0.41 - 1.00 - - - - - - - - - -1.01 - 2.00 - - - - - - - - - -2.01 - 4.00 - - - - - - - - - -
4.01 + - - - - - - - - - -
other labour
all sizes - - - - - - - - - -< 0.01 - - - - - - - - - -
0.01 - 0.40 - - - - - - - - - -0.41 - 1.00 895.06 - - - 876.31 29 - - - 301.01 - 2.00 880.53 - - - 880.53 80 - - - 802.01 - 4.00 887.11 - - - 888.45 108 - - - 109
4.01 + 924.24 - - - 924.24 35 - - - 35
self-employed
in agriculture
all sizes 892.68 - - - 891.57 259 - - - 262< 0.01 - - - - - - - - - -
0.01 - 0.40 - - - - - - - - - -0.41 - 1.00 - - - - - - - - - -1.01 - 2.00 881.94 - - - 904.86 25 - - - 262.01 - 4.00 1025.18 - - - 1039.67 61 - - - 63
4.01 + 1225.64 - - - 1244.10 25 - - - 26
other households
all sizes 998.26 - - - 1003.77 142 - - - 155< 0.01 - - - - - - - - - -
0.01 - 0.40 926.48 - - - 910.36 31 - - - 510.41 - 1.00 986.13 - - - 963.21 51 - - - 561.01 - 2.00 883.53 - - - 890.05 110 - - - 1122.01 - 4.00 942.65 - - - 946.86 179 - - - 183
4.01 + 1040.90 - - - 1025.48 69 - - - 72
all households
all sizes 943.01 - - - 941.03 445 - - - 480 (Contd.)

Appendix Tables
NSS Report No. 472: Differences in Level of Consumption among Socio-Economic Groups,1999-2000 A-103
Table 4R : Average MPCE of rural households classified by household type, social group and area of land possessed and by State/UT Rural
average MPCE (Rs) of households of number of sample households of social group social group household
type
size of land
possessed (hectares) ST SC OBC others all ST SC OBC others all
(1) (2) (3) (4) (5) (6) (7) (8) (9) (10) (11) (12)
Orissa < 0.01 - - - - - - - - - -
0.01 - 0.40 296.79 374.58 414.80 412.87 393.09 31 96 125 78 3300.41 - 1.00 - - 428.80 - 415.91 - - 34 - 681.01 - 2.00 - - - - 512.78 - - - - 262.01 - 4.00 - - - - - - - - - -
4.01 + - - - - - - - - - -
self-employed
in non- agriculture
all sizes 284.12 393.77 425.41 431.78 402.86 46 116 175 100 438< 0.01 - - - - - - - - - -
0.01 - 0.40 267.52 318.49 309.31 370.15 305.94 288 297 264 151 10000.41 - 1.00 268.38 279.58 345.65 474.77 308.94 128 56 81 30 2951.01 - 2.00 287.95 - - - 311.00 24 - - - 412.01 - 4.00 - - - - - - - - - -
4.01 + - - - - - - - - - -
agricultural labour
all sizes 267.74 312.18 317.81 395.20 306.83 449 360 363 184 1356< 0.01 - - - - - - - - - -
0.01 - 0.40 - 342.68 399.41 - 376.61 - 22 27 - 840.41 - 1.00 - - - - 327.04 - - - - 281.01 - 2.00 - - - - - - - - - -2.01 - 4.00 - - - - - - - - - -
4.01 + - - - - - - - - - -
other labour
all sizes 277.90 307.14 422.41 473.04 369.94 29 31 36 22 118< 0.01 - - - - - - - - - -
0.01 - 0.40 - 410.12 403.62 458.57 413.94 - 24 26 25 830.41 - 1.00 304.50 338.14 375.72 450.59 374.86 93 63 100 115 3711.01 - 2.00 286.97 389.18 455.66 474.84 392.19 110 46 97 70 3232.01 - 4.00 279.34 - 395.06 486.56 393.55 40 - 64 52 170
4.01 + 330.99 - 539.31 605.98 483.86 21 - 37 33 97
self-employed
in agriculture
all sizes 294.02 369.59 416.29 474.71 393.02 272 152 325 296 1046< 0.01 - - - - 902.35 - - - - 36
0.01 - 0.40 413.56 480.03 535.61 610.80 543.26 34 61 101 132 3280.41 - 1.00 - - 499.60 - 538.69 - - 33 - 711.01 - 2.00 - - - - 545.65 - - - - 382.01 - 4.00 - - - - 389.05 - - - - 28
4.01 + - - - - - - - - - -
other households
all sizes 404.31 501.60 520.16 620.30 538.35 64 88 167 192 512< 0.01 - - - 973.99 600.44 - - - 20 56
0.01 - 0.40 278.56 348.64 371.56 457.41 360.56 380 500 543 402 18250.41 - 1.00 284.76 321.06 388.26 477.35 361.04 248 150 257 180 8351.01 - 2.00 294.87 395.30 467.18 478.70 402.50 143 60 134 93 4302.01 - 4.00 271.30 - 395.94 493.08 390.17 46 - 85 61 208
4.01 + 322.41 - 496.05 629.65 453.46 33 - 42 39 123
all households
all sizes 284.55 351.10 394.96 480.04 372.95 861 747 1069 795 3477 (Contd.)

Appendix Tables
NSS Report No. 472: Differences in Level of Consumption among Socio-Economic Groups,1999-2000 A-104
Table 4R : Average MPCE of rural households classified by household type, social group and area of land possessed and by State/UT Rural
average MPCE (Rs) of households of number of sample households of social group social group household
type
size of land
possessed (hectares) ST SC OBC others all ST SC OBC others all
(1) (2) (3) (4) (5) (6) (7) (8) (9) (10) (11) (12)
Punjab < 0.01 - 639.21 - - 700.37 - 23 - - 43
0.01 - 0.40 - 585.52 685.59 766.05 658.80 - 88 58 86 2380.41 - 1.00 - - - - - - - - - -1.01 - 2.00 - - - - - - - - - -2.01 - 4.00 - - - - - - - - - -
4.01 + - - - - - - - - - -
self-employed
in non- agriculture
all sizes - 605.48 698.59 796.33 687.20 - 114 68 125 316< 0.01 - 502.59 - - 517.53 - 26 - - 50
0.01 - 0.40 - 521.52 541.55 629.06 536.74 - 337 66 55 4650.41 - 1.00 - - - - - - - - - -1.01 - 2.00 - - - - - - - - - -2.01 - 4.00 - - - - - - - - - -
4.01 + - - - - - - - - - -
agricultural labour
all sizes - 519.51 553.74 625.68 536.98 - 370 82 70 530< 0.01 - 636.45 - - 611.27 - 26 - - 36
0.01 - 0.40 - 604.10 - - 621.13 - 79 - - 1140.41 - 1.00 - - - - - - - - - -1.01 - 2.00 - - - - - - - - - -2.01 - 4.00 - - - - - - - - - -
4.01 + - - - - - - - - - -
other labour
all sizes - 610.97 573.74 724.85 622.52 - 106 23 24 154< 0.01 - - - - - - - - - -
0.01 - 0.40 - - - - 739.96 - - - - 390.41 - 1.00 - - - 838.40 792.82 - - - 102 1221.01 - 2.00 - - - 837.16 814.46 - - - 126 1552.01 - 4.00 - - - 1032.89 993.11 - - - 173 195
4.01 + - - - 1022.61 1005.66 - - - 239 259
self-employed
in agriculture
all sizes - 709.31 671.73 947.66 908.86 - 36 74 661 774< 0.01 - - - 892.77 771.58 - - - 20 43
0.01 - 0.40 - 726.38 817.19 996.99 831.88 - 90 33 104 2340.41 - 1.00 - - - 1152.57 1079.95 - - - 30 361.01 - 2.00 - - - - 792.31 - - - - 222.01 - 4.00 - - - 805.51 809.44 - - - 22 24
4.01 + - - - - - - - - - -
other households
all sizes - 706.80 797.32 985.23 854.13 - 115 44 212 378< 0.01 - 604.65 663.94 798.70 660.82 - 94 26 53 176
0.01 - 0.40 511.71 573.11 633.31 797.16 628.04 20 607 181 282 10900.41 - 1.00 - - 664.85 898.86 827.51 - - 23 144 1881.01 - 2.00 - - 676.09 847.55 811.48 - - 25 148 1872.01 - 4.00 - - - 1000.41 971.14 - - - 204 229
4.01 + - - - 1017.68 1004.89 - - - 261 282
all households
all sizes 548.08 581.66 652.45 909.19 742.29 26 741 291 1092 2152 (Contd.)

Appendix Tables
NSS Report No. 472: Differences in Level of Consumption among Socio-Economic Groups,1999-2000 A-105
Table 4R : Average MPCE of rural households classified by household type, social group and area of land possessed and by State/UT Rural
average MPCE (Rs) of households of number of sample households of social group social group household
type
size of land
possessed (hectares) ST SC OBC others all ST SC OBC others all
(1) (2) (3) (4) (5) (6) (7) (8) (9) (10) (11) (12)
Rajasthan < 0.01 - - - - - - - - - -
0.01 - 0.40 - 505.38 560.50 634.53 569.86 - 48 103 96 2560.41 - 1.00 - - 532.40 554.45 525.90 - - 40 30 871.01 - 2.00 - - - 725.02 570.17 - - - 20 572.01 - 4.00 - - - - 554.60 - - - - 29
4.01 + - - - - 684.79 - - - - 29
self-employed
in non- agriculture
all sizes 483.93 509.11 561.70 624.64 565.97 26 85 188 178 477< 0.01 - - - - - - - - - -
0.01 - 0.40 401.40 488.71 529.68 - 478.38 32 74 24 - 1430.41 - 1.00 - - - - 436.73 - - - - 531.01 - 2.00 - - - - 486.01 - - - - 222.01 - 4.00 - - - - - - - - - -
4.01 + - - - - - - - - - -
agricultural labour
all sizes 385.12 481.69 559.23 509.50 470.33 55 113 45 26 239< 0.01 - - - - - - - - - -
0.01 - 0.40 426.80 480.53 467.72 562.79 461.19 103 45 53 30 2310.41 - 1.00 441.73 434.36 503.02 - 474.13 55 23 29 - 1211.01 - 2.00 - - - - 476.48 - - - - 462.01 - 4.00 - - - - 479.34 - - - - 22
4.01 + - - - - - - - - - -
other labour
all sizes 430.68 461.94 483.95 584.15 469.79 169 96 117 60 442< 0.01 - - - - - - - - - -
0.01 - 0.40 456.89 - 486.31 - 511.94 27 - 39 - 910.41 - 1.00 464.79 490.38 511.10 599.42 504.26 95 32 88 47 2621.01 - 2.00 503.42 490.16 536.14 590.83 537.23 87 42 151 93 3732.01 - 4.00 521.32 518.03 572.10 604.55 568.94 51 45 181 121 398
4.01 + 523.69 515.53 601.89 631.40 600.93 40 50 255 271 616
self-employed
in agriculture
all sizes 493.16 504.30 566.11 615.33 561.25 300 180 715 549 1744< 0.01 - - - - - - - - - -
0.01 - 0.40 - 771.73 594.50 674.84 657.15 - 25 36 79 1550.41 - 1.00 - - - 651.34 603.23 - - - 26 541.01 - 2.00 - - - - 562.96 - - - - 362.01 - 4.00 - - - - 796.94 - - - - 35
4.01 + - - - - 750.77 - - - - 32
other households
all sizes 544.54 676.84 625.93 687.97 652.32 35 40 88 164 327< 0.01 - - 581.93 - 493.04 - - 20 - 57
0.01 - 0.40 439.35 514.07 530.73 635.05 527.89 186 202 255 233 8760.41 - 1.00 449.46 458.04 522.14 598.61 501.69 187 88 181 121 5771.01 - 2.00 488.85 491.55 537.11 593.91 533.59 108 79 202 145 5342.01 - 4.00 516.39 528.63 570.73 633.21 576.86 57 66 213 154 490
4.01 + 531.35 518.48 609.17 634.44 605.35 43 64 282 306 695
all households
all sizes 465.89 501.41 560.04 621.50 548.77 585 514 1153 977 3229 (Contd.)
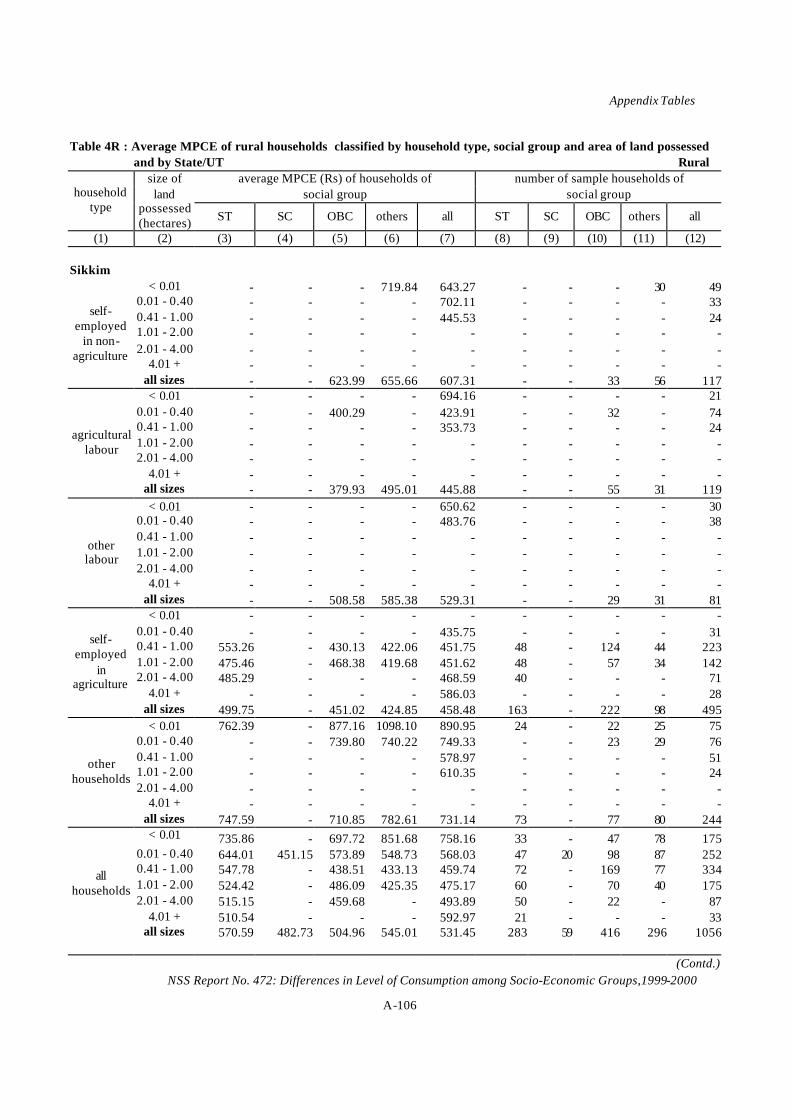
Appendix Tables
NSS Report No. 472: Differences in Level of Consumption among Socio-Economic Groups,1999-2000 A-106
Table 4R : Average MPCE of rural households classified by household type, social group and area of land possessed and by State/UT Rural
average MPCE (Rs) of households of number of sample households of social group social group household
type
size of land
possessed (hectares) ST SC OBC others all ST SC OBC others all
(1) (2) (3) (4) (5) (6) (7) (8) (9) (10) (11) (12)
Sikkim < 0.01 - - - 719.84 643.27 - - - 30 49
0.01 - 0.40 - - - - 702.11 - - - - 330.41 - 1.00 - - - - 445.53 - - - - 241.01 - 2.00 - - - - - - - - - -2.01 - 4.00 - - - - - - - - - -
4.01 + - - - - - - - - - -
self-employed
in non- agriculture
all sizes - - 623.99 655.66 607.31 - - 33 56 117< 0.01 - - - - 694.16 - - - - 21
0.01 - 0.40 - - 400.29 - 423.91 - - 32 - 740.41 - 1.00 - - - - 353.73 - - - - 241.01 - 2.00 - - - - - - - - - -2.01 - 4.00 - - - - - - - - - -
4.01 + - - - - - - - - - -
agricultural labour
all sizes - - 379.93 495.01 445.88 - - 55 31 119< 0.01 - - - - 650.62 - - - - 30
0.01 - 0.40 - - - - 483.76 - - - - 380.41 - 1.00 - - - - - - - - - -1.01 - 2.00 - - - - - - - - - -2.01 - 4.00 - - - - - - - - - -
4.01 + - - - - - - - - - -
other labour
all sizes - - 508.58 585.38 529.31 - - 29 31 81< 0.01 - - - - - - - - - -
0.01 - 0.40 - - - - 435.75 - - - - 310.41 - 1.00 553.26 - 430.13 422.06 451.75 48 - 124 44 2231.01 - 2.00 475.46 - 468.38 419.68 451.62 48 - 57 34 1422.01 - 4.00 485.29 - - - 468.59 40 - - - 71
4.01 + - - - - 586.03 - - - - 28
self-employed
in agriculture
all sizes 499.75 - 451.02 424.85 458.48 163 - 222 98 495< 0.01 762.39 - 877.16 1098.10 890.95 24 - 22 25 75
0.01 - 0.40 - - 739.80 740.22 749.33 - - 23 29 760.41 - 1.00 - - - - 578.97 - - - - 511.01 - 2.00 - - - - 610.35 - - - - 242.01 - 4.00 - - - - - - - - - -
4.01 + - - - - - - - - - -
other households
all sizes 747.59 - 710.85 782.61 731.14 73 - 77 80 244< 0.01 735.86 - 697.72 851.68 758.16 33 - 47 78 175
0.01 - 0.40 644.01 451.15 573.89 548.73 568.03 47 20 98 87 2520.41 - 1.00 547.78 - 438.51 433.13 459.74 72 - 169 77 3341.01 - 2.00 524.42 - 486.09 425.35 475.17 60 - 70 40 1752.01 - 4.00 515.15 - 459.68 - 493.89 50 - 22 - 87
4.01 + 510.54 - - - 592.97 21 - - - 33
all households
all sizes 570.59 482.73 504.96 545.01 531.45 283 59 416 296 1056 (Contd.)

Appendix Tables
NSS Report No. 472: Differences in Level of Consumption among Socio-Economic Groups,1999-2000 A-107
Table 4R : Average MPCE of rural households classified by household type, social group and area of land possessed and by State/UT Rural
average MPCE (Rs) of households of number of sample households of social group social group household
type
size of land
possessed (hectares) ST SC OBC others all ST SC OBC others all
(1) (2) (3) (4) (5) (6) (7) (8) (9) (10) (11) (12)
Tamil Nadu < 0.01 - - 632.70 - 616.02 - - 37 - 52
0.01 - 0.40 - 382.80 552.70 575.55 521.61 - 66 402 27 4980.41 - 1.00 - - 592.33 - 664.10 - - 52 - 591.01 - 2.00 - - 605.87 - 613.30 - - 21 - 232.01 - 4.00 - - - - - - - - - -
4.01 + - - - - - - - - - -
self-employed
in non- agriculture
all sizes - 397.04 569.76 655.67 546.39 - 79 538 35 659< 0.01 - 451.55 470.55 - 456.87 - 79 112 - 195
0.01 - 0.40 - 405.71 480.10 399.92 442.16 - 544 673 22 12570.41 - 1.00 - 342.59 401.36 - 377.69 - 38 117 - 1661.01 - 2.00 - - - - 404.34 - - - - 242.01 - 4.00 - - - - - - - - - -
4.01 + - - - - - - - - - -
agricultural labour
all sizes 331.98 406.59 466.45 406.84 435.72 26 672 919 29 1647< 0.01 - - 602.01 - 700.09 - - 38 - 60
0.01 - 0.40 - 421.96 594.27 573.87 540.28 - 85 234 20 3450.41 - 1.00 - - - - 512.36 - - - - 201.01 - 2.00 - - - - - - - - - -2.01 - 4.00 - - - - - - - - - -
4.01 + - - - - - - - - - -
other labour
all sizes - 465.37 590.92 665.88 558.90 - 108 292 30 436< 0.01 - - - - - - - - - -
0.01 - 0.40 - - 493.81 - 507.98 - - 74 - 900.41 - 1.00 - 458.14 527.33 - 525.83 - 29 279 - 3251.01 - 2.00 - - 553.31 - 531.94 - - 172 - 2112.01 - 4.00 - - 623.86 - 613.75 - - 142 - 168
4.01 + - - 827.30 - 873.14 - - 97 - 113
self-employed
in agriculture
all sizes - 459.36 562.10 695.29 557.65 - 74 766 57 911< 0.01 - - 648.60 - 652.28 - - 28 - 42
0.01 - 0.40 - 589.87 722.78 951.38 705.85 - 67 239 37 3460.41 - 1.00 - - 663.57 - 660.86 - - 49 - 591.01 - 2.00 - - 831.82 - 786.19 - - 25 - 292.01 - 4.00 - - - - 765.53 - - - - 20
4.01 + - - - - - - - - - -
other households
all sizes - 581.02 715.82 881.31 699.83 - 82 370 57 512< 0.01 - 498.63 550.09 - 546.81 - 112 217 - 356
0.01 - 0.40 453.62 420.08 544.62 602.36 501.21 29 774 1624 111 25400.41 - 1.00 - 390.32 503.04 640.85 487.93 - 78 509 35 6301.01 - 2.00 - 389.84 557.40 - 529.80 - 33 238 - 2962.01 - 4.00 - - 632.00 - 622.67 - - 179 - 212
4.01 + - - 834.50 - 844.57 - - 120 - 139
all households
all sizes 384.46 427.01 547.56 651.01 513.75 53 1016 2887 209 4173 (Contd.)

Appendix Tables
NSS Report No. 472: Differences in Level of Consumption among Socio-Economic Groups,1999-2000 A-108
Table 4R : Average MPCE of rural households classified by household type, social group and area of land possessed and by State/UT Rural
average MPCE (Rs) of households of number of sample households of social group social group household
type
size of land
possessed (hectares) ST SC OBC others all ST SC OBC others all
(1) (2) (3) (4) (5) (6) (7) (8) (9) (10) (11) (12)
Tripura < 0.01 - - - - - - - - - -
0.01 - 0.40 - 560.36 516.44 586.57 551.10 - 45 43 51 1470.41 - 1.00 - - - - 616.61 - - - - 321.01 - 2.00 - - - - - - - - - -2.01 - 4.00 - - - - - - - - - -
4.01 + - - - - - - - - - -
self-employed
in non- agriculture
all sizes - 558.75 552.99 610.97 571.79 - 56 56 70 193< 0.01 - - - - - - - - - -
0.01 - 0.40 356.42 390.14 397.91 394.12 387.71 32 45 28 64 1690.41 - 1.00 - - - - - - - - - -1.01 - 2.00 - - - - - - - - - -2.01 - 4.00 - - - - - - - - - -
4.01 + - - - - - - - - - -
agricultural labour
all sizes 350.37 405.24 398.63 406.49 395.68 33 48 30 70 181< 0.01 - - - - - - - - - -
0.01 - 0.40 - 503.95 439.65 424.32 448.30 - 55 49 78 1940.41 - 1.00 - - - - - - - - - -1.01 - 2.00 - - - - - - - - - -2.01 - 4.00 - - - - - - - - - -
4.01 + - - - - - - - - - -
other labour
all sizes - 513.05 438.09 424.63 451.59 - 64 53 82 214< 0.01 - - - - - - - - - -
0.01 - 0.40 - - - 589.91 552.89 - - - 21 410.41 - 1.00 484.10 545.91 582.97 555.66 550.59 25 28 33 66 1531.01 - 2.00 - - - - 572.48 - - - - 392.01 - 4.00 - - - - - - - - - -
4.01 + - - - - - - - - - -
self-employed
in agriculture
all sizes 500.27 542.53 588.00 580.38 561.26 40 45 48 116 251< 0.01 - - - - - - - - - -
0.01 - 0.40 - 657.01 664.86 740.27 685.91 - 37 38 54 1360.41 - 1.00 - - - - 596.11 - - - - 371.01 - 2.00 - - - - - - - - - -2.01 - 4.00 - - - - - - - - - -
4.01 + - - - - - - - - - -
other households
all sizes - 632.34 623.86 713.68 659.75 - 52 49 74 189< 0.01 - - - - - - - - - -
0.01 - 0.40 393.68 520.16 506.17 514.56 505.02 64 190 164 269 6890.41 - 1.00 488.88 554.58 582.55 570.25 560.57 34 58 56 94 2431.01 - 2.00 - - - 594.30 563.14 - - - 25 532.01 - 4.00 - - - - 742.80 - - - - 20
4.01 + - - - - - - - - - -
all households
all sizes 457.43 531.66 529.53 541.96 528.09 112 265 236 414 1031 (Contd.)

Appendix Tables
NSS Report No. 472: Differences in Level of Consumption among Socio-Economic Groups,1999-2000 A-109
Table 4R : Average MPCE of rural households classified by household type, social group and area of land possessed and by State/UT Rural
average MPCE (Rs) of households of number of sample households of social group social group household
type
size of land
possessed (hectares) ST SC OBC others all ST SC OBC others all
(1) (2) (3) (4) (5) (6) (7) (8) (9) (10) (11) (12)
Uttar Pradesh < 0.01 - 471.41 486.19 530.34 490.14 - 26 65 30 126
0.01 - 0.40 - 385.09 424.23 476.05 427.70 - 271 519 319 11200.41 - 1.00 - 400.51 416.00 544.89 447.85 - 32 74 51 1581.01 - 2.00 - - 464.19 514.15 464.69 - - 21 21 532.01 - 4.00 - - - - 618.35 - - - - 23
4.01 + - - - - - - - - - -
self-employed
in non- agriculture
all sizes 377.83 393.10 432.87 497.16 439.84 21 339 693 439 1492< 0.01 - 385.47 377.45 428.61 384.53 - 54 42 22 122
0.01 - 0.40 - 355.68 371.48 399.14 366.13 - 676 470 150 13170.41 - 1.00 - 358.52 393.67 410.46 378.94 - 77 67 25 1741.01 - 2.00 - - - - 362.53 - - - - 202.01 - 4.00 - - - - - - - - - -
4.01 + - - - - - - - - - -
agricultural labour
all sizes 306.83 357.15 374.51 403.07 368.36 26 820 586 201 1637< 0.01 - 464.97 408.08 - 467.35 - 20 34 - 64
0.01 - 0.40 - 396.56 418.12 523.71 423.60 - 216 132 75 4300.41 - 1.00 - - - - 426.15 - - - - 431.01 - 2.00 - - - - - - - - - -2.01 - 4.00 - - - - - - - - - -
4.01 + - - - - - - - - - -
other labour
all sizes - 400.06 421.21 522.05 427.69 - 258 184 93 547< 0.01 - - - - - - - - - -
0.01 - 0.40 - 417.50 403.45 545.18 450.23 - 159 348 263 7740.41 - 1.00 - 414.07 444.68 512.49 460.59 - 279 803 555 16411.01 - 2.00 - 431.31 462.45 579.48 497.90 - 132 587 442 11722.01 - 4.00 - 499.20 503.86 657.74 575.62 - 62 312 364 749
4.01 + - - 601.97 757.82 685.62 - - 146 227 392
self-employed
in agriculture
all sizes 514.29 429.63 459.15 584.06 499.41 34 646 2202 1856 4741< 0.01 - 593.77 539.53 646.67 593.49 - 24 41 44 109
0.01 - 0.40 - 510.16 463.93 635.92 544.25 - 127 230 266 6300.41 - 1.00 - - 487.41 585.01 517.32 - - 59 58 1361.01 - 2.00 - - - 705.45 604.69 - - - 38 652.01 - 4.00 - - - 885.52 720.44 - - - 26 45
4.01 + - - - - - - - - - -
other households
all sizes - 516.03 476.37 645.40 553.32 - 183 365 438 994< 0.01 - 452.17 456.67 556.91 475.77 - 126 188 110 437
0.01 - 0.40 375.91 383.42 408.94 514.77 424.34 47 1452 1702 1074 42800.41 - 1.00 - 403.07 442.44 517.34 456.00 - 425 1020 698 21551.01 - 2.00 - 426.93 460.34 584.43 497.42 - 161 635 508 13202.01 - 4.00 - 488.64 507.18 666.74 579.56 - 70 339 399 820
4.01 + - - 598.04 762.47 680.86 - - 151 242 420
all households
all sizes 425.38 399.13 441.94 562.78 466.44 105 2249 4035 3031 9432 (Contd.)

Appendix Tables
NSS Report No. 472: Differences in Level of Consumption among Socio-Economic Groups,1999-2000 A-110
Table 4R : Average MPCE of rural households classified by household type, social group and area of land possessed and by State/UT Rural
average MPCE (Rs) of households of number of sample households of social group social group household
type
size of land
possessed (hectares) ST SC OBC others all ST SC OBC others all
(1) (2) (3) (4) (5) (6) (7) (8) (9) (10) (11) (12)
West Bengal < 0.01 - - - 426.67 470.42 - - - 37 57
0.01 - 0.40 - 419.55 520.69 440.65 442.06 - 216 79 510 8180.41 - 1.00 - 415.37 - 502.76 490.65 - 24 - 87 1351.01 - 2.00 - - - 675.99 503.91 - - - 32 572.01 - 4.00 - - - - - - - - - -
4.01 + - - - - - - - - - -
self-employed
in non- agriculture
all sizes 371.57 427.84 524.05 453.90 451.54 29 268 110 675 1085< 0.01 - 416.69 - 379.95 395.94 - 35 - 36 86
0.01 - 0.40 348.65 380.32 458.99 385.98 383.17 177 497 69 596 13410.41 - 1.00 - - - 358.05 357.23 - - - 21 601.01 - 2.00 - - - - - - - - - -2.01 - 4.00 - - - - - - - - - -
4.01 + - - - - - - - - - -
agricultural labour
all sizes 351.87 381.89 439.53 384.63 382.57 205 547 81 657 1492< 0.01 - - - - 536.26 - - - - 24
0.01 - 0.40 - 429.77 - 463.00 445.82 - 55 - 123 2080.41 - 1.00 - - - - - - - - - -1.01 - 2.00 - - - - - - - - - -2.01 - 4.00 - - - - - - - - - -
4.01 + - - - - - - - - - -
other labour
all sizes - 446.63 - 466.38 454.07 - 67 - 139 241< 0.01 - - - - - - - - - -
0.01 - 0.40 - 460.51 - 510.91 496.22 - 48 - 156 2360.41 - 1.00 406.11 454.77 483.78 510.74 491.99 22 97 26 278 4231.01 - 2.00 415.88 472.67 - 477.84 469.31 30 55 - 165 2682.01 - 4.00 - - - 513.68 497.86 - - - 82 113
4.01 + - - - 685.94 638.07 - - - 38 46
self-employed
in agriculture
all sizes 417.09 463.04 485.30 505.12 489.28 77 214 79 723 1093< 0.01 - - - 569.73 638.93 - - - 30 53
0.01 - 0.40 - 872.46 665.63 643.77 689.20 - 85 28 218 3420.41 - 1.00 - 611.59 - 706.24 659.75 - 26 - 73 1131.01 - 2.00 - - - 636.70 659.40 - - - 41 642.01 - 4.00 - - - 733.67 717.03 - - - 28 35
4.01 + - - - - - - - - - -
other households
all sizes 523.29 746.97 697.80 655.84 676.76 25 139 53 402 620< 0.01 496.57 490.19 - 445.05 467.72 25 68 - 118 231
0.01 - 0.40 359.59 425.60 517.43 439.30 435.10 228 902 212 1607 29550.41 - 1.00 399.67 464.46 495.81 523.95 500.96 48 163 64 464 7401.01 - 2.00 387.52 487.25 527.24 505.63 491.54 40 79 32 239 3912.01 - 4.00 - - - 537.69 516.41 - - - 122 166
4.01 + - - - 667.82 568.23 - - - 51 67
all households
all sizes 375.68 439.38 516.33 463.14 454.24 354 1236 346 2601 4550 (Contd.)

Appendix Tables
NSS Report No. 472: Differences in Level of Consumption among Socio-Economic Groups,1999-2000 A-111
Table 4R : Average MPCE of rural households classified by household type, social group and area of land possessed and by State/UT Rural
average MPCE (Rs) of households of number of sample households of social group social group household
type
size of land
possessed (hectares) ST SC OBC others all ST SC OBC others all
(1) (2) (3) (4) (5) (6) (7) (8) (9) (10) (11) (12)
A. & N. Islands < 0.01 - - - - - - - - - -
0.01 - 0.40 - - - - - - - - - -0.41 - 1.00 - - - - - - - - - -1.01 - 2.00 - - - - - - - - - -2.01 - 4.00 - - - - - - - - - -
4.01 + - - - - - - - - - -
self-employed
in non- agriculture
all sizes - - - 933.26 953.78 - - - 23 26< 0.01 - - - - - - - - - -
0.01 - 0.40 - - - - - - - - - -0.41 - 1.00 - - - - - - - - - -1.01 - 2.00 - - - - - - - - - -2.01 - 4.00 - - - - - - - - - -
4.01 + - - - - - - - - - -
agricultural labour
all sizes - - - 685.32 680.92 - - - 21 33< 0.01 - - - - - - - - - -
0.01 - 0.40 - - - 883.90 847.44 - - - 27 350.41 - 1.00 - - - - - - - - - -1.01 - 2.00 - - - - - - - - - -2.01 - 4.00 - - - - - - - - - -
4.01 + - - - - - - - - - -
other labour
all sizes - - - 896.89 840.67 - - - 43 55< 0.01 - - - - - - - - - -
0.01 - 0.40 - - - - - - - - - -0.41 - 1.00 758.30 - - - 779.19 21 - - - 271.01 - 2.00 638.53 - - - 630.30 21 - - - 332.01 - 4.00 - - - - 658.83 - - - - 28
4.01 + - - - - - - - - - -
self-employed
in agriculture
all sizes 664.98 - - 679.28 675.87 68 - - 51 121< 0.01 - - - - - - - - - -
0.01 - 0.40 - - - - 1100.00 - - - - 240.41 - 1.00 - - - - - - - - - -1.01 - 2.00 - - - - - - - - - -2.01 - 4.00 - - - - - - - - - -
4.01 + - - - - - - - - - -
other households
all sizes - - - 1071.88 1068.37 - - - 28 38< 0.01 - - - 1066.30 906.77 - - - 24 40
0.01 - 0.40 797.09 - - 878.71 865.82 24 - - 82 1100.41 - 1.00 748.10 - - - 763.61 26 - - - 421.01 - 2.00 567.76 - - - 633.61 24 - - - 432.01 - 4.00 - - - 688.78 678.46 - - - 21 32
4.01 + - - - - - - - - - -
all households
all sizes 686.55 - - 801.54 780.07 98 - - 166 273 (Contd.)

Appendix Tables
NSS Report No. 472: Differences in Level of Consumption among Socio-Economic Groups,1999-2000 A-112
Table 4R : Average MPCE of rural households classified by household type, social group and area of land possessed and by State/UT Rural
average MPCE (Rs) of households of number of sample households of social group social group household
type
size of land
possessed (hectares) ST SC OBC others all ST SC OBC others all
(1) (2) (3) (4) (5) (6) (7) (8) (9) (10) (11) (12)
Chandigarh < 0.01 - - - - 891.34 - - - - 23
0.01 - 0.40 - - - - 741.09 - - - - 200.41 - 1.00 - - - - - - - - - -1.01 - 2.00 - - - - - - - - - -2.01 - 4.00 - - - - - - - - - -
4.01 + - - - - - - - - - -
self-employed
in non- agriculture
all sizes - - - 849.33 824.70 - - - 28 47< 0.01 - - - - 804.69 - - - - 20
0.01 - 0.40 - - - - - - - - - -0.41 - 1.00 - - - - - - - - - -1.01 - 2.00 - - - - - - - - - -2.01 - 4.00 - - - - - - - - - -
4.01 + - - - - - - - - - -
agricultural labour
all sizes - - - - 783.44 - - - - 24< 0.01 - - - - 864.28 - - - - 23
0.01 - 0.40 - - - - - - - - - -0.41 - 1.00 - - - - - - - - - -1.01 - 2.00 - - - - - - - - - -2.01 - 4.00 - - - - - - - - - -
4.01 + - - - - - - - - - -
other labour
all sizes - - - - 768.60 - - - - 28< 0.01 - - - - - - - - - -
0.01 - 0.40 - - - - - - - - - -0.41 - 1.00 - - - - - - - - - -1.01 - 2.00 - - - - - - - - - -2.01 - 4.00 - - - - - - - - - -
4.01 + - - - - - - - - - -
self-employed
in agriculture
all sizes - - - - - - - - - -< 0.01 - - - 1010.55 1217.23 - - - 23 47
0.01 - 0.40 - - - - 802.26 - - - - 220.41 - 1.00 - - - - - - - - - -1.01 - 2.00 - - - - - - - - - -2.01 - 4.00 - - - - - - - - - -
4.01 + - - - - - - - - - -
other households
all sizes - - 817.82 1047.52 1076.83 - - 20 41 75< 0.01 - 737.60 1016.59 908.67 992.87 - 24 30 53 114
0.01 - 0.40 - - - 773.25 733.04 - - - 29 520.41 - 1.00 - - - - - - - - - -1.01 - 2.00 - - - - - - - - - -2.01 - 4.00 - - - - - - - - - -
4.01 + - - - - - - - - - -
all households
all sizes - 709.45 901.28 1026.56 988.97 - 32 45 94 180 (Contd.)

Appendix Tables
NSS Report No. 472: Differences in Level of Consumption among Socio-Economic Groups,1999-2000 A-113
Table 4R : Average MPCE of rural households classified by household type, social group and area of land possessed and by State/UT Rural
average MPCE (Rs) of households of number of sample households of social group social group household
type
size of land
possessed (hectares) ST SC OBC others all ST SC OBC others all
(1) (2) (3) (4) (5) (6) (7) (8) (9) (10) (11) (12)
Dadra & Nagar Haveli < 0.01 - - - - - - - - - -
0.01 - 0.40 - - - - - - - - - -0.41 - 1.00 - - - - - - - - - -1.01 - 2.00 - - - - - - - - - -2.01 - 4.00 - - - - - - - - - -
4.01 + - - - - - - - - - -
self-employed
in non- agriculture
all sizes - - - - 656.33 - - - - 27< 0.01 - - - - - - - - - -
0.01 - 0.40 - - - - - - - - - -0.41 - 1.00 - - - - - - - - - -1.01 - 2.00 - - - - - - - - - -2.01 - 4.00 - - - - - - - - - -
4.01 + - - - - - - - - - -
agricultural labour
all sizes - - - - - - - - - -< 0.01 - - - - - - - - - -
0.01 - 0.40 407.10 - - - 473.61 22 - - - 280.41 - 1.00 - - - - - - - - - -1.01 - 2.00 - - - - - - - - - -2.01 - 4.00 - - - - - - - - - -
4.01 + - - - - - - - - - -
other labour
all sizes 404.89 - - - 483.28 40 - - - 52< 0.01 - - - - - - - - - -
0.01 - 0.40 - - - - - - - - - -0.41 - 1.00 451.43 - - - 446.30 35 - - - 361.01 - 2.00 - - - - - - - - - -2.01 - 4.00 - - - - - - - - - -
4.01 + - - - - - - - - - -
self-employed
in agriculture
all sizes 448.87 - - - 447.57 62 - - - 64< 0.01 - - - - - - - - - -
0.01 - 0.40 - - - - - - - - - -0.41 - 1.00 - - - - - - - - - -1.01 - 2.00 - - - - - - - - - -2.01 - 4.00 - - - - - - - - - -
4.01 + - - - - - - - - - -
other households
all sizes 663.92 - - - 1144.64 20 - - - 31< 0.01 - - - - - - - - - -
0.01 - 0.40 479.06 - - - 572.77 48 - - - 670.41 - 1.00 457.50 - - - 455.99 73 - - - 781.01 - 2.00 441.82 - - - 468.12 21 - - - 242.01 - 4.00 - - - - - - - - - -
4.01 + - - - - - - - - - -
all households
all sizes 460.71 - - 1170.74 561.12 153 - - 34 192 (Contd.)

Appendix Tables
NSS Report No. 472: Differences in Level of Consumption among Socio-Economic Groups,1999-2000 A-114
Table 4R : Average MPCE of rural households classified by household type, social group and area of land possessed and by State/UT Rural
average MPCE (Rs) of households of number of sample households of social group social group household
type
size of land
possessed (hectares) ST SC OBC others all ST SC OBC others all
(1) (2) (3) (4) (5) (6) (7) (8) (9) (10) (11) (12)
Daman & Diu < 0.01 - - - - - - - - - -
0.01 - 0.40 - - - - - - - - - -0.41 - 1.00 - - - - - - - - - -1.01 - 2.00 - - - - - - - - - -2.01 - 4.00 - - - - - - - - - -
4.01 + - - - - - - - - - -
self-employed
in non- agriculture
all sizes - - - - 1009.41 - - - - 25< 0.01 - - - - - - - - - -
0.01 - 0.40 529.22 - - - 590.46 24 - - - 340.41 - 1.00 - - - - - - - - - -1.01 - 2.00 - - - - - - - - - -2.01 - 4.00 - - - - - - - - - -
4.01 + - - - - - - - - - -
agricultural labour
all sizes 537.10 - - - 609.58 25 - - - 37< 0.01 - - - - - - - - - -
0.01 - 0.40 - - - - 952.99 - - - - 460.41 - 1.00 - - - - - - - - - -1.01 - 2.00 - - - - - - - - - -2.01 - 4.00 - - - - - - - - - -
4.01 + - - - - - - - - - -
other labour
all sizes 643.12 - - - 944.82 22 - - - 56< 0.01 - - - - - - - - - -
0.01 - 0.40 - - - - - - - - - -0.41 - 1.00 - - - - - - - - - -1.01 - 2.00 - - - - - - - - - -2.01 - 4.00 - - - - - - - - - -
4.01 + - - - - - - - - - -
self-employed
in agriculture
all sizes - - - - 794.90 - - - - 20< 0.01 - - - - - - - - - -
0.01 - 0.40 - - - 1482.47 1320.89 - - - 20 300.41 - 1.00 - - - - - - - - - -1.01 - 2.00 - - - - - - - - - -2.01 - 4.00 - - - - - - - - - -
4.01 + - - - - - - - - - -
other households
all sizes - - - 1346.62 1248.99 - - - 30 42< 0.01 - - - - - - - - - -
0.01 - 0.40 641.46 - - 1198.46 902.80 58 - - 57 1340.41 - 1.00 - - - 907.62 823.86 - - - 20 301.01 - 2.00 - - - - - - - - - -2.01 - 4.00 - - - - - - - - - -
4.01 + - - - - - - - - - -
all households
all sizes 650.65 - - 1093.83 901.38 70 - - 85 180 (Contd.)

Appendix Tables
NSS Report No. 472: Differences in Level of Consumption among Socio-Economic Groups,1999-2000 A-115
Table 4R : Average MPCE of rural households classified by household type, social group and area of land possessed and by State/UT Rural
average MPCE (Rs) of households of number of sample households of social group social group household
type
size of land
possessed (hectares) ST SC OBC others all ST SC OBC others all
(1) (2) (3) (4) (5) (6) (7) (8) (9) (10) (11) (12)
Delhi < 0.01 - - - - 807.81 - - - - 28
0.01 - 0.40 - - - 959.66 957.05 - - - 23 280.41 - 1.00 - - - - - - - - - -1.01 - 2.00 - - - - - - - - - -2.01 - 4.00 - - - - - - - - - -
4.01 + - - - - - - - - - -
self-employed
in non- agriculture
all sizes - - - 889.75 854.68 - - - 42 61< 0.01 - - - - - - - - - -
0.01 - 0.40 - - - - - - - - - -0.41 - 1.00 - - - - - - - - - -1.01 - 2.00 - - - - - - - - - -2.01 - 4.00 - - - - - - - - - -
4.01 + - - - - - - - - - -
agricultural labour
all sizes - - - - - - - - - -< 0.01 - - - - - - - - - -
0.01 - 0.40 - - - - - - - - - -0.41 - 1.00 - - - - - - - - - -1.01 - 2.00 - - - - - - - - - -2.01 - 4.00 - - - - - - - - - -
4.01 + - - - - - - - - - -
other labour
all sizes - - - - - - - - - -< 0.01 - - - - - - - - - -
0.01 - 0.40 - - - - - - - - - -0.41 - 1.00 - - - - - - - - - -1.01 - 2.00 - - - - - - - - - -2.01 - 4.00 - - - - - - - - - -
4.01 + - - - - - - - - - -
self-employed
in agriculture
all sizes - - - - - - - - - -< 0.01 - - - 903.14 937.61 - - - 30 49
0.01 - 0.40 - - - 1053.68 987.02 - - - 29 380.41 - 1.00 - - - - - - - - - -1.01 - 2.00 - - - - - - - - - -2.01 - 4.00 - - - - - - - - - -
4.01 + - - - - - - - - - -
other households
all sizes - - - 955.12 961.57 - - - 70 99< 0.01 - - - 881.83 891.11 - - - 46 84
0.01 - 0.40 - - - 1014.05 955.94 - - - 57 770.41 - 1.00 - - - - - - - - - -1.01 - 2.00 - - - - - - - - - -2.01 - 4.00 - - - - - - - - - -
4.01 + - - - - - - - - - -
all households
all sizes - 731.05 989.84 932.83 916.85 - 34 25 123 187 (Contd.)

Appendix Tables
NSS Report No. 472: Differences in Level of Consumption among Socio-Economic Groups,1999-2000 A-116
Table 4R : Average MPCE of rural households classified by household type, social group and area of land possessed and by State/UT Rural
average MPCE (Rs) of households of number of sample households of social group social group household
type
size of land
possessed (hectares) ST SC OBC others all ST SC OBC others all
(1) (2) (3) (4) (5) (6) (7) (8) (9) (10) (11) (12)
Lakshadweep < 0.01 - - - - - - - - - -
0.01 - 0.40 - - - - - - - - - -0.41 - 1.00 - - - - - - - - - -1.01 - 2.00 - - - - - - - - - -2.01 - 4.00 - - - - - - - - - -
4.01 + - - - - - - - - - -
self-employed
in non- agriculture
all sizes - - - - - - - - - -< 0.01 - - - - - - - - - -
0.01 - 0.40 - - - - - - - - - -0.41 - 1.00 - - - - - - - - - -1.01 - 2.00 - - - - - - - - - -2.01 - 4.00 - - - - - - - - - -
4.01 + - - - - - - - - - -
agricultural labour
all sizes - - - - - - - - - -< 0.01 - - - - - - - - - -
0.01 - 0.40 - - - - - - - - - -0.41 - 1.00 - - - - - - - - - -1.01 - 2.00 - - - - - - - - - -2.01 - 4.00 - - - - - - - - - -
4.01 + - - - - - - - - - -
other labour
all sizes - - - - - - - - - -< 0.01 - - - - - - - - - -
0.01 - 0.40 925.26 - - - 925.26 21 - - - 210.41 - 1.00 - - - - - - - - - -1.01 - 2.00 - - - - - - - - - -2.01 - 4.00 - - - - - - - - - -
4.01 + - - - - - - - - - -
self-employed
in agriculture
all sizes 925.26 - - - 925.26 21 - - - 21< 0.01 - - - - - - - - - -
0.01 - 0.40 823.24 - - - 858.12 27 - - - 300.41 - 1.00 - - - - - - - - - -1.01 - 2.00 - - - - - - - - - -2.01 - 4.00 - - - - - - - - - -
4.01 + - - - - - - - - - -
other households
all sizes 846.42 - - - 886.09 32 - - - 36< 0.01 - - - - - - - - - -
0.01 - 0.40 844.07 - - - 866.96 68 - - - 730.41 - 1.00 - - - - - - - - - -1.01 - 2.00 - - - - - - - - - -2.01 - 4.00 - - - - - - - - - -
4.01 + - - - - - - - - - -
all households
all sizes 850.06 - - - 876.13 76 - - - 84 (Contd.)

Appendix Tables
NSS Report No. 472: Differences in Level of Consumption among Socio-Economic Groups,1999-2000 A-117
Table 4R : Average MPCE of rural households classified by household type, social group and area of land possessed and by State/UT Rural
average MPCE (Rs) of households of number of sample households of social group social group household
type
size of land
possessed (hectares) ST SC OBC others all ST SC OBC others all
(1) (2) (3) (4) (5) (6) (7) (8) (9) (10) (11) (12)
Pondicherry < 0.01 - - - - - - - - - -
0.01 - 0.40 - - 632.02 - 611.88 - - 23 - 270.41 - 1.00 - - - - - - - - - -1.01 - 2.00 - - - - - - - - - -2.01 - 4.00 - - - - - - - - - -
4.01 + - - - - - - - - - -
self-employed
in non- agriculture
all sizes - - 666.16 - 643.56 - - 28 - 32< 0.01 - - - - - - - - - -
0.01 - 0.40 - 411.55 476.63 - 442.44 - 55 54 - 1100.41 - 1.00 - - - - - - - - - -1.01 - 2.00 - - - - - - - - - -2.01 - 4.00 - - - - - - - - - -
4.01 + - - - - - - - - - -
agricultural labour
all sizes - 433.67 484.93 - 457.21 - 66 58 - 125< 0.01 - - - - - - - - - -
0.01 - 0.40 - - 662.43 - 662.49 - - 37 - 420.41 - 1.00 - - - - - - - - - -1.01 - 2.00 - - - - - - - - - -2.01 - 4.00 - - - - - - - - - -
4.01 + - - - - - - - - - -
other labour
all sizes - - 663.44 - 660.20 - - 42 - 49< 0.01 - - - - - - - - - -
0.01 - 0.40 - - - - - - - - - -0.41 - 1.00 - - - - - - - - - -1.01 - 2.00 - - - - - - - - - -2.01 - 4.00 - - - - - - - - - -
4.01 + - - - - - - - - - -
self-employed
in agriculture
all sizes - - 756.26 - 813.38 - - 25 - 30< 0.01 - - - - - - - - - -
0.01 - 0.40 - - 828.48 - 838.79 - - 30 - 380.41 - 1.00 - - - - - - - - - -1.01 - 2.00 - - - - - - - - - -2.01 - 4.00 - - - - - - - - - -
4.01 + - - - - - - - - - -
other households
all sizes - - 859.79 - 867.51 - - 43 - 52< 0.01 - - - - - - - - - -
0.01 - 0.40 - 434.48 616.96 - 561.38 - 67 146 - 2190.41 - 1.00 - - - - 797.11 - - - - 221.01 - 2.00 - - - - - - - - - -2.01 - 4.00 - - - - - - - - - -
4.01 + - - - - - - - - - -
all households
all sizes - 453.89 649.37 - 597.48 - 81 196 - 288 (Contd.)

Appendix Tables
NSS Report No. 472: Differences in Level of Consumption among Socio-Economic Groups,1999-2000 A-118
Table 4R : Average MPCE of rural households classified by household type, social group and area of land possessed and by State/UT Rural
average MPCE (Rs) of households of number of sample households of social group social group household
type
size of land
possessed (hectares) ST SC OBC others all ST SC OBC others all
(1) (2) (3) (4) (5) (6) (7) (8) (9) (10) (11) (12)
all-India 464.19 459.06 516.44 618.41 533.22 40 173 317 315 853 464.19406.13 428.19 488.63 526.09 486.81 302 1312 2927 2560 7103 406.13448.39 447.24 471.98 603.18 513.79 123 170 536 535 1367 448.39358.58 451.16 510.34 635.16 529.80 73 66 205 243 589 358.58508.19 591.24 620.11 709.40 645.59 34 23 105 134 296 508.19488.08 - 764.96 791.28 711.38 27 - 58 81 177 488.08
self-emp loyed
in non- agriculture
420.21 435.46 495.09 557.19 502.28 599 1754 4148 3868 10385 420.21361.07 376.27 395.94 436.17 389.97 188 658 593 261 1702 361.07334.20 381.30 398.97 410.82 387.65 1697 4590 4441 2522 13259 334.20321.66 357.61 400.45 441.50 378.06 669 600 999 413 2682 321.66338.32 381.68 374.32 421.08 375.89 205 139 289 150 783 338.32329.81 402.72 375.92 478.87 397.45 52 38 74 55 220 329.81263.82 - - - 430.13 20 - - - 52 263.82
agricultural labour
332.58 378.31 397.08 419.35 385.98 2831 6034 6406 3414 18698 332.58474.45 472.15 509.10 646.28 525.85 37 181 191 176 585 474.45392.35 434.75 497.26 546.02 482.97 447 959 1477 1157 4041 392.35382.36 401.59 471.45 537.54 445.01 157 107 151 129 544 382.36361.64 435.06 500.43 519.75 466.60 28 25 59 34 146 361.64
- - - - 484.20 - - - - 54 -- - - - 515.24 - - - - 20 -
other labour
391.02 438.09 496.18 554.31 482.74 688 1290 1902 1509 5390 391.02397.98 - 398.75 551.87 454.97 22 - 29 24 89 397.98461.42 446.01 453.77 579.28 496.99 407 425 1216 1246 3299 461.42417.16 422.84 462.84 548.66 483.69 1442 836 2673 2740 7696 417.16406.28 437.18 476.14 572.57 497.58 1501 584 2316 2439 6850 406.28400.79 460.87 502.67 638.42 540.36 1021 314 1655 2016 5010 400.79450.45 521.90 586.31 698.91 626.59 436 182 1449 2117 4190 450.45
self-employed
in agriculture
414.72 442.22 488.02 602.81 519.53 4829 2355 9338 10582 27134 414.72533.48 605.86 705.12 772.68 705.96 157 186 298 517 1158 533.48581.93 592.63 584.15 733.40 652.27 389 865 1747 2411 5413 581.93541.13 520.86 549.43 712.96 613.81 191 154 410 627 1383 541.13613.60 536.04 576.63 692.33 625.96 146 58 232 348 785 613.60512.17 659.82 579.36 740.71 657.89 162 31 131 231 556 512.17614.27 - 664.60 782.72 707.81 113 - 77 139 345 614.27
other households
564.56 581.87 591.23 733.68 652.05 1158 1310 2895 4273 9640 564.56411.40 429.00 492.38 628.24 499.91 444 1212 1428 1294 4419 411.40371.53 413.85 460.05 537.34 462.07 3246 8162 11823 9906 33168 371.53379.23 405.48 455.83 557.75 468.42 2583 1867 4777 4451 13691 379.23397.11 431.38 471.93 573.67 491.06 1953 872 3102 3215 9157 397.11402.80 467.98 503.20 642.04 541.79 1284 419 1984 2446 6142 402.80444.79 509.66 591.93 704.82 627.53 614 223 1607 2356 4808 444.79
all households
387.69 418.51 473.65 577.22 485.88 10124 12755 24721 23668 71385 387.69

NSS Report No. 472: Differences in Level of Consumption among Socio-Economic Groups,1999-2000
A-119
Table 4U: Average MPCE of urban households classified by household type and social group and by State/UT Urban
average MPCE (Rs) of number of sample households households of social group of social group household type
SC ST OBC others all SC ST OBC others all (1) (2) (3) (4) (5) (6) (7) (8) (9) (10) (11)
Andhra Pradesh self-employed 566.87 470.47 634.48 803.86 709.78 34 70 444 697 1246 regular wage/salaried 867.78 790.75 919.52 991.89 934.82 42 193 498 840 1574 casual labour 465.10 428.93 498.60 493.58 482.28 26 122 269 151 570 other households - 610.13 892.76 1203.13 1010.49 - 41 112 237 407 all types 634.73 613.86 712.44 878.04 773.34 121 426 1326 1928 3806 Arunachal Pradesh self-employed - - - 698.89 712.25 - - - 25 39 regular wage/salaried 824.02 - - 731.45 779.74 54 - - 80 141 casual labour - - - - - - - - - - other households - - - - 752.02 - - - - 31 all types 823.29 - - 723.41 762.20 82 - - 130 233 Assam self-employed 758.63 484.47 842.04 726.57 705.18 25 28 28 188 270 regular wage/salaried 868.00 765.72 884.41 1069.52 1006.78 49 23 52 230 354 casual labour - - - 502.90 464.37 - - - 44 79 other households 630.78 - - 1024.86 873.66 31 - - 84 145 all types 749.73 557.30 737.07 872.29 813.82 111 79 112 548 852 Bihar self-employed 559.93 353.48 465.21 676.26 524.60 22 78 449 331 881 regular wage/salaried 592.11 607.25 629.09 983.73 784.02 52 118 251 343 766 casual labour 332.83 319.95 339.80 400.14 343.08 43 66 119 50 278 other households 490.79 466.80 597.49 822.21 678.48 20 24 127 165 336 all types 524.74 440.88 499.52 808.03 601.58 142 287 950 895 2279 Goa self-employed - - - 1077.91 1075.61 - - - 50 52 regular wage/salaried - - - 1309.11 1285.82 - - - 153 170 casual labour - - - 783.62 778.13 - - - 37 40 other households - - - 1076.99 1157.29 - - - 21 22 all types - - - 1161.57 1155.35 - - - 261 284 Gujarat self-employed - 565.43 665.37 1027.69 890.28 - 67 279 727 1086 regular wage/salaried 891.93 753.76 788.24 1121.70 995.88 42 129 162 674 1007 casual labour 488.97 582.34 554.25 697.42 600.17 46 102 146 138 432 other households - 576.05 678.55 1448.70 1201.07 - 33 31 166 238 all types 662.15 652.00 671.31 1056.78 891.59 109 331 618 1705 2764 (Contd.)
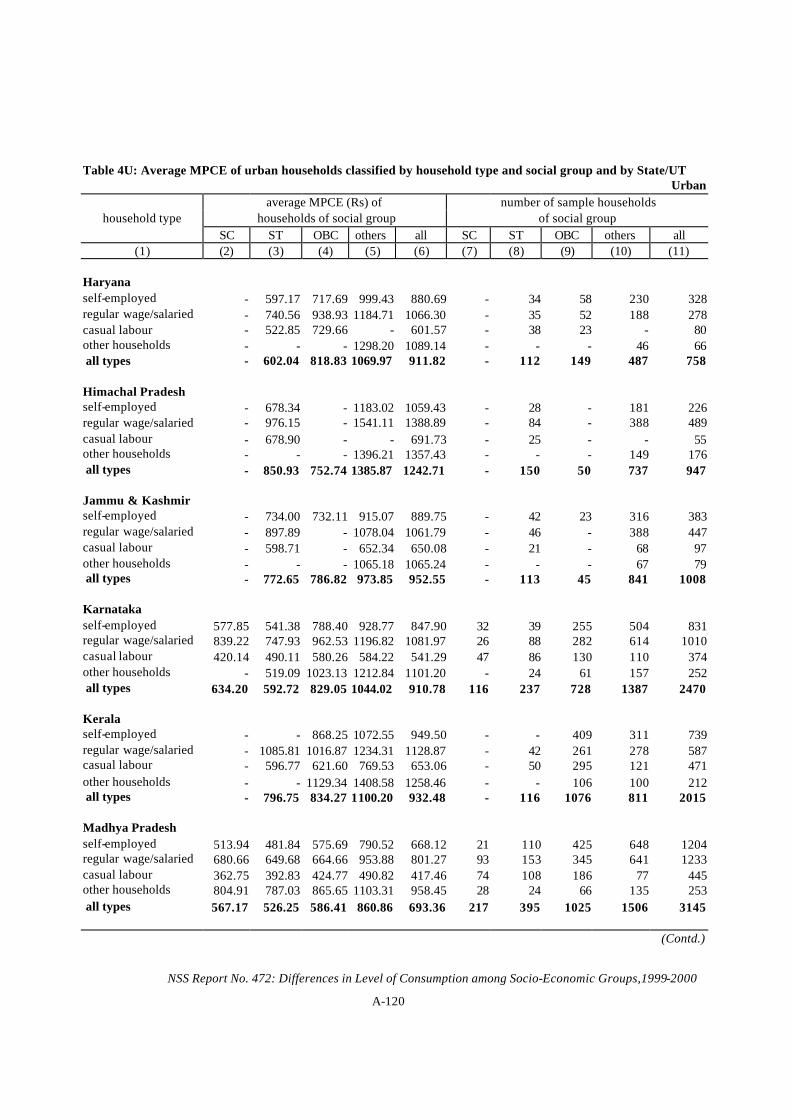
NSS Report No. 472: Differences in Level of Consumption among Socio-Economic Groups,1999-2000
A-120
Table 4U: Average MPCE of urban households classified by household type and social group and by State/UT Urban
average MPCE (Rs) of number of sample households households of social group of social group household type
SC ST OBC others all SC ST OBC others all (1) (2) (3) (4) (5) (6) (7) (8) (9) (10) (11)
Haryana self-employed - 597.17 717.69 999.43 880.69 - 34 58 230 328 regular wage/salaried - 740.56 938.93 1184.71 1066.30 - 35 52 188 278 casual labour - 522.85 729.66 - 601.57 - 38 23 - 80 other households - - - 1298.20 1089.14 - - - 46 66 all types - 602.04 818.83 1069.97 911.82 - 112 149 487 758 Himachal Pradesh self-employed - 678.34 - 1183.02 1059.43 - 28 - 181 226 regular wage/salaried - 976.15 - 1541.11 1388.89 - 84 - 388 489 casual labour - 678.90 - - 691.73 - 25 - - 55 other households - - - 1396.21 1357.43 - - - 149 176 all types - 850.93 752.74 1385.87 1242.71 - 150 50 737 947 Jammu & Kashmir self-employed - 734.00 732.11 915.07 889.75 - 42 23 316 383 regular wage/salaried - 897.89 - 1078.04 1061.79 - 46 - 388 447 casual labour - 598.71 - 652.34 650.08 - 21 - 68 97 other households - - - 1065.18 1065.24 - - - 67 79 all types - 772.65 786.82 973.85 952.55 - 113 45 841 1008 Karnataka self-employed 577.85 541.38 788.40 928.77 847.90 32 39 255 504 831 regular wage/salaried 839.22 747.93 962.53 1196.82 1081.97 26 88 282 614 1010 casual labour 420.14 490.11 580.26 584.22 541.29 47 86 130 110 374 other households - 519.09 1023.13 1212.84 1101.20 - 24 61 157 252 all types 634.20 592.72 829.05 1044.02 910.78 116 237 728 1387 2470 Kerala self-employed - - 868.25 1072.55 949.50 - - 409 311 739 regular wage/salaried - 1085.81 1016.87 1234.31 1128.87 - 42 261 278 587 casual labour - 596.77 621.60 769.53 653.06 - 50 295 121 471 other households - - 1129.34 1408.58 1258.46 - - 106 100 212 all types - 796.75 834.27 1100.20 932.48 - 116 1076 811 2015 Madhya Pradesh self-employed 513.94 481.84 575.69 790.52 668.12 21 110 425 648 1204 regular wage/salaried 680.66 649.68 664.66 953.88 801.27 93 153 345 641 1233 casual labour 362.75 392.83 424.77 490.82 417.46 74 108 186 77 445 other households 804.91 787.03 865.65 1103.31 958.45 28 24 66 135 253 all types 567.17 526.25 586.41 860.86 693.36 217 395 1025 1506 3145 (Contd.)

NSS Report No. 472: Differences in Level of Consumption among Socio-Economic Groups,1999-2000
A-121
Table 4U: Average MPCE of urban households classified by household type and social group and by State/UT Urban
average MPCE (Rs) of number of sample households households of social group of social group household type
SC ST OBC others all SC ST OBC others all (1) (2) (3) (4) (5) (6) (7) (8) (9) (10) (11)
Maharashtra self-employed 719.33 604.17 667.56 1095.22 966.14 42 115 307 1167 1632 regular wage/salaried 857.12 828.58 898.83 1135.93 1043.44 80 335 481 1868 2768 casual labour 375.15 465.09 555.14 547.61 516.49 33 126 113 230 504 other households - 906.92 1003.26 1612.30 1418.32 - 46 53 210 318 all types 723.77 704.58 779.72 1095.18 973.16 165 622 960 3478 5234 Manipur self-employed 601.24 - 697.04 565.58 616.36 30 - 101 154 285 regular wage/salaried 672.48 - 875.69 776.82 823.23 30 - 119 112 262 casual labour - - - - 519.28 - - - - 30 other households 678.91 - 588.26 569.95 594.32 30 - 31 22 83 all types 640.06 - 775.31 654.88 707.43 100 - 259 302 665 Meghalaya self-employed 877.03 - - 1000.03 907.64 35 - - 35 76 regular wage/salaried 1000.88 - - 1097.32 1006.82 142 - - 52 205 casual labour 706.98 - - - 715.43 25 - - - 36 other households 1196.30 - - - 1162.19 53 - - - 65 all types 960.05 - - 1036.66 971.64 255 - - 105 384 Mizoram self-employed 1038.19 - - - 1039.41 283 - - - 298 regular wage/salaried 1181.65 - - - 1182.12 367 - - - 388 casual labour 779.47 - - - 787.50 103 - - - 105 other households 913.07 - - - 904.04 57 - - - 59 all types 1057.13 - - - 1056.27 812 - - - 858 Nagaland self-employed - - - - 1384.13 - - - - 33 regular wage/salaried 1229.87 - - 1191.62 1208.73 140 - - 21 175 casual labour - - - - - - - - - - other households 1302.03 - - - 1293.65 44 - - - 47 all types 1268.15 - - 1140.76 1242.11 205 - - 35 264 Orissa self-employed 411.87 444.56 542.01 609.33 553.36 23 43 95 156 317 regular wage/salaried 519.73 556.72 683.30 906.70 759.36 57 47 107 259 471 casual labour 395.33 349.99 422.40 443.26 395.34 29 58 28 36 152 other households - - 542.19 689.46 655.84 - - 21 65 107 all types 489.74 440.67 579.80 727.94 618.22 122 157 251 517 1050 (Contd.)

NSS Report No. 472: Differences in Level of Consumption among Socio-Economic Groups,1999-2000
A-122
Table 4U: Average MPCE of urban households classified by household type and social group and by State/UT Urban
average MPCE (Rs) of number of sample households households of social group of social group household type
SC ST OBC others all SC ST OBC others all (1) (2) (3) (4) (5) (6) (7) (8) (9) (10) (11)
Punjab self-employed - 605.16 721.41 1044.93 904.84 - 136 120 512 774 regular wage/salaried - 754.14 824.15 1056.49 937.90 - 196 111 447 766 casual labour - 585.36 737.02 728.33 633.97 - 128 26 56 213 other households - - - 1210.22 1143.51 - - - 95 126 all types 654.39 666.78 762.80 1047.52 898.59 23 480 268 1110 1883 Rajasthan self-employed 569.59 544.38 631.98 831.37 721.04 27 90 222 502 841 regular wage/salaried 853.61 700.91 896.30 1031.15 937.66 35 87 167 483 772 casual labour - 480.64 566.57 588.01 526.95 - 78 51 40 183 other households - 590.05 799.48 979.19 890.14 - 22 30 132 189 all types 679.26 587.75 720.21 918.45 795.70 81 277 470 1157 1985 Sikkim self-employed - - - 893.23 843.85 - - - 44 73 regular wage/salaried 996.23 - 842.62 1126.00 980.47 42 - 37 83 177 casual labour - - - - - - - - - - other households - - - - - - - - - - all types 1021.25 690.27 768.39 979.39 905.42 63 33 50 140 288 Tamil Nadu self-employed - 513.33 954.83 1175.01 957.25 - 84 1040 237 1374 regular wage/salaried - 780.92 927.05 1362.38 1020.91 - 156 1169 399 1745 casual labour - 471.75 1013.50 615.79 837.06 - 176 469 52 703 other households - 456.19 1044.44 1691.17 1129.31 - 40 248 90 379 all types 1075.91 591.69 958.95 1276.84 971.34 33 458 2933 779 4212 Tripura self-employed - 621.46 780.99 902.17 808.20 - 39 28 114 183 regular wage/salaried - 983.93 1158.93 1025.09 1034.05 - 39 23 155 237 casual labour - 449.17 - 510.40 487.77 - 28 - 32 71 other households - - - 833.59 821.98 - - - 47 75 all types 1072.69 682.95 853.20 925.06 876.30 26 115 76 350 569 Uttar Pradesh self-employed - 511.55 537.16 717.00 626.33 - 234 820 1183 2263 regular wage/salaried - 699.34 719.23 927.25 849.81 - 239 313 797 1367 casual labour - 396.98 450.90 364.72 406.16 - 176 159 133 473 other households - 578.71 712.27 1022.88 869.81 - 50 155 300 510 all types 898.80 553.05 575.67 796.91 690.07 49 703 1453 2419 4638 (Contd.)

NSS Report No. 472: Differences in Level of Consumption among Socio-Economic Groups,1999-2000
A-123
Table 4U: Average MPCE of urban households classified by household type and social group and by State/UT Urban
average MPCE (Rs) of number of sample households households of social group of social group household type
SC ST OBC others all SC ST OBC others all (1) (2) (3) (4) (5) (6) (7) (8) (9) (10) (11)
West Bengal self-employed - 534.72 577.28 896.62 808.19 - 221 82 968 1289 regular wage/salaried 699.40 732.42 854.05 1048.07 982.26 26 190 92 1116 1428 casual labour 375.08 437.59 462.65 536.02 490.89 26 106 24 204 366 other households - 706.64 - 1272.56 1165.31 - 38 - 274 336 all types 573.87 591.40 684.41 955.50 866.32 76 556 216 2568 3432 A. & N. Islands self-employed - - - 1162.65 1146.31 - - - 28 29 regular wage/salaried - - - 1166.44 1161.85 - - - 119 133 casual labour - - - 799.62 816.25 - - - 20 21 other households - - - - - - - - - - all types - - - 1112.28 1114.04 - - - 174 191 Chandigarh self-employed - 866.79 1081.50 1259.65 1191.69 - 23 21 154 204 regular wage/salaried - 980.92 1221.40 1698.34 1558.49 - 59 46 363 477 casual labour - - - - 592.56 - - - - 28 other households - - - 2092.77 2095.10 - - - 51 54 all types - 881.55 1156.76 1571.41 1435.19 - 94 68 583 765 Dadra & Nagar Haveli self-employed - - - - 1099.34 - - - - 21 regular wage/salaried - - - 1576.20 1358.21 - - - 35 61 casual labour - - - - - - - - - - other households - - - - - - - - - - all types 722.17 - - 1439.84 1207.24 28 - - 50 96 Daman & Diu self-employed - - 825.32 1048.23 980.57 - - 24 37 65 regular wage/salaried - - 807.51 1106.01 961.59 - - 33 52 98 casual labour - - - - - - - - - - other households - - - - - - - - - - all types - - 823.28 1109.09 979.33 - - 65 104 192 Delhi self-employed - 812.38 788.51 1740.65 1535.90 - 42 53 326 431 regular wage/salaried - 828.85 1050.66 1466.38 1311.42 - 69 77 378 532 casual labour - 547.07 - - 587.77 - 23 - - 51 other households - - - 1590.97 1399.70 - - - 49 59 all types - 778.03 907.06 1595.03 1383.19 - 143 144 771 1081 (Contd.)

NSS Report No. 472: Differences in Level of Consumption among Socio-Economic Groups,1999-2000
A-124
Table 4U: Average MPCE of urban households by type and social group Urban
average MPCE (Rs) of number of sample households households of social group of social group household type
SC ST OBC others all SC ST OBC others all (1) (2) (3) (4) (5) (6) (7) (8) (9) (10) (11)
Lakshadweep self-employed 916.81 - - - 924.26 71 - - - 74 regular wage/salaried 1059.85 - - - 1113.43 70 - - - 82 casual labour - - - - 831.93 - - - - 21 other households - - - - - - - - - - all types 988.18 - - - 1018.12 170 - - - 192 Pondicherry self-employed - - 881.43 - 867.79 - - 62 - 79 regular wage/salaried - - 788.69 979.30 819.33 - - 115 28 159 casual labour - - 567.06 - 541.44 - - 73 - 85 other households - - 1057.81 - 1091.12 - - 42 - 61 all types - 684.61 774.53 927.97 784.16 - 32 292 57 384 all-India self-employed 662.14 542.68 674.97 953.00 812.96 777 1572 5391 9864 17626 regular wage/salaried 834.94 754.69 859.34 1101.05 981.49 1471 2399 4862 11600 20359 casual labour 424.50 463.58 608.23 548.65 540.66 526 1569 2184 1727 6024 other households 808.09 649.49 860.69 1207.74 1030.82 400 433 1187 2726 4750 all types 690.52 608.79 734.82 1004.75 854.70 3202 5985 13668 25966 48924

Appendix Tables
NSS Report No.472: Differences in Level of Consumption among Socio-Economic Groups,1999-2000 A-125
Table 5R: Break-up of MPCE by broad groups of food items separately for each household type in rural areas and by State/UT Rural
average per capita consumption expenditure (Rs) per 30 days on
household type cereals gram
cereal substi- tutes
pulses &
products
milk &
milk products
edibile oil
meat, egg &
fish
vegeta- bles
fruits (fresh)
fruits (dry)
sugar salt spices
beve- rages,
refresh- ments etc,
food total
(1) (2) (3) (4) (5) (6) (7) (8) (9) (10) (11) (12) (13) (14) (15) (16) Andhra Pradesh self-employed in non-ag. 110.52 0.17 0.01 18.36 29.26 17.01 21.49 26.52 6.01 1.80 7.17 1.25 15.51 24.50 279.57 agricultural labour 109.50 0.14 0.01 15.45 19.67 15.32 18.03 26.04 3.98 1.21 5.63 1.12 14.98 17.35 248.43 other labour 111.67 0.10 0.00 16.99 22.77 16.08 20.86 24.60 4.89 2.03 5.99 1.07 14.79 23.86 265.71 self-employed in ag. 116.30 0.16 0.00 20.36 35.85 19.05 23.82 26.71 6.27 2.16 8.09 1.13 15.11 19.54 294.56 other households 109.26 0.30 0.00 20.86 43.63 20.07 22.40 29.72 8.62 2.34 8.56 1.18 16.98 73.62 357.57 not recorded 123.96 0.00 0.00 16.19 17.33 14.53 21.08 18.82 1.91 1.85 4.90 1.12 12.14 10.13 243.95 all types 111.70 0.16 0.01 17.70 27.40 16.98 20.61 26.46 5.28 1.69 6.76 1.14 15.21 23.36 274.45 Arunachal Pradesh self-employed in non-ag. 106.86 0.16 0.00 28.66 38.71 23.55 63.54 48.83 10.49 0.70 10.47 1.94 10.21 39.02 383.13 agricultural labour 122.90 0.27 0.00 9.19 1.82 6.60 75.09 82.64 2.65 0.00 15.65 1.58 3.98 12.59 334.96 other labour 142.40 0.38 0.00 32.16 17.91 16.93 77.00 95.04 5.88 0.03 7.98 2.79 9.76 14.83 423.08 self-employed in ag. 171.71 0.20 0.39 7.78 15.79 9.86 53.99 45.00 9.01 0.41 5.94 2.16 7.59 14.24 344.08 other households 154.54 0.35 3.94 18.45 14.44 16.02 57.31 61.19 6.15 0.31 8.58 2.06 10.35 20.31 373.99 not recorded 180.16 0.41 0.00 23.42 35.52 20.33 59.82 78.39 5.96 0.15 3.92 2.42 8.66 21.71 440.87 all types 156.80 0.26 1.26 13.99 16.30 12.81 58.75 56.11 7.62 0.35 7.85 2.12 8.39 17.64 360.23 Assam self-employed in non-ag. 142.27 0.17 0.02 13.45 14.44 15.48 33.50 35.24 4.46 0.15 7.74 1.33 7.66 18.55 294.47 agricultural labour 101.75 0.09 0.01 9.83 4.09 11.46 31.53 31.95 2.32 0.02 5.61 1.13 6.02 15.70 221.50 other labour 118.26 0.09 0.01 11.49 6.15 13.20 28.36 33.07 1.73 0.00 6.02 1.57 7.47 14.47 241.87 self-employed in ag. 153.50 0.17 0.02 14.06 20.02 14.98 36.76 35.05 4.05 0.10 7.78 1.23 7.20 14.52 309.47 other households 151.72 0.33 0.04 16.08 23.72 18.71 45.02 39.85 6.79 0.12 8.64 1.36 7.91 24.79 345.08 not recorded 154.94 0.00 0.00 14.67 14.01 17.67 40.17 37.73 6.16 0.00 10.97 1.54 9.97 17.74 325.57 all types 137.85 0.17 0.02 13.20 15.05 14.78 35.41 35.01 3.91 0.09 7.30 1.30 7.23 16.89 288.20
(Contd.)
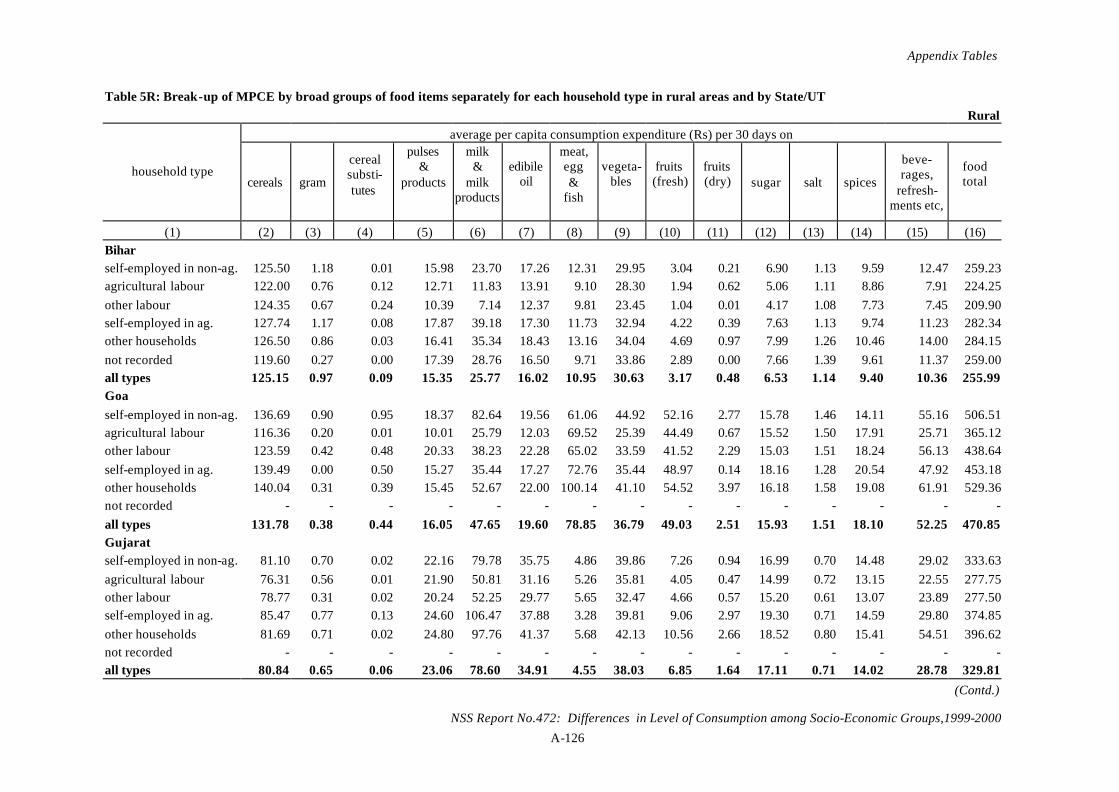
Appendix Tables
NSS Report No.472: Differences in Level of Consumption among Socio-Economic Groups,1999-2000 A-126
Table 5R: Break-up of MPCE by broad groups of food items separately for each household type in rural areas and by State/UT Rural
average per capita consumption expenditure (Rs) per 30 days on
household type cereals gram
cereal substi- tutes
pulses &
products
milk &
milk products
edibile oil
meat, egg &
fish
vegeta- bles
fruits (fresh)
fruits (dry)
sugar salt spices
beve- rages,
refresh- ments etc,
food total
(1) (2) (3) (4) (5) (6) (7) (8) (9) (10) (11) (12) (13) (14) (15) (16) Bihar self-employed in non-ag. 125.50 1.18 0.01 15.98 23.70 17.26 12.31 29.95 3.04 0.21 6.90 1.13 9.59 12.47 259.23 agricultural labour 122.00 0.76 0.12 12.71 11.83 13.91 9.10 28.30 1.94 0.62 5.06 1.11 8.86 7.91 224.25 other labour 124.35 0.67 0.24 10.39 7.14 12.37 9.81 23.45 1.04 0.01 4.17 1.08 7.73 7.45 209.90 self-employed in ag. 127.74 1.17 0.08 17.87 39.18 17.30 11.73 32.94 4.22 0.39 7.63 1.13 9.74 11.23 282.34 other households 126.50 0.86 0.03 16.41 35.34 18.43 13.16 34.04 4.69 0.97 7.99 1.26 10.46 14.00 284.15 not recorded 119.60 0.27 0.00 17.39 28.76 16.50 9.71 33.86 2.89 0.00 7.66 1.39 9.61 11.37 259.00 all types 125.15 0.97 0.09 15.35 25.77 16.02 10.95 30.63 3.17 0.48 6.53 1.14 9.40 10.36 255.99 Goa self-employed in non-ag. 136.69 0.90 0.95 18.37 82.64 19.56 61.06 44.92 52.16 2.77 15.78 1.46 14.11 55.16 506.51 agricultural labour 116.36 0.20 0.01 10.01 25.79 12.03 69.52 25.39 44.49 0.67 15.52 1.50 17.91 25.71 365.12 other labour 123.59 0.42 0.48 20.33 38.23 22.28 65.02 33.59 41.52 2.29 15.03 1.51 18.24 56.13 438.64 self-employed in ag. 139.49 0.00 0.50 15.27 35.44 17.27 72.76 35.44 48.97 0.14 18.16 1.28 20.54 47.92 453.18 other households 140.04 0.31 0.39 15.45 52.67 22.00 100.14 41.10 54.52 3.97 16.18 1.58 19.08 61.91 529.36 not recorded - - - - - - - - - - - - - - - all types 131.78 0.38 0.44 16.05 47.65 19.60 78.85 36.79 49.03 2.51 15.93 1.51 18.10 52.25 470.85 Gujarat self-employed in non-ag. 81.10 0.70 0.02 22.16 79.78 35.75 4.86 39.86 7.26 0.94 16.99 0.70 14.48 29.02 333.63 agricultural labour 76.31 0.56 0.01 21.90 50.81 31.16 5.26 35.81 4.05 0.47 14.99 0.72 13.15 22.55 277.75 other labour 78.77 0.31 0.02 20.24 52.25 29.77 5.65 32.47 4.66 0.57 15.20 0.61 13.07 23.89 277.50 self-employed in ag. 85.47 0.77 0.13 24.60 106.47 37.88 3.28 39.81 9.06 2.97 19.30 0.71 14.59 29.80 374.85 other households 81.69 0.71 0.02 24.80 97.76 41.37 5.68 42.13 10.56 2.66 18.52 0.80 15.41 54.51 396.62 not recorded - - - - - - - - - - - - - - - all types 80.84 0.65 0.06 23.06 78.60 34.91 4.55 38.03 6.85 1.64 17.11 0.71 14.02 28.78 329.81
(Contd.)

Appendix Tables
NSS Report No.472: Differences in Level of Consumption among Socio-Economic Groups,1999-2000 A-127
Table 5R: Break-up of MPCE by broad groups of food items separately for each household type in rural areas and by State/UT Rural
average per capita consumption expenditure (Rs) per 30 days on
household type cereals gram
cereal substi- tutes
pulses &
products
milk &
milk products
edibile oil
meat, egg &
fish
vegeta- bles
fruits (fresh)
fruits (dry)
sugar salt spices
beve- rages,
refresh- ments etc,
food total
(1) (2) (3) (4) (5) (6) (7) (8) (9) (10) (11) (12) (13) (14) (15) (16) Haryana self-employed in non-ag. 71.95 1.50 0.00 20.26 143.42 16.11 4.30 33.91 9.01 1.06 31.72 1.12 12.09 23.35 369.79 agricultural labour 84.15 1.10 0.00 17.85 90.50 16.44 3.50 31.96 5.35 0.44 29.50 1.11 12.28 17.82 312.01 other labour 81.91 1.05 0.00 18.45 88.19 17.82 5.49 29.07 6.74 0.60 25.43 1.21 12.52 16.79 305.27 self-employed in ag. 78.53 1.16 0.00 20.77 213.09 12.24 1.54 37.93 11.02 2.39 32.98 1.12 14.15 24.46 451.40 other households 77.69 1.15 0.00 20.02 190.60 16.21 2.00 40.96 15.04 1.01 27.03 1.24 12.87 26.05 431.88 not recorded 65.19 0.43 0.00 35.99 452.72 7.30 0.71 57.42 18.41 0.00 30.56 1.76 14.69 104.20 789.39 all types 78.89 1.18 0.00 19.84 164.46 14.76 2.77 35.87 9.87 1.42 30.42 1.14 13.14 22.78 396.55 Himachal Pradesh self-employed in non-ag. 119.11 2.95 0.00 29.62 91.97 29.72 9.73 30.36 7.50 3.24 18.71 1.48 14.19 28.23 386.81 agricultural labour 114.87 2.37 0.00 29.78 53.44 20.20 7.25 23.71 3.29 0.03 17.18 1.41 12.71 18.90 305.13 other labour 112.91 2.75 0.00 26.27 66.20 23.81 6.87 25.44 4.48 1.31 16.84 1.43 13.28 27.45 329.03 self-employed in ag. 118.76 2.73 0.00 29.93 101.01 25.79 7.71 28.51 6.19 2.30 18.33 1.54 13.81 21.25 377.84 other households 115.67 3.33 0.00 31.72 117.40 32.68 13.00 38.97 13.46 3.78 21.63 1.51 16.30 52.68 462.14 not recorded 102.00 6.80 0.00 32.30 68.00 26.50 16.00 38.60 0.00 0.00 16.30 1.44 14.40 6.30 328.64 all types 117.16 2.86 0.00 29.61 95.29 27.00 8.77 29.94 7.26 2.44 18.68 1.50 14.17 28.64 383.33 Jammu & Kashmir self-employed in non-ag. 143.21 3.15 0.00 21.38 106.51 31.94 32.13 40.90 8.49 0.52 11.57 2.50 15.44 24.36 442.10 agricultural labour 142.19 1.51 0.00 19.50 63.85 28.06 24.64 36.22 12.69 2.24 10.15 2.75 15.84 19.56 379.19 other labour 126.46 1.43 0.00 23.22 68.11 27.50 20.30 35.00 6.23 0.48 12.95 1.58 14.57 21.83 359.66 self-employed in ag. 142.73 2.94 0.00 23.95 98.84 29.17 25.06 35.14 9.12 1.64 12.67 1.92 14.71 23.09 421.00 other households 143.83 3.06 0.00 24.92 91.30 32.76 24.30 51.91 14.00 2.39 14.88 2.01 17.42 34.60 457.37 not recorded 233.33 0.00 0.00 43.33 73.33 33.33 75.00 34.17 33.33 0.00 8.00 0.83 13.33 91.67 639.67 all types 141.89 2.79 0.00 23.53 93.91 30.02 25.38 39.20 10.06 1.62 12.85 2.03 15.39 25.25 423.92
(Contd.)

Appendix Tables
NSS Report No.472: Differences in Level of Consumption among Socio-Economic Groups,1999-2000 A-128
Table 5R: Break-up of MPCE by broad groups of food items separately for each household type in rural areas and by State/UT Rural
average per capita consumption expenditure (Rs) per 30 days on
household type cereals gram
cereal substi- tutes
pulses &
products
milk &
milk products
edibile oil
meat, egg &
fish
vegeta- bles
fruits (fresh)
fruits (dry)
sugar salt spices
beve- rages,
refresh- ments etc,
food total
(1) (2) (3) (4) (5) (6) (7) (8) (9) (10) (11) (12) (13) (14) (15) (16) Karnataka self-employed in non-ag. 106.82 1.07 0.02 23.03 41.28 19.49 23.75 25.39 15.55 3.29 12.69 1.12 16.04 38.54 328.09 agricultural labour 89.73 1.09 0.01 20.43 23.30 15.16 16.75 22.18 9.02 2.30 10.62 1.07 13.87 25.55 251.07 other labour 95.87 0.70 0.00 19.11 23.28 13.76 28.78 21.85 13.18 2.04 9.48 1.15 14.56 33.61 277.37 self-employed in ag. 114.63 1.31 0.03 25.77 41.38 18.28 16.79 24.46 14.26 3.94 12.97 1.11 14.61 28.95 318.49 other households 112.66 1.00 0.14 25.98 47.92 22.77 21.08 25.31 17.56 4.10 14.29 1.09 15.24 74.58 383.72 not recorded 169.36 0.00 0.00 6.94 24.40 9.69 14.69 18.28 3.38 0.00 16.13 1.19 13.94 9.83 287.83 all types 102.87 1.15 0.02 23.04 33.75 17.27 18.36 23.58 12.48 3.13 11.94 1.09 14.50 32.07 295.25 Kerala self-employed in non-ag. 112.50 1.83 3.46 14.34 42.59 21.42 67.11 29.67 38.30 1.25 12.29 1.04 19.80 58.59 424.19 agricultural labour 102.86 1.47 5.43 10.37 19.90 17.00 48.34 24.85 26.96 0.54 10.90 0.98 17.84 44.99 332.43 other labour 101.91 1.56 5.07 11.06 25.08 17.11 52.70 26.66 32.77 0.81 10.79 0.92 18.32 71.19 375.96 self-employed in ag. 128.10 2.54 6.18 16.57 56.40 24.10 75.35 34.82 49.27 1.33 14.13 1.10 22.28 42.79 474.97 other households 112.54 2.20 3.06 17.39 58.15 24.11 70.80 34.83 46.16 1.10 13.17 1.12 21.45 91.46 497.52 not recorded 108.50 0.00 1.55 8.37 27.56 17.20 42.89 19.15 17.91 0.00 10.59 0.78 18.67 21.00 294.18 all types 110.68 1.87 4.78 13.47 37.88 20.22 61.33 29.53 37.54 0.97 12.07 1.02 19.69 60.16 411.19 Madhya Pradesh self-employed in non-ag. 96.95 0.57 0.14 19.36 33.28 18.33 6.42 25.94 4.58 0.81 13.09 1.12 10.90 19.06 250.55 agricultural labour 98.01 0.24 0.10 14.47 15.87 12.72 4.98 21.45 2.20 0.26 8.64 0.99 9.28 8.47 197.66 other labour 88.37 0.54 0.13 14.55 19.20 11.89 5.55 18.13 2.74 0.19 9.50 0.91 9.93 11.52 193.15 self-employed in ag. 103.81 0.45 0.27 19.69 44.12 16.02 5.26 23.07 4.43 0.65 12.87 0.98 10.45 13.72 255.76 other households 98.85 0.21 0.12 19.58 39.90 17.00 8.47 29.16 4.84 0.48 14.00 1.01 13.86 26.63 274.12 not recorded 46.50 0.00 0.00 21.02 50.69 38.89 0.00 20.52 6.61 0.00 14.88 2.88 8.86 11.02 221.87 all types 100.29 0.37 0.18 17.59 31.97 14.92 5.45 22.88 3.60 0.49 11.31 0.99 10.25 12.94 233.23
(Contd.)

Appendix Tables
NSS Report No.472: Differences in Level of Consumption among Socio-Economic Groups,1999-2000 A-129
Table 5R: Break-up of MPCE by broad groups of food items separately for each household type in rural areas and by State/UT Rural
average per capita consumption expenditure (Rs) per 30 days on
household type cereals gram
cereal substi- tutes
pulses &
products
milk &
milk products
edibile oil
meat, egg &
fish
vegeta- bles
fruits (fresh)
fruits (dry)
sugar salt spices
beve- rages,
refresh- ments etc,
food total
(1) (2) (3) (4) (5) (6) (7) (8) (9) (10) (11) (12) (13) (14) (15) (16) Maharashtra self-employed in non-ag. 89.05 0.40 2.20 22.81 35.93 23.72 21.50 28.72 10.11 7.89 14.72 1.09 14.51 25.62 298.27 agricultural labour 80.83 0.28 1.37 22.82 17.37 17.56 11.67 22.65 4.58 4.93 13.54 1.02 13.08 15.02 226.72 other labour 98.02 1.07 2.62 23.71 30.13 24.84 21.12 31.67 8.55 7.34 13.98 1.11 15.00 27.70 306.85 self-employed in ag. 92.99 0.38 2.46 25.98 38.76 23.31 12.96 25.48 7.62 7.51 16.42 1.08 14.05 19.05 288.05 other households 92.79 0.59 2.69 24.19 49.06 29.06 19.86 32.98 12.57 9.32 16.80 1.26 15.04 48.98 355.19 not recorded 107.25 0.70 0.93 22.66 9.63 27.86 7.46 21.05 3.29 0.85 22.24 1.41 11.51 13.02 249.88 all types 87.83 0.41 2.01 23.98 29.93 21.66 14.55 25.86 7.17 6.64 14.91 1.08 13.86 21.90 271.78 Manipur self-employed in non-ag. 199.14 0.09 0.05 8.39 8.53 13.70 40.72 35.39 5.16 0.44 4.73 1.83 12.42 18.69 349.29 agricultural labour 206.72 0.00 0.03 6.33 2.02 9.79 25.19 26.59 3.61 0.00 3.23 1.79 10.93 13.20 309.44 other labour 190.31 0.00 0.07 9.81 3.05 14.32 41.09 37.42 4.57 0.36 6.59 1.77 12.68 12.96 335.00 self-employed in ag. 203.69 0.04 0.06 11.55 3.21 9.06 30.60 33.77 4.60 0.15 5.79 1.81 10.66 14.58 329.57 other households 213.57 0.19 0.08 9.51 11.25 14.11 40.60 33.71 5.11 0.23 5.13 1.85 13.02 21.67 370.01 not recorded 204.40 0.00 0.00 7.87 40.63 15.45 70.99 38.16 5.46 0.00 7.12 2.25 12.25 27.32 431.91 all types 205.25 0.07 0.06 10.45 5.46 10.80 33.79 33.59 4.70 0.19 5.42 1.82 11.42 16.41 339.43 Meghalaya self-employed in non-ag. 138.93 0.10 0.71 8.12 14.05 14.68 58.06 53.23 9.15 0.24 10.40 1.62 6.62 43.23 359.15 agricultural labour 127.28 0.00 0.67 5.86 1.40 11.00 52.86 47.05 7.31 0.00 10.56 1.19 6.40 34.11 305.70 other labour 124.43 0.00 0.47 8.11 5.59 17.31 67.78 54.00 6.54 0.02 9.80 1.19 7.41 21.02 323.66 self-employed in ag. 137.87 0.00 1.49 7.18 9.67 11.43 62.06 49.80 8.76 0.15 9.69 1.47 5.49 30.77 335.83 other households 139.43 0.02 0.42 7.65 17.59 17.17 72.29 52.18 10.26 0.02 12.17 1.18 6.85 49.64 386.86 not recorded 121.25 0.00 0.00 6.96 0.00 12.80 75.73 59.19 6.01 0.00 17.23 1.16 4.98 35.19 340.51 all types 136.71 0.01 1.19 7.19 10.00 12.46 62.33 50.17 8.77 0.12 10.16 1.41 5.87 34.12 340.51
(Contd.)

Appendix Tables
NSS Report No.472: Differences in Level of Consumption among Socio-Economic Groups,1999-2000 A-130
Table 5R: Break-up of MPCE by broad groups of food items separately for each household type in rural areas and by State/UT Rural
average per capita consumption expenditure (Rs) per 30 days on
household type cereals gram
cereal substi- tutes
pulses &
products
milk &
milk products
edibile oil
meat, egg &
fish
vegeta- bles
fruits (fresh)
fruits (dry)
sugar salt spices
beve- rages,
refresh- ments etc,
food total
(1) (2) (3) (4) (5) (6) (7) (8) (9) (10) (11) (12) (13) (14) (15) (16) Mizoram self-employed in non-ag. 162.09 0.35 0.13 27.89 49.36 26.35 101.96 86.03 11.31 0.59 17.07 3.58 13.37 57.73 557.81 agricultural labour 117.60 0.00 0.00 17.99 10.69 20.97 89.86 103.36 9.60 1.26 14.19 6.97 11.90 28.27 432.65 other labour 140.61 0.00 1.07 28.25 27.67 32.10 106.52 126.89 8.47 0.00 20.93 3.99 15.38 54.24 566.11 self-employed in ag. 142.52 0.15 0.55 17.69 12.15 18.06 61.64 82.94 7.79 0.19 13.79 2.92 10.09 26.77 397.25 other households 134.42 0.01 0.42 27.01 29.41 21.17 89.03 96.66 8.40 0.75 16.15 3.82 11.96 33.88 473.07 not recorded 132.73 0.00 0.00 17.89 18.10 25.21 61.24 121.02 11.89 0.00 17.55 3.64 11.85 13.78 434.89 all types 142.02 0.14 0.49 20.49 18.79 19.65 71.40 87.11 8.27 0.35 14.65 3.24 10.84 31.02 428.46 Nagaland self-employed in non-ag. 202.02 1.45 0.00 20.08 68.01 21.01 118.50 94.54 21.25 0.10 12.49 2.34 17.05 102.82 681.66 agricultural labour 273.21 0.18 0.00 29.62 26.22 11.81 79.04 88.67 27.08 0.00 11.73 2.34 15.57 32.01 597.49 other labour 176.25 0.00 0.00 11.95 21.14 7.21 94.75 71.88 23.40 0.00 11.00 1.93 18.71 53.12 491.35 self-employed in ag. 218.71 0.95 0.00 18.67 31.21 10.69 102.09 87.24 16.22 0.01 13.93 2.68 10.27 36.57 549.24 other households 195.33 1.52 0.18 18.34 42.83 13.15 100.79 77.17 20.88 0.22 13.16 2.29 11.04 52.32 549.23 not recorded 194.10 0.00 0.00 19.70 46.92 5.68 106.84 50.18 23.98 0.00 5.72 1.48 4.30 59.21 518.12 all types 209.70 1.11 0.06 18.60 36.58 11.85 102.06 83.58 18.40 0.08 13.40 2.50 11.12 45.66 554.68 Orissa self-employed in non-ag. 141.04 0.10 0.02 11.91 8.27 11.64 15.25 33.53 3.93 0.13 6.49 1.10 8.43 14.93 256.80 agricultural labour 130.28 0.16 0.05 7.32 2.28 8.74 9.22 26.57 2.12 0.07 4.49 1.14 7.20 6.95 206.60 other labour 131.74 0.07 0.08 10.91 7.04 10.91 14.23 32.49 4.14 0.06 5.66 1.11 7.89 15.25 241.58 self-employed in ag. 138.06 0.28 0.10 12.01 10.00 11.95 16.69 32.73 4.01 0.18 6.48 1.10 7.96 10.70 252.24 other households 133.70 0.32 0.00 17.10 22.29 14.85 19.49 40.35 6.56 0.61 9.20 1.28 10.30 32.42 308.47 not recorded 137.09 0.02 0.00 6.05 5.87 6.53 6.07 16.04 1.69 0.15 2.96 1.10 4.74 5.98 194.30 all types 134.38 0.21 0.06 10.54 7.81 10.83 13.57 31.02 3.49 0.17 5.91 1.14 7.94 12.18 239.25
(Contd.)

Appendix Tables
NSS Report No.472: Differences in Level of Consumption among Socio-Economic Groups,1999-2000 A-131
Table 5R: Break-up of MPCE by broad groups of food items separately for each household type in rural areas and by State/UT Rural
average per capita consumption expenditure (Rs) per 30 days on
household type cereals gram
cereal substi- tutes
pulses &
products
milk &
milk products
edibile oil
meat, egg &
fish
vegeta- bles
fruits (fresh)
fruits (dry)
sugar salt spices
beve- rages,
refresh- ments etc,
food total
(1) (2) (3) (4) (5) (6) (7) (8) (9) (10) (11) (12) (13) (14) (15) (16) Punjab self-employed in non-ag. 71.23 3.07 0.00 21.44 106.47 23.81 4.40 36.27 10.40 1.63 28.74 1.14 15.15 29.43 353.17 agricultural labour 71.37 2.50 0.00 19.21 80.81 18.36 4.86 28.41 4.26 0.95 26.32 1.34 11.89 26.91 297.18 other labour 73.57 2.89 0.00 22.92 81.21 23.81 6.38 32.86 6.38 0.93 29.46 1.19 14.16 31.95 327.71 self-employed in ag. 75.89 3.58 0.00 24.66 180.63 21.77 5.91 39.66 12.00 2.70 37.72 1.39 35.15 35.09 476.17 other households 76.45 3.31 0.00 24.34 139.39 26.98 7.22 41.75 13.82 1.63 31.98 1.41 15.91 36.26 420.46 not recorded - - - - - - - - - - - - - - - all types 73.86 3.11 0.00 22.50 127.90 22.09 5.64 35.83 9.45 1.75 31.72 1.32 21.18 31.93 388.27 Rajasthan self-employed in non-ag. 95.87 0.50 0.00 14.86 101.27 19.76 6.44 28.13 5.33 1.92 16.89 1.05 15.28 20.02 327.32 agricultural labour 94.79 0.23 0.00 12.23 75.92 16.55 6.09 23.72 2.36 0.45 18.47 1.17 15.12 15.13 282.24 other labour 95.86 0.15 0.00 12.67 64.76 15.23 6.70 22.13 3.09 0.45 13.80 1.13 14.96 15.95 266.88 self-employed in ag. 99.85 0.56 0.00 13.71 125.37 17.94 3.35 24.92 3.68 1.29 18.04 1.08 14.70 16.66 341.16 other households 96.82 0.25 0.00 15.75 126.57 21.55 6.16 31.72 6.63 2.54 20.08 1.12 15.97 27.05 372.23 not recorded - - - - - - - - - - - - - - - all types 98.14 0.45 0.00 13.76 109.86 17.96 4.66 25.37 3.93 1.28 17.48 1.09 14.94 17.67 326.60 Sikkim self-employed in non-ag. 100.39 1.33 0.00 17.36 48.08 21.87 32.95 53.32 6.93 1.09 6.71 1.25 8.06 29.92 329.26 agricultural labour 87.14 1.14 0.00 11.35 33.72 16.07 30.86 48.88 2.70 0.31 3.89 1.41 6.85 14.47 258.81 other labour 90.67 0.28 0.00 14.56 45.19 19.83 37.76 45.56 2.83 0.22 5.53 1.22 7.72 38.37 309.74 self-employed in ag. 93.38 0.17 0.00 10.44 41.47 18.37 28.34 47.54 2.10 0.08 3.93 1.16 7.79 18.68 273.44 other households 87.93 1.63 0.00 16.76 61.90 22.52 51.32 54.26 8.13 0.37 7.25 1.43 8.76 61.18 383.45 not recorded - - - - - - - - - - - - - - - all types 91.76 0.70 0.00 12.71 45.62 19.34 34.58 49.45 3.88 0.26 4.96 1.26 7.89 29.46 301.88
(Contd.)
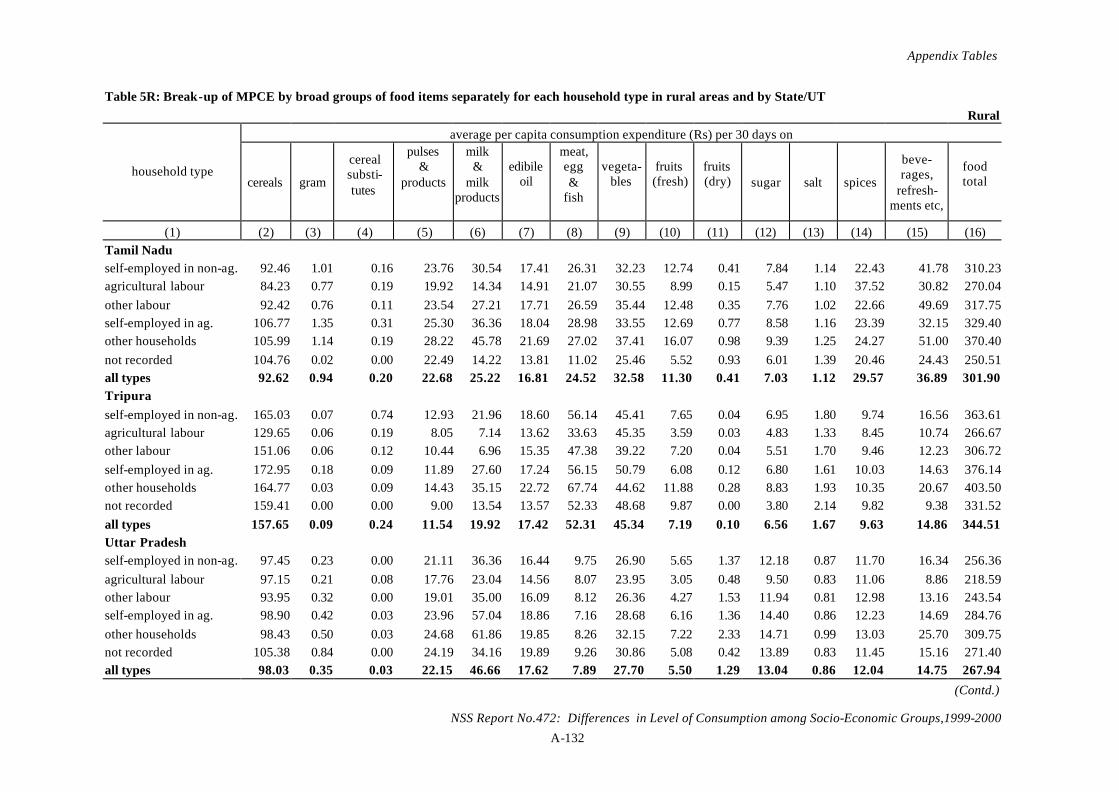
Appendix Tables
NSS Report No.472: Differences in Level of Consumption among Socio-Economic Groups,1999-2000 A-132
Table 5R: Break-up of MPCE by broad groups of food items separately for each household type in rural areas and by State/UT Rural
average per capita consumption expenditure (Rs) per 30 days on
household type cereals gram
cereal substi- tutes
pulses &
products
milk &
milk products
edibile oil
meat, egg &
fish
vegeta- bles
fruits (fresh)
fruits (dry)
sugar salt spices
beve- rages,
refresh- ments etc,
food total
(1) (2) (3) (4) (5) (6) (7) (8) (9) (10) (11) (12) (13) (14) (15) (16) Tamil Nadu self-employed in non-ag. 92.46 1.01 0.16 23.76 30.54 17.41 26.31 32.23 12.74 0.41 7.84 1.14 22.43 41.78 310.23 agricultural labour 84.23 0.77 0.19 19.92 14.34 14.91 21.07 30.55 8.99 0.15 5.47 1.10 37.52 30.82 270.04 other labour 92.42 0.76 0.11 23.54 27.21 17.71 26.59 35.44 12.48 0.35 7.76 1.02 22.66 49.69 317.75 self-employed in ag. 106.77 1.35 0.31 25.30 36.36 18.04 28.98 33.55 12.69 0.77 8.58 1.16 23.39 32.15 329.40 other households 105.99 1.14 0.19 28.22 45.78 21.69 27.02 37.41 16.07 0.98 9.39 1.25 24.27 51.00 370.40 not recorded 104.76 0.02 0.00 22.49 14.22 13.81 11.02 25.46 5.52 0.93 6.01 1.39 20.46 24.43 250.51 all types 92.62 0.94 0.20 22.68 25.22 16.81 24.52 32.58 11.30 0.41 7.03 1.12 29.57 36.89 301.90 Tripura self-employed in non-ag. 165.03 0.07 0.74 12.93 21.96 18.60 56.14 45.41 7.65 0.04 6.95 1.80 9.74 16.56 363.61 agricultural labour 129.65 0.06 0.19 8.05 7.14 13.62 33.63 45.35 3.59 0.03 4.83 1.33 8.45 10.74 266.67 other labour 151.06 0.06 0.12 10.44 6.96 15.35 47.38 39.22 7.20 0.04 5.51 1.70 9.46 12.23 306.72 self-employed in ag. 172.95 0.18 0.09 11.89 27.60 17.24 56.15 50.79 6.08 0.12 6.80 1.61 10.03 14.63 376.14 other households 164.77 0.03 0.09 14.43 35.15 22.72 67.74 44.62 11.88 0.28 8.83 1.93 10.35 20.67 403.50 not recorded 159.41 0.00 0.00 9.00 13.54 13.57 52.33 48.68 9.87 0.00 3.80 2.14 9.82 9.38 331.52 all types 157.65 0.09 0.24 11.54 19.92 17.42 52.31 45.34 7.19 0.10 6.56 1.67 9.63 14.86 344.51 Uttar Pradesh self-employed in non-ag. 97.45 0.23 0.00 21.11 36.36 16.44 9.75 26.90 5.65 1.37 12.18 0.87 11.70 16.34 256.36 agricultural labour 97.15 0.21 0.08 17.76 23.04 14.56 8.07 23.95 3.05 0.48 9.50 0.83 11.06 8.86 218.59 other labour 93.95 0.32 0.00 19.01 35.00 16.09 8.12 26.36 4.27 1.53 11.94 0.81 12.98 13.16 243.54 self-employed in ag. 98.90 0.42 0.03 23.96 57.04 18.86 7.16 28.68 6.16 1.36 14.40 0.86 12.23 14.69 284.76 other households 98.43 0.50 0.03 24.68 61.86 19.85 8.26 32.15 7.22 2.33 14.71 0.99 13.03 25.70 309.75 not recorded 105.38 0.84 0.00 24.19 34.16 19.89 9.26 30.86 5.08 0.42 13.89 0.83 11.45 15.16 271.40 all types 98.03 0.35 0.03 22.15 46.66 17.62 7.89 27.70 5.50 1.29 13.04 0.86 12.04 14.75 267.94
(Contd.)

Appendix Tables
NSS Report No.472: Differences in Level of Consumption among Socio-Economic Groups,1999-2000 A-133
Table 5R: Break-up of MPCE by broad groups of food items separately for each household type in rural areas and by State/UT Rural
average per capita consumption expenditure (Rs) per 30 days on
household type cereals gram
cereal substi- tutes
pulses &
products
milk &
milk products
edibile oil
meat, egg &
fish
vegeta- bles
fruits (fresh)
fruits (dry)
sugar salt spices
beve- rages,
refresh- ments etc,
food total
(1) (2) (3) (4) (5) (6) (7) (8) (9) (10) (11) (12) (13) (14) (15) (16) West Bengal self-employed in non-ag. 138.69 0.04 0.01 12.11 14.82 18.96 37.22 40.62 4.72 0.15 6.93 1.23 10.66 14.04 300.21 agricultural labour 138.67 0.03 0.05 9.50 6.71 16.00 26.14 35.57 2.19 0.13 5.67 1.16 9.30 11.64 262.77 other labour 142.97 0.25 0.03 11.53 11.61 17.48 35.91 43.31 3.49 0.16 7.01 1.41 10.31 15.42 300.89 self-employed in ag. 150.96 0.10 0.01 13.17 22.13 19.90 39.72 41.46 4.92 0.25 7.36 1.49 10.36 12.52 324.36 other households 150.20 0.26 0.00 15.08 30.41 24.71 59.07 48.61 10.15 0.40 8.97 1.66 12.38 28.22 390.13 not recorded 124.70 0.41 0.00 13.21 12.19 17.55 32.72 31.51 2.97 0.90 6.95 1.23 7.61 7.29 259.23 all types 142.76 0.09 0.02 11.60 14.65 18.48 35.46 39.71 4.22 0.19 6.73 1.32 10.19 14.11 299.53 A. & N. Islands self-employed in non-ag. 127.27 0.49 0.17 28.76 58.74 35.01 55.99 63.51 11.63 0.63 17.08 2.51 18.93 106.14 526.85 agricultural labour 122.44 1.10 1.58 26.48 30.63 37.85 63.17 64.88 10.45 0.07 12.72 2.53 22.14 36.91 432.95 other labour 119.26 0.27 0.15 30.54 48.21 41.11 67.75 67.14 14.63 0.00 11.04 2.68 22.96 86.95 512.70 self-employed in ag. 130.34 0.00 1.34 31.77 30.50 36.26 70.82 58.88 16.90 0.17 12.51 2.50 20.15 41.81 453.95 other households 118.78 0.02 0.38 34.72 47.52 43.44 87.95 56.17 21.25 0.51 12.33 2.44 22.27 96.66 544.45 not recorded - - - - - - - - - - - - - - - all types 125.00 0.26 0.90 30.85 38.60 38.40 70.00 61.71 15.58 0.19 12.47 2.54 21.28 62.52 480.31 Chandigarh self-employed in non-ag. 98.81 0.80 0.00 30.41 92.10 29.05 30.77 59.57 17.27 0.85 20.59 9.67 14.80 50.63 455.32 agricultural labour 110.36 0.80 0.00 28.38 54.19 30.35 12.06 65.07 20.16 0.60 17.18 1.72 18.12 38.01 397.00 other labour 88.09 1.79 0.00 34.91 66.66 30.43 17.29 45.25 8.43 0.49 21.75 1.55 20.10 41.73 378.46 self-employed in ag. 40.17 4.92 0.00 25.22 445.14 16.56 1.00 32.63 61.90 0.00 55.47 0.11 10.47 36.12 729.71 other households 85.21 3.68 0.00 28.03 111.40 30.86 7.04 48.23 18.92 0.22 23.46 1.47 17.38 62.38 438.29 not recorded - - - - - - - - - - - - - - - all types 84.90 2.58 0.00 29.20 144.96 28.11 13.52 50.04 23.83 0.42 26.74 3.11 16.24 49.44 473.07
(Contd.)
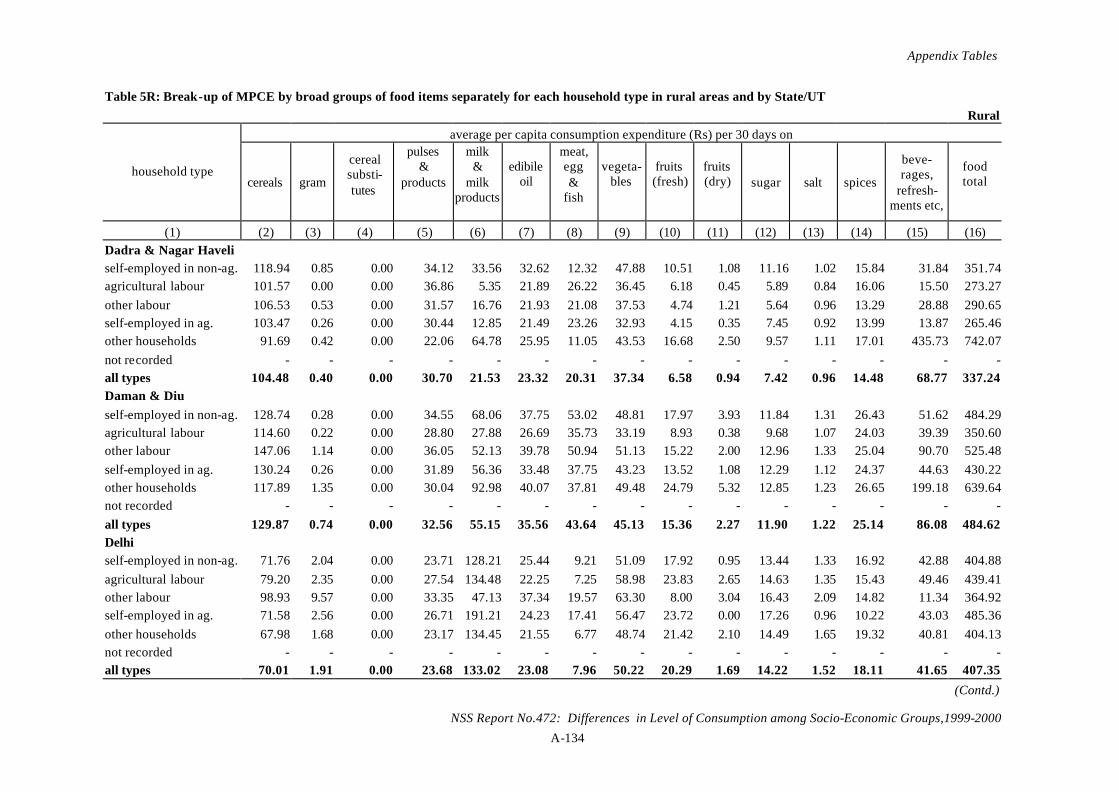
Appendix Tables
NSS Report No.472: Differences in Level of Consumption among Socio-Economic Groups,1999-2000 A-134
Table 5R: Break-up of MPCE by broad groups of food items separately for each household type in rural areas and by State/UT Rural
average per capita consumption expenditure (Rs) per 30 days on
household type cereals gram
cereal substi- tutes
pulses &
products
milk &
milk products
edibile oil
meat, egg &
fish
vegeta- bles
fruits (fresh)
fruits (dry)
sugar salt spices
beve- rages,
refresh- ments etc,
food total
(1) (2) (3) (4) (5) (6) (7) (8) (9) (10) (11) (12) (13) (14) (15) (16) Dadra & Nagar Haveli self-employed in non-ag. 118.94 0.85 0.00 34.12 33.56 32.62 12.32 47.88 10.51 1.08 11.16 1.02 15.84 31.84 351.74 agricultural labour 101.57 0.00 0.00 36.86 5.35 21.89 26.22 36.45 6.18 0.45 5.89 0.84 16.06 15.50 273.27 other labour 106.53 0.53 0.00 31.57 16.76 21.93 21.08 37.53 4.74 1.21 5.64 0.96 13.29 28.88 290.65 self-employed in ag. 103.47 0.26 0.00 30.44 12.85 21.49 23.26 32.93 4.15 0.35 7.45 0.92 13.99 13.87 265.46 other households 91.69 0.42 0.00 22.06 64.78 25.95 11.05 43.53 16.68 2.50 9.57 1.11 17.01 435.73 742.07 not recorded - - - - - - - - - - - - - - - all types 104.48 0.40 0.00 30.70 21.53 23.32 20.31 37.34 6.58 0.94 7.42 0.96 14.48 68.77 337.24 Daman & Diu self-employed in non-ag. 128.74 0.28 0.00 34.55 68.06 37.75 53.02 48.81 17.97 3.93 11.84 1.31 26.43 51.62 484.29 agricultural labour 114.60 0.22 0.00 28.80 27.88 26.69 35.73 33.19 8.93 0.38 9.68 1.07 24.03 39.39 350.60 other labour 147.06 1.14 0.00 36.05 52.13 39.78 50.94 51.13 15.22 2.00 12.96 1.33 25.04 90.70 525.48 self-employed in ag. 130.24 0.26 0.00 31.89 56.36 33.48 37.75 43.23 13.52 1.08 12.29 1.12 24.37 44.63 430.22 other households 117.89 1.35 0.00 30.04 92.98 40.07 37.81 49.48 24.79 5.32 12.85 1.23 26.65 199.18 639.64 not recorded - - - - - - - - - - - - - - - all types 129.87 0.74 0.00 32.56 55.15 35.56 43.64 45.13 15.36 2.27 11.90 1.22 25.14 86.08 484.62 Delhi self-employed in non-ag. 71.76 2.04 0.00 23.71 128.21 25.44 9.21 51.09 17.92 0.95 13.44 1.33 16.92 42.88 404.88 agricultural labour 79.20 2.35 0.00 27.54 134.48 22.25 7.25 58.98 23.83 2.65 14.63 1.35 15.43 49.46 439.41 other labour 98.93 9.57 0.00 33.35 47.13 37.34 19.57 63.30 8.00 3.04 16.43 2.09 14.82 11.34 364.92 self-employed in ag. 71.58 2.56 0.00 26.71 191.21 24.23 17.41 56.47 23.72 0.00 17.26 0.96 10.22 43.03 485.36 other households 67.98 1.68 0.00 23.17 134.45 21.55 6.77 48.74 21.42 2.10 14.49 1.65 19.32 40.81 404.13 not recorded - - - - - - - - - - - - - - - all types 70.01 1.91 0.00 23.68 133.02 23.08 7.96 50.22 20.29 1.69 14.22 1.52 18.11 41.65 407.35
(Contd.)

Appendix Tables
NSS Report No.472: Differences in Level of Consumption among Socio-Economic Groups,1999-2000 A-135
Table 5R: Break-up of MPCE by broad groups of food items separately for each household type in rural areas and by State/UT Rural
average per capita consumption expenditure (Rs) per 30 days on
household type cereals gram
cereal substi- tutes
pulses &
products
milk &
milk products
edibile oil
meat, egg &
fish
vegeta- bles
fruits (fresh)
fruits (dry)
sugar salt spices
beve- rages,
refresh- ments etc,
food total
(1) (2) (3) (4) (5) (6) (7) (8) (9) (10) (11) (12) (13) (14) (15) (16) Lakshadweep self-employed in non-ag. 126.14 0.00 0.00 29.41 34.07 28.19 162.00 67.08 71.63 2.80 30.85 1.83 32.61 85.51 672.11 agricultural labour 129.50 2.63 0.00 12.79 20.06 18.50 92.71 36.97 46.18 1.68 24.10 1.43 23.40 84.24 494.18 other labour 102.48 3.54 0.00 5.56 16.49 24.40 71.24 36.19 54.80 2.69 25.94 1.30 18.74 107.38 470.77 self-employed in ag. 118.20 4.04 0.00 16.11 38.20 39.20 109.02 39.43 64.60 1.86 38.11 2.00 28.18 88.85 587.81 other households 108.23 2.69 0.00 8.78 29.94 30.11 118.13 32.84 55.85 3.83 32.93 1.24 22.98 98.41 545.94 not recorded - - - - - - - - - - - - - - - all types 112.03 3.08 0.00 10.95 29.30 30.54 107.86 36.14 57.47 2.97 32.42 1.47 23.91 95.89 544.02 Pondicherry self-employed in non-ag. 115.99 1.58 0.03 26.89 33.90 15.83 39.84 35.09 13.09 1.92 9.05 1.59 26.65 38.64 360.08 agricultural labour 93.88 1.45 0.08 19.07 19.81 13.38 31.94 31.55 7.98 0.60 4.66 1.40 20.69 29.18 275.67 other labour 96.17 2.16 0.00 22.34 27.32 13.75 33.97 35.87 12.84 0.94 6.85 1.90 24.34 80.15 358.61 self-employed in ag. 154.37 2.96 0.06 32.08 52.50 18.99 46.79 43.17 17.89 1.53 11.11 1.71 28.43 38.32 449.91 other households 133.99 1.44 0.01 30.03 52.40 21.18 63.24 48.10 24.15 2.75 11.08 1.80 26.96 43.22 460.34 not recorded - - - - - - - - - - - - - - - all types 106.63 1.69 0.05 22.99 29.62 15.21 38.66 35.88 12.41 1.18 6.90 1.59 23.44 42.04 338.30 all-India self-employed in non-ag. 109.54 0.65 0.28 18.22 39.95 18.86 19.97 31.49 7.88 1.34 11.29 1.10 13.01 22.43 296.00 agricultural labour 103.40 0.47 0.32 15.83 20.13 15.57 14.04 27.17 4.46 1.08 8.87 1.05 13.39 15.50 241.29 other labour 103.08 0.67 0.75 16.69 32.28 17.32 20.28 28.86 8.29 1.27 10.89 1.08 13.94 26.60 282.01 self-employed in ag. 110.66 0.72 0.32 20.52 59.16 19.14 14.04 30.22 7.10 1.69 13.47 1.07 13.00 17.78 308.92 other households 111.06 0.83 0.42 20.91 61.09 22.27 22.24 36.61 11.38 2.26 13.73 1.25 14.32 38.20 356.58 not recorded 118.77 0.37 0.04 17.74 39.53 16.41 19.03 30.51 4.66 0.57 9.70 1.22 10.49 16.18 285.21 all types 107.75 0.64 0.36 18.50 42.56 18.16 16.14 29.98 6.89 1.47 11.57 1.09 13.32 20.38 288.80

Appendix Tables
NSS Report No.472: Differences in Level of Consumption among Socio-Economic Groups,1999-2000 A-136
Table 5U: Break-up of MPCE by broad groups of food items separately for each household type in urban areas and by State/UT Urban average per capita consumption expenditure (Rs) per 30 days on
household type cereals gram
cereal substi- tutes
pulses &
products
milk &
milk products
edibile oil
meat, egg &
fish
vegeta- bles
fruits (fresh)
fruits (dry)
sugar salt spices
beve- rages,
refresh- ments etc,
food total
(1) (2) (3) (4) (5) (6) (7) (8) (9) (10) (11) (12) (13) (14) (15) (16) Andhra Pradesh self-employed 116.61 0.24 0.00 22.76 52.99 21.44 24.73 31.14 9.91 3.05 8.85 1.41 15.99 41.33 350.44 regular wage/salarid 128.58 0.23 0.00 27.75 65.22 25.58 30.95 36.46 12.52 3.80 10.74 1.57 17.13 50.12 410.64 casual labour 112.57 0.14 0.00 16.49 26.15 17.04 21.95 27.73 4.63 1.44 6.71 1.18 15.50 28.35 279.87 other households 115.89 0.38 0.00 23.85 63.30 21.63 22.32 32.63 13.58 2.67 9.08 1.47 15.94 132.10 454.84 not recorded 105.17 0.00 0.00 17.31 40.31 19.49 26.09 26.20 9.35 2.56 9.63 1.51 17.31 22.71 297.64 all types 120.50 0.22 0.00 23.56 53.15 22.22 26.51 32.66 10.13 3.00 9.20 1.43 16.35 48.00 366.95 Arunachal Pradesh self-employed 116.61 0.24 0.00 22.76 52.99 21.44 24.73 31.14 9.91 3.05 8.85 1.41 15.99 41.33 350.44 regular wage/salarid 128.58 0.23 0.00 27.75 65.22 25.58 30.95 36.46 12.52 3.80 10.74 1.57 17.13 50.12 410.64 casual labour 112.57 0.14 0.00 16.49 26.15 17.04 21.95 27.73 4.63 1.44 6.71 1.18 15.50 28.35 279.87 other households 115.89 0.38 0.00 23.85 63.30 21.63 22.32 32.63 13.58 2.67 9.08 1.47 15.94 132.10 454.84 not recorded 105.17 0.00 0.00 17.31 40.31 19.49 26.09 26.20 9.35 2.56 9.63 1.51 17.31 22.71 297.64 all types 120.50 0.22 0.00 23.56 53.15 22.22 26.51 32.66 10.13 3.00 9.20 1.43 16.35 48.00 366.95 Assam self-employed 149.18 0.32 0.00 18.07 41.38 23.03 57.23 45.81 10.44 0.54 9.96 1.69 11.16 38.55 407.36 regular wage/salarid 158.68 1.43 0.00 21.97 53.50 29.99 87.61 55.61 16.44 0.80 11.86 1.73 14.21 67.30 521.12 casual labour 134.92 0.25 0.00 16.38 6.75 15.43 34.20 37.29 2.77 0.04 7.45 1.64 9.97 37.99 305.07 other households 170.57 0.33 0.00 20.00 47.46 29.09 81.41 46.80 13.99 1.10 10.72 1.90 12.77 64.38 500.51 not recorded 176.85 3.17 0.00 35.24 55.65 47.97 109.90 74.93 18.68 0.00 19.94 2.22 41.71 53.15 639.41 all types 153.87 0.73 0.00 19.63 43.07 25.64 69.15 48.78 12.32 0.65 10.53 1.73 12.48 52.22 450.82
(Contd.)

Appendix Tables
NSS Report No.472: Differences in Level of Consumption among Socio-Economic Groups,1999-2000 A-137
Table 5U: Break-up of MPCE by broad groups of food items separately for each household type in urban areas and by State/UT Urban average per capita consumption expenditure (Rs) per 30 days on
household type cereals gram
cereal substi- tutes
pulses &
products
milk &
milk products
edibile oil
meat, egg &
fish
vegeta- bles
fruits (fresh)
fruits (dry)
sugar salt spices
beve- rages,
refresh- ments etc,
food total
(1) (2) (3) (4) (5) (6) (7) (8) (9) (10) (11) (12) (13) (14) (15) (16) Bihar self-employed 129.82 1.22 0.00 19.22 39.57 20.14 15.92 38.40 6.70 2.20 8.96 1.26 10.84 21.68 315.94 regular wage/salarid 131.52 1.54 0.01 22.67 67.89 27.83 29.22 44.93 11.77 4.46 13.85 1.73 13.56 43.70 414.69 casual labour 115.48 0.78 0.00 13.86 16.95 13.72 10.38 29.26 1.86 0.09 6.02 1.04 8.37 11.03 228.81 other households 127.58 1.54 0.01 21.50 56.80 24.11 18.72 40.41 10.02 3.59 10.32 1.61 11.51 57.46 385.19 not recorded 130.82 1.05 0.00 20.08 38.94 21.32 27.48 32.52 3.51 2.01 10.99 1.69 10.19 28.86 329.45 all types 128.31 1.31 0.00 19.92 47.70 22.23 19.81 39.49 8.06 2.81 10.30 1.42 11.45 31.70 344.53 Goa self-employed 121.50 1.77 0.12 31.10 74.73 31.13 107.09 49.12 70.54 8.37 16.24 1.42 23.24 61.79 598.17 regular wage/salarid 126.43 1.89 0.11 28.93 84.82 28.39 113.98 52.67 63.89 4.77 18.56 1.51 24.07 82.24 632.26 casual labour 118.78 1.05 0.04 24.39 31.72 21.42 71.14 39.70 36.76 1.35 12.72 1.23 20.20 64.01 444.52 other households 123.59 0.96 0.00 27.68 71.93 26.98 121.53 46.93 62.26 3.82 14.29 1.45 24.95 69.53 595.89 not recorded - - - - - - - - - - - - - - - all types 124.07 1.67 0.09 28.53 73.48 27.69 106.19 49.53 60.66 4.84 16.91 1.45 23.34 74.59 593.04 Gujarat self-employed 83.60 0.96 0.21 25.77 117.06 47.09 9.25 52.01 17.60 5.45 17.63 0.92 16.46 49.32 443.33 regular wage/salarid 85.45 1.16 0.34 28.28 124.99 47.37 9.58 56.65 19.79 5.97 18.72 1.05 17.07 57.70 474.10 casual labour 78.74 0.88 0.34 23.52 65.46 36.92 9.77 48.20 8.37 1.25 15.32 0.74 16.35 35.37 341.26 other households 68.60 0.74 0.27 23.85 122.12 37.05 4.98 50.41 23.97 4.26 16.15 0.94 14.75 197.73 565.81 not recorded 80.25 0.00 0.00 36.25 252.50 60.00 73.75 81.88 48.00 0.00 32.00 1.20 13.32 118.50 797.65 all types 82.69 1.01 0.28 26.20 110.88 44.87 9.27 52.97 17.04 4.82 17.55 0.94 16.59 56.94 442.06
(Contd.)

Appendix Tables
NSS Report No.472: Differences in Level of Consumption among Socio-Economic Groups,1999-2000 A-138
Table 5U: Break-up of MPCE by broad groups of food items separately for each household type in urban areas and by State/UT Urban average per capita consumption expenditure (Rs) per 30 days on
household type cereals gram
cereal substi- tutes
pulses &
products
milk &
milk products
edibile oil
meat, egg &
fish
vegeta- bles
fruits (fresh)
fruits (dry)
sugar salt spices
beve- rages,
refresh- ments etc,
food total
(1) (2) (3) (4) (5) (6) (7) (8) (9) (10) (11) (12) (13) (14) (15) (16) Haryana self-employed 73.69 2.19 0.00 21.25 159.21 22.68 3.67 39.29 19.18 3.37 22.10 1.23 14.44 37.29 419.59 regular wage/salarid 85.27 1.84 0.00 24.31 151.45 28.59 12.66 47.28 19.85 3.72 23.05 1.36 16.57 42.26 458.20 casual labour 82.64 1.31 0.00 18.08 89.62 23.71 8.50 32.94 4.52 0.32 21.91 1.04 12.99 22.35 319.94 other households 69.63 1.81 0.00 20.28 172.41 24.58 2.40 44.55 26.10 7.60 26.33 1.23 18.35 32.51 447.77 not recorded 44.47 0.98 0.00 12.90 117.60 7.79 0.00 18.94 3.83 0.47 14.71 0.67 6.40 13.97 242.74 all types 78.30 1.91 0.00 21.69 147.09 24.78 7.31 41.20 17.58 3.28 22.56 1.24 15.10 36.32 418.37 Himachal Pradesh self-employed 117.48 3.38 0.00 31.19 157.03 35.26 13.66 43.39 18.58 6.37 20.92 1.44 16.13 52.25 517.08 regular wage/salarid 119.26 4.31 0.00 34.88 169.17 37.45 18.34 51.34 25.19 10.40 20.54 1.74 20.77 86.94 600.32 casual labour 125.94 3.32 0.00 33.11 71.68 26.55 16.77 40.53 6.01 0.75 18.10 1.73 17.94 46.64 409.07 other households 82.17 3.38 0.00 24.36 133.93 26.76 21.35 39.04 29.57 8.07 13.93 1.28 14.18 199.30 597.33 not recorded 190.00 10.00 0.00 88.50 170.00 37.50 40.00 175.00 55.00 0.00 36.00 6.00 45.50 110.00 963.50 all types 111.19 3.79 0.00 31.48 151.21 33.74 17.62 45.77 22.99 8.10 19.03 1.56 17.88 99.14 563.49 Jammu & Kashmir self-employed 146.42 2.63 0.00 23.16 107.60 31.15 45.76 52.06 21.45 2.14 10.69 1.59 17.73 45.24 507.61 regular wage/salarid 152.98 1.71 0.00 22.82 123.09 35.07 52.36 57.43 27.45 3.33 11.94 1.92 18.84 58.16 567.12 casual labour 134.68 1.24 0.00 20.14 64.71 27.26 46.88 51.93 13.36 0.50 7.61 6.19 16.44 30.90 421.84 other households 160.77 2.20 0.00 32.51 134.90 36.06 33.12 62.80 24.38 4.08 13.96 1.59 17.81 44.87 569.04 not recorded 142.42 2.74 0.00 30.24 113.48 34.85 46.58 63.85 42.26 2.66 12.48 1.50 25.08 35.73 553.86 all types 149.04 2.06 0.00 23.36 111.78 32.80 47.86 55.14 23.45 2.62 11.14 2.21 18.10 49.32 528.88
(Contd.)

Appendix Tables
NSS Report No.472: Differences in Level of Consumption among Socio-Economic Groups,1999-2000 A-139
Table 5U: Break-up of MPCE by broad groups of food items separately for each household type in urban areas and by State/UT Urban average per capita consumption expenditure (Rs) per 30 days on
household type cereals gram
cereal substi- tutes
pulses &
products
milk &
milk products
edibile oil
meat, egg &
fish
vegeta- bles
fruits (fresh)
fruits (dry)
sugar salt spices
beve- rages,
refresh- ments etc,
food total
(1) (2) (3) (4) (5) (6) (7) (8) (9) (10) (11) (12) (13) (14) (15) (16) Karnataka self-employed 120.62 1.06 0.06 28.08 63.69 24.67 32.13 30.87 19.64 4.97 13.95 1.27 17.04 58.77 416.82 regular wage/salarid 121.53 0.98 0.06 30.08 72.67 27.06 30.16 35.59 21.52 5.48 14.64 1.48 19.15 84.49 464.88 casual labour 104.74 0.90 0.07 20.33 28.30 16.79 27.87 25.27 12.46 1.14 10.90 1.12 14.57 38.22 302.68 other households 118.81 1.40 0.01 28.55 67.83 24.78 21.94 33.42 26.36 5.29 13.43 1.40 16.75 122.67 482.63 not recorded 115.82 0.17 0.00 22.90 54.66 17.61 22.40 38.27 10.73 1.96 12.70 1.46 17.96 41.10 357.73 all types 118.17 1.02 0.06 27.62 61.70 24.32 29.86 32.07 19.66 4.55 13.68 1.34 17.48 70.41 421.94 Kerala self-employed 111.00 2.70 2.24 17.58 55.30 23.83 79.70 34.45 43.92 1.50 12.83 1.06 20.81 62.53 469.43 regular wage/salarid 111.91 3.01 1.93 21.21 63.16 25.87 69.50 40.31 46.27 1.45 13.31 1.19 21.50 99.11 519.73 casual labour 94.93 1.94 2.65 12.28 25.58 18.80 53.57 25.09 29.87 0.69 11.04 0.92 18.01 60.97 356.34 other households 101.21 2.46 1.46 17.77 63.69 25.59 93.21 34.33 46.27 5.03 13.68 1.20 19.89 153.65 579.43 not recorded 96.95 3.65 1.83 16.70 59.37 17.36 61.98 36.77 39.28 0.98 10.48 1.23 21.89 50.83 419.30 all types 105.74 2.54 2.22 16.98 49.27 22.99 70.38 33.22 40.57 1.51 12.48 1.06 20.10 78.28 457.35 Madhya Pradesh self-employed 92.73 0.35 0.20 23.08 68.74 22.12 11.01 35.89 10.09 2.06 15.52 1.27 12.91 29.31 325.29 regular wage/salarid 103.02 0.36 0.30 27.28 70.57 26.70 13.39 40.78 12.29 3.45 16.23 1.40 13.69 35.20 364.65 casual labour 90.68 0.11 0.05 18.71 27.15 17.68 7.32 28.09 3.95 0.31 11.36 1.21 11.40 15.37 233.40 other households 108.13 0.45 0.23 29.32 78.49 27.32 19.23 48.48 15.06 6.30 17.52 1.46 14.73 50.00 416.74 not recorded 99.81 1.63 0.54 23.68 70.33 19.49 1.61 31.74 4.98 1.58 13.98 1.08 12.07 27.20 309.72 all types 97.17 0.32 0.22 24.29 63.08 23.39 11.76 37.16 10.17 2.54 15.20 1.32 13.06 30.44 330.12
(Contd.)

Appendix Tables
NSS Report No.472: Differences in Level of Consumption among Socio-Economic Groups,1999-2000 A-140
Table 5U: Break-up of MPCE by broad groups of food items separately for each household type in urban areas and by State/UT Urban average per capita consumption expenditure (Rs) per 30 days on
household type cereals gram
cereal substi- tutes
pulses &
products
milk &
milk products
edibile oil
meat, egg &
fish
vegeta- bles
fruits (fresh)
fruits (dry)
sugar salt spices
beve- rages,
refresh- ments etc,
food total
(1) (2) (3) (4) (5) (6) (7) (8) (9) (10) (11) (12) (13) (14) (15) (16) Maharashtra self-employed 100.85 0.57 1.30 26.81 79.48 32.71 27.33 44.87 19.55 8.75 15.38 1.38 15.36 61.90 436.22 regular wage/salarid 102.50 0.80 1.65 28.39 76.09 36.51 31.33 51.20 22.05 9.11 15.52 1.54 16.64 75.72 469.05 casual labour 88.17 0.57 0.97 22.26 25.14 22.49 19.03 29.40 5.76 4.98 13.19 1.18 13.19 30.05 276.38 other households 103.56 0.82 2.51 31.94 106.10 41.64 30.91 56.59 30.28 11.72 18.98 1.65 18.53 127.95 583.17 not recorded 85.08 0.63 3.27 16.03 52.23 18.46 13.13 20.40 16.50 12.74 11.66 0.90 11.99 55.90 318.91 all types 100.36 0.70 1.50 27.30 72.61 33.86 28.60 46.84 19.73 8.64 15.34 1.45 15.90 68.15 440.99 Manipur self-employed 218.91 0.13 0.01 11.06 10.79 13.53 41.07 32.65 6.09 0.35 5.23 2.48 11.51 22.03 375.83 regular wage/salarid 219.05 0.30 6.84 13.72 18.74 17.07 54.51 37.02 7.76 0.58 6.88 2.39 13.08 31.78 429.71 casual labour 176.54 0.03 0.04 12.85 3.06 16.98 41.82 30.34 5.47 0.40 5.67 2.15 12.63 20.82 328.81 other households 219.13 0.02 0.04 11.68 8.00 13.11 37.11 33.98 5.47 0.47 4.72 1.86 9.17 27.28 372.04 not recorded 256.65 0.00 0.00 11.34 0.00 10.39 35.79 24.08 3.35 0.64 3.84 2.06 7.69 7.90 363.74 all types 218.05 0.20 3.18 12.40 13.98 15.22 46.99 34.66 6.78 0.47 5.96 2.38 12.06 26.85 399.18 Meghalaya self-employed 135.32 0.41 0.32 14.27 34.61 22.46 81.34 45.71 12.09 0.88 11.78 1.44 7.02 43.94 411.59 regular wage/salarid 138.43 0.09 0.26 12.03 45.06 23.77 90.29 49.84 11.27 0.77 12.08 1.46 8.41 74.80 468.57 casual labour 120.03 0.04 0.57 8.60 22.12 17.79 79.26 42.78 5.75 0.00 9.27 1.40 5.47 48.38 361.46 other households 101.92 0.00 0.17 8.34 29.59 19.85 79.12 49.94 12.57 4.80 9.90 1.49 9.54 268.70 595.94 not recorded 126.71 19.86 0.00 37.57 87.86 96.43 123.14 132.79 15.86 7.14 23.29 2.57 14.86 231.21 919.29 all types 132.99 0.21 0.30 11.94 39.42 22.79 86.49 48.50 11.00 1.05 11.59 1.45 7.93 81.31 456.98
(Contd.)

Appendix Tables
NSS Report No.472: Differences in Level of Consumption among Socio-Economic Groups,1999-2000 A-141
Table 5U: Break-up of MPCE by broad groups of food items separately for each household type in urban areas and by State/UT Urban average per capita consumption expenditure (Rs) per 30 days on
household type cereals gram
cereal substi- tutes
pulses &
products
milk &
milk products
edibile oil
meat, egg &
fish
vegeta- bles
fruits (fresh)
fruits (dry)
sugar salt spices
beve- rages,
refresh- ments etc,
food total
(1) (2) (3) (4) (5) (6) (7) (8) (9) (10) (11) (12) (13) (14) (15) (16) Mizoram self-employed 147.48 0.16 0.03 22.93 40.26 25.28 105.67 108.71 9.90 0.45 15.16 2.91 11.85 38.63 529.44 regular wage/salarid 150.89 0.39 0.00 22.78 55.45 29.74 125.48 119.70 13.83 0.79 17.52 2.73 12.42 52.67 604.39 casual labour 121.16 0.09 0.00 16.52 25.63 20.28 85.20 85.12 8.81 0.08 13.52 2.62 9.53 37.77 426.33 other households 168.27 0.20 0.01 25.32 45.45 29.45 101.10 121.97 10.35 0.24 19.15 3.68 10.51 36.37 572.06 not recorded 192.55 0.00 0.00 12.23 32.15 11.70 69.38 78.89 8.58 0.00 9.74 1.80 9.17 37.67 463.88 all types 147.44 0.25 0.01 22.05 45.06 26.63 110.67 110.82 11.45 0.53 16.15 2.83 11.67 44.33 549.90 Nagaland self-employed 181.20 0.25 0.00 21.61 58.58 22.87 141.28 83.20 39.27 0.08 12.78 2.53 17.45 70.64 651.73 regular wage/salarid 184.14 0.22 0.00 16.75 60.10 17.27 111.90 72.64 18.88 0.56 11.41 2.05 12.69 65.38 573.99 casual labour 126.58 0.00 0.00 10.34 20.68 12.54 56.06 58.64 9.15 0.00 8.19 1.85 11.97 155.89 471.88 other households 181.84 0.35 0.28 18.19 41.43 16.81 121.46 77.96 28.69 1.96 12.62 2.05 15.37 107.65 626.67 not recorded 181.19 0.00 0.00 8.44 52.19 21.40 164.68 72.00 12.19 0.00 15.94 4.00 12.75 92.18 636.94 all types 182.12 0.24 0.05 17.53 55.97 17.91 116.68 74.74 23.21 0.71 11.75 2.12 13.80 75.04 591.88 Orissa self-employed 143.24 0.25 0.00 17.54 25.03 17.42 26.68 45.88 7.00 0.77 8.60 1.39 10.56 26.94 331.31 regular wage/salarid 140.73 0.28 0.00 23.68 43.24 22.37 36.00 52.54 12.51 0.68 11.56 1.72 11.99 48.97 406.27 casual labour 141.54 0.24 0.00 13.51 3.67 11.77 17.22 33.89 3.42 0.15 6.29 1.25 9.76 17.83 260.55 other households 122.82 0.66 0.00 19.53 30.14 17.78 24.73 48.44 9.34 0.63 10.52 1.33 11.29 65.31 362.52 not recorded 141.01 0.00 0.00 28.76 41.89 27.65 36.27 79.47 18.27 5.92 10.04 1.75 11.64 17.88 420.57 all types 140.39 0.29 0.00 19.51 29.23 18.52 28.73 46.80 8.82 0.62 9.56 1.49 11.06 37.22 352.23
(Contd.)

Appendix Tables
NSS Report No.472: Differences in Level of Consumption among Socio-Economic Groups,1999-2000 A-142
Table 5U: Break-up of MPCE by broad groups of food items separately for each household type in urban areas and by State/UT Urban average per capita consumption expenditure (Rs) per 30 days on
household type cereals gram
cereal substi- tutes
pulses &
products
milk &
milk products
edibile oil
meat, egg &
fish
vegeta- bles
fruits (fresh)
fruits (dry)
sugar salt spices
beve- rages,
refresh- ments etc,
food total
(1) (2) (3) (4) (5) (6) (7) (8) (9) (10) (11) (12) (13) (14) (15) (16) Punjab self-employed 74.80 2.79 0.00 24.63 137.63 25.86 9.63 41.54 19.00 2.93 25.38 1.32 15.11 48.58 429.21 regular wage/salarid 74.41 3.17 0.00 24.55 130.92 26.87 9.46 41.88 17.39 3.68 25.28 1.36 14.84 56.58 430.39 casual labour 81.85 2.83 0.00 25.63 79.72 22.37 6.89 37.81 7.38 1.21 28.03 1.52 12.38 33.66 341.27 other households 75.95 4.14 0.00 30.22 170.07 24.11 12.12 43.13 24.18 2.22 31.44 1.38 17.23 72.92 509.11 not recorded 62.25 3.37 0.00 24.25 90.55 15.16 5.72 34.77 5.98 0.00 27.97 1.02 17.32 46.50 334.86 all types 75.53 3.02 0.00 25.03 129.93 25.72 9.37 41.30 17.27 2.96 26.00 1.36 14.81 51.24 423.54 Rajasthan self-employed 89.66 0.41 0.02 16.33 123.59 23.65 8.74 37.99 11.11 2.45 18.02 1.25 15.29 30.22 378.73 regular wage/salarid 95.47 0.29 0.21 18.12 140.27 30.80 11.49 48.16 15.03 5.81 18.96 1.27 17.62 51.96 455.46 casual labour 94.13 0.30 0.00 15.10 65.98 21.76 8.67 32.73 3.36 0.65 15.68 1.13 15.35 22.97 297.81 other households 91.91 0.57 0.00 18.99 146.56 28.72 9.70 46.96 14.04 6.17 18.48 1.34 19.22 51.70 454.37 not recorded - - - - - - - - - - - - - - - all types 92.61 0.36 0.09 17.05 125.16 26.59 9.89 41.97 11.99 3.79 18.16 1.25 16.44 39.28 404.64 Sikkim self-employed 112.37 1.26 0.00 18.12 69.63 25.97 35.59 60.76 14.89 1.00 8.68 1.55 15.46 41.26 406.55 regular wage/salarid 99.33 0.88 0.00 18.54 61.41 27.20 55.55 60.36 11.96 0.88 8.50 1.66 8.39 97.95 452.60 casual labour 92.01 1.61 0.00 12.85 18.75 16.13 23.20 37.12 1.99 0.00 5.10 0.93 5.38 59.68 274.76 other households 92.35 0.99 0.00 14.37 72.49 27.68 33.75 57.11 16.11 0.21 6.95 1.41 5.99 194.16 523.57 not recorded 144.48 0.00 0.00 17.94 55.08 15.89 49.43 26.83 7.77 0.00 6.78 0.92 5.23 312.65 643.00 all types 102.88 1.05 0.00 17.83 61.68 26.04 46.03 58.63 12.40 0.83 8.25 1.56 10.30 83.00 430.47
(Contd.)

Appendix Tables
NSS Report No.472: Differences in Level of Consumption among Socio-Economic Groups,1999-2000 A-143
Table 5U: Break-up of MPCE by broad groups of food items separately for each household type in urban areas and by State/UT Urban average per capita consumption expenditure (Rs) per 30 days on
household type cereals gram
cereal substi- tutes
pulses &
products
milk &
milk products
edibile oil
meat, egg &
fish
vegeta- bles
fruits (fresh)
fruits (dry)
sugar salt spices
beve- rages,
refresh- ments etc,
food total
(1) (2) (3) (4) (5) (6) (7) (8) (9) (10) (11) (12) (13) (14) (15) (16) Tamil Nadu self-employed 107.83 1.60 0.01 30.23 57.34 22.72 37.16 43.25 19.16 1.23 10.13 1.30 70.30 64.38 466.66 regular wage/salarid 111.22 1.59 0.03 32.99 70.19 24.01 35.38 49.77 22.43 1.66 11.21 1.52 27.91 79.72 469.63 casual labour 88.01 0.74 0.06 22.65 26.39 15.92 27.64 37.36 11.73 0.22 6.90 1.24 24.80 48.84 312.48 other households 106.82 0.97 0.10 34.13 74.25 26.23 35.17 73.23 23.34 2.00 12.74 1.33 46.21 105.05 541.58 not recorded 91.94 3.70 0.00 28.48 37.96 21.72 32.24 39.25 18.14 2.70 7.24 1.08 26.77 45.72 356.93 all types 105.46 1.40 0.04 30.21 57.95 22.20 34.49 46.67 19.40 1.27 10.13 1.39 42.24 70.33 443.17 Tripura self-employed 177.48 0.02 0.12 16.14 38.66 25.04 85.20 52.56 16.75 1.24 10.95 1.99 11.95 26.30 464.41 regular wage/salarid 182.60 0.10 0.11 19.53 61.05 32.04 107.61 65.82 22.70 1.10 10.96 2.45 13.68 36.90 556.63 casual labour 156.55 0.00 0.00 12.92 11.92 17.41 46.91 40.37 5.98 0.01 7.21 1.64 10.59 15.51 327.02 other households 175.82 0.00 0.01 18.46 44.27 28.29 78.89 59.46 16.53 0.81 9.70 2.35 13.24 33.72 481.56 not recorded 196.00 0.00 0.00 20.46 5.86 24.70 53.36 53.57 4.57 0.00 7.30 2.44 14.94 7.80 391.00 all types 177.15 0.05 0.09 17.58 46.41 27.73 90.35 58.01 18.17 0.97 10.35 2.20 12.74 30.65 492.44 Uttar Pradesh self-employed 90.67 0.42 0.02 23.59 67.48 21.00 12.94 37.31 11.95 3.40 14.52 1.12 13.96 31.62 330.00 regular wage/salarid 95.67 0.83 0.02 27.49 89.42 26.53 12.80 46.84 17.64 5.82 16.79 1.38 15.76 49.88 406.86 casual labour 86.15 0.21 0.00 17.65 32.81 15.19 9.69 26.80 5.82 0.84 11.77 0.93 11.95 15.77 235.58 other households 93.56 1.02 0.00 28.20 88.43 24.60 15.58 42.35 14.99 3.61 17.07 1.28 15.11 52.38 398.17 not recorded 90.92 0.23 0.25 20.71 50.80 19.75 8.76 31.19 5.02 1.31 12.65 1.17 11.59 18.56 272.91 all types 91.95 0.57 0.02 24.50 72.05 22.35 12.73 39.48 13.24 3.87 15.11 1.19 14.37 37.11 348.54
(Contd.)

Appendix Tables
NSS Report No.472: Differences in Level of Consumption among Socio-Economic Groups,1999-2000 A-144
Table 5U: Break-up of MPCE by broad groups of food items separately for each household type in urban areas and by State/UT Urban average per capita consumption expenditure (Rs) per 30 days on
household type cereals gram
cereal substi- tutes
pulses &
products
milk &
milk products
edibile oil
meat, egg &
fish
vegeta- bles
fruits (fresh)
fruits (dry)
sugar salt spices
beve- rages,
refresh- ments etc,
food total
(1) (2) (3) (4) (5) (6) (7) (8) (9) (10) (11) (12) (13) (14) (15) (16) West Bengal self-employed 132.80 0.26 0.05 16.11 34.15 26.37 57.61 53.30 11.66 0.80 9.68 1.60 13.79 82.18 440.38 regular wage/salarid 140.78 0.22 0.02 18.33 52.26 31.71 79.40 59.63 17.14 1.50 11.69 1.93 16.59 59.13 490.33 casual labour 126.92 0.19 0.01 13.07 12.59 20.00 36.44 41.66 3.61 0.11 7.27 1.38 11.27 27.88 302.39 other households 138.93 0.12 0.02 19.32 52.10 33.70 82.05 62.66 20.30 1.50 14.12 1.76 17.62 117.89 562.08 not recorded 117.11 0.74 0.00 17.16 43.05 25.50 57.05 49.93 9.21 0.72 9.87 1.90 15.52 58.94 406.69 all types 135.73 0.23 0.03 16.89 40.31 28.30 65.69 55.17 13.54 1.05 10.51 1.72 14.90 68.98 453.06 A. & N. Islands self-employed 110.88 0.50 0.55 30.24 59.31 41.66 71.39 63.04 23.82 0.87 10.46 2.51 19.82 106.98 542.02 regular wage/salarid 120.03 1.72 0.16 37.37 69.04 45.70 85.71 80.02 22.59 1.35 13.40 2.86 25.55 91.14 596.63 casual labour 116.89 0.11 0.13 30.64 33.85 42.05 48.14 63.27 8.95 0.00 11.66 2.62 22.72 92.85 473.87 other households 116.98 0.00 0.00 45.66 61.06 43.10 100.62 77.48 24.01 1.33 14.91 3.12 34.89 72.64 595.80 not recorded all types 117.86 1.24 0.22 35.49 62.57 44.41 78.85 74.72 21.15 1.09 12.69 2.77 24.45 93.64 571.16 Chandigarh self-employed 80.46 3.92 0.10 27.40 154.92 28.92 12.36 52.23 24.66 4.41 19.80 1.41 15.63 74.86 501.08 regular wage/salarid 88.07 4.08 0.00 29.98 181.44 32.68 15.91 59.03 33.58 9.61 21.25 1.51 17.16 88.14 582.46 casual labour 78.22 4.43 0.00 27.99 72.37 21.75 20.32 40.05 7.19 1.47 18.02 1.44 17.47 43.08 353.78 other households 91.57 4.42 0.00 32.65 261.49 46.18 15.74 83.71 56.73 12.98 23.14 1.66 23.69 107.21 761.18 not recorded 169.77 4.53 0.00 38.48 130.46 42.25 0.00 77.53 23.41 8.26 31.64 2.92 17.48 43.79 590.51 all types 85.74 4.05 0.03 29.23 172.96 31.73 14.83 57.35 30.88 7.85 20.80 1.49 16.93 83.28 557.15
(Contd.)

Appendix Tables
NSS Report No.472: Differences in Level of Consumption among Socio-Economic Groups,1999-2000 A-145
Table 5U: Break-up of MPCE by broad groups of food items separately for each household type in urban areas and by State/UT Urban average per capita consumption expenditure (Rs) per 30 days on
household type cereals gram
cereal substi- tutes
pulses &
products
milk &
milk products
edibile oil
meat, egg &
fish
vegeta- bles
fruits (fresh)
fruits (dry)
sugar salt spices
beve- rages,
refresh- ments etc,
food total
(1) (2) (3) (4) (5) (6) (7) (8) (9) (10) (11) (12) (13) (14) (15) (16) Dadra & Nagar Haveli self-employed 116.12 0.27 0.00 35.70 96.16 39.52 24.92 58.85 26.52 3.58 12.83 1.16 20.22 100.78 536.64 regular wage/salarid 123.44 0.52 0.00 36.19 122.47 41.35 20.75 70.01 24.80 5.29 17.23 1.34 24.46 136.39 624.23 casual labour 76.73 0.00 0.00 18.06 12.37 19.52 12.20 29.76 15.04 0.00 8.22 0.93 16.94 279.62 489.38 other households 107.07 0.00 0.00 25.48 18.15 27.24 20.79 37.35 11.20 0.00 9.70 0.88 19.39 32.25 309.51 not recorded - - - - - - - - - - - - - - - all types 116.75 0.39 0.00 34.00 101.48 38.34 21.07 62.19 23.79 4.15 14.98 1.24 22.49 135.26 576.13 Daman & Diu self-employed 117.19 2.67 0.06 25.15 103.12 41.21 60.91 51.86 25.27 10.83 14.76 1.21 20.11 53.53 527.86 regular wage/salarid 115.04 1.67 0.10 26.94 96.51 40.97 47.57 50.72 21.97 6.53 15.41 1.15 21.89 74.46 520.94 casual labour 85.14 2.58 0.00 20.39 39.79 28.74 51.54 40.86 5.35 0.83 9.49 0.95 16.34 25.31 327.32 other households 113.35 2.38 0.00 24.31 122.01 57.22 81.89 53.00 33.07 16.40 16.16 1.37 22.61 107.74 651.51 not recorded - - - - - - - - - - - - - - - all types 114.24 2.20 0.07 25.62 98.69 41.94 56.49 50.90 23.51 8.94 14.90 1.18 20.93 66.30 525.91 Delhi self-employed 84.78 2.82 0.00 29.55 164.58 34.98 24.23 79.82 42.33 9.20 14.95 2.02 16.53 91.76 597.55 regular wage/salarid 91.43 3.05 0.00 30.02 151.60 31.36 21.36 72.88 32.89 11.16 15.46 1.77 20.11 75.26 558.35 casual labour 79.46 1.89 0.00 22.18 59.20 23.09 25.68 50.50 12.78 0.00 12.00 1.41 15.88 26.20 330.27 other households 97.10 1.89 0.54 32.99 184.98 37.29 20.51 85.50 40.87 6.09 17.73 1.81 24.70 72.56 624.56 not recorded 79.82 6.62 0.00 32.90 102.97 40.06 33.02 87.95 26.72 0.54 13.55 1.91 22.05 37.31 485.42 all types 87.97 2.88 0.02 29.58 154.18 32.93 22.93 75.62 36.54 9.48 15.14 1.87 18.47 80.17 567.77
(Contd.)

Appendix Tables
NSS Report No.472: Differences in Level of Consumption among Socio-Economic Groups,1999-2000 A-146
Table 5U: Break-up of MPCE by broad groups of food items separately for each household type in urban areas and by State/UT Urban average per capita consumption expenditure (Rs) per 30 days on
household type cereals gram
cereal substi- tutes
pulses &
products
milk &
milk products
edibile oil
meat, egg &
fish
vegeta- bles
fruits (fresh)
fruits (dry)
sugar salt spices
beve- rages,
refresh- ments etc,
food total
(1) (2) (3) (4) (5) (6) (7) (8) (9) (10) (11) (12) (13) (14) (15) (16) Lakshadweep self-employed 110.91 4.04 0.00 11.46 18.15 29.38 144.52 39.65 53.51 2.10 27.53 1.34 21.29 90.35 554.24 regular wage/salarid 120.62 4.36 0.00 17.90 33.33 28.41 132.49 44.21 61.76 1.59 27.93 1.17 23.21 136.70 633.68 casual labour 102.59 2.59 0.00 15.00 20.36 22.98 110.09 34.31 43.99 1.01 21.16 1.00 16.27 156.86 548.21 other households 145.31 4.97 0.00 30.13 55.54 32.89 233.11 53.88 78.29 9.50 28.82 0.90 15.48 113.38 802.18 not recorded - - - - - - - - - - - - - - - all types 117.55 4.12 0.00 16.33 28.35 28.71 145.33 42.43 58.45 2.55 27.19 1.19 20.98 118.05 611.24 Pondicherry self-employed 100.17 1.95 0.00 27.98 66.54 22.25 45.61 41.52 17.16 1.35 9.98 1.60 21.87 75.76 433.74 regular wage/salarid 113.77 1.35 0.01 32.07 50.41 20.42 41.59 42.31 14.77 1.76 9.83 4.08 22.41 54.33 409.12 casual labour 98.72 1.57 0.04 22.23 31.14 14.48 37.25 32.05 9.78 0.73 6.95 1.39 18.53 39.03 313.88 other households 127.61 2.48 0.91 34.82 86.33 28.47 69.06 50.49 20.52 2.90 13.51 1.82 26.62 47.95 513.48 not recorded - - - - - - - - - - - - - - - all types 108.30 1.65 0.11 28.87 52.47 20.07 44.14 40.27 14.56 1.52 9.48 2.60 21.70 54.21 399.95 all-India self-employed 103.71 0.93 0.27 23.46 76.72 25.90 24.80 42.50 16.31 3.77 13.92 1.31 18.80 48.43 400.83 regular wage/salarid 109.85 1.05 0.43 26.76 84.80 30.22 30.49 48.78 19.54 5.19 15.02 1.52 17.62 62.49 453.77 casual labour 97.63 0.66 0.33 18.68 32.75 19.43 20.82 32.31 8.14 1.20 10.90 1.15 14.86 30.73 289.60 other households 108.55 1.06 0.34 26.07 85.58 27.78 29.27 48.23 20.28 4.46 15.14 1.45 18.41 92.53 479.13 not recorded 97.31 1.49 0.50 20.92 60.01 21.43 22.58 37.34 11.01 2.67 12.25 1.34 14.53 33.23 336.62 all types 105.58 0.95 0.35 24.25 74.17 26.81 26.78 43.90 16.67 4.01 14.00 1.38 17.73 54.28 410.84

Appendix Tables
NSS Report No.472: Differences in Level of Consumption among Socio-Economic Groups,1999-2000 A-147
Table 6R: Break-up of MPCE by broad groups of non-food items separately for each household type in rural areas and by State/UT
Rural average per capita consumption expenditure (Rs) per 30 days on
household type pan, tobacco &
intoxicants
fuel &
light
clothing
footwear
misc. goods &
services
durable goods
non-food total
all
clothing (second hand)
durable goods
(second hand)
no. of sample hhs reporting
consumption
(1) (17) (18) (19) (20) (21) (22) (23) (24) (25) (26) (27) Andhra Pradesh self-employed in non-ag. 16.42 32.63 29.42 3.13 97.09 8.84 187.52 467.10 0.05 0.08 826 agricultural labour 18.71 26.77 23.10 2.33 68.56 3.17 142.64 391.08 0.09 0.02 1981 other labour 22.04 29.18 25.91 3.07 83.84 5.02 169.07 434.78 0.05 0.11 272 self-employed in ag. 22.63 30.12 35.31 3.83 104.48 11.88 208.26 502.82 0.05 0.38 1532 other households 12.81 40.71 42.49 5.53 170.72 15.82 288.07 645.64 0.11 0.02 559 not recorded 12.00 29.35 24.15 3.52 71.35 10.93 151.30 395.26 0.02 0.00 11 all types 19.26 29.64 28.94 3.14 90.75 7.42 179.16 453.61 0.07 0.13 5181 Arunachal Pradesh self-employed in non-ag. 69.94 83.40 34.30 8.53 264.31 68.59 529.07 912.21 0.00 0.00 63 agricultural labour 54.90 77.81 13.23 1.61 79.07 11.73 238.34 573.30 0.00 1.35 26 other labour 115.04 80.79 34.53 7.88 106.04 11.41 355.69 778.77 0.00 0.00 30 self-employed in ag. 43.38 95.55 24.50 5.89 76.45 16.91 262.68 606.76 0.30 0.05 434 other households 54.05 64.00 31.71 8.00 91.09 17.04 265.89 639.88 0.00 0.00 268 not recorded 111.54 61.00 27.56 4.01 119.60 52.53 376.22 817.10 0.00 0.00 6 all types 54.30 83.50 26.95 6.43 96.38 20.22 287.78 648.00 0.15 0.13 827 Assam self-employed in non-ag. 16.24 31.75 26.30 4.41 51.89 7.73 138.33 432.80 0.08 0.06 560 agricultural labour 20.58 25.35 20.81 2.58 31.84 6.56 107.72 329.22 0.39 0.00 536 other labour 18.85 29.67 23.00 3.41 34.81 5.43 115.18 357.05 0.10 0.03 516 self-employed in ag. 17.93 28.60 25.73 4.19 48.93 9.52 134.90 444.37 0.06 0.01 1307 other households 21.40 38.24 35.85 7.21 88.51 9.26 200.46 545.55 0.02 0.10 530 not recorded 28.72 34.03 29.08 4.27 58.01 6.46 160.58 486.15 0.00 0.00 13 all types 18.76 30.16 26.12 4.30 50.46 8.12 137.92 426.13 0.12 0.03 3462 (Contd.)

Appendix Tables
NSS Report No.472: Differences in Level of Consumption among Socio-Economic Groups,1999-2000 A-148
Table 6R: Break-up of MPCE by broad groups of non-food items separately for each household type in rural areas and by State/UT
Rural average per capita consumption expenditure (Rs) per 30 days on
household type pan, tobacco &
intoxicants
fuel &
light
clothing
footwear
misc. goods &
services
durable goods
non-food total
all
clothing (second hand)
durable goods
(second hand)
no. of sample hhs reporting
consumption
(1) (17) (18) (19) (20) (21) (22) (23) (24) (25) (26) (27) Bihar self-employed in non-ag. 7.71 29.26 25.84 2.90 60.38 6.93 133.01 392.24 0.05 0.02 1156 agricultural labour 8.16 27.27 20.95 1.84 43.99 5.98 108.19 332.44 0.09 0.01 2439 other labour 10.99 25.66 21.56 2.11 39.47 4.30 104.08 313.98 0.02 0.00 311 self-employed in ag. 7.72 28.73 28.73 3.57 63.63 8.02 140.41 422.75 0.04 0.02 2551 other households 6.77 32.41 30.63 3.90 83.07 8.70 165.48 449.63 0.01 0.00 829 not recorded 5.37 29.37 26.60 2.70 53.22 6.54 123.80 382.80 0.15 0.00 25 all types 7.91 28.53 25.51 2.84 57.24 7.07 129.10 385.09 0.06 0.02 7311 Goa self-employed in non-ag. 27.68 50.83 62.55 13.08 285.54 50.69 490.37 996.88 0.00 0.00 30 agricultural labour 29.59 41.72 32.84 5.06 130.70 8.80 248.71 613.83 0.00 0.00 29 other labour 43.56 54.20 41.86 7.95 150.17 16.83 314.57 753.22 0.09 0.99 34 self-employed in ag. 20.04 45.45 41.49 7.04 122.80 12.48 249.30 702.48 0.00 0.00 19 other households 30.57 64.41 54.20 12.27 315.13 41.03 517.61 1046.97 0.00 3.68 80 not recorded - - - - - - - - - - - all types 31.98 54.58 47.86 9.72 224.86 28.92 397.92 868.77 0.02 1.58 192 Gujarat self-employed in non-ag. 14.41 44.21 36.20 6.73 128.67 14.25 244.47 578.10 0.59 0.08 288 agricultural labour 15.48 35.28 28.38 4.64 73.25 5.76 162.80 440.55 1.45 0.00 805 other labour 14.17 37.13 31.37 4.89 94.72 9.34 191.62 469.12 1.05 1.23 142 self-employed in ag. 13.69 43.84 41.73 7.54 125.58 22.21 254.59 629.44 0.33 0.32 961 other households 10.44 52.69 50.12 9.15 163.24 39.79 325.45 722.06 0.37 2.04 283 not recorded - - - - - - - - - - - all types 14.18 41.04 36.24 6.34 107.80 15.93 221.52 551.33 0.82 0.39 2479 (Contd.)

Appendix Tables
NSS Report No.472: Differences in Level of Consumption among Socio-Economic Groups,1999-2000 A-149
Table 6R: Break-up of MPCE by broad groups of non-food items separately for each household type in rural areas and by State/UT
Rural average per capita consumption expenditure (Rs) per 30 days on
household type pan, tobacco &
intoxicants
fuel &
light
clothing
footwear
misc. goods &
services
durable goods
non-food total
all
clothing (second hand)
durable goods
(second hand)
no. of sample hhs reporting
consumption
(1) (17) (18) (19) (20) (21) (22) (23) (24) (25) (26) (27) Haryana self-employed in non-ag. 17.46 53.46 43.08 12.27 157.82 10.39 294.48 664.28 0.00 2.00 161 agricultural labour 16.35 49.97 34.84 8.69 115.71 5.70 231.26 543.27 0.90 0.35 174 other labour 23.33 58.93 37.70 10.30 105.99 3.30 239.56 544.83 0.01 0.17 108 self-employed in ag. 17.65 64.64 53.17 14.52 191.04 15.88 356.89 808.29 0.00 0.17 490 other households 13.16 73.69 57.74 15.17 213.55 16.76 390.08 821.96 0.02 0.03 195 not recorded 23.59 104.83 117.97 21.06 222.12 14.08 503.64 1293.03 0.00 0.00 4 all types 17.27 61.26 47.62 12.78 166.89 12.01 317.83 714.38 0.18 0.43 1132 Himachal Pradesh self-employed in non-ag. 18.35 45.49 46.91 15.23 168.86 19.91 314.76 701.57 0.11 0.50 216 agricultural labour 17.61 50.03 35.26 10.71 120.59 1.82 236.01 541.15 1.09 0.00 63 other labour 18.80 40.51 37.97 12.60 112.35 11.14 233.37 562.41 0.78 0.00 233 self-employed in ag. 15.80 53.35 50.63 16.26 128.52 19.03 283.59 661.43 0.17 0.01 784 other households 15.70 54.92 63.29 21.20 230.12 30.02 415.24 877.38 0.21 0.00 337 not recorded 12.00 27.00 37.56 6.58 200.33 0.00 283.47 612.11 0.00 0.00 1 all types 16.67 50.38 49.75 16.20 149.02 19.16 301.17 684.50 0.30 0.07 1634 Jammu & Kashmir self-employed in non-ag. 12.45 46.56 44.49 11.08 108.90 18.26 241.74 683.84 0.00 0.00 209 agricultural labour 13.31 38.23 47.54 12.54 95.16 9.73 216.50 595.69 0.00 0.03 100 other labour 13.50 38.56 30.31 10.48 88.42 10.11 191.36 551.02 0.08 0.00 87 self-employed in ag. 15.62 42.28 43.09 11.41 102.29 24.05 238.75 659.75 0.05 0.00 764 other households 24.34 43.62 47.39 13.90 170.84 34.56 334.64 792.02 0.00 0.36 311 not recorded 0.00 122.50 136.99 23.29 216.00 41.10 539.88 1179.54 0.00 0.00 1 all types 16.70 42.56 43.55 11.88 115.36 23.64 253.68 677.60 0.03 0.07 1472 (Contd.)

Appendix Tables
NSS Report No.472: Differences in Level of Consumption among Socio-Economic Groups,1999-2000 A-150
Table 6R: Break-up of MPCE by broad groups of non-food items separately for each household type in rural areas and by State/UT
Rural average per capita consumption expenditure (Rs) per 30 days on
household type pan, tobacco &
intoxicants
fuel &
light
clothing
footwear
misc. goods &
services
durable goods
non-food total
all
clothing (second hand)
durable goods
(second hand)
no. of sample hhs reporting
consumption
(1) (17) (18) (19) (20) (21) (22) (23) (24) (25) (26) (27) Karnataka self-employed in non-ag. 17.34 43.85 40.55 5.47 140.07 17.84 265.12 593.21 0.04 0.01 326 agricultural labour 20.27 30.96 29.66 3.01 72.32 4.18 160.40 411.47 0.10 0.03 1012 other labour 27.72 39.23 30.05 3.58 103.48 6.84 210.91 488.28 0.03 0.21 125 self-employed in ag. 15.74 35.51 41.00 4.68 98.21 19.79 214.92 533.41 0.02 0.04 1016 other households 14.87 50.17 47.83 7.29 165.96 17.98 304.11 687.83 0.00 0.00 282 not recorded 39.54 18.40 56.66 7.55 109.12 4.62 235.89 523.72 0.00 0.00 2 all types 18.23 35.77 36.41 4.23 97.31 12.59 204.53 499.78 0.05 0.04 2763 Kerala self-employed in non-ag. 18.60 45.62 43.00 5.97 198.41 63.91 375.51 799.70 0.04 3.25 487 agricultural labour 22.39 38.93 32.14 4.31 118.59 20.86 237.23 569.65 0.21 0.29 506 other labour 25.91 39.50 35.05 5.12 142.79 31.56 279.93 655.89 0.04 0.05 560 self-employed in ag. 11.31 53.68 52.66 7.36 232.38 93.25 450.63 925.60 0.01 3.40 602 other households 13.17 58.15 58.83 8.90 309.83 70.07 518.95 1016.47 0.00 13.12 446 not recorded 0.00 75.54 45.51 6.15 104.78 0.00 231.99 526.16 0.00 0.00 3 all types 19.11 45.90 42.62 6.06 188.32 52.51 354.51 765.71 0.07 3.17 2604 Madhya Pradesh self-employed in non-ag. 12.82 38.49 33.47 5.13 93.61 14.64 198.14 448.69 0.09 0.13 418 agricultural labour 11.91 31.29 25.37 3.32 52.87 6.30 131.05 328.71 0.14 0.03 1788 other labour 16.20 30.84 26.46 3.58 75.68 6.14 158.89 352.04 0.22 0.00 186 self-employed in ag. 13.91 34.05 33.42 5.01 83.24 13.69 183.33 439.08 0.05 0.09 2402 other households 14.55 40.97 39.13 7.63 123.64 14.12 240.04 514.16 0.03 0.22 348 not recorded 3.47 47.26 13.01 7.37 269.55 50.65 391.32 613.19 0.00 0.00 2 all types 13.24 33.69 30.61 4.52 75.35 10.86 168.27 401.50 0.09 0.07 5144 (Contd.)

Appendix Tables
NSS Report No.472: Differences in Level of Consumption among Socio-Economic Groups,1999-2000 A-151
Table 6R: Break-up of MPCE by broad groups of non-food items separately for each household type in rural areas and by State/UT
Rural average per capita consumption expenditure (Rs) per 30 days on
household type pan, tobacco &
intoxicants
fuel &
light
clothing
footwear
misc. goods &
services
durable goods
non-food total
all
clothing (second hand)
durable goods
(second hand)
no. of sample hhs reporting
consumption
(1) (17) (18) (19) (20) (21) (22) (23) (24) (25) (26) (27) Maharashtra self-employed in non-ag. 11.78 41.63 43.03 6.60 162.67 19.91 285.63 583.90 0.61 0.66 424 agricultural labour 11.28 31.03 30.48 3.81 83.10 4.88 164.57 391.29 0.13 0.04 1610 other labour 14.81 43.50 38.25 6.44 147.86 23.52 274.37 581.22 0.09 0.04 226 self-employed in ag. 11.19 36.82 40.76 5.69 120.27 18.25 232.98 521.03 0.03 0.08 1319 other households 9.43 47.23 49.82 8.84 216.38 20.68 352.38 707.57 0.04 0.00 540 not recorded 10.94 24.93 50.23 4.35 72.44 3.11 166.00 415.88 0.00 0.00 2 all types 11.35 36.45 37.43 5.38 121.02 13.37 224.99 496.77 0.13 0.10 4121 Manipur self-employed in non-ag. 22.19 51.96 24.25 7.48 107.41 20.07 233.34 582.64 0.00 6.19 68 agricultural labour 9.29 48.80 14.10 5.23 49.65 5.09 132.16 441.60 0.30 0.53 44 other labour 18.32 48.56 15.84 5.81 76.64 5.29 170.47 505.47 0.00 0.00 20 self-employed in ag. 13.85 51.33 25.44 7.96 66.15 14.63 179.35 508.92 0.24 0.06 458 other households 21.46 52.10 21.53 8.02 139.94 14.00 257.04 627.06 0.15 0.41 146 not recorded 34.93 88.54 25.28 6.93 86.68 3.59 245.95 677.86 0.00 0.00 2 all types 16.18 51.40 23.50 7.70 85.49 14.10 198.36 537.80 0.19 0.71 738 Meghalaya self-employed in non-ag. 54.23 37.92 42.92 8.39 113.21 16.74 273.41 632.56 3.64 1.64 67 agricultural labour 46.44 33.81 33.34 6.95 62.66 11.27 194.47 500.17 6.72 0.00 103 other labour 56.77 38.44 23.37 7.09 73.69 7.06 206.42 530.08 5.50 0.00 27 self-employed in ag. 47.20 29.63 37.63 7.81 75.13 10.86 208.27 544.09 5.47 0.00 631 other households 59.99 38.74 43.40 12.50 132.45 16.02 303.11 689.96 5.34 0.00 103 not recorded 36.15 28.50 18.12 3.91 23.98 2.52 113.17 453.68 5.81 0.00 2 all types 49.40 31.95 37.90 8.33 83.48 11.84 222.90 563.41 5.46 0.11 933 (Contd.)

Appendix Tables
NSS Report No.472: Differences in Level of Consumption among Socio-Economic Groups,1999-2000 A-152
Table 6R: Break-up of MPCE by broad groups of non-food items separately for each household type in rural areas and by State/UT
Rural average per capita consumption expenditure (Rs) per 30 days on
household type pan, tobacco &
intoxicants
fuel &
light
clothing
footwear
misc. goods &
services
durable goods
non-food total
all
clothing (second hand)
durable goods
(second hand)
no. of sample hhs reporting
consumption
(1) (17) (18) (19) (20) (21) (22) (23) (24) (25) (26) (27) Mizoram self-employed in non-ag. 73.14 89.44 55.11 21.99 137.83 26.82 404.33 962.14 0.00 0.00 44 agricultural labour 36.76 58.34 33.99 25.50 118.89 3.17 276.65 709.30 0.00 0.00 18 other labour 59.60 100.47 42.98 19.13 121.46 19.21 362.85 928.96 0.00 0.00 8 self-employed in ag. 32.72 64.06 36.77 18.10 83.61 9.08 244.35 641.60 0.12 0.12 276 other households 49.76 74.02 64.36 27.68 178.25 25.74 419.81 892.88 0.11 0.10 79 not recorded 19.72 62.42 23.29 33.20 50.67 2.89 192.20 627.09 0.00 0.00 3 all types 39.71 68.49 43.56 20.53 107.33 13.76 293.38 721.84 0.11 0.10 428 Nagaland self-employed in non-ag. 33.89 71.16 85.72 24.30 269.68 57.45 542.19 1223.85 4.81 0.00 42 agricultural labour 12.12 67.09 38.91 7.86 139.77 3.41 269.16 866.65 4.88 0.00 5 other labour 38.56 66.96 50.81 16.03 163.62 8.61 344.58 835.94 4.84 0.00 13 self-employed in ag. 24.36 76.35 58.34 16.61 156.63 10.33 342.62 891.86 6.93 0.00 262 other households 28.95 75.58 62.81 19.37 252.84 15.24 454.78 1004.01 3.41 0.00 155 not recorded 18.50 44.14 57.69 29.57 144.45 1.39 295.74 813.86 7.93 0.00 3 all types 26.48 75.04 60.67 17.90 192.47 14.07 386.62 941.31 5.64 0.00 480 Orissa self-employed in non-ag. 13.14 33.17 25.94 2.11 58.87 13.04 146.27 403.07 0.01 0.00 438 agricultural labour 8.58 24.47 19.80 1.22 37.09 9.26 100.43 307.03 0.04 0.02 1356 other labour 11.23 33.13 24.02 2.31 43.96 13.94 128.59 370.17 0.01 0.00 118 self-employed in ag. 9.77 31.29 26.26 2.17 57.87 13.65 141.01 393.25 0.00 0.03 1046 other households 12.47 42.04 35.91 4.34 116.36 18.99 230.12 538.59 0.02 0.01 512 not recorded 5.06 26.74 18.13 1.50 46.07 4.71 102.20 296.50 0.00 0.00 7 all types 9.98 29.88 24.48 2.01 55.25 12.32 133.92 373.17 0.02 0.02 3477 (Contd.)

Appendix Tables
NSS Report No.472: Differences in Level of Consumption among Socio-Economic Groups,1999-2000 A-153
Table 6R: Break-up of MPCE by broad groups of non-food items separately for each household type in rural areas and by State/UT
Rural average per capita consumption expenditure (Rs) per 30 days on
household type pan, tobacco &
intoxicants
fuel &
light
clothing
footwear
misc. goods &
services
durable goods
non-food total
all
clothing (second hand)
durable goods
(second hand)
no. of sample hhs reporting
consumption
(1) (17) (18) (19) (20) (21) (22) (23) (24) (25) (26) (27) Punjab self-employed in non-ag. 15.38 68.21 48.04 11.38 171.46 19.76 334.24 687.41 0.02 0.12 316 agricultural labour 11.97 63.90 35.73 9.26 111.55 7.60 240.01 537.19 0.17 0.04 530 other labour 16.97 73.03 34.32 8.87 149.59 12.26 295.04 622.74 0.22 1.01 154 self-employed in ag. 16.28 81.28 61.94 15.56 227.61 31.17 433.85 910.01 0.02 5.79 774 other households 16.20 83.01 58.11 14.01 234.46 28.11 433.89 854.35 0.13 0.20 378 not recorded - - - - - - - - - - - all types 15.00 74.17 49.85 12.43 182.10 21.00 354.55 742.82 0.09 2.14 2152 Rajasthan self-employed in non-ag. 16.74 49.76 41.19 8.88 107.03 15.15 238.77 566.09 0.08 0.42 477 agricultural labour 21.16 42.38 35.05 7.52 74.68 7.42 188.20 470.44 0.00 0.04 239 other labour 21.78 47.17 33.49 6.72 81.19 12.64 202.99 469.87 0.03 1.18 442 self-employed in ag. 17.71 47.63 39.21 8.89 93.30 13.46 220.20 561.36 0.05 0.50 1744 other households 13.13 51.49 47.88 10.09 137.79 19.84 280.22 652.45 0.07 0.12 327 not recorded - - - - - - - - - - - all types 18.08 47.73 39.00 8.57 95.33 13.58 222.28 548.88 0.05 0.52 3229 Sikkim self-employed in non-ag. 27.32 43.03 48.76 12.50 141.12 5.58 278.31 607.57 1.15 0.00 117 agricultural labour 28.90 41.21 31.52 8.52 75.70 2.68 188.53 447.33 2.84 0.01 119 other labour 31.62 38.58 47.57 11.80 85.98 4.24 219.79 529.53 1.42 0.00 81 self-employed in ag. 37.95 39.41 38.85 10.97 51.78 6.31 185.27 458.71 2.41 0.01 495 other households 26.25 53.00 59.06 16.35 186.02 7.30 347.98 731.44 0.81 0.00 244 not recorded - - - - - - - - - - - all types 33.05 42.77 43.60 11.99 92.69 5.86 229.97 531.85 1.96 0.01 1056 (Contd.)

Appendix Tables
NSS Report No.472: Differences in Level of Consumption among Socio-Economic Groups,1999-2000 A-154
Table 6R: Break-up of MPCE by broad groups of non-food items separately for each household type in rural areas and by State/UT
Rural average per capita consumption expenditure (Rs) per 30 days on
household type pan, tobacco &
intoxicants
fuel &
light
clothing
footwear
misc. goods &
services
durable goods
non-food total
all
clothing (second hand)
durable goods
(second hand)
no. of sample hhs reporting
consumption
(1) (17) (18) (19) (20) (21) (22) (23) (24) (25) (26) (27) Tamil Nadu self-employed in non-ag. 13.31 38.21 30.74 3.44 138.40 12.80 236.90 547.13 0.01 0.09 659 agricultural labour 21.01 29.92 24.85 2.33 82.58 5.19 165.87 435.92 0.03 0.01 1647 other labour 14.99 37.48 31.49 3.71 130.08 23.68 241.42 559.17 0.04 0.61 436 self-employed in ag. 14.08 34.74 33.85 3.59 125.97 16.29 228.51 557.91 0.01 0.36 911 other households 14.62 48.96 39.86 5.28 202.41 18.55 329.69 700.09 0.07 0.00 512 not recorded 3.93 28.36 24.08 2.91 152.09 5.57 216.94 467.45 0.00 0.00 8 all types 17.23 34.67 29.56 3.16 115.59 11.94 212.16 514.06 0.03 0.17 4173 Tripura self-employed in non-ag. 25.32 41.56 34.95 4.68 92.40 9.62 208.52 572.13 0.02 0.01 193 agricultural labour 17.15 26.86 22.10 2.69 55.30 5.18 129.28 395.95 0.06 0.08 181 other labour 20.12 34.35 26.35 3.41 56.81 4.12 145.17 451.89 0.00 0.00 214 self-employed in ag. 21.22 36.48 31.86 5.66 81.71 8.57 185.50 561.64 0.08 0.00 251 other households 28.25 43.54 43.74 6.36 122.92 11.74 256.54 660.04 0.24 0.00 189 not recorded 13.90 38.64 20.46 4.94 42.93 2.76 123.63 455.15 0.00 0.00 3 all types 22.26 36.53 31.63 4.60 81.09 7.80 183.90 528.41 0.08 0.02 1031 Uttar Pradesh self-employed in non-ag. 12.21 33.02 33.33 5.33 88.88 10.91 183.68 440.04 0.20 0.42 1492 agricultural labour 11.55 32.41 26.83 3.62 68.21 7.34 149.95 368.55 0.07 0.06 1637 other labour 13.80 33.61 31.10 5.09 88.60 12.17 184.36 427.90 0.09 0.04 547 self-employed in ag. 12.38 34.98 37.90 6.05 106.46 17.09 214.86 499.62 0.08 0.62 4741 other households 10.81 38.93 40.45 7.16 129.94 16.51 243.80 553.54 0.35 0.02 994 not recorded 9.57 30.39 33.48 4.86 73.34 7.38 159.01 430.42 0.00 0.00 21 all types 12.14 34.45 34.98 5.53 97.62 13.98 198.70 466.64 0.12 0.40 9432 (Contd.)

Appendix Tables
NSS Report No.472: Differences in Level of Consumption among Socio-Economic Groups,1999-2000 A-155
Table 6R: Break-up of MPCE by broad groups of non-food items separately for each household type in rural areas and by State/UT
Rural average per capita consumption expenditure (Rs) per 30 days on
household type pan, tobacco &
intoxicants
fuel &
light
clothing
footwear
misc. goods &
services
durable goods
non-food total
all
clothing (second hand)
durable goods
(second hand)
no. of sample hhs reporting
consumption
(1) (17) (18) (19) (20) (21) (22) (23) (24) (25) (26) (27) West Bengal self-employed in non-ag. 9.71 35.99 29.88 3.31 67.26 5.44 151.59 451.80 0.05 0.12 1085 agricultural labour 11.37 32.46 25.69 2.45 44.37 3.74 120.09 382.86 0.19 0.01 1492 other labour 11.52 35.60 30.31 2.83 69.10 4.01 153.37 454.26 0.22 0.00 241 self-employed in ag. 9.82 36.73 32.23 3.68 75.74 7.00 165.20 489.56 0.09 0.19 1093 other households 13.57 48.81 46.29 42.75 127.08 11.58 290.07 680.20 0.05 0.28 620 not recorded 9.20 31.92 23.42 2.42 34.79 4.34 106.09 365.32 0.39 0.00 19 all types 10.83 35.95 30.32 6.68 65.87 5.63 155.27 454.80 0.12 0.10 4550 A. & N. Islands self-employed in non-ag. 50.83 49.04 51.21 13.72 170.10 92.14 427.04 953.89 0.00 10.60 26 agricultural labour 31.35 39.59 40.30 10.20 117.13 9.81 248.37 681.32 0.00 0.19 33 other labour 40.07 45.93 49.67 11.25 153.88 27.28 328.08 840.79 0.81 0.00 55 self-employed in ag. 38.04 34.76 40.62 8.42 87.63 12.52 222.00 675.95 0.00 0.00 121 other households 28.79 60.44 63.70 18.09 260.44 92.62 524.08 1068.52 0.00 0.44 38 not recorded all types 37.32 42.06 46.13 10.83 133.32 30.24 299.90 780.21 0.19 0.78 273 Chandigarh self-employed in non-ag. 45.31 50.62 39.96 10.14 205.80 17.78 369.61 824.93 2.20 0.00 47 agricultural labour 18.96 58.64 41.38 10.69 233.25 23.77 386.71 783.71 1.35 0.53 24 other labour 31.27 60.53 37.63 8.48 218.62 33.75 390.27 768.74 3.74 2.53 28 self-employed in ag. 133.43 41.10 47.26 10.25 282.52 167.81 682.38 1412.09 0.00 0.00 6 other households 21.38 63.55 48.79 11.61 270.70 222.65 638.68 1076.96 0.88 1.20 75 not recorded - - - - - - - - - - - all types 45.27 56.11 43.97 10.49 245.54 114.74 516.12 989.19 1.53 0.86 180 (Contd.)

Appendix Tables
NSS Report No.472: Differences in Level of Consumption among Socio-Economic Groups,1999-2000 A-156
Table 6R: Break-up of MPCE by broad groups of non-food items separately for each household type in rural areas and by State/UT
Rural average per capita consumption expenditure (Rs) per 30 days on
household type pan, tobacco &
intoxicants
fuel &
light
clothing
footwear
misc. goods &
services
durable goods
non-food total
all
clothing (second hand)
durable goods
(second hand)
no. of sample hhs reporting
consumption
(1) (17) (18) (19) (20) (21) (22) (23) (24) (25) (26) (27) Dadra & Nagar Haveli self-employed in non-ag. 24.39 52.20 35.91 5.57 154.69 31.97 304.74 656.47 0.00 18.47 27 agricultural labour 33.14 40.09 26.70 5.56 79.21 5.43 190.13 463.40 0.00 0.00 18 other labour 31.26 36.23 24.99 3.60 91.97 4.64 192.69 483.34 0.02 0.00 52 self-employed in ag. 41.59 36.30 24.93 3.82 70.10 5.39 182.13 447.58 0.36 0.00 64 other households 24.75 57.85 46.91 8.01 247.45 17.76 402.73 1144.81 0.00 0.00 31 not recorded - - - - - - - - - - - all types 34.14 40.70 28.75 4.55 106.45 9.35 223.94 561.18 0.15 1.91 192 Daman & Diu self-employed in non-ag. 45.19 65.98 57.64 7.68 312.82 35.97 525.27 1009.56 0.23 0.00 25 agricultural labour 35.37 44.96 46.89 4.74 115.00 12.13 259.09 609.69 0.13 0.00 37 other labour 30.63 66.41 51.52 7.86 244.59 18.40 419.41 944.89 0.00 0.00 56 self-employed in ag. 39.63 51.48 52.56 8.14 182.16 30.72 364.69 794.91 0.00 0.00 20 other households 39.95 61.34 76.45 12.29 375.08 44.43 609.54 1249.18 0.00 0.00 42 not recorded - - - - - - - - - - - all types 36.12 58.39 55.36 7.82 234.57 24.61 416.86 901.48 0.06 0.00 180 Delhi self-employed in non-ag. 40.83 53.49 47.32 16.11 265.32 27.23 450.31 855.19 0.19 0.00 61 agricultural labour 7.55 51.23 53.71 12.00 186.38 11.27 322.14 761.55 0.00 7.38 15 other labour 14.81 59.95 34.91 11.60 199.71 3.62 324.61 689.53 0.00 0.00 3 self-employed in ag. 29.35 59.09 43.49 12.51 349.63 18.00 512.06 997.43 0.00 9.60 9 other households 24.95 62.40 60.00 16.19 362.97 31.23 557.74 961.87 0.00 0.00 99 not recorded - - - - - - - - - - - all types 29.65 58.89 54.91 15.88 321.93 28.60 509.86 917.21 0.06 0.51 187 (Contd.)

Appendix Tables
NSS Report No.472: Differences in Level of Consumption among Socio-Economic Groups,1999-2000 A-157
Table 6R: Break-up of MPCE by broad groups of non-food items separately for each household type in rural areas and by State/UT
Rural average per capita consumption expenditure (Rs) per 30 days on
household type pan, tobacco &
intoxicants
fuel &
light
clothing
footwear
misc. goods &
services
durable goods
non-food total
all
clothing (second hand)
durable goods
(second hand)
no. of sample hhs reporting
consumption
(1) (17) (18) (19) (20) (21) (22) (23) (24) (25) (26) (27) Lakshadweep self-employed in non-ag. 60.68 79.11 70.67 7.46 155.72 27.45 401.10 1073.21 0.00 0.00 5 agricultural labour 41.62 53.00 26.83 3.47 55.02 10.78 190.73 684.91 0.00 0.00 6 other labour 19.45 59.22 50.98 6.27 192.36 34.66 362.94 833.70 0.00 0.00 16 self-employed in ag. 40.85 58.65 45.70 9.76 111.82 70.65 337.43 925.23 0.00 0.00 21 other households 20.00 72.15 51.45 8.67 163.08 24.91 340.25 886.19 0.00 0.00 36 not recorded - - - - - - - - - - - all types 27.86 65.46 48.39 8.13 145.63 36.70 332.17 876.19 0.00 0.00 84 Pondicherry self-employed in non-ag. 28.76 42.80 39.99 4.46 131.12 36.53 283.66 643.74 0.00 0.00 32 agricultural labour 26.90 35.83 26.89 2.55 83.80 5.73 181.70 457.38 0.00 0.00 125 other labour 23.98 41.87 40.28 5.13 176.88 13.57 301.72 660.33 0.00 0.06 49 self-employed in ag. 18.92 41.85 53.45 7.49 209.97 31.83 363.51 813.42 0.00 0.00 30 other households 3.31 58.36 55.40 7.76 255.34 27.17 407.34 867.68 0.00 0.00 52 not recorded - - - - - - - - - - - all types 22.69 41.32 36.65 4.31 138.91 15.46 259.33 597.63 0.00 0.01 288 all-India self-employed in non-ag. 13.40 37.85 33.67 5.21 102.80 13.59 206.52 502.52 0.13 0.37 10385 agricultural labour 13.87 31.31 25.95 3.14 64.84 5.88 145.00 386.29 0.19 0.04 18698 other labour 17.74 37.99 30.89 4.91 95.95 13.47 200.96 482.96 0.14 0.29 5390 self-employed in ag. 13.68 37.50 36.84 5.95 100.77 16.09 210.82 519.75 0.09 0.44 27134 other households 13.34 46.67 44.08 10.81 161.05 20.07 296.02 652.59 0.13 0.69 9640 not recorded 10.82 34.67 31.65 4.41 71.95 7.18 160.68 445.89 0.18 0.00 138 all types 13.96 36.56 33.28 5.37 95.42 12.76 197.36 486.16 0.14 0.32 71385

Appendix Tables
NSS Report No.472: Differences in Level of Consumption among Socio-Economic Groups,1999-2000 A-158
Table 6U: Break-up of MPCE by broad groups of non-food items separately for each social group in urban areas and by State/UT
Urban average per capita consumption expenditure (Rs) per 30 days on
household type pan, tobacco &
intoxicants
fuel &
light
clothing
footwear
misc. goods &
services
durable goods
non-food total
all
clothing (second hand)
durable goods
(second hand)
no. of sample hhs reporting
consumption
(1) (17) (18) (19) (20) (21) (22) (23) (24) (25) (26) (27) Andhra Pradesh self-employed 17.27 53.36 42.83 6.30 224.39 15.38 359.52 709.96 0.19 0.30 1246 regular wage/salarid 19.32 62.05 56.62 9.32 347.46 29.60 524.37 935.02 0.05 0.04 1574 casual labour 21.75 37.04 24.95 3.19 111.39 4.26 202.57 482.44 0.10 0.24 570 others households 6.42 64.58 55.86 9.32 387.65 31.97 555.81 1010.64 0.05 0.00 407 not recorded 5.44 45.17 39.45 6.80 219.97 1.64 318.46 616.10 0.00 0.00 9 all types 18.25 54.28 45.60 7.08 261.50 19.86 406.57 773.52 0.11 0.16 3806 Arunachal Pradesh self-employed 46.54 47.80 38.36 9.84 148.42 19.91 310.88 712.64 0.00 0.00 39 regular wage/salarid 46.76 59.18 41.81 11.39 146.26 20.78 326.18 780.21 0.00 0.00 141 casual labour 45.64 47.42 27.46 7.94 152.49 4.58 285.53 714.50 0.00 0.00 17 others households 60.78 80.41 31.12 11.66 131.54 12.05 327.57 752.53 0.00 0.00 31 not recorded 31.25 94.78 60.03 26.01 319.53 52.02 583.62 1164.89 0.00 0.00 5 all types 48.36 59.32 39.13 11.04 146.31 18.85 323.02 762.66 0.00 0.00 233 Assam self-employed 23.30 48.92 45.65 8.60 157.65 14.01 298.12 705.49 0.00 0.00 270 regular wage/salarid 28.87 64.16 58.57 11.90 304.09 18.40 486.00 1007.12 0.06 0.03 354 casual labour 15.67 33.58 25.09 4.25 75.14 5.83 159.55 464.63 0.05 0.00 79 others households 18.55 58.07 53.11 9.89 219.39 14.34 373.35 873.86 0.00 0.00 145 not recorded 32.41 80.70 35.68 7.67 433.82 5.39 595.67 1235.08 0.00 0.00 4 all types 24.04 54.18 49.14 9.52 211.62 14.79 363.30 814.12 0.03 0.01 852
(Contd.)

Appendix Tables
NSS Report No.472: Differences in Level of Consumption among Socio-Economic Groups,1999-2000 A-159
Table 6U: Break-up of MPCE by broad groups of non-food items separately for each social group in urban areas and by State/UT
Urban average per capita consumption expenditure (Rs) per 30 days on
household type pan, tobacco &
intoxicants
fuel &
light
clothing
footwear
misc. goods &
services
durable goods
non-food total
all
clothing (second hand)
durable goods
(second hand)
no. of sample hhs reporting
consumption
(1) (17) (18) (19) (20) (21) (22) (23) (24) (25) (26) (27) Bihar self-employed 9.46 41.74 35.61 5.43 106.03 10.71 208.97 524.91 0.04 0.44 881 regular wage/salarid 13.55 47.19 52.72 8.78 218.08 29.32 369.63 784.33 0.58 0.04 766 casual labour 8.33 30.12 21.93 2.29 45.64 6.21 114.54 343.35 0.09 0.00 278 others households 9.48 49.55 41.48 6.88 173.70 12.49 293.58 678.77 0.01 0.08 336 not recorded 7.81 40.97 30.79 4.34 79.47 10.20 173.58 503.03 0.16 0.00 18 all types 10.58 42.96 39.91 6.25 141.51 16.14 257.36 601.88 0.21 0.21 2279 Goa self-employed 18.39 56.54 44.88 9.82 304.72 43.21 477.55 1075.72 0.00 6.22 52 regular wage/salarid 16.79 66.49 50.97 12.68 428.38 78.33 653.64 1285.90 0.00 0.00 170 casual labour 30.72 44.33 35.20 5.79 208.28 9.45 333.76 778.28 0.00 0.17 40 others households 43.95 69.22 40.19 8.75 338.63 60.83 561.57 1157.46 0.00 0.00 22 not recorded - - - - - - - - - - - all types 21.05 61.17 46.58 10.77 363.48 59.36 562.42 1155.45 0.00 1.21 284 Gujarat self-employed 12.56 73.31 55.92 11.50 257.30 36.44 447.02 890.35 0.42 0.02 1086 regular wage/salarid 11.90 75.12 61.91 12.90 313.04 46.99 521.87 995.97 0.26 0.63 1007 casual labour 20.35 47.88 38.24 6.86 131.73 13.97 259.03 600.29 1.46 0.20 432 others households 6.55 72.75 77.73 14.55 388.90 74.86 635.34 1201.15 0.52 0.00 238 not recorded 75.00 76.56 108.39 19.52 140.40 32.47 452.34 1249.99 0.00 0.00 1 all types 13.45 69.33 55.97 11.32 261.44 38.10 449.62 891.68 0.55 0.28 2764 (Contd.)

Appendix Tables
NSS Report No.472: Differences in Level of Consumption among Socio-Economic Groups,1999-2000 A-160
Table 6U: Break-up of MPCE by broad groups of non-food items separately for each social group in urban areas and by State/UT
Urban average per capita consumption expenditure (Rs) per 30 days on
household type pan, tobacco &
intoxicants
fuel &
light
clothing
footwear
misc. goods &
services
durable goods
non-food total
all
clothing (second hand)
durable goods
(second hand)
no. of sample hhs reporting
consumption
(1) (17) (18) (19) (20) (21) (22) (23) (24) (25) (26) (27) Haryana self-employed 16.68 82.19 62.40 17.37 261.63 21.09 461.38 880.97 0.19 0.69 328 regular wage/salarid 19.45 97.57 62.48 18.30 367.24 43.29 608.33 1066.53 0.05 0.36 278 casual labour 26.43 58.98 31.66 8.66 151.69 4.43 281.86 601.80 0.40 0.34 80 others households 8.59 114.44 74.66 20.80 381.96 41.29 641.74 1089.51 0.45 0.00 66 not recorded 6.23 27.80 32.98 13.08 69.65 3.94 153.68 396.42 0.00 0.00 6 all types 18.37 85.48 58.50 16.63 287.34 27.38 493.70 912.08 0.18 0.48 758 Himachal Pradesh self-employed 17.82 64.33 89.45 29.33 311.57 30.07 542.57 1059.66 0.35 0.00 226 regular wage/salarid 26.80 67.60 115.69 36.45 447.20 95.45 789.18 1389.50 0.20 9.34 489 casual labour 31.04 51.58 39.97 15.58 131.17 13.51 282.85 691.92 3.18 3.52 55 others households 8.04 54.60 102.77 33.86 529.11 31.88 760.26 1357.59 0.06 0.11 176 not recorded 0.00 80.00 275.35 86.31 362.00 57.54 861.20 1824.70 0.00 0.00 1 all types 20.55 62.73 100.39 32.47 405.54 57.91 679.60 1243.09 0.42 4.36 947 Jammu & Kashmir self-employed 16.84 59.47 62.30 17.59 191.91 34.32 382.43 890.04 0.07 0.03 383 regular wage/salarid 22.38 63.97 69.35 19.52 266.63 53.11 494.97 1062.09 0.00 0.01 447 casual labour 14.08 49.26 44.11 11.17 98.59 11.25 228.46 650.30 0.08 0.00 97 others households 13.72 60.63 64.36 16.58 293.57 47.64 496.51 1065.54 0.45 11.30 79 not recorded 32.93 68.99 64.75 22.88 693.62 5.26 888.43 1442.29 0.00 0.00 2 all types 18.76 60.46 63.62 17.70 222.46 40.96 423.97 952.84 0.07 0.80 1008 (Contd.)

Appendix Tables
NSS Report No.472: Differences in Level of Consumption among Socio-Economic Groups,1999-2000 A-161
Table 6U: Break-up of MPCE by broad groups of non-food items separately for each social group in urban areas and by State/UT
Urban average per capita consumption expenditure (Rs) per 30 days on
household type pan, tobacco &
intoxicants
fuel &
light
clothing
footwear
misc. goods &
services
durable goods
non-food total
all
clothing (second hand)
durable goods
(second hand)
no. of sample hhs reporting
consumption
(1) (17) (18) (19) (20) (21) (22) (23) (24) (25) (26) (27) Karnataka self-employed 11.13 65.38 50.49 7.67 278.51 18.09 431.26 848.08 0.01 0.14 831 regular wage/salarid 10.65 79.92 58.91 11.13 395.92 60.78 617.31 1082.19 0.06 3.58 1010 casual labour 19.14 48.51 31.08 3.61 127.84 8.63 238.83 541.51 0.16 0.10 374 others households 12.44 81.79 60.96 12.23 409.08 42.29 618.79 1101.42 0.11 0.00 252 not recorded 59.84 71.50 36.40 4.55 311.38 19.28 502.95 860.68 0.00 0.00 3 all types 12.48 69.71 51.40 8.73 310.88 35.85 489.05 910.99 0.06 1.55 2470 Kerala self-employed 17.93 57.71 53.85 8.28 269.05 73.39 480.22 949.65 0.02 4.49 739 regular wage/salarid 18.53 61.24 68.23 11.49 374.58 75.21 609.28 1129.01 0.05 0.83 587 casual labour 22.90 40.67 34.62 5.08 152.14 41.44 296.85 653.18 0.01 0.29 471 others households 5.97 66.60 79.54 13.48 457.82 55.72 679.13 1258.56 0.06 0.05 212 not recorded 4.30 54.25 51.69 6.53 462.78 38.61 618.15 1037.46 0.00 0.00 6 all types 18.59 54.29 53.84 8.56 276.93 63.06 475.26 932.62 0.03 1.97 2015 Madhya Pradesh self-employed 16.12 53.17 43.84 8.67 188.60 32.63 343.03 668.32 0.01 0.49 1204 regular wage/salarid 17.61 57.35 53.00 10.01 249.88 48.97 436.82 801.47 0.02 0.97 1233 casual labour 15.85 41.09 29.96 4.79 85.04 7.51 184.24 417.64 0.11 0.36 445 others households 18.78 66.40 53.22 11.67 285.60 106.30 541.96 958.70 0.04 0.00 253 not recorded 9.12 74.41 36.16 6.98 147.78 34.56 309.01 618.73 0.00 0.00 10 all types 16.77 53.58 45.47 8.70 199.87 39.05 363.44 693.56 0.03 0.61 3145 (Contd.)

Appendix Tables
NSS Report No.472: Differences in Level of Consumption among Socio-Economic Groups,1999-2000 A-162
Table 6U: Break-up of MPCE by broad groups of non-food items separately for each social group in urban areas and by State/UT
Urban average per capita consumption expenditure (Rs) per 30 days on
household type pan, tobacco &
intoxicants
fuel &
light
clothing
footwear
misc. goods &
services
durable goods
non-food total
all
clothing (second hand)
durable goods
(second hand)
no. of sample hhs reporting
consumption
(1) (17) (18) (19) (20) (21) (22) (23) (24) (25) (26) (27) Maharashtra self-employed 15.66 65.82 59.09 11.28 317.25 60.99 530.09 966.31 0.10 0.45 1632 regular wage/salarid 15.21 66.95 61.41 12.02 370.64 48.32 574.56 1043.61 0.17 0.75 2768 casual labour 17.35 39.78 32.50 4.86 132.25 13.50 240.25 516.64 0.23 0.19 504 others households 10.28 102.57 82.62 15.02 590.41 34.35 835.26 1418.43 0.05 1.32 318 not recorded 13.54 32.19 37.83 8.23 181.89 25.21 298.89 617.80 0.00 0.78 12 all types 15.40 64.86 58.20 11.09 334.88 47.91 532.34 973.33 0.15 0.62 5234 Manipur self-employed 20.19 53.00 22.83 7.63 125.70 11.51 240.86 616.69 0.02 0.06 285 regular wage/salarid 21.91 53.11 30.74 10.15 256.12 21.81 393.85 823.57 0.01 0.03 262 casual labour 29.98 51.96 18.67 5.48 80.47 4.36 190.93 519.73 0.00 0.00 30 others households 11.83 47.31 25.21 8.91 124.93 4.36 222.54 594.59 0.00 0.00 83 not recorded 9.59 52.87 30.17 6.32 61.57 0.00 160.51 524.25 0.00 0.00 5 all types 20.54 52.57 26.62 8.84 184.56 15.46 308.59 707.77 0.01 0.04 665 Meghalaya self-employed 43.78 54.84 51.28 17.36 300.53 28.55 496.34 907.93 6.34 0.00 76 regular wage/salarid 66.63 57.25 55.76 18.38 321.14 19.63 538.78 1007.35 3.66 0.00 205 casual labour 77.90 49.88 32.42 11.45 177.96 4.52 354.13 715.59 5.92 0.00 36 others households 54.43 57.75 66.01 22.99 356.24 9.16 566.58 1162.52 2.30 0.00 65 not recorded 175.71 82.57 142.19 35.99 532.97 188.22 1157.65 2076.94 0.00 0.00 2 all types 62.27 56.11 53.50 17.88 305.65 19.67 515.08 972.06 4.34 0.00 384 (Contd.)

Appendix Tables
NSS Report No.472: Differences in Level of Consumption among Socio-Economic Groups,1999-2000 A-163
Table 6U: Break-up of MPCE by broad groups of non-food items separately for each social group in urban areas and by State/UT
Urban average per capita consumption expenditure (Rs) per 30 days on
household type pan, tobacco &
intoxicants
fuel &
light
clothing
footwear
misc. goods &
services
durable goods
non-food total
all
clothing (second hand)
durable goods
(second hand)
no. of sample hhs reporting
consumption
(1) (17) (18) (19) (20) (21) (22) (23) (24) (25) (26) (27) Mizoram self-employed 59.15 68.82 57.41 28.72 262.64 33.60 510.34 1039.78 0.01 0.41 298 regular wage/salarid 65.95 73.78 72.52 34.99 305.51 25.37 578.12 1182.51 0.01 0.06 388 casual labour 49.85 69.26 46.89 24.74 163.07 7.71 361.51 787.84 0.00 0.00 105 others households 43.53 74.93 41.80 20.77 142.88 8.44 332.34 904.40 0.00 0.21 59 not recorded 51.70 60.54 62.57 30.47 201.56 11.59 418.42 882.30 0.00 0.00 8 all types 59.70 71.30 61.49 30.36 259.14 24.76 506.75 1056.65 0.01 0.19 858 Nagaland self-employed 64.74 91.94 92.06 24.86 399.82 59.23 732.64 1384.37 2.68 0.00 33 regular wage/salarid 46.45 86.44 73.99 23.77 375.96 28.46 635.06 1209.05 3.60 0.00 175 casual labour 48.31 65.62 58.69 14.50 252.76 22.69 462.57 934.45 2.74 0.00 7 others households 22.47 76.86 82.44 30.75 413.24 41.36 667.13 1293.81 4.91 0.00 47 not recorded 18.75 135.38 100.91 18.80 259.70 6.68 540.21 1177.15 9.25 0.00 2 all types 45.14 85.37 77.74 24.86 382.57 34.84 650.51 1242.39 3.68 0.00 264 Orissa self-employed 10.04 48.49 34.82 4.73 109.04 15.20 222.33 553.63 0.01 0.03 317 regular wage/salarid 13.43 59.65 48.18 7.66 205.60 18.84 353.36 759.63 0.01 0.08 471 casual labour 12.56 35.89 22.36 2.26 52.12 9.84 135.03 395.58 0.17 0.00 152 others households 13.21 58.53 37.72 5.10 169.72 9.31 293.59 656.11 0.01 0.00 107 not recorded 14.70 54.06 36.77 0.97 232.92 58.32 397.74 818.30 0.00 0.00 3 all types 12.07 51.66 38.36 5.53 143.25 15.38 266.25 618.48 0.04 0.04 1050 (Contd.)

Appendix Tables
NSS Report No.472: Differences in Level of Consumption among Socio-Economic Groups,1999-2000 A-164
Table 6U: Break-up of MPCE by broad groups of non-food items separately for each social group in urban areas and by State/UT
Urban average per capita consumption expenditure (Rs) per 30 days on
household type pan, tobacco &
intoxicants
fuel &
light
clothing
footwear
misc. goods &
services
durable goods
non-food total
all
clothing (second hand)
durable goods
(second hand)
no. of sample hhs reporting
consumption
(1) (17) (18) (19) (20) (21) (22) (23) (24) (25) (26) (27) Punjab self-employed 14.89 82.36 66.18 18.80 267.95 25.68 475.85 905.07 0.09 0.29 774 regular wage/salarid 14.62 84.64 64.54 18.08 294.93 30.94 507.75 938.13 0.07 0.29 766 casual labour 19.96 66.21 38.27 10.23 149.35 8.96 292.97 634.25 0.63 1.64 213 others households 11.03 94.96 76.30 22.35 407.05 22.93 634.62 1143.73 0.11 0.00 126 not recorded 58.29 93.30 81.25 17.71 222.11 3.94 476.60 811.45 0.00 0.00 4 all types 15.26 82.05 62.84 17.70 271.92 25.51 475.28 898.82 0.14 0.43 1883 Rajasthan self-employed 11.86 59.20 49.20 12.12 187.86 22.18 342.43 721.16 0.10 0.40 841 regular wage/salarid 17.49 63.73 59.75 14.03 293.96 33.36 482.32 937.78 0.15 0.33 772 casual labour 25.70 57.20 35.07 8.53 97.03 5.70 229.24 527.05 0.46 0.03 183 others households 8.48 72.49 52.20 13.17 271.44 18.10 435.88 890.25 0.21 0.10 189 not recorded - - - - - - - - - - - all types 15.48 61.48 52.06 12.55 224.93 24.67 391.17 795.81 0.16 0.32 1985 Sikkim self-employed 23.62 51.59 69.41 15.19 270.55 7.24 437.60 844.15 0.24 0.00 73 regular wage/salarid 38.84 58.39 63.49 23.53 329.28 14.57 528.11 980.71 0.67 0.01 177 casual labour 17.58 27.24 31.63 25.10 66.14 2.23 169.93 444.69 0.91 0.00 17 others households 37.47 50.76 75.10 23.19 318.86 11.44 516.82 1040.39 0.00 0.00 19 not recorded 81.02 65.51 131.24 38.84 194.44 37.15 548.19 1191.19 6.97 0.00 2 all types 32.75 53.85 64.14 21.05 292.03 11.40 475.22 905.69 0.55 0.00 288 (Contd.)

Appendix Tables
NSS Report No.472: Differences in Level of Consumption among Socio-Economic Groups,1999-2000 A-165
Table 6U: Break-up of MPCE by broad groups of non-food items separately for each social group in urban areas and by State/UT
Urban average per capita consumption expenditure (Rs) per 30 days on
household type pan, tobacco &
intoxicants
fuel &
light
clothing
footwear
misc. goods &
services
durable goods
non-food total
all
clothing (second hand)
durable goods
(second hand)
no. of sample hhs reporting
consumption
(1) (17) (18) (19) (20) (21) (22) (23) (24) (25) (26) (27) Tamil Nadu self-employed 14.76 59.26 46.83 5.86 337.88 26.27 490.87 957.52 0.09 0.21 1374 regular wage/salarid 14.05 63.57 55.62 8.54 378.11 31.74 551.62 1021.25 0.04 0.31 1745 casual labour 20.38 325.86 28.19 3.53 137.25 9.61 524.81 837.29 0.08 0.65 703 others households 8.35 71.43 57.27 7.78 424.50 18.66 587.98 1129.56 0.00 0.06 379 not recorded 7.78 45.22 41.89 5.86 235.65 7.98 344.39 701.32 0.22 0.00 11 all types 15.12 111.78 47.67 6.67 322.23 24.99 528.46 971.64 0.06 0.32 4212 Tripura self-employed 30.09 51.09 46.47 6.52 183.57 26.39 344.13 808.54 0.03 0.00 183 regular wage/salarid 36.75 53.08 62.67 9.56 279.13 36.53 477.72 1034.35 0.47 0.00 237 casual labour 17.31 41.10 23.44 1.91 73.83 3.36 160.94 487.96 0.00 0.00 71 others households 26.14 56.39 48.29 7.06 190.30 12.54 340.71 822.26 0.18 0.00 75 not recorded 5.26 52.88 39.08 5.84 164.43 0.19 267.68 658.68 0.00 0.00 3 all types 31.20 51.28 51.44 7.44 215.89 26.91 384.15 876.59 0.25 0.00 569 Uttar Pradesh self-employed 13.05 49.07 43.33 8.28 162.28 20.56 296.57 626.57 0.23 0.04 2263 regular wage/salarid 15.94 58.06 55.58 11.61 272.23 29.80 443.23 850.09 0.20 0.20 1367 casual labour 15.23 36.62 27.33 4.47 80.63 6.57 170.86 406.44 0.25 0.01 473 others households 9.22 62.43 52.29 9.38 306.42 32.17 471.91 870.08 0.10 0.00 510 not recorded 24.68 38.14 42.19 7.26 119.08 10.18 241.53 514.44 0.36 0.00 25 all types 13.94 51.49 46.08 8.97 198.55 22.76 341.78 690.33 0.21 0.09 4638 (Contd.)
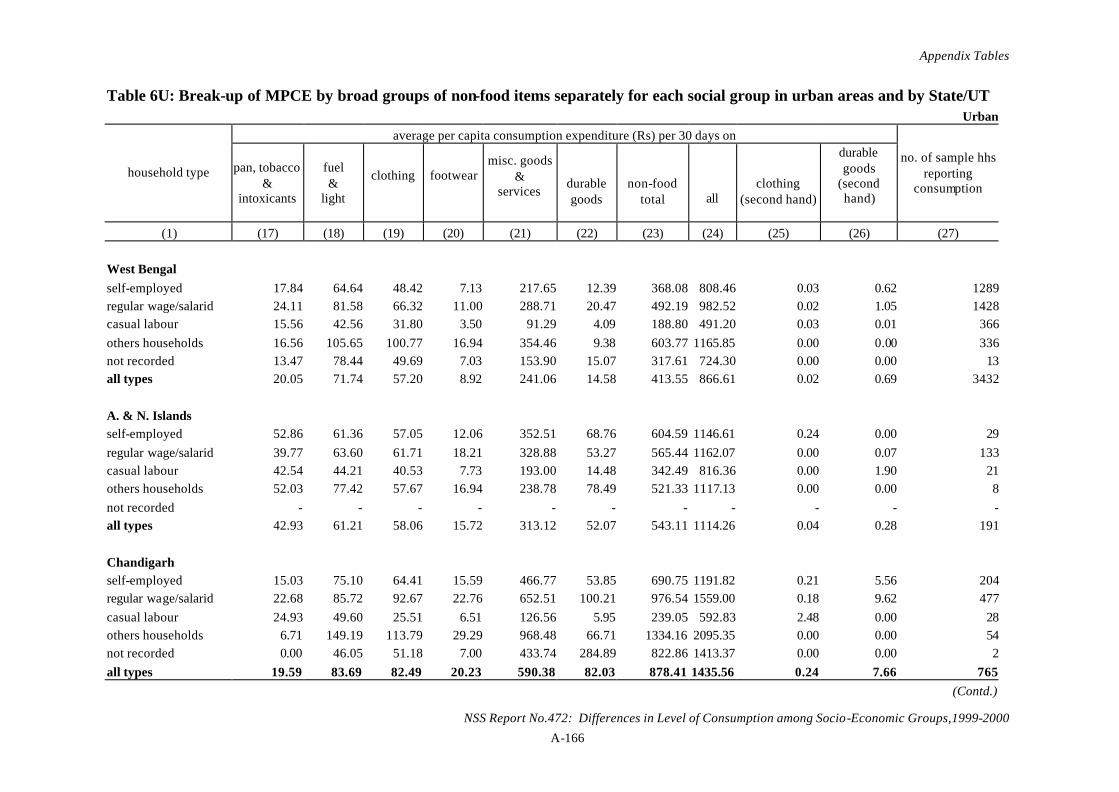
Appendix Tables
NSS Report No.472: Differences in Level of Consumption among Socio-Economic Groups,1999-2000 A-166
Table 6U: Break-up of MPCE by broad groups of non-food items separately for each social group in urban areas and by State/UT
Urban average per capita consumption expenditure (Rs) per 30 days on
household type pan, tobacco &
intoxicants
fuel &
light
clothing
footwear
misc. goods &
services
durable goods
non-food total
all
clothing (second hand)
durable goods
(second hand)
no. of sample hhs reporting
consumption
(1) (17) (18) (19) (20) (21) (22) (23) (24) (25) (26) (27) West Bengal self-employed 17.84 64.64 48.42 7.13 217.65 12.39 368.08 808.46 0.03 0.62 1289 regular wage/salarid 24.11 81.58 66.32 11.00 288.71 20.47 492.19 982.52 0.02 1.05 1428 casual labour 15.56 42.56 31.80 3.50 91.29 4.09 188.80 491.20 0.03 0.01 366 others households 16.56 105.65 100.77 16.94 354.46 9.38 603.77 1165.85 0.00 0.00 336 not recorded 13.47 78.44 49.69 7.03 153.90 15.07 317.61 724.30 0.00 0.00 13 all types 20.05 71.74 57.20 8.92 241.06 14.58 413.55 866.61 0.02 0.69 3432 A. & N. Islands self-employed 52.86 61.36 57.05 12.06 352.51 68.76 604.59 1146.61 0.24 0.00 29 regular wage/salarid 39.77 63.60 61.71 18.21 328.88 53.27 565.44 1162.07 0.00 0.07 133 casual labour 42.54 44.21 40.53 7.73 193.00 14.48 342.49 816.36 0.00 1.90 21 others households 52.03 77.42 57.67 16.94 238.78 78.49 521.33 1117.13 0.00 0.00 8 not recorded - - - - - - - - - - - all types 42.93 61.21 58.06 15.72 313.12 52.07 543.11 1114.26 0.04 0.28 191 Chandigarh self-employed 15.03 75.10 64.41 15.59 466.77 53.85 690.75 1191.82 0.21 5.56 204 regular wage/salarid 22.68 85.72 92.67 22.76 652.51 100.21 976.54 1559.00 0.18 9.62 477 casual labour 24.93 49.60 25.51 6.51 126.56 5.95 239.05 592.83 2.48 0.00 28 others households 6.71 149.19 113.79 29.29 968.48 66.71 1334.16 2095.35 0.00 0.00 54 not recorded 0.00 46.05 51.18 7.00 433.74 284.89 822.86 1413.37 0.00 0.00 2 all types 19.59 83.69 82.49 20.23 590.38 82.03 878.41 1435.56 0.24 7.66 765 (Contd.)
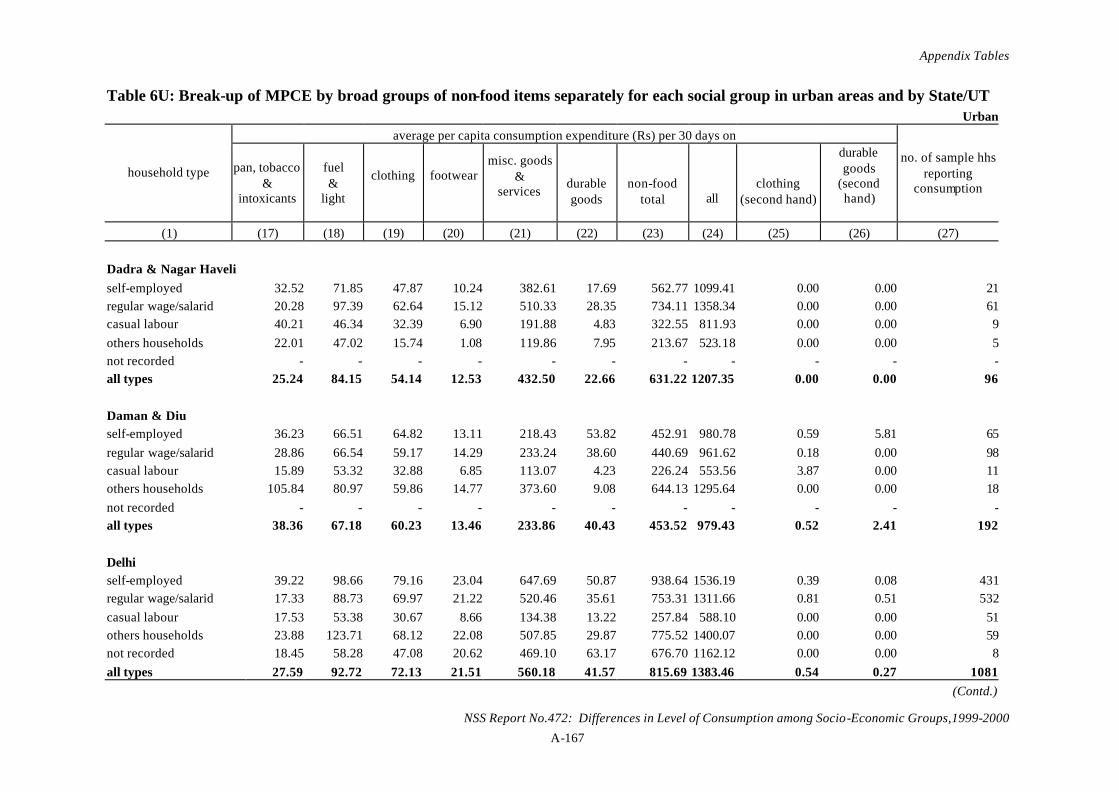
Appendix Tables
NSS Report No.472: Differences in Level of Consumption among Socio-Economic Groups,1999-2000 A-167
Table 6U: Break-up of MPCE by broad groups of non-food items separately for each social group in urban areas and by State/UT
Urban average per capita consumption expenditure (Rs) per 30 days on
household type pan, tobacco &
intoxicants
fuel &
light
clothing
footwear
misc. goods &
services
durable goods
non-food total
all
clothing (second hand)
durable goods
(second hand)
no. of sample hhs reporting
consumption
(1) (17) (18) (19) (20) (21) (22) (23) (24) (25) (26) (27) Dadra & Nagar Haveli self-employed 32.52 71.85 47.87 10.24 382.61 17.69 562.77 1099.41 0.00 0.00 21 regular wage/salarid 20.28 97.39 62.64 15.12 510.33 28.35 734.11 1358.34 0.00 0.00 61 casual labour 40.21 46.34 32.39 6.90 191.88 4.83 322.55 811.93 0.00 0.00 9 others households 22.01 47.02 15.74 1.08 119.86 7.95 213.67 523.18 0.00 0.00 5 not recorded - - - - - - - - - - - all types 25.24 84.15 54.14 12.53 432.50 22.66 631.22 1207.35 0.00 0.00 96 Daman & Diu self-employed 36.23 66.51 64.82 13.11 218.43 53.82 452.91 980.78 0.59 5.81 65 regular wage/salarid 28.86 66.54 59.17 14.29 233.24 38.60 440.69 961.62 0.18 0.00 98 casual labour 15.89 53.32 32.88 6.85 113.07 4.23 226.24 553.56 3.87 0.00 11 others households 105.84 80.97 59.86 14.77 373.60 9.08 644.13 1295.64 0.00 0.00 18 not recorded - - - - - - - - - - - all types 38.36 67.18 60.23 13.46 233.86 40.43 453.52 979.43 0.52 2.41 192 Delhi self-employed 39.22 98.66 79.16 23.04 647.69 50.87 938.64 1536.19 0.39 0.08 431 regular wage/salarid 17.33 88.73 69.97 21.22 520.46 35.61 753.31 1311.66 0.81 0.51 532 casual labour 17.53 53.38 30.67 8.66 134.38 13.22 257.84 588.10 0.00 0.00 51 others households 23.88 123.71 68.12 22.08 507.85 29.87 775.52 1400.07 0.00 0.00 59 not recorded 18.45 58.28 47.08 20.62 469.10 63.17 676.70 1162.12 0.00 0.00 8 all types 27.59 92.72 72.13 21.51 560.18 41.57 815.69 1383.46 0.54 0.27 1081 (Contd.)

Appendix Tables
NSS Report No.472: Differences in Level of Consumption among Socio-Economic Groups,1999-2000 A-168
Table 6U: Break-up of MPCE by broad groups of non-food items separately for each social group in urban areas and by State/UT
Urban average per capita consumption expenditure (Rs) per 30 days on
household type pan, tobacco &
intoxicants
fuel &
light
clothing
footwear
misc. goods &
services
durable goods
non-food total
all
clothing (second hand)
durable goods
(second hand)
no. of sample hhs reporting
consumption
(1) (17) (18) (19) (20) (21) (22) (23) (24) (25) (26) (27) Lakshadweep self-employed 40.64 78.26 55.15 7.62 151.03 37.47 370.16 924.40 0.00 0.00 74 regular wage/salarid 43.41 72.89 65.55 13.73 231.75 52.58 479.90 1113.58 0.00 0.00 82 casual labour 38.13 51.14 43.89 5.96 129.00 15.59 283.71 831.91 0.00 0.00 21 others households 36.95 62.66 69.47 16.77 140.69 52.62 379.17 1181.35 0.00 0.00 15 not recorded - - - - - - - - - - - all types 41.14 71.81 59.72 10.87 180.49 42.98 407.00 1018.24 0.00 0.00 192 Pondicherry self-employed 21.52 47.39 62.90 6.09 277.64 18.64 434.17 867.91 0.05 0.00 79 regular wage/salarid 15.74 47.23 49.15 6.78 260.07 31.40 410.37 819.49 0.00 0.42 159 casual labour 19.96 34.43 28.18 3.23 136.45 5.37 227.62 541.50 0.00 0.51 85 others households 25.21 66.64 54.78 6.32 409.14 15.59 577.69 1091.17 0.00 2.25 61 not recorded - - - - - - - - - - - all types 19.08 45.88 47.12 5.64 246.48 20.13 384.33 784.27 0.01 0.54 384 all-India self-employed 15.74 60.68 50.17 9.78 246.59 29.39 412.34 813.17 0.14 0.42 17626 regular wage/salarid 16.63 67.59 59.49 11.94 333.27 39.05 527.95 981.72 0.17 0.72 20359 casual labour 18.66 74.68 30.13 4.71 112.61 10.46 251.26 540.86 0.27 0.26 6024 others households 11.20 74.30 62.19 11.94 357.47 34.82 551.92 1031.06 0.10 0.23 4750 not recorded 16.51 48.11 41.00 8.73 193.20 19.16 326.71 663.33 0.12 0.08 165 all types 16.22 66.26 51.76 10.05 268.93 30.85 444.07 854.92 0.17 0.50 48924

Appendix Tables
NSS Report No.472: Differences in Level of Consumption among Socio-Economic Groups,1999-2000 A-180
Table 7U: Break-up of MPCE by broad groups of food items separately for each social group in urban areas by State/UT Urban
average per capita consumption expenditure (Rs) per 30 days on
social group cereals gram
cereal substi- tutes
pulses &
products
milk &
milk products
edibile oil
meat, egg &
fish
vegeta- bles
fruits (fresh)
fruits (dry)
sugar salt spices
beve- rages,
refresh- ments etc,
food total
(1) (2) (3) (4) (5) (6) (7) (8) (9) (10) (11) (12) (13) (14) (15) (16) Andhra Pradesh scheduled tribe 122.37 0.13 0.00 19.43 35.28 19.95 21.15 30.62 6.72 2.20 5.85 1.30 15.86 57.06 337.93 scheduled caste 116.27 0.09 0.01 19.50 36.70 19.30 27.81 31.01 7.02 1.94 7.56 1.28 15.64 42.44 326.59 other backward classes 117.59 0.14 0.00 22.61 44.50 20.83 27.60 31.39 8.74 2.07 8.74 1.40 16.84 45.27 347.72 others 124.06 0.34 0.00 25.76 66.15 24.35 25.60 34.34 12.40 4.13 10.26 1.51 16.18 51.25 396.32 not recorded 83.58 0.00 0.00 17.22 11.18 15.71 31.09 20.20 0.67 0.00 4.89 1.12 13.08 28.58 227.34 all social groups 120.50 0.22 0.00 23.56 53.15 22.22 26.51 32.66 10.13 3.00 9.20 1.43 16.35 48.00 366.95 Arunachal Pradesh scheduled tribe 150.61 0.62 0.71 14.60 36.39 23.75 73.41 74.55 13.99 1.20 10.34 2.34 10.40 35.46 448.37 scheduled caste 155.52 0.00 9.14 20.85 26.20 21.12 64.18 64.18 8.50 0.00 9.84 1.67 13.06 26.15 420.42 other backward classes 79.62 0.35 0.82 20.24 42.18 18.89 82.11 51.18 26.89 8.04 7.80 1.07 9.60 45.29 394.08 others 137.97 1.87 0.21 24.75 42.23 30.54 68.39 61.69 12.83 1.62 10.29 2.46 14.71 28.70 438.26 not recorded 117.88 0.00 0.00 22.97 30.06 39.21 49.48 51.17 7.79 0.00 11.53 2.64 11.38 34.99 379.10 all social groups 142.00 1.26 0.90 20.66 39.15 27.24 70.30 66.27 13.37 1.54 10.22 2.34 12.88 31.52 439.64 Assam scheduled tribe 158.05 0.21 0.00 16.39 34.94 22.42 75.26 49.16 8.71 0.83 8.01 1.69 10.42 46.91 433.00 scheduled caste 148.94 0.21 0.00 18.30 17.21 19.67 49.23 38.90 6.43 0.22 9.88 1.52 9.12 34.19 353.82 other backward classes 141.82 0.29 0.01 16.02 34.36 21.27 65.50 46.18 11.91 0.39 9.18 1.62 12.70 44.96 406.21 others 156.60 0.94 0.00 20.82 49.33 27.66 72.32 50.71 13.59 0.75 11.11 1.78 13.10 56.77 475.49 not recorded 152.88 0.00 0.00 18.14 0.00 18.39 27.00 44.04 0.00 0.00 10.00 1.43 13.22 28.93 314.02 all social groups 153.87 0.73 0.00 19.63 43.07 25.64 69.15 48.78 12.32 0.65 10.53 1.73 12.48 52.22 450.82 (Contd.)

Appendix Tables
NSS Report No.472: Differences in Level of Consumption among Socio-Economic Groups,1999-2000 A-181
Table 7U: Break-up of MPCE by broad groups of food items separately for each social group in urban areas by State/UT Urban
average per capita consumption expenditure (Rs) per 30 days on
social group cereals gram
cereal substi- tutes
pulses &
products
milk &
milk products
edibile oil
meat, egg &
fish
vegeta- bles
fruits (fresh)
fruits (dry)
sugar salt spices
beve- rages,
refresh- ments etc,
food total
(1) (2) (3) (4) (5) (6) (7) (8) (9) (10) (11) (12) (13) (14) (15) (16) Bihar scheduled tribe 120.33 1.07 0.00 16.36 34.13 20.38 22.53 36.46 5.57 2.35 8.23 1.40 11.99 30.17 310.97 scheduled caste 125.39 1.13 0.00 15.45 22.95 17.32 18.58 35.24 3.87 0.34 6.94 1.76 10.24 18.57 277.79 other backward classes 125.54 1.15 0.00 18.28 36.22 18.71 15.70 36.92 5.61 1.16 8.25 1.20 10.15 25.43 304.32 others 134.46 1.61 0.01 24.29 74.12 29.01 25.34 44.95 13.23 5.97 14.59 1.61 13.54 45.05 427.78 not recorded 120.03 1.46 0.00 14.82 21.67 15.97 9.00 37.51 5.34 1.39 5.53 1.23 10.21 11.43 255.59 all social groups 128.31 1.31 0.00 19.92 47.70 22.23 19.81 39.49 8.06 2.81 10.30 1.42 11.45 31.70 344.53 Goa scheduled tribe 89.39 0.00 0.00 19.48 86.10 28.44 39.74 35.01 18.95 0.00 17.31 0.99 12.46 51.73 399.61 scheduled caste 110.94 0.81 0.00 27.22 64.42 22.50 68.14 54.86 46.09 1.93 14.57 1.51 16.78 28.81 458.59 other backward classes 121.09 0.23 0.06 33.72 91.44 23.21 93.72 53.43 57.69 0.34 16.44 1.82 24.60 49.18 566.96 others 124.72 1.76 0.10 28.43 72.71 27.93 107.88 49.46 61.40 5.12 16.95 1.43 23.48 76.44 597.82 not recorded - - - - - - - - - - - - - - - all social groups 124.07 1.67 0.09 28.53 73.48 27.69 106.19 49.53 60.66 4.84 16.91 1.45 23.34 74.59 593.04 Gujarat scheduled tribe 87.39 0.54 0.11 26.74 63.15 32.66 18.17 41.02 10.41 3.98 14.46 0.92 15.35 40.98 355.88 scheduled caste 77.73 1.34 0.17 23.04 67.10 37.30 13.87 48.46 9.41 1.58 16.67 0.72 15.07 45.13 357.58 other backward classes 79.10 0.82 0.33 23.37 88.38 41.37 7.72 46.04 9.15 2.07 16.56 0.78 15.18 38.17 369.03 others 85.05 1.04 0.31 28.10 134.29 49.05 8.11 57.75 22.60 6.81 18.38 1.05 17.62 68.60 498.76 not recorded 80.25 0.00 0.00 36.25 252.50 60.00 73.75 81.88 48.00 0.00 32.00 1.20 13.32 118.50 797.65 all social groups 82.69 1.01 0.28 26.20 110.88 44.87 9.27 52.97 17.04 4.82 17.55 0.94 16.59 56.94 442.06
(Contd.)
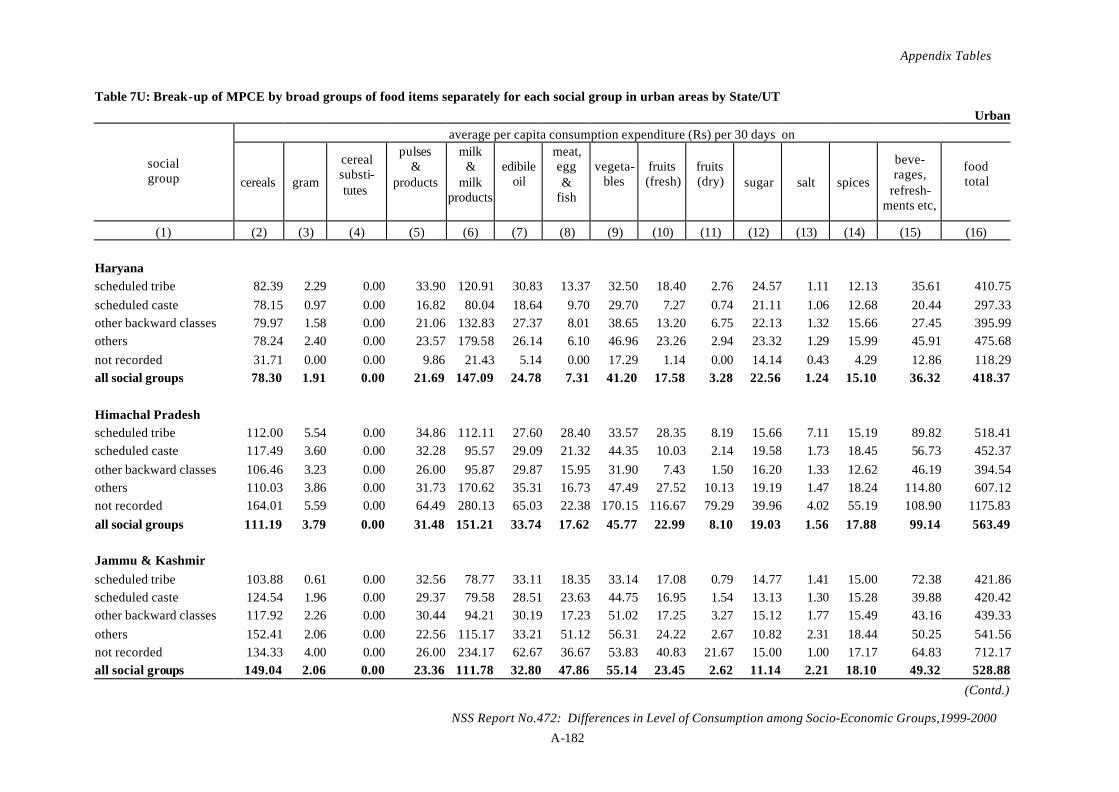
Appendix Tables
NSS Report No.472: Differences in Level of Consumption among Socio-Economic Groups,1999-2000 A-182
Table 7U: Break-up of MPCE by broad groups of food items separately for each social group in urban areas by State/UT Urban
average per capita consumption expenditure (Rs) per 30 days on
social group cereals gram
cereal substi- tutes
pulses &
products
milk &
milk products
edibile oil
meat, egg &
fish
vegeta- bles
fruits (fresh)
fruits (dry)
sugar salt spices
beve- rages,
refresh- ments etc,
food total
(1) (2) (3) (4) (5) (6) (7) (8) (9) (10) (11) (12) (13) (14) (15) (16) Haryana scheduled tribe 82.39 2.29 0.00 33.90 120.91 30.83 13.37 32.50 18.40 2.76 24.57 1.11 12.13 35.61 410.75 scheduled caste 78.15 0.97 0.00 16.82 80.04 18.64 9.70 29.70 7.27 0.74 21.11 1.06 12.68 20.44 297.33 other backward classes 79.97 1.58 0.00 21.06 132.83 27.37 8.01 38.65 13.20 6.75 22.13 1.32 15.66 27.45 395.99 others 78.24 2.40 0.00 23.57 179.58 26.14 6.10 46.96 23.26 2.94 23.32 1.29 15.99 45.91 475.68 not recorded 31.71 0.00 0.00 9.86 21.43 5.14 0.00 17.29 1.14 0.00 14.14 0.43 4.29 12.86 118.29 all social groups 78.30 1.91 0.00 21.69 147.09 24.78 7.31 41.20 17.58 3.28 22.56 1.24 15.10 36.32 418.37 Himachal Pradesh scheduled tribe 112.00 5.54 0.00 34.86 112.11 27.60 28.40 33.57 28.35 8.19 15.66 7.11 15.19 89.82 518.41 scheduled caste 117.49 3.60 0.00 32.28 95.57 29.09 21.32 44.35 10.03 2.14 19.58 1.73 18.45 56.73 452.37 other backward classes 106.46 3.23 0.00 26.00 95.87 29.87 15.95 31.90 7.43 1.50 16.20 1.33 12.62 46.19 394.54 others 110.03 3.86 0.00 31.73 170.62 35.31 16.73 47.49 27.52 10.13 19.19 1.47 18.24 114.80 607.12 not recorded 164.01 5.59 0.00 64.49 280.13 65.03 22.38 170.15 116.67 79.29 39.96 4.02 55.19 108.90 1175.83 all social groups 111.19 3.79 0.00 31.48 151.21 33.74 17.62 45.77 22.99 8.10 19.03 1.56 17.88 99.14 563.49 Jammu & Kashmir scheduled tribe 103.88 0.61 0.00 32.56 78.77 33.11 18.35 33.14 17.08 0.79 14.77 1.41 15.00 72.38 421.86 scheduled caste 124.54 1.96 0.00 29.37 79.58 28.51 23.63 44.75 16.95 1.54 13.13 1.30 15.28 39.88 420.42 other backward classes 117.92 2.26 0.00 30.44 94.21 30.19 17.23 51.02 17.25 3.27 15.12 1.77 15.49 43.16 439.33 others 152.41 2.06 0.00 22.56 115.17 33.21 51.12 56.31 24.22 2.67 10.82 2.31 18.44 50.25 541.56 not recorded 134.33 4.00 0.00 26.00 234.17 62.67 36.67 53.83 40.83 21.67 15.00 1.00 17.17 64.83 712.17 all social groups 149.04 2.06 0.00 23.36 111.78 32.80 47.86 55.14 23.45 2.62 11.14 2.21 18.10 49.32 528.88
(Contd.)

Appendix Tables
NSS Report No.472: Differences in Level of Consumption among Socio-Economic Groups,1999-2000 A-183
Table 7U: Break-up of MPCE by broad groups of food items separately for each social group in urban areas by State/UT Urban
average per capita consumption expenditure (Rs) per 30 days on
social group cereals gram
cereal substi- tutes
pulses &
products
milk &
milk products
edibile oil
meat, egg &
fish
vegeta- bles
fruits (fresh)
fruits (dry)
sugar salt spices
beve- rages,
refresh- ments etc,
food total
(1) (2) (3) (4) (5) (6) (7) (8) (9) (10) (11) (12) (13) (14) (15) (16) Karnataka scheduled tribe 104.95 0.96 0.12 21.23 36.00 19.66 24.63 26.07 12.84 2.57 10.83 1.07 14.84 46.83 322.61 scheduled caste 107.19 0.73 0.00 23.32 31.90 18.29 25.63 24.65 10.14 2.19 12.15 1.18 14.37 38.62 310.36 other backward classes 120.48 1.04 0.01 26.69 50.26 22.21 36.95 30.52 20.35 3.56 12.73 1.25 17.63 60.80 404.50 others 120.16 1.07 0.09 29.55 76.31 27.11 27.10 34.93 21.74 5.75 14.76 1.45 18.24 84.18 462.45 not recorded 117.77 0.00 0.00 16.35 14.75 27.02 44.37 33.03 17.17 3.67 11.71 0.71 10.13 54.56 351.24 all social groups 118.17 1.02 0.06 27.62 61.70 24.32 29.86 32.07 19.66 4.55 13.68 1.34 17.48 70.41 421.94 Kerala scheduled tribe 107.43 1.60 2.15 17.72 38.89 17.84 62.54 36.75 42.81 3.86 8.70 1.03 19.31 103.02 463.65 scheduled caste 101.17 1.61 4.16 16.29 30.72 20.75 55.91 33.25 33.31 0.88 11.10 0.96 19.96 85.57 415.65 other backward classes 102.65 2.48 2.19 14.53 42.53 21.59 71.35 30.48 38.50 1.52 12.36 1.01 18.94 65.38 425.53 others 110.97 2.82 1.92 20.70 62.67 25.55 71.45 37.22 44.76 1.55 13.00 1.16 21.88 95.70 511.34 not recorded 124.40 2.20 6.00 14.90 21.00 16.00 92.80 25.80 55.00 4.80 5.24 1.20 16.40 59.80 445.54 all social groups 105.74 2.54 2.22 16.98 49.27 22.99 70.38 33.22 40.57 1.51 12.48 1.06 20.10 78.28 457.35 Madhya Pradesh scheduled tribe 102.29 0.24 0.16 23.51 32.68 18.81 16.67 32.53 7.73 1.37 11.01 1.22 12.20 29.59 290.00 scheduled caste 97.08 0.16 0.15 21.36 38.83 19.76 12.00 30.70 5.96 0.97 13.03 1.26 12.17 21.79 275.21 other backward classes 96.09 0.30 0.16 21.68 51.38 21.10 9.08 32.65 7.43 1.78 14.75 1.27 12.89 25.67 296.24 others 97.25 0.42 0.29 27.62 86.17 27.31 13.14 43.91 14.32 3.91 17.02 1.40 13.63 37.43 383.82 not recorded 97.17 0.00 0.00 21.69 104.62 22.45 1.64 55.60 9.67 9.26 17.95 0.88 14.10 72.82 427.85 all social groups 97.17 0.32 0.22 24.29 63.08 23.39 11.76 37.16 10.17 2.54 15.20 1.32 13.06 30.44 330.12
(Contd.)

Appendix Tables
NSS Report No.472: Differences in Level of Consumption among Socio-Economic Groups,1999-2000 A-184
Table 7U: Break-up of MPCE by broad groups of food items separately for each social group in urban areas by State/UT Urban
average per capita consumption expenditure (Rs) per 30 days on
social group cereals gram
cereal substi- tutes
pulses &
products
milk &
milk products
edibile oil
meat, egg &
fish
vegeta- bles
fruits (fresh)
fruits (dry)
sugar salt spices
beve- rages,
refresh- ments etc,
food total
(1) (2) (3) (4) (5) (6) (7) (8) (9) (10) (11) (12) (13) (14) (15) (16) Maharashtra scheduled tribe 98.76 0.75 1.56 25.37 47.05 30.13 20.81 38.81 10.62 6.49 14.33 1.21 16.48 42.73 355.09 scheduled caste 97.04 0.55 0.75 24.71 38.36 29.18 28.36 40.56 11.44 5.60 13.52 1.34 14.61 49.05 355.06 other backward classes 98.94 0.86 1.63 26.70 51.37 31.87 23.89 42.10 12.75 6.98 14.87 1.39 15.35 53.44 382.15 others 101.54 0.68 1.61 28.10 86.88 35.57 30.40 49.88 23.86 9.85 15.90 1.50 16.30 77.40 479.47 not recorded 90.62 0.20 2.89 23.64 51.02 30.38 11.48 38.88 10.04 3.89 13.07 1.44 13.58 79.62 370.76 all social groups 100.36 0.70 1.50 27.30 72.61 33.86 28.60 46.84 19.73 8.64 15.34 1.45 15.90 68.15 440.99 Manipur scheduled tribe 198.80 0.07 0.19 12.23 13.22 10.57 32.92 31.55 9.00 1.82 6.73 2.23 8.77 36.05 364.17 scheduled caste 271.88 0.00 0.00 18.25 14.00 16.25 32.50 22.50 11.25 1.25 4.38 0.75 11.12 13.25 417.38 other backward classes 222.19 0.14 0.01 14.08 17.07 16.80 54.36 39.02 6.65 0.17 5.79 1.98 9.61 22.39 410.26 others 215.90 0.25 6.25 10.93 11.44 14.29 41.84 31.19 6.71 0.61 6.03 2.74 14.52 29.99 392.69 not recorded 260.97 0.00 0.00 12.96 0.00 13.12 55.89 30.79 3.68 0.00 7.00 2.72 9.47 12.34 408.94 all social groups 218.05 0.20 3.18 12.40 13.98 15.22 46.99 34.66 6.78 0.47 5.96 2.38 12.06 26.85 399.18 Meghalaya scheduled tribe 133.97 0.10 0.30 9.70 38.90 20.87 92.81 46.63 9.85 1.00 11.58 1.43 7.21 75.81 450.18 scheduled caste 141.60 0.00 0.00 20.52 37.57 22.18 46.65 54.66 15.97 0.79 11.32 1.34 8.00 51.23 411.83 other backward classes 128.00 1.87 0.42 14.87 48.67 28.63 91.78 62.36 6.61 1.09 15.35 1.76 7.98 62.21 471.60 others 129.27 0.29 0.29 19.74 39.77 29.23 62.21 52.71 16.24 1.27 10.85 1.51 10.70 109.51 483.58 not recorded 182.33 0.00 0.00 17.33 30.00 54.17 193.33 49.67 0.00 0.00 15.00 1.17 26.00 78.67 647.67 all social groups 132.99 0.21 0.30 11.94 39.42 22.79 86.49 48.50 11.00 1.05 11.59 1.45 7.93 81.31 456.98
(Contd.)

Appendix Tables
NSS Report No.472: Differences in Level of Consumption among Socio-Economic Groups,1999-2000 A-185
Table 7U: Break-up of MPCE by broad groups of food items separately for each social group in urban areas by State/UT Urban
average per capita consumption expenditure (Rs) per 30 days on
social group cereals gram
cereal substi- tutes
pulses &
products
milk &
milk products
edibile oil
meat, egg &
fish
vegeta- bles
fruits (fresh)
fruits (dry)
sugar salt spices
beve- rages,
refresh- ments etc,
food total
(1) (2) (3) (4) (5) (6) (7) (8) (9) (10) (11) (12) (13) (14) (15) (16) Mizoram scheduled tribe 147.10 0.21 0.01 21.45 44.52 26.30 110.50 110.18 11.36 0.48 16.12 2.84 11.47 44.43 546.98 scheduled caste 131.08 4.83 0.00 38.47 38.07 32.79 142.51 123.70 16.41 0.24 18.71 3.01 20.16 47.86 617.82 other backward classes 189.41 0.10 0.00 29.23 85.35 44.25 154.28 141.74 12.45 0.00 19.04 2.39 11.89 46.51 736.65 others 128.74 0.74 0.00 52.40 79.13 47.22 114.09 146.12 16.27 3.64 19.50 3.09 20.13 46.81 677.87 not recorded 190.91 0.00 0.00 13.13 25.05 11.06 76.63 88.46 8.05 0.36 10.16 1.70 9.88 29.52 464.91 all social groups 147.44 0.25 0.01 22.05 45.06 26.63 110.67 110.82 11.45 0.53 16.15 2.83 11.67 44.33 549.90 Nagaland scheduled tribe 185.12 0.22 0.06 16.57 56.51 16.24 117.56 75.22 25.33 0.77 11.75 2.09 13.21 72.00 592.63 scheduled caste 179.58 0.00 0.00 12.34 43.87 24.43 92.31 68.73 8.96 0.67 9.74 2.07 22.67 43.77 509.12 other backward classes 144.82 0.88 0.00 19.96 47.63 18.79 118.27 64.68 14.46 0.53 11.99 2.29 12.74 95.36 552.37 others 175.52 0.23 0.00 25.30 57.01 28.49 113.66 75.52 12.07 0.30 12.09 2.28 17.02 99.64 619.13 not recorded 132.26 0.00 0.00 25.37 68.54 49.13 124.57 87.77 28.49 0.00 12.29 2.91 18.78 58.16 608.27 all social groups 182.12 0.24 0.05 17.53 55.97 17.91 116.68 74.74 23.21 0.71 11.75 2.12 13.80 75.04 591.88 Orissa scheduled tribe 135.52 0.08 0.00 18.50 15.13 14.32 21.92 35.90 5.24 0.57 7.97 1.54 10.83 20.72 288.23 scheduled caste 138.11 0.00 0.00 14.34 11.61 13.39 22.59 37.34 5.18 0.25 7.04 1.33 9.34 17.43 277.94 other backward classes 142.22 0.18 0.00 17.60 26.06 18.20 25.41 46.26 6.94 0.44 9.13 1.57 11.54 34.43 339.97 others 141.59 0.50 0.00 22.54 39.54 21.48 34.05 53.03 11.79 0.85 11.00 1.51 11.51 49.48 398.87 not recorded 113.57 0.00 0.00 13.38 166.42 14.64 26.00 27.26 15.51 0.84 13.06 0.88 11.39 21.48 424.45 all social groups 140.39 0.29 0.00 19.51 29.23 18.52 28.73 46.80 8.82 0.62 9.56 1.49 11.06 37.22 352.23
(Contd.)
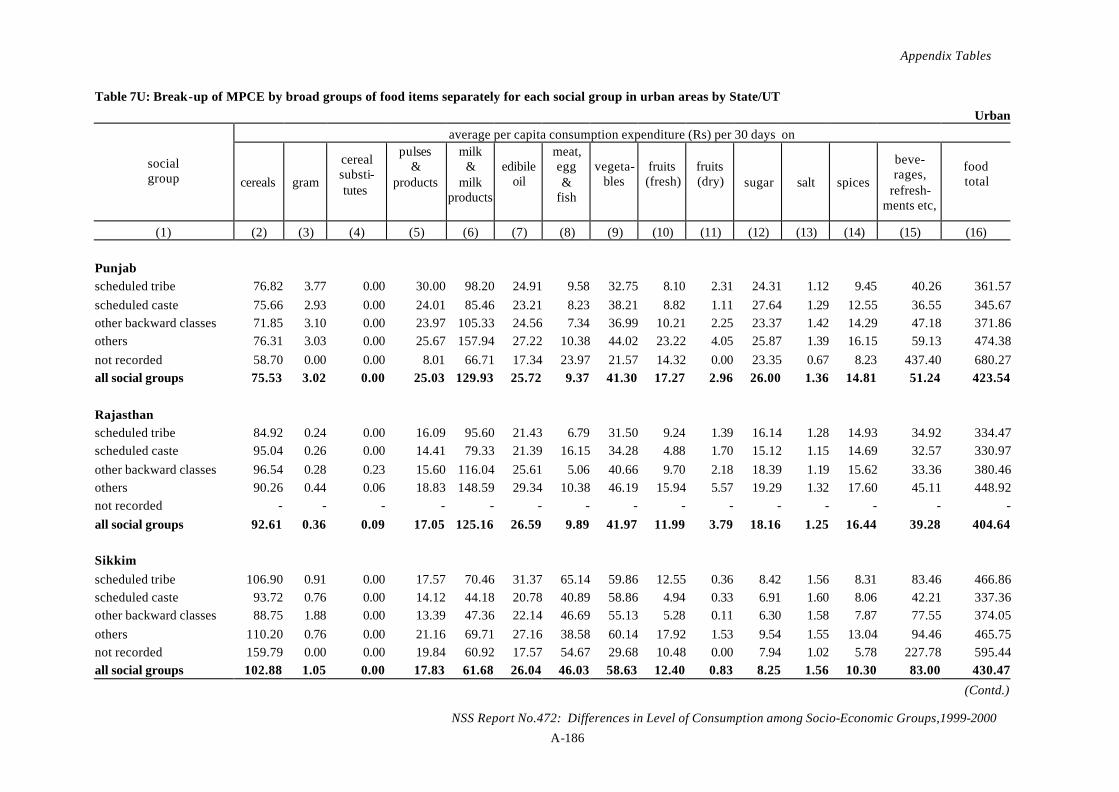
Appendix Tables
NSS Report No.472: Differences in Level of Consumption among Socio-Economic Groups,1999-2000 A-186
Table 7U: Break-up of MPCE by broad groups of food items separately for each social group in urban areas by State/UT Urban
average per capita consumption expenditure (Rs) per 30 days on
social group cereals gram
cereal substi- tutes
pulses &
products
milk &
milk products
edibile oil
meat, egg &
fish
vegeta- bles
fruits (fresh)
fruits (dry)
sugar salt spices
beve- rages,
refresh- ments etc,
food total
(1) (2) (3) (4) (5) (6) (7) (8) (9) (10) (11) (12) (13) (14) (15) (16) Punjab scheduled tribe 76.82 3.77 0.00 30.00 98.20 24.91 9.58 32.75 8.10 2.31 24.31 1.12 9.45 40.26 361.57 scheduled caste 75.66 2.93 0.00 24.01 85.46 23.21 8.23 38.21 8.82 1.11 27.64 1.29 12.55 36.55 345.67 other backward classes 71.85 3.10 0.00 23.97 105.33 24.56 7.34 36.99 10.21 2.25 23.37 1.42 14.29 47.18 371.86 others 76.31 3.03 0.00 25.67 157.94 27.22 10.38 44.02 23.22 4.05 25.87 1.39 16.15 59.13 474.38 not recorded 58.70 0.00 0.00 8.01 66.71 17.34 23.97 21.57 14.32 0.00 23.35 0.67 8.23 437.40 680.27 all social groups 75.53 3.02 0.00 25.03 129.93 25.72 9.37 41.30 17.27 2.96 26.00 1.36 14.81 51.24 423.54 Rajasthan scheduled tribe 84.92 0.24 0.00 16.09 95.60 21.43 6.79 31.50 9.24 1.39 16.14 1.28 14.93 34.92 334.47 scheduled caste 95.04 0.26 0.00 14.41 79.33 21.39 16.15 34.28 4.88 1.70 15.12 1.15 14.69 32.57 330.97 other backward classes 96.54 0.28 0.23 15.60 116.04 25.61 5.06 40.66 9.70 2.18 18.39 1.19 15.62 33.36 380.46 others 90.26 0.44 0.06 18.83 148.59 29.34 10.38 46.19 15.94 5.57 19.29 1.32 17.60 45.11 448.92 not recorded - - - - - - - - - - - - - - - all social groups 92.61 0.36 0.09 17.05 125.16 26.59 9.89 41.97 11.99 3.79 18.16 1.25 16.44 39.28 404.64 Sikkim scheduled tribe 106.90 0.91 0.00 17.57 70.46 31.37 65.14 59.86 12.55 0.36 8.42 1.56 8.31 83.46 466.86 scheduled caste 93.72 0.76 0.00 14.12 44.18 20.78 40.89 58.86 4.94 0.33 6.91 1.60 8.06 42.21 337.36 other backward classes 88.75 1.88 0.00 13.39 47.36 22.14 46.69 55.13 5.28 0.11 6.30 1.58 7.87 77.55 374.05 others 110.20 0.76 0.00 21.16 69.71 27.16 38.58 60.14 17.92 1.53 9.54 1.55 13.04 94.46 465.75 not recorded 159.79 0.00 0.00 19.84 60.92 17.57 54.67 29.68 10.48 0.00 7.94 1.02 5.78 227.78 595.44 all social groups 102.88 1.05 0.00 17.83 61.68 26.04 46.03 58.63 12.40 0.83 8.25 1.56 10.30 83.00 430.47
(Contd.)

Appendix Tables
NSS Report No.472: Differences in Level of Consumption among Socio-Economic Groups,1999-2000 A-187
Table 7U: Break-up of MPCE by broad groups of food items separately for each social group in urban areas by State/UT Urban
average per capita consumption expenditure (Rs) per 30 days on
social group cereals gram
cereal substi- tutes
pulses &
products
milk &
milk products
edibile oil
meat, egg &
fish
vegeta- bles
fruits (fresh)
fruits (dry)
sugar salt spices
beve- rages,
refresh- ments etc,
food total
(1) (2) (3) (4) (5) (6) (7) (8) (9) (10) (11) (12) (13) (14) (15) (16) Tamil Nadu scheduled tribe 118.67 3.13 0.00 34.01 83.12 24.69 23.82 51.48 20.25 4.69 10.75 1.21 26.51 71.80 474.13 scheduled caste 89.96 1.15 0.00 24.41 27.23 16.43 29.85 33.08 12.76 0.44 6.91 1.41 22.10 55.13 320.87 other backward classes 104.83 1.35 0.03 29.07 53.33 21.41 37.16 42.74 18.56 1.02 9.85 1.34 48.64 65.53 434.87 others 116.16 1.67 0.09 38.40 95.41 28.97 28.04 70.64 27.09 2.63 13.40 1.55 33.21 99.13 556.39 not recorded 292.60 2.90 0.00 22.97 68.69 29.29 51.18 48.37 22.27 0.25 10.08 1.35 20.00 46.04 615.99 all social groups 105.46 1.40 0.04 30.21 57.95 22.20 34.49 46.67 19.40 1.27 10.13 1.39 42.24 70.33 443.17 Tripura scheduled tribe 176.21 0.00 0.00 17.57 43.86 30.96 139.55 80.45 17.62 0.00 10.67 2.88 16.82 49.90 586.47 scheduled caste 172.05 0.00 0.04 15.53 27.61 21.66 72.03 47.67 12.25 0.68 8.89 1.89 11.21 20.94 412.45 other backward classes 178.08 0.00 0.24 17.33 42.54 24.47 82.30 59.94 19.55 1.28 9.52 2.11 12.00 22.80 472.17 others 178.97 0.09 0.07 18.35 53.83 29.98 92.21 58.66 20.05 1.14 10.95 2.24 12.89 33.04 512.47 not recorded 160.64 0.00 4.22 14.59 38.12 22.07 81.40 53.32 16.05 0.00 9.35 3.00 14.56 20.38 437.73 all social groups 177.15 0.05 0.09 17.58 46.41 27.73 90.35 58.01 18.17 0.97 10.35 2.20 12.74 30.65 492.44 Uttar Pradesh scheduled tribe 102.73 0.52 0.00 27.20 101.67 27.32 19.85 46.14 18.06 9.15 18.10 1.42 14.79 41.62 428.58 scheduled caste 93.04 0.26 0.00 22.43 46.84 19.75 12.44 35.53 8.30 1.66 13.45 1.12 12.93 29.24 297.00 other backward classes 92.14 0.43 0.02 22.82 57.43 19.79 13.26 34.88 9.91 2.48 14.50 1.12 13.90 29.12 311.82 others 91.25 0.75 0.02 26.10 87.90 24.61 12.41 43.34 16.68 5.29 15.92 1.25 15.09 44.28 384.90 not recorded 103.58 0.32 0.00 21.28 73.21 19.28 3.78 32.81 7.28 1.46 15.04 1.30 12.82 21.52 313.69 all social groups 91.95 0.57 0.02 24.50 72.05 22.35 12.73 39.48 13.24 3.87 15.11 1.19 14.37 37.11 348.54
(Contd.)

Appendix Tables
NSS Report No.472: Differences in Level of Consumption among Socio-Economic Groups,1999-2000 A-188
Table 7U: Break-up of MPCE by broad groups of food items separately for each social group in urban areas by State/UT Urban
average per capita consumption expenditure (Rs) per 30 days on
social group cereals gram
cereal substi- tutes
pulses &
products
milk &
milk products
edibile oil
meat, egg &
fish
vegeta- bles
fruits (fresh)
fruits (dry)
sugar salt spices
beve- rages,
refresh- ments etc,
food total
(1) (2) (3) (4) (5) (6) (7) (8) (9) (10) (11) (12) (13) (14) (15) (16) West Bengal scheduled tribe 150.79 0.20 0.00 13.34 21.08 21.29 52.55 41.44 6.65 0.75 8.91 1.56 12.09 30.13 360.77 scheduled caste 130.87 0.24 0.04 14.45 23.83 24.40 46.19 49.17 7.29 0.29 8.05 1.43 12.63 32.13 351.01 other backward classes 134.71 0.08 0.00 16.02 33.02 24.60 51.84 47.96 9.76 0.31 9.01 1.83 14.09 43.23 386.46 others 136.62 0.24 0.04 17.64 45.39 29.75 71.94 57.60 15.55 1.31 11.28 1.79 15.58 80.87 485.58 not recorded 130.51 0.34 0.00 18.28 41.38 24.22 50.17 48.52 13.01 1.71 9.85 2.15 16.53 119.12 475.80 all social groups 135.73 0.23 0.03 16.89 40.31 28.30 65.69 55.17 13.54 1.05 10.51 1.72 14.90 68.98 453.06 A. & N. Islands scheduled tribe 125.47 3.03 1.14 34.77 47.35 37.72 104.46 88.42 20.60 0.62 16.17 3.36 26.87 91.03 601.01 scheduled caste 153.25 0.00 0.00 35.19 11.82 28.93 46.93 60.27 17.75 0.00 8.93 3.24 25.08 52.11 443.50 other backward classes 127.09 2.00 0.00 41.79 86.87 48.98 81.57 92.80 23.97 3.34 12.02 2.68 31.65 67.26 622.02 others 116.32 1.12 0.20 35.11 62.49 44.68 77.93 73.08 21.04 0.98 12.63 2.74 23.85 96.16 568.33 not recorded - - - - - - - - - - - - - - - all social groups 117.86 1.24 0.22 35.49 62.57 44.41 78.85 74.72 21.15 1.09 12.69 2.77 24.45 93.64 571.16 Chandigarh scheduled tribe 104.36 3.62 0.00 23.66 134.05 35.50 27.13 52.63 15.80 10.10 22.54 1.47 17.40 74.37 522.63 scheduled caste 78.47 3.58 0.00 24.91 102.59 27.34 18.16 45.37 17.72 1.51 19.41 1.44 16.08 47.67 404.24 other backward classes 81.96 3.80 0.00 31.60 153.81 28.74 14.52 55.06 26.39 5.19 23.52 1.31 15.98 64.57 506.45 others 87.13 4.20 0.04 29.78 189.97 32.88 13.87 59.98 34.37 9.35 20.61 1.52 17.20 92.80 593.69 not recorded 121.47 0.52 0.00 66.03 209.97 41.51 46.09 104.34 41.72 20.90 36.31 1.50 25.97 141.51 857.83 all social groups 85.74 4.05 0.03 29.23 172.96 31.73 14.83 57.35 30.88 7.85 20.80 1.49 16.93 83.28 557.15
(Contd.)

Appendix Tables
NSS Report No.472: Differences in Level of Consumption among Socio-Economic Groups,1999-2000 A-189
Table 7U: Break-up of MPCE by broad groups of food items separately for each social group in urban areas by State/UT Urban
average per capita consumption expenditure (Rs) per 30 days on
social group cereals gram
cereal substi- tutes
pulses &
products
milk &
milk products
edibile oil
meat, egg &
fish
vegeta- bles
fruits (fresh)
fruits (dry)
sugar salt spices
beve- rages,
refresh- ments etc,
food total
(1) (2) (3) (4) (5) (6) (7) (8) (9) (10) (11) (12) (13) (14) (15) (16) Dadra & Nagar Haveli scheduled tribe 123.10 0.16 0.00 32.80 45.16 33.14 17.39 51.25 13.28 0.40 11.47 1.06 20.51 52.72 402.44 scheduled caste 155.57 0.00 0.00 21.93 132.50 35.97 54.27 78.05 42.59 48.35 12.93 0.83 15.40 97.28 695.67 other backward classes 124.05 0.17 0.00 29.04 81.28 37.71 28.56 55.30 19.42 2.47 14.96 1.17 23.91 64.63 482.65 others 108.86 0.59 0.00 36.73 133.18 41.34 18.69 68.37 28.91 3.31 16.93 1.37 23.66 198.02 679.97 not recorded - - - - - - - - - - - - - - - all social groups 116.75 0.39 0.00 34.00 101.48 38.34 21.07 62.19 23.79 4.15 14.98 1.24 22.49 135.26 576.13 Daman & Diu scheduled tribe 110.83 1.17 0.30 28.94 56.87 39.88 45.97 43.35 12.38 1.54 12.11 1.15 23.14 39.03 416.65 scheduled caste 94.23 0.49 0.00 23.17 51.85 30.84 35.73 32.05 7.67 2.34 13.49 1.02 14.79 26.64 334.30 other backward classes 99.55 1.48 0.06 22.84 88.82 40.91 69.14 44.09 18.74 5.31 16.09 0.95 17.66 41.21 466.86 others 124.23 2.84 0.06 26.98 112.37 43.69 52.64 56.98 28.60 12.21 14.68 1.33 23.01 86.01 585.63 not recorded - - - - - - - - - - - - - - - all social groups 114.24 2.20 0.07 25.62 98.69 41.94 56.49 50.90 23.51 8.94 14.90 1.18 20.93 66.30 525.91 Delhi scheduled tribe 80.53 2.53 0.00 21.40 117.02 26.28 34.24 58.32 25.37 15.45 13.00 1.35 20.39 47.95 463.83 scheduled caste 82.56 2.58 0.00 23.97 82.23 28.18 28.46 62.83 17.99 0.55 13.30 2.43 19.35 37.20 401.63 other backward classes 86.61 2.86 0.01 26.22 127.05 26.16 22.28 68.76 20.49 2.25 14.79 1.45 18.80 49.99 467.72 others 89.47 2.95 0.03 31.47 174.84 35.13 21.66 79.74 43.24 12.42 15.65 1.82 18.21 94.85 621.48 not recorded 96.42 4.00 0.00 29.92 114.44 25.81 0.00 91.47 25.73 0.00 10.27 1.32 12.01 33.70 445.08 all social groups 87.97 2.88 0.02 29.58 154.18 32.93 22.93 75.62 36.54 9.48 15.14 1.87 18.47 80.17 567.77
(Contd.)

Appendix Tables
NSS Report No.472: Differences in Level of Consumption among Socio-Economic Groups,1999-2000 A-190
Table 7U: Break-up of MPCE by broad groups of food items separately for each social group in urban areas by State/UT Urban
average per capita consumption expenditure (Rs) per 30 days on
social group cereals gram
cereal substi- tutes
pulses &
products
milk &
milk products
edibile oil
meat, egg &
fish
vegeta- bles
fruits (fresh)
fruits (dry)
sugar salt spices
beve- rages,
refresh- ments etc,
food total
(1) (2) (3) (4) (5) (6) (7) (8) (9) (10) (11) (12) (13) (14) (15) (16) Lakshadweep scheduled tribe 117.64 4.14 0.00 16.09 27.04 28.33 147.01 41.43 58.32 2.62 27.60 1.18 20.89 105.62 597.90 scheduled caste 129.85 5.54 0.00 20.42 31.89 38.09 155.01 52.35 77.42 1.59 18.42 1.43 20.75 352.83 905.59 other backward classes 148.62 0.00 0.00 23.29 59.54 56.62 209.00 99.64 75.88 0.00 24.22 1.62 29.97 509.37 1237.77 others 95.53 4.32 0.00 22.43 72.27 30.18 41.53 59.30 48.77 0.90 14.62 1.24 21.49 404.16 816.73 not recorded - - - - - - - - - - - - - - - all social groups 117.55 4.12 0.00 16.33 28.35 28.71 145.33 42.43 58.45 2.55 27.19 1.19 20.98 118.05 611.24 Pondicherry scheduled tribe 146.16 7.03 0.00 38.00 83.90 22.54 64.76 38.40 15.80 0.00 13.16 2.20 26.73 25.40 484.07 scheduled caste 97.20 1.98 0.00 28.27 30.98 17.25 41.17 30.42 11.50 2.59 6.98 1.68 24.32 89.77 384.10 other backward classes 107.83 1.49 0.13 29.23 51.52 19.68 45.11 41.34 14.43 1.25 9.22 1.60 21.61 53.06 397.51 others 118.15 2.38 0.01 25.74 74.82 25.29 37.02 39.12 17.87 3.03 13.23 11.61 20.08 38.13 426.47 not recorded 108.30 1.65 0.11 28.87 52.47 20.07 44.14 40.27 14.56 1.52 9.48 2.60 21.70 54.21 399.95 all social groups 146.16 7.03 0.00 38.00 83.90 22.54 64.76 38.40 15.80 0.00 13.16 2.20 26.73 25.40 484.07 all-India scheduled tribe 113.08 0.64 0.28 21.37 46.91 22.71 30.11 39.86 10.39 3.02 11.72 1.35 13.96 41.25 356.64 scheduled caste 100.23 0.78 0.19 20.90 45.86 22.53 22.97 38.00 9.22 1.75 12.75 1.31 14.43 36.97 327.89 other backward classes 104.65 0.91 0.32 23.25 56.58 23.13 25.78 37.97 13.56 2.34 12.51 1.27 21.48 45.19 368.95 others 107.07 1.04 0.41 25.97 94.22 30.44 28.22 49.29 21.00 5.69 15.38 1.47 16.70 65.31 462.21 not recorded 116.26 0.81 0.59 19.45 57.88 21.08 21.58 38.76 11.76 1.84 11.78 1.28 12.93 48.71 364.71 all social groups 105.58 0.95 0.35 24.25 74.17 26.81 26.78 43.90 16.67 4.01 14.00 1.38 17.73 54.28 410.84

Appendix Tables
NSS Report No.472: Differences in Level of Consumption among Socio-Economic Groups,1999-2000 A-191
Table 8R: Break-up of MPCE by broad groups of non-food items separately for each social group in rural areas and by State/UT
Rural average monthly per capita consumption expenditure (Rs) per 30 days on
social group
pan, tobacco &
intoxicants
fuel &
light
clothing
footwear
misc. goods &
services
durable goods
non-food total
all
clothing (second hand)
durable goods (second
hand)
no. of sample hhs reporting consumption
(1) (17) (18) (19) (20) (21) (22) (23) (24) (25) (26) (27) Andhra Pradesh scheduled tribe 33.09 21.99 21.61 2.57 65.61 3.14 148.00 383.12 0.33 0.00 441 scheduled caste 18.93 24.87 23.09 2.74 66.03 3.33 139.00 381.82 0.10 0.02 943 other backward classes 18.67 29.22 28.18 2.97 85.73 7.04 171.81 438.90 0.05 0.25 2301 others 16.71 36.85 37.64 3.97 129.21 12.91 237.29 564.50 0.01 0.06 1490 not recorded 17.87 30.40 30.03 1.86 57.20 17.88 155.23 424.04 0.00 0.00 6 all social groups 19.26 29.64 28.94 3.14 90.75 7.42 179.16 453.61 0.07 0.13 5181 Arunachal Pradesh scheduled tribe 57.70 93.28 23.85 6.31 95.92 23.22 300.29 659.13 0.10 0.17 602 scheduled caste 340.74 172.88 171.05 28.02 227.23 42.50 982.41 1863.07 0.00 0.00 7 other backward classes 92.59 21.03 51.74 10.18 49.36 0.24 225.14 690.55 7.99 0.00 11 others 31.47 50.98 33.70 6.35 96.79 8.76 228.06 574.88 0.01 0.00 201 not recorded 129.54 63.85 28.28 4.10 111.32 51.22 388.31 814.92 0.00 0.00 6 all social groups 54.30 83.50 26.95 6.43 96.38 20.22 287.78 648.00 0.15 0.13 827 Assam scheduled tribe 27.11 26.41 24.81 3.94 46.63 7.30 136.20 437.61 0.05 0.01 604 scheduled caste 16.58 28.18 24.71 4.52 48.53 6.94 129.46 414.44 0.01 0.01 332 other backward classes 20.32 33.25 28.36 4.51 53.39 9.51 149.33 435.83 0.24 0.08 691 others 16.24 30.60 26.03 4.28 50.92 8.12 136.19 421.79 0.12 0.03 1826 not recorded 20.84 26.80 27.50 5.41 65.13 9.88 155.58 441.66 0.26 0.00 9 all social groups 18.76 30.16 26.12 4.30 50.46 8.12 137.92 426.13 0.12 0.03 3462
(Contd.)
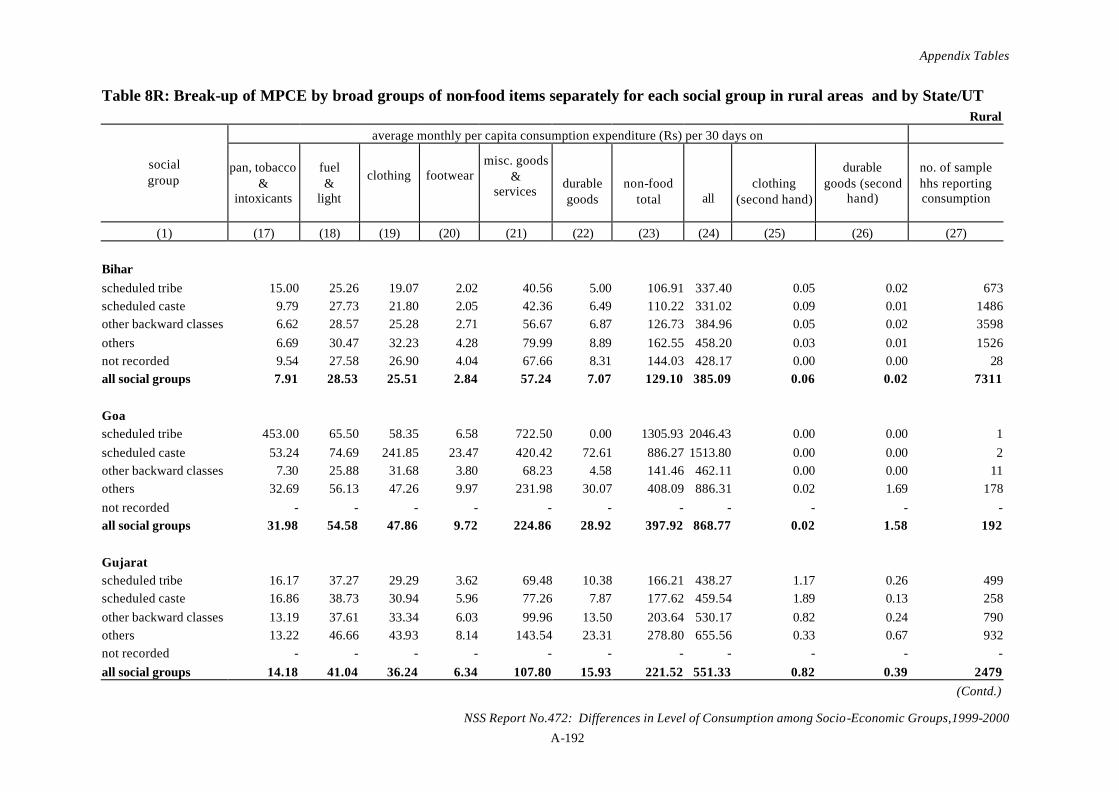
Appendix Tables
NSS Report No.472: Differences in Level of Consumption among Socio-Economic Groups,1999-2000 A-192
Table 8R: Break-up of MPCE by broad groups of non-food items separately for each social group in rural areas and by State/UT
Rural average monthly per capita consumption expenditure (Rs) per 30 days on
social group
pan, tobacco &
intoxicants
fuel &
light
clothing
footwear
misc. goods &
services
durable goods
non-food total
all
clothing (second hand)
durable goods (second
hand)
no. of sample hhs reporting consumption
(1) (17) (18) (19) (20) (21) (22) (23) (24) (25) (26) (27) Bihar scheduled tribe 15.00 25.26 19.07 2.02 40.56 5.00 106.91 337.40 0.05 0.02 673 scheduled caste 9.79 27.73 21.80 2.05 42.36 6.49 110.22 331.02 0.09 0.01 1486 other backward classes 6.62 28.57 25.28 2.71 56.67 6.87 126.73 384.96 0.05 0.02 3598 others 6.69 30.47 32.23 4.28 79.99 8.89 162.55 458.20 0.03 0.01 1526 not recorded 9.54 27.58 26.90 4.04 67.66 8.31 144.03 428.17 0.00 0.00 28 all social groups 7.91 28.53 25.51 2.84 57.24 7.07 129.10 385.09 0.06 0.02 7311 Goa scheduled tribe 453.00 65.50 58.35 6.58 722.50 0.00 1305.93 2046.43 0.00 0.00 1 scheduled caste 53.24 74.69 241.85 23.47 420.42 72.61 886.27 1513.80 0.00 0.00 2 other backward classes 7.30 25.88 31.68 3.80 68.23 4.58 141.46 462.11 0.00 0.00 11 others 32.69 56.13 47.26 9.97 231.98 30.07 408.09 886.31 0.02 1.69 178 not recorded - - - - - - - - - - - all social groups 31.98 54.58 47.86 9.72 224.86 28.92 397.92 868.77 0.02 1.58 192 Gujarat scheduled tribe 16.17 37.27 29.29 3.62 69.48 10.38 166.21 438.27 1.17 0.26 499 scheduled caste 16.86 38.73 30.94 5.96 77.26 7.87 177.62 459.54 1.89 0.13 258 other backward classes 13.19 37.61 33.34 6.03 99.96 13.50 203.64 530.17 0.82 0.24 790 others 13.22 46.66 43.93 8.14 143.54 23.31 278.80 655.56 0.33 0.67 932 not recorded - - - - - - - - - - - all social groups 14.18 41.04 36.24 6.34 107.80 15.93 221.52 551.33 0.82 0.39 2479 (Contd.)

Appendix Tables
NSS Report No.472: Differences in Level of Consumption among Socio-Economic Groups,1999-2000 A-193
Table 8R: Break-up of MPCE by broad groups of non-food items separately for each social group in rural areas and by State/UT
Rural average monthly per capita consumption expenditure (Rs) per 30 days on
social group
pan, tobacco &
intoxicants
fuel &
light
clothing
footwear
misc. goods &
services
durable goods
non-food total
all
clothing (second hand)
durable goods (second
hand)
no. of sample hhs reporting consumption
(1) (17) (18) (19) (20) (21) (22) (23) (24) (25) (26) (27) Haryana scheduled tribe 8.82 45.56 38.54 9.43 88.68 6.16 197.19 508.59 0.00 0.61 7 scheduled caste 17.33 51.63 37.38 10.04 109.18 6.51 232.07 543.45 0.11 0.32 224 other backward classes 15.11 61.49 39.91 11.43 141.84 9.00 278.78 641.44 0.60 0.04 344 others 18.35 65.81 56.50 14.81 207.85 16.22 379.54 834.72 0.00 0.68 555 not recorded 50.67 127.00 56.04 12.25 243.73 10.41 500.09 1002.64 0.00 0.00 2 all social groups 17.27 61.26 47.62 12.78 166.89 12.01 317.83 714.38 0.18 0.43 1132 Himachal Pradesh scheduled tribe 17.35 59.16 47.60 22.60 128.26 6.65 281.62 659.25 0.30 0.00 95 scheduled caste 15.62 45.52 39.97 13.86 124.96 12.83 252.77 589.03 0.56 0.00 360 other backward classes 19.20 47.46 50.53 13.23 148.06 20.55 299.03 683.46 0.04 0.00 178 others 16.59 52.26 53.51 17.23 159.75 22.12 321.47 723.16 0.25 0.12 1000 not recorded 10.00 19.17 30.30 14.25 71.08 0.00 144.79 396.23 0.00 0.00 1 all social groups 16.67 50.38 49.75 16.20 149.02 19.16 301.17 684.50 0.30 0.07 1634 Jammu & Kashmir scheduled tribe 16.84 31.53 41.00 10.22 83.80 3.81 187.20 529.65 0.00 0.00 20 scheduled caste 18.49 40.09 37.98 11.00 113.11 20.63 241.30 574.99 0.05 0.03 153 other backward classes 8.39 42.49 37.28 11.54 105.78 7.84 213.33 659.25 0.01 0.00 183 others 17.43 42.99 44.80 12.02 117.49 26.18 260.91 691.79 0.03 0.09 1113 not recorded 27.15 65.04 42.11 16.03 98.23 22.44 271.01 873.01 0.00 0.00 3 all social groups 16.70 42.56 43.55 11.88 115.36 23.64 253.68 677.60 0.03 0.07 1472 (Contd.)
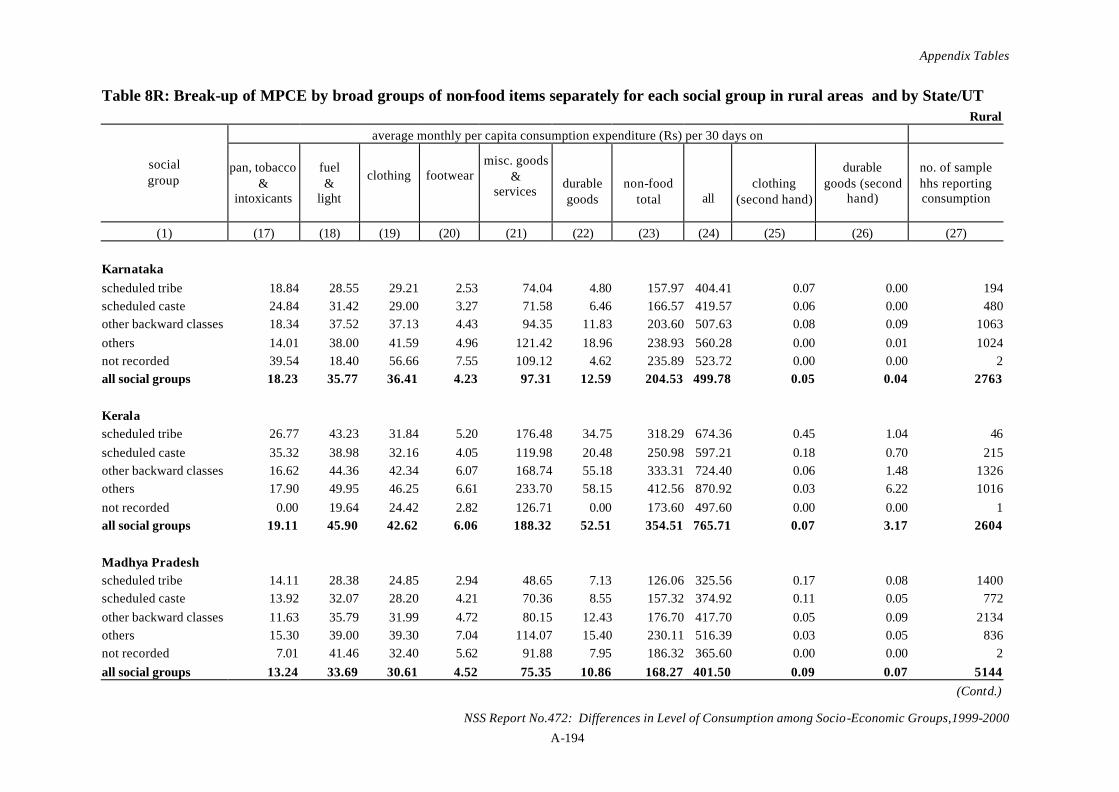
Appendix Tables
NSS Report No.472: Differences in Level of Consumption among Socio-Economic Groups,1999-2000 A-194
Table 8R: Break-up of MPCE by broad groups of non-food items separately for each social group in rural areas and by State/UT
Rural average monthly per capita consumption expenditure (Rs) per 30 days on
social group
pan, tobacco &
intoxicants
fuel &
light
clothing
footwear
misc. goods &
services
durable goods
non-food total
all
clothing (second hand)
durable goods (second
hand)
no. of sample hhs reporting consumption
(1) (17) (18) (19) (20) (21) (22) (23) (24) (25) (26) (27) Karnataka scheduled tribe 18.84 28.55 29.21 2.53 74.04 4.80 157.97 404.41 0.07 0.00 194 scheduled caste 24.84 31.42 29.00 3.27 71.58 6.46 166.57 419.57 0.06 0.00 480 other backward classes 18.34 37.52 37.13 4.43 94.35 11.83 203.60 507.63 0.08 0.09 1063 others 14.01 38.00 41.59 4.96 121.42 18.96 238.93 560.28 0.00 0.01 1024 not recorded 39.54 18.40 56.66 7.55 109.12 4.62 235.89 523.72 0.00 0.00 2 all social groups 18.23 35.77 36.41 4.23 97.31 12.59 204.53 499.78 0.05 0.04 2763 Kerala scheduled tribe 26.77 43.23 31.84 5.20 176.48 34.75 318.29 674.36 0.45 1.04 46 scheduled caste 35.32 38.98 32.16 4.05 119.98 20.48 250.98 597.21 0.18 0.70 215 other backward classes 16.62 44.36 42.34 6.07 168.74 55.18 333.31 724.40 0.06 1.48 1326 others 17.90 49.95 46.25 6.61 233.70 58.15 412.56 870.92 0.03 6.22 1016 not recorded 0.00 19.64 24.42 2.82 126.71 0.00 173.60 497.60 0.00 0.00 1 all social groups 19.11 45.90 42.62 6.06 188.32 52.51 354.51 765.71 0.07 3.17 2604 Madhya Pradesh scheduled tribe 14.11 28.38 24.85 2.94 48.65 7.13 126.06 325.56 0.17 0.08 1400 scheduled caste 13.92 32.07 28.20 4.21 70.36 8.55 157.32 374.92 0.11 0.05 772 other backward classes 11.63 35.79 31.99 4.72 80.15 12.43 176.70 417.70 0.05 0.09 2134 others 15.30 39.00 39.30 7.04 114.07 15.40 230.11 516.39 0.03 0.05 836 not recorded 7.01 41.46 32.40 5.62 91.88 7.95 186.32 365.60 0.00 0.00 2 all social groups 13.24 33.69 30.61 4.52 75.35 10.86 168.27 401.50 0.09 0.07 5144 (Contd.)

Appendix Tables
NSS Report No.472: Differences in Level of Consumption among Socio-Economic Groups,1999-2000 A-195
Table 8R: Break-up of MPCE by broad groups of non-food items separately for each social group in rural areas and by State/UT
Rural average monthly per capita consumption expenditure (Rs) per 30 days on
social group
pan, tobacco &
intoxicants
fuel &
light
clothing
footwear
misc. goods &
services
durable goods
non-food total
all
clothing (second hand)
durable goods (second
hand)
no. of sample hhs reporting consumption
(1) (17) (18) (19) (20) (21) (22) (23) (24) (25) (26) (27) Maharashtra scheduled tribe 13.86 27.91 29.97 3.66 74.47 7.93 157.79 384.45 0.28 0.00 676 scheduled caste 11.27 33.16 34.05 4.51 97.41 8.29 188.70 429.63 0.10 0.03 497 other backward classes 11.76 34.33 37.91 5.12 121.65 9.52 220.30 489.91 0.04 0.07 1198 others 10.00 42.67 41.23 6.57 147.31 20.23 268.02 570.14 0.15 0.18 1747 not recorded 15.80 33.98 50.32 4.14 222.97 0.41 327.60 636.89 0.00 0.00 3 all social groups 11.35 36.45 37.43 5.38 121.02 13.37 224.99 496.77 0.13 0.10 4121 Manipur scheduled tribe 14.76 49.79 27.90 8.83 77.21 15.58 194.07 523.19 0.31 0.04 352 scheduled caste 18.99 66.60 19.65 6.55 68.51 16.07 196.38 560.55 0.00 0.48 36 other backward classes 22.10 51.55 23.53 8.01 118.73 19.72 243.64 625.75 0.00 3.47 132 others 14.21 50.95 17.80 6.09 80.86 8.48 178.39 503.34 0.18 0.10 215 not recorded 33.56 83.50 23.79 6.67 81.73 3.85 233.09 652.48 0.00 0.00 3 all social groups 16.18 51.40 23.50 7.70 85.49 14.10 198.36 537.80 0.19 0.71 738 Meghalaya scheduled tribe 50.27 32.15 38.18 8.44 82.49 11.95 223.49 563.52 5.60 0.12 873 scheduled caste 60.07 50.70 54.57 9.20 173.51 0.00 348.06 862.11 18.76 0.00 2 other backward classes 37.41 43.34 25.19 6.45 53.57 11.34 177.30 462.90 2.21 0.00 12 others 32.66 23.09 35.58 6.52 107.92 10.31 216.08 575.42 3.22 0.00 44 not recorded 169.10 66.15 35.10 14.49 127.52 3.78 416.15 803.69 4.54 0.00 2 all social groups 49.40 31.95 37.90 8.33 83.48 11.84 222.90 563.41 5.46 0.11 933 (Contd.)
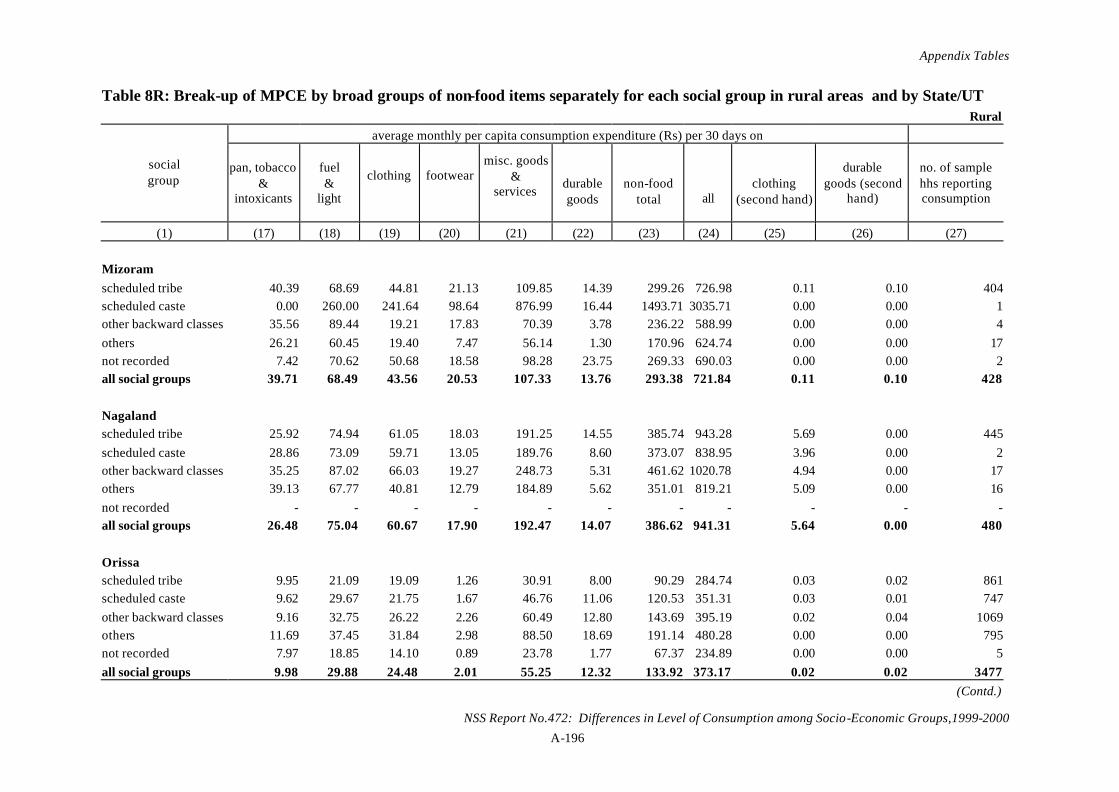
Appendix Tables
NSS Report No.472: Differences in Level of Consumption among Socio-Economic Groups,1999-2000 A-196
Table 8R: Break-up of MPCE by broad groups of non-food items separately for each social group in rural areas and by State/UT
Rural average monthly per capita consumption expenditure (Rs) per 30 days on
social group
pan, tobacco &
intoxicants
fuel &
light
clothing
footwear
misc. goods &
services
durable goods
non-food total
all
clothing (second hand)
durable goods (second
hand)
no. of sample hhs reporting consumption
(1) (17) (18) (19) (20) (21) (22) (23) (24) (25) (26) (27) Mizoram scheduled tribe 40.39 68.69 44.81 21.13 109.85 14.39 299.26 726.98 0.11 0.10 404 scheduled caste 0.00 260.00 241.64 98.64 876.99 16.44 1493.71 3035.71 0.00 0.00 1 other backward classes 35.56 89.44 19.21 17.83 70.39 3.78 236.22 588.99 0.00 0.00 4 others 26.21 60.45 19.40 7.47 56.14 1.30 170.96 624.74 0.00 0.00 17 not recorded 7.42 70.62 50.68 18.58 98.28 23.75 269.33 690.03 0.00 0.00 2 all social groups 39.71 68.49 43.56 20.53 107.33 13.76 293.38 721.84 0.11 0.10 428 Nagaland scheduled tribe 25.92 74.94 61.05 18.03 191.25 14.55 385.74 943.28 5.69 0.00 445 scheduled caste 28.86 73.09 59.71 13.05 189.76 8.60 373.07 838.95 3.96 0.00 2 other backward classes 35.25 87.02 66.03 19.27 248.73 5.31 461.62 1020.78 4.94 0.00 17 others 39.13 67.77 40.81 12.79 184.89 5.62 351.01 819.21 5.09 0.00 16 not recorded - - - - - - - - - - - all social groups 26.48 75.04 60.67 17.90 192.47 14.07 386.62 941.31 5.64 0.00 480 Orissa scheduled tribe 9.95 21.09 19.09 1.26 30.91 8.00 90.29 284.74 0.03 0.02 861 scheduled caste 9.62 29.67 21.75 1.67 46.76 11.06 120.53 351.31 0.03 0.01 747 other backward classes 9.16 32.75 26.22 2.26 60.49 12.80 143.69 395.19 0.02 0.04 1069 others 11.69 37.45 31.84 2.98 88.50 18.69 191.14 480.28 0.00 0.00 795 not recorded 7.97 18.85 14.10 0.89 23.78 1.77 67.37 234.89 0.00 0.00 5 all social groups 9.98 29.88 24.48 2.01 55.25 12.32 133.92 373.17 0.02 0.02 3477 (Contd.)

Appendix Tables
NSS Report No.472: Differences in Level of Consumption among Socio-Economic Groups,1999-2000 A-197
Table 8R: Break-up of MPCE by broad groups of non-food items separately for each social group in rural areas and by State/UT
Rural average monthly per capita consumption expenditure (Rs) per 30 days on
social group
pan, tobacco &
intoxicants
fuel &
light
clothing
footwear
misc. goods &
services
durable goods
non-food total
all
clothing (second hand)
durable goods (second
hand)
no. of sample hhs reporting consumption
(1) (17) (18) (19) (20) (21) (22) (23) (24) (25) (26) (27) Punjab scheduled tribe 10.31 63.32 41.57 9.32 93.72 26.42 244.66 548.22 0.64 0.17 26 scheduled caste 13.46 66.49 37.88 9.83 130.51 10.35 268.52 581.86 0.13 0.25 741 other backward classes 13.00 71.01 47.85 10.68 154.36 15.18 312.09 652.66 0.17 0.44 291 others 17.06 81.79 60.59 15.23 235.98 31.61 442.26 910.12 0.02 4.30 1092 not recorded 2.91 72.59 65.23 10.69 100.22 8.67 260.31 540.85 0.00 0.00 2 all social groups 15.00 74.17 49.85 12.43 182.10 21.00 354.55 742.82 0.09 2.14 2152 Rajasthan scheduled tribe 19.69 47.69 34.08 6.93 77.61 11.53 197.53 465.95 0.01 0.76 585 scheduled caste 20.91 42.67 36.01 7.91 84.07 7.68 199.25 501.53 0.12 0.04 514 other backward classes 17.33 46.84 39.65 8.68 96.43 14.97 223.90 560.15 0.06 0.15 1153 others 16.23 51.93 43.44 9.98 113.26 16.73 251.57 621.63 0.01 1.13 977 not recorded - - - - - - - - - - - all social groups 18.08 47.73 39.00 8.57 95.33 13.58 222.28 548.88 0.05 0.52 3229 Sikkim scheduled tribe 59.18 44.82 46.07 12.19 86.17 7.54 255.97 571.48 1.00 0.00 283 scheduled caste 25.49 39.81 32.03 9.70 94.08 4.58 205.70 482.86 2.14 0.00 59 other backward classes 31.22 41.51 42.32 11.71 85.26 5.84 217.86 505.25 2.89 0.01 416 others 13.02 43.45 45.70 12.70 109.38 4.64 228.88 545.18 1.46 0.01 296 not recorded 1.99 26.11 44.17 12.34 108.89 0.00 193.51 415.44 0.00 0.00 2 all social groups 33.05 42.77 43.60 11.99 92.69 5.86 229.97 531.85 1.96 0.01 1056 (Contd.)

Appendix Tables
NSS Report No.472: Differences in Level of Consumption among Socio-Economic Groups,1999-2000 A-198
Table 8R: Break-up of MPCE by broad groups of non-food items separately for each social group in rural areas and by State/UT
Rural average monthly per capita consumption expenditure (Rs) per 30 days on
social group
pan, tobacco &
intoxicants
fuel &
light
clothing
footwear
misc. goods &
services
durable goods
non-food total
all
clothing (second hand)
durable goods (second
hand)
no. of sample hhs reporting consumption
(1) (17) (18) (19) (20) (21) (22) (23) (24) (25) (26) (27) Tamil Nadu scheduled tribe 10.19 35.43 22.38 1.83 69.09 3.46 142.38 384.64 0.00 0.00 53 scheduled caste 24.51 29.97 23.99 2.37 85.26 9.50 175.60 427.23 0.04 0.14 1016 other backward classes 14.25 36.03 31.90 3.44 125.94 13.18 224.75 547.91 0.03 0.19 2887 others 12.14 47.23 36.02 4.81 180.52 13.70 294.42 651.24 0.00 0.00 209 not recorded 9.22 24.74 29.59 4.61 176.57 6.08 250.81 563.00 0.00 0.00 8 all social groups 17.23 34.67 29.56 3.16 115.59 11.94 212.16 514.06 0.03 0.17 4173 Tripura scheduled tribe 31.77 25.73 25.37 4.32 59.75 9.72 156.66 457.78 0.08 0.00 112 scheduled caste 22.42 36.37 32.49 4.50 81.40 8.78 185.97 531.99 0.05 0.00 265 other backward classes 20.12 39.13 31.17 4.81 85.58 8.01 188.82 529.82 0.00 0.05 236 others 21.36 37.31 32.85 4.60 83.09 6.62 185.83 542.28 0.14 0.01 414 not recorded 20.82 47.98 25.15 4.58 65.04 2.37 165.94 455.20 0.00 0.00 4 all social groups 22.26 36.53 31.63 4.60 81.09 7.80 183.90 528.41 0.08 0.02 1031 Uttar Pradesh scheduled tribe 16.69 31.09 32.15 4.71 79.68 12.89 177.21 425.66 0.00 0.05 105 scheduled caste 13.49 32.86 29.37 4.26 80.73 8.99 169.69 399.33 0.14 0.21 2249 other backward classes 11.18 32.97 33.53 5.03 88.22 12.37 183.31 442.14 0.15 0.16 4035 others 12.30 38.24 42.06 7.41 127.17 20.78 247.95 562.99 0.05 0.95 3031 not recorded 8.35 30.37 37.57 4.74 84.51 4.69 170.23 464.08 0.00 0.00 12 all social groups 12.14 34.45 34.98 5.53 97.62 13.98 198.70 466.64 0.12 0.40 9432 (Contd.)

Appendix Tables
NSS Report No.472: Differences in Level of Consumption among Socio-Economic Groups,1999-2000 A-199
Table 8R: Break-up of MPCE by broad groups of non-food items separately for each social group in rural areas and by State/UT
Rural average monthly per capita consumption expenditure (Rs) per 30 days on
social group
pan, tobacco &
intoxicants
fuel &
light
clothing
footwear
misc. goods &
services
durable goods
non-food total
all
clothing (second hand)
durable goods (second
hand)
no. of sample hhs reporting consumption
(1) (17) (18) (19) (20) (21) (22) (23) (24) (25) (26) (27) West Bengal scheduled tribe 15.75 30.68 24.56 2.30 41.14 2.71 117.14 375.93 0.27 0.00 354 scheduled caste 11.37 34.83 28.36 15.18 60.54 5.04 155.33 439.70 0.15 0.02 1236 other backward classes 9.99 40.41 34.61 4.52 90.58 8.33 188.44 516.62 0.02 0.23 346 others 10.13 36.57 31.39 3.52 68.42 5.92 155.95 463.89 0.11 0.14 2601 not recorded 8.91 31.38 29.21 3.41 43.13 5.62 121.67 405.48 0.00 0.00 13 all social groups 10.83 35.95 30.32 6.68 65.87 5.63 155.27 454.80 0.12 0.10 4550 A. & N. Islands scheduled tribe 63.05 34.41 41.52 8.20 96.36 6.50 250.04 686.74 0.00 0.28 98 scheduled caste 39.49 39.14 52.86 11.91 102.68 2.30 248.39 813.42 0.00 0.00 2 other backward classes 79.11 44.10 29.27 6.94 179.73 46.17 385.33 846.00 8.23 29.83 6 others 29.95 43.99 47.59 11.56 141.63 36.02 310.74 801.67 0.00 0.04 166 not recorded 41.25 23.25 48.82 8.83 62.92 0.00 185.08 511.69 0.00 0.00 1 all social groups 37.32 42.06 46.13 10.83 133.32 30.24 299.90 780.21 0.19 0.78 273 Chandigarh scheduled tribe 16.38 43.97 22.69 6.16 148.99 1242.12 1480.31 1807.06 0.69 0.00 9 scheduled caste 22.92 57.34 40.18 11.58 169.02 18.91 319.94 709.79 1.66 0.00 32 other backward classes 23.43 69.81 46.91 12.10 264.94 32.94 450.13 901.35 2.89 1.97 45 others 62.92 52.08 46.23 10.00 272.35 61.63 505.22 1026.77 1.08 0.83 94 not recorded - - - - - - - - - - - all social groups 45.27 56.11 43.97 10.49 245.54 114.74 516.12 989.19 1.53 0.86 180 (Contd.)

Appendix Tables
NSS Report No.472: Differences in Level of Consumption among Socio-Economic Groups,1999-2000 A-200
Table 8R: Break-up of MPCE by broad groups of non-food items separately for each social group in rural areas and by State/UT
Rural average monthly per capita consumption expenditure (Rs) per 30 days on
social group
pan, tobacco &
intoxicants
fuel &
light
clothing
footwear
misc. goods &
services
durable goods
non-food total
all
clothing (second hand)
durable goods (second
hand)
no. of sample hhs reporting consumption
(1) (17) (18) (19) (20) (21) (22) (23) (24) (25) (26) (27) Dadra & Nagar Haveli scheduled tribe 35.55 36.23 25.60 4.05 74.76 8.01 184.19 460.77 0.17 2.26 153 scheduled caste 48.57 22.86 42.20 10.45 94.14 1.19 219.41 572.91 0.00 0.00 1 other backward classes 45.26 46.02 14.39 2.28 70.30 7.61 185.86 459.40 0.00 0.00 4 others 24.47 68.01 48.01 7.50 299.72 17.83 465.54 1170.83 0.05 0.00 34 not recorded - - - - - - - - - - - all social groups 34.14 40.70 28.75 4.55 106.45 9.35 223.94 561.18 0.15 1.91 192 Daman & Diu scheduled tribe 32.83 47.90 42.33 5.32 137.54 13.45 279.37 650.74 0.08 0.00 70 scheduled caste 38.84 65.49 59.07 7.43 242.43 27.05 440.31 951.35 0.00 0.00 8 other backward classes 37.50 78.07 56.85 10.92 319.82 19.45 522.61 1141.78 0.00 0.00 17 others 38.76 63.21 67.97 9.69 312.80 37.16 529.60 1093.95 0.07 0.00 85 not recorded - - - - - - - - - - - all social groups 36.12 58.39 55.36 7.82 234.57 24.61 416.86 901.48 0.06 0.00 180 Delhi scheduled tribe 11.96 52.07 39.94 18.09 216.28 7.28 345.62 698.52 0.00 0.00 5 scheduled caste 7.65 48.77 37.37 11.28 212.78 9.17 327.02 731.43 0.00 0.00 34 other backward classes 58.53 63.84 53.69 17.96 330.57 51.94 576.53 990.25 0.00 0.00 25 others 25.87 59.42 58.55 16.09 340.36 25.94 526.23 933.17 0.09 0.74 123 not recorded - - - - - - - - - - - all social groups 29.65 58.89 54.91 15.88 321.93 28.60 509.86 917.21 0.06 0.51 187 (Contd.)

Appendix Tables
NSS Report No.472: Differences in Level of Consumption among Socio-Economic Groups,1999-2000 A-201
Table 8R: Break-up of MPCE by broad groups of non-food items separately for each social group in rural areas and by State/UT
Rural average monthly per capita consumption expenditure (Rs) per 30 days on
social group
pan, tobacco &
intoxicants
fuel &
light
clothing
footwear
misc. goods &
services
durable goods
non-food total
all
clothing (second hand)
durable goods (second
hand)
no. of sample hhs reporting consumption
(1) (17) (18) (19) (20) (21) (22) (23) (24) (25) (26) (27) Lakshadweep scheduled tribe 28.18 65.36 45.56 7.52 132.46 36.95 316.02 850.12 0.00 0.00 76 scheduled caste - - - - - - - - - - - other backward classes 49.52 66.66 84.45 21.85 352.96 4.80 580.23 1651.15 0.00 0.00 2 others 2.45 71.05 207.52 40.67 872.94 31.15 1225.78 2209.03 0.00 0.00 6 not recorded - - - - - - - - - - - all social groups 27.86 65.46 48.39 8.13 145.63 36.70 332.17 876.19 0.00 0.00 84 Pondicherry scheduled tribe 62.06 17.51 42.58 6.15 286.24 0.00 414.54 779.20 0.00 0.00 2 scheduled caste 30.21 31.80 27.45 2.92 82.41 6.90 181.67 454.06 0.00 0.00 81 other backward classes 19.02 45.74 39.99 4.73 156.98 19.54 286.01 649.51 0.00 0.02 196 others 2.42 55.84 70.16 12.20 368.16 18.00 526.78 1059.41 0.00 0.00 9 not recorded - - - - - - - - - - - all social groups 22.69 41.32 36.65 4.31 138.91 15.46 259.33 597.63 0.00 0.01 288 all-India scheduled tribe 17.72 31.25 26.61 3.71 59.68 8.08 147.05 387.86 0.36 0.13 10124 scheduled caste 15.38 33.91 28.20 5.45 75.08 7.86 165.89 418.88 0.15 0.10 12755 other backward classes 12.77 35.13 32.55 4.63 92.86 12.75 190.69 473.86 0.11 0.19 24721 others 13.22 41.80 39.71 6.77 123.69 17.55 242.73 577.56 0.08 0.69 23668 not recorded 12.51 31.09 31.77 4.39 87.12 7.11 173.99 464.59 0.01 0.00 117 all social groups 13.96 36.56 33.28 5.37 95.42 12.76 197.36 486.16 0.14 0.32 71385

Appendix Tables
NSS Report No.472: Differences in Level of Consumption among Socio-Economic Groups,1999-2000 A-211
Table 9R: Break-up of MPCE by broad groups of food items separately for each land possessed class in rural areas and by State/UT Rural
average per capita consumption expenditure (Rs) per 30 days on
size of land possessed (hectares) cereals gram
cereal substi- tutes
pulses &
products
milk &
milk products
edibile oil
meat, egg &
fish
vegeta- bles
fruits (fresh)
fruits (dry)
sugar salt spices
beve- rages,
refresh- ments etc,
food total
(1) (2) (3) (4) (5) (6) (7) (8) (9) (10) (11) (12) (13) (14) (15) (16) Andhra Pradesh < 0.01 105.64 0.08 0.00 14.17 25.56 15.77 18.49 27.35 3.35 0.38 5.51 1.02 15.27 39.30 271.90 0.01-0.40 109.91 0.19 0.01 16.67 24.77 16.45 19.99 26.91 5.05 1.38 6.31 1.20 15.47 26.02 270.33 0.41-1.00 110.35 0.14 0.02 17.87 25.21 16.60 19.70 25.49 4.90 1.68 6.44 1.06 14.85 18.30 262.61 1.01-2.00 113.86 0.14 0.00 18.54 30.13 17.28 20.91 25.71 5.44 2.14 7.10 1.03 14.46 16.93 273.66 2.01-4.00 118.04 0.03 0.00 20.19 34.87 18.44 23.12 26.12 6.68 2.78 8.14 1.09 15.25 20.41 295.16 4.01+ 126.79 0.29 0.00 25.52 49.04 22.66 28.51 27.48 8.46 3.22 11.27 1.22 15.79 24.31 344.56 all sizes 111.70 0.16 0.01 17.70 27.40 16.98 20.61 26.46 5.28 1.69 6.76 1.14 15.21 23.36 274.45 Arunachal Pradesh < 0.01 126.00 0.25 0.30 29.12 32.54 27.77 64.21 58.72 10.14 0.68 10.32 2.36 14.20 32.56 409.16 0.01-0.40 163.49 0.06 0.08 25.52 25.85 19.19 74.97 92.44 5.63 0.21 9.10 2.37 10.86 30.17 459.92 0.41-1.00 167.92 0.53 0.00 10.77 21.34 11.63 50.07 48.40 7.32 0.76 7.68 2.63 8.67 15.28 353.00 1.01-2.00 170.85 0.20 0.02 7.95 8.34 10.35 60.03 47.88 10.82 0.12 5.59 2.00 7.06 11.94 343.16 2.01-4.00 158.93 0.27 0.80 7.24 5.81 7.34 58.82 53.43 7.42 0.14 7.50 1.65 5.04 11.74 326.14 4.01+ 130.31 0.08 8.49 11.01 8.57 5.70 46.58 36.78 4.10 0.15 8.29 1.54 6.74 10.16 278.49 all sizes 156.80 0.26 1.26 13.99 16.30 12.81 58.75 56.11 7.62 0.35 7.85 2.12 8.39 17.64 360.23 Assam < 0.01 124.93 0.01 0.00 7.36 3.82 10.83 16.34 21.43 1.71 0.00 4.42 1.18 6.87 22.53 221.44 0.01-0.40 121.59 0.16 0.01 12.33 10.29 14.27 33.58 34.97 3.39 0.07 6.71 1.36 7.07 17.63 263.45 0.41-1.00 145.96 0.18 0.02 14.07 16.52 15.30 35.84 36.27 3.94 0.09 8.10 1.27 7.79 15.59 300.95 1.01-2.00 158.10 0.20 0.02 13.91 21.75 15.06 37.97 34.84 4.71 0.09 7.66 1.20 7.04 15.08 317.64 2.01-4.00 166.11 0.15 0.05 16.02 25.41 17.05 45.15 37.28 5.24 0.11 8.63 1.27 7.15 18.47 348.07 4.01+ 151.63 0.25 0.00 15.99 28.06 16.56 43.43 33.52 7.94 0.52 8.02 1.31 7.05 20.02 334.29 all sizes 137.85 0.17 0.02 13.20 15.05 14.78 35.41 35.01 3.91 0.09 7.30 1.30 7.23 16.89 288.20
(Contd.)

Appendix Tables
NSS Report No.472: Differences in Level of Consumption among Socio-Economic Groups,1999-2000 A-212
Table 9R: Break-up of MPCE by broad groups of food items separately for each land possessed class in rural areas and by State/UT Rural
average per capita consumption expenditure (Rs) per 30 days on
size of land possessed (hectares) cereals gram
cereal substi- tutes
pulses &
products
milk &
milk products
edibile oil
meat, egg &
fish
vegeta- bles
fruits (fresh)
fruits (dry)
sugar salt spices
beve- rages,
refresh- ments etc,
food total
(1) (2) (3) (4) (5) (6) (7) (8) (9) (10) (11) (12) (13) (14) (15) (16) Bihar < 0.01 115.53 0.60 0.00 12.34 14.34 13.86 7.68 28.71 1.56 0.17 4.94 1.16 9.18 10.17 220.21 0.01-0.40 124.97 0.90 0.11 14.29 18.46 15.36 10.63 29.33 2.56 0.59 5.99 1.13 9.20 9.37 242.89 0.41-1.00 126.86 1.01 0.15 16.96 31.76 17.02 11.57 31.90 4.12 0.31 7.02 1.16 9.48 10.89 270.20 1.01-2.00 126.35 1.06 0.00 17.58 41.76 17.73 11.93 32.71 4.01 0.18 7.79 1.11 9.45 11.30 282.95 2.01-4.00 132.22 1.81 0.05 19.13 53.01 17.97 14.30 35.63 5.57 0.72 8.83 1.17 11.06 14.09 315.57 4.01+ 136.61 1.82 0.00 21.55 66.08 20.30 16.09 39.20 8.00 1.96 11.28 1.14 11.04 18.92 353.98 all sizes 125.15 0.97 0.09 15.35 25.77 16.02 10.95 30.63 3.17 0.48 6.53 1.14 9.40 10.36 255.99 Goa < 0.01 177.47 0.99 0.47 31.74 43.75 25.15 66.92 59.14 62.00 8.12 19.93 2.26 22.32 87.01 607.28 0.01-0.40 125.55 0.33 0.49 14.90 50.17 19.49 80.71 35.52 48.05 1.62 15.79 1.51 17.39 50.31 461.82 0.41-1.00 164.51 0.62 0.06 14.13 34.03 15.32 62.79 35.18 52.44 3.69 14.33 0.94 24.20 48.93 471.16 1.01-2.00 170.10 0.00 0.00 26.97 26.64 26.92 116.56 41.37 59.98 20.56 20.25 1.48 22.41 79.48 612.73 2.01-4.00 101.36 0.00 0.00 12.33 20.00 14.44 50.00 22.89 26.22 0.00 10.44 0.89 9.00 9.00 276.58 4.01+ 0.00 0.00 0.00 0.00 0.00 0.00 0.00 0.00 0.00 0.00 0.00 0.00 0.00 0.00 0.00 all sizes 131.78 0.38 0.44 16.05 47.65 19.60 78.85 36.79 49.03 2.51 15.93 1.51 18.10 52.25 470.85 Gujarat < 0.01 70.86 0.58 0.02 21.57 60.59 33.36 3.34 43.55 4.99 0.83 15.68 0.64 13.19 30.80 300.00 0.01-0.40 79.21 0.53 0.02 21.94 61.51 33.33 5.59 35.86 5.31 0.77 15.88 0.73 14.01 27.68 302.37 0.41-1.00 80.98 0.58 0.04 22.41 71.99 32.11 5.59 35.76 5.62 1.86 16.46 0.72 14.19 25.35 313.65 1.01-2.00 80.43 0.84 0.03 24.06 92.12 34.49 3.47 37.41 8.97 2.13 18.06 0.66 13.70 28.54 344.91 2.01-4.00 90.24 0.84 0.12 26.62 111.56 40.12 3.77 41.99 8.88 2.80 19.71 0.73 14.64 31.07 393.09 4.01+ 90.67 0.86 0.25 25.58 132.18 43.47 2.19 41.27 12.68 4.17 21.23 0.78 14.58 34.67 424.59 all sizes 80.84 0.65 0.06 23.06 78.60 34.91 4.55 38.03 6.85 1.64 17.11 0.71 14.02 28.78 329.81
(Contd.)

Appendix Tables
NSS Report No.472: Differences in Level of Consumption among Socio-Economic Groups,1999-2000 A-213
Table 9R: Break-up of MPCE by broad groups of food items separately for each land possessed class in rural areas and by State/UT Rural
average per capita consumption expenditure (Rs) per 30 days on
size of land possessed (hectares) cereals gram
cereal substi- tutes
pulses &
products
milk &
milk products
edibile oil
meat, egg &
fish
vegeta- bles
fruits (fresh)
fruits (dry)
sugar salt spices
beve- rages,
refresh- ments etc,
food total
(1) (2) (3) (4) (5) (6) (7) (8) (9) (10) (11) (12) (13) (14) (15) (16) Haryana < 0.01 96.09 2.87 0.00 26.05 94.42 24.94 3.92 41.49 7.96 0.34 33.72 1.51 17.55 28.59 379.45 0.01-0.40 78.60 0.93 0.00 18.48 125.62 15.75 3.56 32.88 8.63 1.98 27.60 1.12 12.02 20.84 348.01 0.41-1.00 80.10 0.97 0.00 20.34 188.59 16.32 4.01 37.72 10.40 1.10 32.39 1.21 14.27 20.07 427.48 1.01-2.00 77.49 0.61 0.00 19.79 220.08 11.76 0.79 35.44 9.26 0.68 29.98 1.12 13.25 23.41 443.66 2.01-4.00 77.15 1.33 0.00 21.92 199.84 11.24 1.13 39.78 11.07 1.03 35.17 1.13 14.51 27.17 442.47 4.01+ 75.65 2.42 0.00 20.62 244.18 12.07 1.53 41.41 15.30 0.89 34.87 1.10 13.56 26.36 489.95 all sizes 78.89 1.18 0.00 19.84 164.46 14.76 2.77 35.87 9.87 1.42 30.42 1.14 13.14 22.78 396.55 Himachal Pradesh < 0.01 109.69 2.34 0.00 31.12 101.83 30.23 16.94 36.53 15.67 6.47 19.42 1.51 14.24 108.85 494.83 0.01-0.40 115.32 2.87 0.00 29.88 86.35 28.14 9.36 30.95 7.13 2.02 18.53 1.49 14.64 29.80 376.48 0.41-1.00 118.66 2.90 0.00 29.78 101.61 26.54 7.86 29.69 6.44 2.60 18.96 1.55 14.06 23.73 384.39 1.01-2.00 123.07 2.69 0.00 29.11 104.54 24.58 8.49 27.70 7.54 2.80 18.93 1.49 13.96 24.20 389.10 2.01-4.00 117.13 2.96 0.00 27.29 113.17 24.34 6.89 27.24 8.21 3.10 17.28 1.44 12.71 19.36 381.11 4.01+ 110.41 3.47 0.00 29.02 107.71 25.78 4.29 24.08 7.42 1.55 19.70 1.29 10.16 30.02 374.90 all sizes 117.16 2.86 0.00 29.61 95.29 27.00 8.77 29.94 7.26 2.44 18.68 1.50 14.17 28.64 383.33 Jammu & Kashmir < 0.01 103.98 1.41 0.00 33.23 77.84 24.26 6.47 39.85 10.73 1.79 14.23 3.07 12.95 29.38 359.19 0.01-0.40 143.20 1.87 0.00 19.96 84.75 31.34 26.73 43.63 10.08 1.52 11.44 2.20 16.92 26.80 420.44 0.41-1.00 148.32 2.61 0.00 23.14 97.79 31.37 33.20 39.81 10.88 2.10 11.31 2.12 15.74 25.70 444.09 1.01-2.00 137.89 3.78 0.00 25.66 102.25 29.05 19.40 37.31 10.84 1.34 14.00 1.73 14.82 25.02 423.09 2.01-4.00 130.01 2.60 0.00 30.04 96.64 27.22 11.09 41.38 11.02 1.56 16.24 1.69 12.55 20.36 402.39 4.01+ 123.17 6.43 0.00 31.58 96.95 21.30 5.48 15.54 2.55 0.15 22.11 1.80 10.16 20.45 357.67 all sizes 141.89 2.79 0.00 23.53 93.91 30.02 25.38 39.20 10.06 1.62 12.85 2.03 15.39 25.25 423.92
(Contd.)

Appendix Tables
NSS Report No.472: Differences in Level of Consumption among Socio-Economic Groups,1999-2000 A-214
Table 9R: Break-up of MPCE by broad groups of food items separately for each land possessed class in rural areas and by State/UT Rural
average per capita consumption expenditure (Rs) per 30 days on
size of land possessed (hectares) cereals gram
cereal substi- tutes
pulses &
products
milk &
milk products
edibile oil
meat, egg &
fish
vegeta- bles
fruits (fresh)
fruits (dry)
sugar salt spices
beve- rages,
refresh- ments etc,
food total
(1) (2) (3) (4) (5) (6) (7) (8) (9) (10) (11) (12) (13) (14) (15) (16) Karnataka < 0.01 82.32 0.91 0.00 22.10 32.84 13.10 24.63 23.19 9.33 1.02 10.81 1.06 14.00 53.16 288.48 0.01-0.40 98.08 0.96 0.03 20.66 29.12 16.86 21.20 24.01 12.80 2.46 11.11 1.12 15.29 37.07 290.77 0.41-1.00 97.35 1.52 0.02 21.84 31.43 16.32 18.73 24.06 12.35 2.49 10.97 1.08 14.69 25.57 278.42 1.01-2.00 105.59 1.11 0.00 23.90 36.38 17.12 16.50 23.27 13.62 3.47 12.42 1.08 14.16 27.00 295.62 2.01-4.00 110.85 1.03 0.04 25.61 39.64 18.48 17.26 22.74 11.82 4.02 13.15 1.09 13.57 33.82 313.11 4.01+ 121.39 1.33 0.06 29.01 42.43 20.45 10.61 22.88 11.59 5.61 14.59 1.07 13.37 27.21 321.61 all sizes 102.87 1.15 0.02 23.04 33.75 17.27 18.36 23.58 12.48 3.13 11.94 1.09 14.50 32.07 295.25 Kerala < 0.01 94.35 1.33 3.95 15.02 39.44 17.05 61.07 29.23 37.90 0.38 10.07 1.10 21.40 167.74 500.02 0.01-0.40 107.14 1.78 4.46 12.48 33.08 19.29 59.43 28.27 35.32 0.94 11.71 0.99 19.23 60.67 394.79 0.41-1.00 124.38 2.04 5.69 16.57 54.29 22.86 66.71 34.88 45.30 1.07 13.31 1.09 21.47 51.53 461.20 1.01-2.00 136.20 2.60 6.39 18.38 62.58 27.15 73.45 35.11 49.78 1.03 14.35 1.13 22.23 50.61 500.98 2.01-4.00 123.91 2.62 9.31 23.03 76.66 26.23 75.00 35.75 52.50 1.62 15.40 1.42 21.82 48.27 513.55 4.01+ 133.06 5.36 8.31 28.97 123.40 42.70 112.07 52.95 74.64 5.21 17.71 1.27 22.93 122.30 750.87 all sizes 110.68 1.87 4.78 13.47 37.88 20.22 61.33 29.53 37.54 0.97 12.07 1.02 19.69 60.16 411.19 Madhya Pradesh < 0.01 85.59 0.52 0.25 19.41 25.88 15.32 5.98 22.74 4.24 0.47 13.31 0.97 11.34 20.01 226.05 0.01-0.40 95.46 0.29 0.07 15.64 20.71 14.34 6.37 23.89 2.85 0.28 9.79 1.04 10.33 11.86 212.93 0.41-1.00 104.26 0.20 0.15 15.55 22.97 13.30 4.81 22.99 2.62 0.39 9.48 0.97 9.92 10.57 218.17 1.01-2.00 103.44 0.49 0.14 17.81 31.39 14.25 5.47 22.33 3.28 0.26 10.72 0.96 9.88 12.53 232.96 2.01-4.00 102.71 0.39 0.19 18.60 40.22 15.90 4.87 21.86 4.12 0.69 12.06 0.99 10.05 11.58 244.24 4.01+ 102.06 0.51 0.51 22.11 60.96 18.07 5.13 23.15 6.19 1.19 16.28 0.99 11.03 18.45 286.62 all sizes 100.29 0.37 0.18 17.59 31.97 14.92 5.45 22.88 3.60 0.49 11.31 0.99 10.25 12.94 233.23
(Contd.)

Appendix Tables
NSS Report No.472: Differences in Level of Consumption among Socio-Economic Groups,1999-2000 A-215
Table 9R: Break-up of MPCE by broad groups of food items separately for each land possessed class in rural areas and by State/UT Rural
average per capita consumption expenditure (Rs) per 30 days on
size of land possessed (hectares) cereals gram
cereal substi- tutes
pulses &
products
milk &
milk products
edibile oil
meat, egg &
fish
vegeta- bles
fruits (fresh)
fruits (dry)
sugar salt spices
beve- rages,
refresh- ments etc,
food total
(1) (2) (3) (4) (5) (6) (7) (8) (9) (10) (11) (12) (13) (14) (15) (16) Maharashtra < 0.01 80.68 0.82 2.37 23.03 29.96 23.43 17.64 26.71 8.83 8.03 13.43 1.08 14.98 44.27 295.23 0.01-0.40 87.75 0.39 1.60 22.60 25.51 20.89 15.80 26.90 7.15 5.92 14.46 1.16 14.03 19.89 264.05 0.41-1.00 87.98 0.44 1.93 21.55 27.20 20.65 14.29 26.63 6.69 5.99 14.08 1.02 13.15 19.97 261.57 1.01-2.00 88.57 0.29 2.20 25.41 31.08 21.83 12.38 25.13 6.49 7.15 15.73 1.03 13.92 17.81 269.01 2.01-4.00 89.06 0.34 2.44 27.08 35.06 22.27 12.56 23.86 7.11 7.08 15.33 0.99 13.28 17.90 274.34 4.01+ 93.97 0.27 2.58 29.11 45.77 23.69 12.63 22.94 7.56 7.77 18.45 1.07 13.89 20.23 299.91 all sizes 87.83 0.41 2.01 23.98 29.93 21.66 14.55 25.86 7.17 6.64 14.91 1.08 13.86 21.90 271.78 Manipur < 0.01 202.58 0.00 0.97 3.69 0.33 15.46 21.32 30.90 4.74 0.00 6.04 1.46 15.56 38.17 341.21 0.01-0.40 211.34 0.13 0.04 10.23 5.20 11.89 37.34 35.54 5.17 0.11 4.98 1.79 12.41 18.97 355.15 0.41-1.00 208.70 0.00 0.08 11.81 5.48 9.40 28.77 34.14 4.83 0.13 5.47 1.85 10.87 14.71 336.25 1.01-2.00 193.44 0.07 0.06 9.64 5.34 10.84 34.85 31.39 3.93 0.23 5.86 1.79 11.34 13.84 322.63 2.01-4.00 195.09 0.09 0.00 8.58 7.07 10.32 34.89 26.91 3.80 0.90 6.48 2.00 8.08 13.90 318.11 4.01+ 152.04 0.42 0.00 9.33 13.43 11.76 38.51 30.56 3.91 0.00 4.62 1.33 9.66 21.20 296.78 all sizes 205.25 0.07 0.06 10.45 5.46 10.80 33.79 33.59 4.70 0.19 5.42 1.82 11.42 16.41 339.43 Meghalaya < 0.01 124.73 0.00 0.00 8.61 18.01 18.35 71.88 51.76 10.67 0.00 10.75 1.29 7.43 49.81 373.30 0.01-0.40 129.13 0.00 0.93 6.90 8.90 14.09 60.97 44.87 7.30 0.06 9.97 1.27 6.32 31.12 321.83 0.41-1.00 129.92 0.02 2.39 8.17 11.99 11.69 58.44 56.24 8.26 0.17 8.83 1.54 5.57 26.98 330.21 1.01-2.00 146.29 0.02 0.72 6.79 6.82 12.23 64.03 46.38 8.55 0.07 10.60 1.44 5.89 41.24 351.07 2.01-4.00 144.94 0.00 0.31 5.94 9.61 11.09 66.62 49.48 10.26 0.16 12.20 1.26 5.62 36.10 353.59 4.01+ 148.10 0.00 0.17 6.75 22.24 11.05 63.21 62.06 20.45 0.61 10.61 1.68 4.76 33.16 384.83 all sizes 136.71 0.01 1.19 7.19 10.00 12.46 62.33 50.17 8.77 0.12 10.16 1.41 5.87 34.12 340.51
(Contd.)

Appendix Tables
NSS Report No.472: Differences in Level of Consumption among Socio-Economic Groups,1999-2000 A-216
Table 9R: Break-up of MPCE by broad groups of food items separately for each land possessed class in rural areas and by State/UT Rural
average per capita consumption expenditure (Rs) per 30 days on
size of land possessed (hectares) cereals gram
cereal substi- tutes
pulses &
products
milk &
milk products
edibile oil
meat, egg &
fish
vegeta- bles
fruits (fresh)
fruits (dry)
sugar salt spices
beve- rages,
refresh- ments etc,
food total
(1) (2) (3) (4) (5) (6) (7) (8) (9) (10) (11) (12) (13) (14) (15) (16) Mizoram < 0.01 184.22 0.30 0.00 37.95 15.07 54.86 119.39 177.98 20.84 0.00 13.41 5.06 29.08 53.84 711.99 0.01-0.40 141.61 0.00 0.52 25.66 28.55 25.97 88.38 99.81 10.77 0.44 16.57 3.76 12.18 38.40 492.61 0.41-1.00 135.29 0.08 0.96 21.63 17.95 18.93 74.46 87.52 8.10 0.30 14.79 3.42 11.36 33.23 428.03 1.01-2.00 145.91 0.26 0.11 17.95 13.07 17.84 58.66 78.83 7.13 0.23 13.71 2.59 9.37 26.78 392.43 2.01-4.00 150.85 0.00 0.00 17.22 16.11 17.46 67.18 87.60 7.88 0.64 14.23 3.52 10.58 24.67 417.93 4.01+ 146.52 2.19 0.00 15.82 98.02 22.91 104.79 77.27 10.73 0.00 15.32 2.66 9.01 40.81 546.04 all sizes 142.02 0.14 0.49 20.49 18.79 19.65 71.40 87.11 8.27 0.35 14.65 3.24 10.84 31.02 428.46 Nagaland < 0.01 76.16 0.00 0.00 20.64 43.57 1.23 71.64 58.69 19.07 0.00 6.97 0.76 5.43 523.68 827.82 0.01-0.40 194.11 0.61 0.55 20.58 40.05 13.32 92.70 78.94 20.51 0.08 11.20 2.11 11.54 54.60 540.90 0.41-1.00 208.90 1.96 0.00 17.57 41.45 11.36 100.01 95.22 21.33 0.15 12.40 2.46 11.07 59.83 583.70 1.01-2.00 210.66 0.94 0.00 19.14 30.95 11.71 101.10 81.77 17.54 0.00 13.28 2.45 11.72 40.47 541.71 2.01-4.00 213.73 0.84 0.00 17.51 35.91 12.18 104.72 79.90 17.06 0.01 14.09 2.62 10.80 41.87 551.22 4.01+ 209.95 2.06 0.00 20.62 43.14 10.32 105.39 93.91 20.29 0.44 14.17 2.58 10.74 40.73 574.35 all sizes 209.70 1.11 0.06 18.60 36.58 11.85 102.06 83.58 18.40 0.08 13.40 2.50 11.12 45.66 554.68 Orissa < 0.01 113.49 0.15 0.00 14.72 9.55 10.90 12.01 31.69 4.93 0.66 6.62 1.18 8.59 117.53 332.03 0.01-0.40 133.07 0.15 0.02 9.86 6.70 10.73 12.30 30.71 3.26 0.13 5.73 1.17 7.96 11.92 233.70 0.41-1.00 133.94 0.27 0.12 9.95 6.49 10.28 12.87 30.14 3.25 0.19 5.60 1.10 7.84 9.76 231.82 1.01-2.00 139.11 0.32 0.08 11.86 10.41 11.51 17.45 32.80 4.08 0.21 6.31 1.09 8.09 11.21 254.56 2.01-4.00 135.08 0.18 0.00 12.59 12.78 11.81 15.40 31.60 4.20 0.20 6.58 1.09 7.79 11.10 250.40 4.01+ 144.45 0.07 0.04 15.56 14.87 12.31 20.06 35.25 4.73 0.43 8.43 1.21 8.21 14.63 280.24 all sizes 134.38 0.21 0.06 10.54 7.81 10.83 13.57 31.02 3.49 0.17 5.91 1.14 7.94 12.18 239.25
(Contd.)

Appendix Tables
NSS Report No.472: Differences in Level of Consumption among Socio-Economic Groups,1999-2000 A-217
Table 9R: Break-up of MPCE by broad groups of food items separately for each land possessed class in rural areas and by State/UT Rural
average per capita consumption expenditure (Rs) per 30 days on
size of land possessed (hectares) cereals gram
cereal substi- tutes
pulses &
products
milk &
milk products
edibile oil
meat, egg &
fish
vegeta- bles
fruits (fresh)
fruits (dry)
sugar salt spices
beve- rages,
refresh- ments etc,
food total
(1) (2) (3) (4) (5) (6) (7) (8) (9) (10) (11) (12) (13) (14) (15) (16) Punjab < 0.01 74.68 2.72 0.00 23.15 83.81 28.32 6.41 40.01 6.62 0.32 29.40 1.27 17.22 30.19 344.13 0.01-0.40 71.83 2.89 0.00 20.73 94.47 21.01 5.33 32.51 7.57 1.38 27.70 1.34 13.32 29.57 329.63 0.41-1.00 78.06 3.26 0.00 25.79 163.60 27.11 6.94 40.83 11.15 1.11 35.47 1.73 16.18 34.77 445.98 1.01-2.00 75.77 3.63 0.00 26.46 167.01 23.27 4.00 41.14 11.30 2.54 36.52 1.32 15.41 32.63 441.00 2.01-4.00 78.20 3.09 0.00 23.42 183.27 20.43 5.38 37.14 12.23 1.87 37.89 1.15 76.95 34.09 515.12 4.01+ 73.66 3.91 0.00 23.64 204.96 19.36 7.21 39.23 14.99 4.44 39.78 1.12 15.73 39.70 487.74 all sizes 73.86 3.11 0.00 22.50 127.90 22.09 5.64 35.83 9.45 1.75 31.72 1.32 21.18 31.93 388.27 Rajasthan < 0.01 96.88 0.04 0.00 14.01 56.14 20.22 4.81 24.18 4.30 0.77 17.47 0.94 15.32 17.77 272.85 0.01-0.40 94.00 0.38 0.00 13.87 88.74 17.57 6.61 26.45 4.31 1.15 16.87 1.11 15.20 20.08 306.35 0.41-1.00 93.73 0.23 0.00 13.34 89.51 16.67 6.00 22.91 3.45 0.82 15.43 1.10 14.96 15.29 293.44 1.01-2.00 96.38 0.32 0.00 14.09 111.62 17.22 3.13 25.27 3.57 1.17 16.47 1.14 13.83 16.02 320.22 2.01-4.00 99.22 0.69 0.00 14.34 129.85 19.00 3.69 26.21 4.05 1.48 18.55 1.09 15.21 17.10 350.48 4.01+ 106.88 0.65 0.01 13.29 137.00 19.14 3.36 25.81 4.11 1.80 19.85 1.03 15.31 18.76 366.98 all sizes 98.14 0.45 0.00 13.76 109.86 17.96 4.66 25.37 3.93 1.28 17.48 1.09 14.94 17.67 326.60 Sikkim < 0.01 86.15 2.59 0.00 17.04 51.66 21.20 44.92 57.76 7.49 1.37 8.12 1.33 9.84 86.71 396.17 0.01-0.40 90.99 1.03 0.00 15.47 50.31 20.54 39.76 51.30 5.08 0.14 5.57 1.39 8.33 23.43 313.33 0.41-1.00 91.35 0.12 0.00 10.71 38.76 18.60 26.06 46.91 2.53 0.03 4.54 1.11 7.65 19.45 267.81 1.01-2.00 96.06 0.28 0.00 10.92 47.65 18.21 34.57 47.15 2.53 0.12 3.69 1.24 7.29 20.90 290.59 2.01-4.00 88.24 0.34 0.00 11.07 43.37 18.58 35.53 47.54 3.18 0.15 3.44 1.42 6.50 24.33 283.68 4.01+ 112.18 0.49 0.00 10.42 53.87 19.52 45.14 48.87 5.73 0.31 3.87 1.43 6.46 27.10 335.39 all sizes 91.76 0.70 0.00 12.71 45.62 19.34 34.58 49.45 3.88 0.26 4.96 1.26 7.89 29.46 301.88
(Contd.)

Appendix Tables
NSS Report No.472: Differences in Level of Consumption among Socio-Economic Groups,1999-2000 A-218
Table 9R: Break-up of MPCE by broad groups of food items separately for each land possessed class in rural areas and by State/UT Rural
average per capita consumption expenditure (Rs) per 30 days on
size of land possessed (hectares) cereals gram
cereal substi- tutes
pulses &
products
milk &
milk products
edibile oil
meat, egg &
fish
vegeta- bles
fruits (fresh)
fruits (dry)
sugar salt spices
beve- rages,
refresh- ments etc,
food total
(1) (2) (3) (4) (5) (6) (7) (8) (9) (10) (11) (12) (13) (14) (15) (16) Tamil Nadu < 0.01 91.81 1.43 0.11 25.00 22.96 18.11 24.61 37.53 11.38 0.18 7.63 1.11 23.46 52.04 317.37 0.01-0.40 87.82 0.75 0.28 21.51 22.88 16.38 24.19 31.94 11.16 0.32 6.63 1.12 33.25 37.24 295.47 0.41-1.00 95.62 1.20 0.02 22.69 26.42 16.70 23.83 30.67 10.82 0.43 6.68 1.08 21.98 29.55 287.69 1.01-2.00 108.45 1.38 0.05 26.63 34.31 17.25 26.07 34.63 11.35 0.52 8.81 1.17 22.92 29.98 323.53 2.01-4.00 126.67 1.21 0.00 28.30 41.73 19.59 27.30 35.62 12.74 1.25 10.07 1.17 23.29 32.14 361.07 4.01+ 135.31 1.47 0.00 31.65 54.93 21.75 33.74 36.44 18.82 2.74 10.66 1.07 24.55 49.55 422.69 all sizes 92.62 0.94 0.20 22.68 25.22 16.81 24.52 32.58 11.30 0.41 7.03 1.12 29.57 36.89 301.90 Tripura < 0.01 175.32 0.00 0.00 15.23 30.80 24.43 60.55 51.21 6.56 0.00 7.31 1.97 11.63 15.07 400.08 0.01-0.40 150.07 0.05 0.33 10.97 14.88 17.11 50.08 44.36 6.85 0.13 6.34 1.65 9.58 14.94 327.35 0.41-1.00 171.34 0.08 0.09 12.39 27.38 17.19 56.32 47.50 7.94 0.05 6.70 1.73 9.97 14.37 373.05 1.01-2.00 168.76 0.47 0.03 11.62 36.63 18.21 53.11 44.19 7.79 0.03 7.96 1.53 8.03 14.70 373.07 2.01-4.00 202.85 0.23 0.04 15.96 29.13 18.44 67.37 55.21 7.79 0.16 5.15 1.41 10.77 17.88 432.37 4.01+ 189.20 0.00 0.00 17.98 31.93 22.56 74.65 46.30 8.13 0.00 7.06 1.79 10.35 21.51 431.45 all sizes 157.65 0.09 0.24 11.54 19.92 17.42 52.31 45.34 7.19 0.10 6.56 1.67 9.63 14.86 344.51 Uttar Pradesh < 0.01 95.50 0.31 0.05 21.36 38.74 15.65 11.98 25.56 5.32 0.78 12.53 0.88 12.44 25.61 266.71 0.01-0.40 96.97 0.27 0.04 20.18 33.21 16.32 8.41 26.74 4.41 1.15 11.41 0.88 11.80 13.78 245.57 0.41-1.00 99.05 0.31 0.01 22.11 48.01 18.15 7.43 28.00 5.28 1.24 12.78 0.86 11.84 12.93 268.01 1.01-2.00 97.46 0.45 0.05 23.96 57.77 18.16 6.49 28.36 6.50 1.28 14.43 0.84 12.09 14.06 281.91 2.01-4.00 102.07 0.60 0.07 26.90 78.20 21.24 7.15 30.22 8.23 1.92 18.15 0.81 13.16 18.93 327.65 4.01+ 99.96 0.81 0.00 29.64 95.48 21.54 8.71 31.42 10.59 2.75 18.20 0.85 13.44 23.09 356.48 all sizes 98.03 0.35 0.03 22.15 46.66 17.62 7.89 27.70 5.50 1.29 13.04 0.86 12.04 14.75 267.94
(Contd.)

Appendix Tables
NSS Report No.472: Differences in Level of Consumption among Socio-Economic Groups,1999-2000 A-219
Table 9R: Break-up of MPCE by broad groups of food items separately for each land possessed class in rural areas and by State/UT Rural
average per capita consumption expenditure (Rs) per 30 days on
size of land possessed (hectares) cereals gram
cereal substi- tutes
pulses &
products
milk &
milk products
edibile oil
meat, egg &
fish
vegeta- bles
fruits (fresh)
fruits (dry)
sugar salt spices
beve- rages,
refresh- ments etc,
food total
(1) (2) (3) (4) (5) (6) (7) (8) (9) (10) (11) (12) (13) (14) (15) (16) West Bengal < 0.01 140.21 0.07 0.00 12.63 9.68 20.70 35.52 41.53 3.10 0.04 6.31 1.49 11.06 25.02 307.35 0.01-0.40 139.94 0.08 0.03 10.79 11.20 17.75 33.35 38.92 3.72 0.17 6.45 1.24 10.12 13.63 287.38 0.41-1.00 149.96 0.11 0.00 13.30 23.03 20.10 41.52 42.83 5.56 0.21 7.34 1.57 10.66 14.14 330.32 1.01-2.00 150.97 0.13 0.02 13.47 24.93 19.36 37.97 39.12 5.42 0.18 7.44 1.36 9.58 12.76 322.72 2.01-4.00 150.53 0.05 0.00 14.15 27.41 21.71 42.29 39.88 6.15 0.85 8.69 1.26 9.77 14.50 337.26 4.01+ 148.82 0.09 0.02 17.72 28.89 21.02 53.65 41.41 9.09 1.09 8.59 1.36 10.33 17.63 359.71 all sizes 142.76 0.09 0.02 11.60 14.65 18.48 35.46 39.71 4.22 0.19 6.73 1.32 10.19 14.11 299.53 A. & N. Islands < 0.01 107.17 0.76 0.00 23.85 40.64 39.08 69.48 63.40 25.31 0.51 9.53 2.46 22.15 121.95 526.28 0.01-0.40 134.64 0.36 0.80 33.78 44.14 41.06 72.09 65.33 13.10 0.10 13.36 2.67 22.57 69.56 513.56 0.41-1.00 137.26 0.18 1.99 30.95 35.30 37.81 79.26 65.37 20.14 0.14 14.21 2.31 21.66 53.07 499.66 1.01-2.00 114.00 0.00 1.56 28.39 19.42 32.84 64.38 57.39 14.37 0.00 11.78 2.53 19.72 42.09 408.48 2.01-4.00 130.29 0.00 0.83 33.84 44.25 37.89 64.08 53.72 13.39 0.47 13.42 2.35 19.40 41.31 455.24 4.01+ 90.85 0.00 0.00 24.65 36.80 35.49 67.31 57.36 12.68 0.00 8.92 2.73 18.79 21.60 377.18 all sizes 125.00 0.26 0.90 30.85 38.60 38.40 70.00 61.71 15.58 0.19 12.47 2.54 21.28 62.52 480.31 Chandigarh < 0.01 100.71 1.84 0.00 31.47 78.43 32.62 20.42 57.42 16.81 0.37 21.39 5.04 18.62 56.90 442.04 0.01-0.40 80.79 2.68 0.00 27.73 101.48 25.67 8.97 46.23 15.50 0.63 20.04 1.39 14.71 43.82 389.65 0.41-1.00 73.29 3.35 0.00 28.36 176.19 26.11 1.10 61.52 30.37 4.33 37.38 1.19 20.89 58.57 522.66 1.01-2.00 81.19 3.39 0.00 23.98 189.49 34.22 0.00 42.71 28.31 0.00 36.33 1.26 18.81 31.87 491.55 2.01-4.00 36.23 4.65 0.00 24.41 453.99 15.03 1.03 31.68 63.71 0.00 55.82 0.05 10.02 35.85 732.48 4.01+ 157.78 8.89 0.00 41.78 160.00 67.22 0.00 47.00 14.00 0.00 45.58 1.33 19.11 45.56 608.24 all sizes 84.90 2.58 0.00 29.20 144.96 28.11 13.52 50.04 23.83 0.42 26.74 3.11 16.24 49.44 473.07
(Contd.)
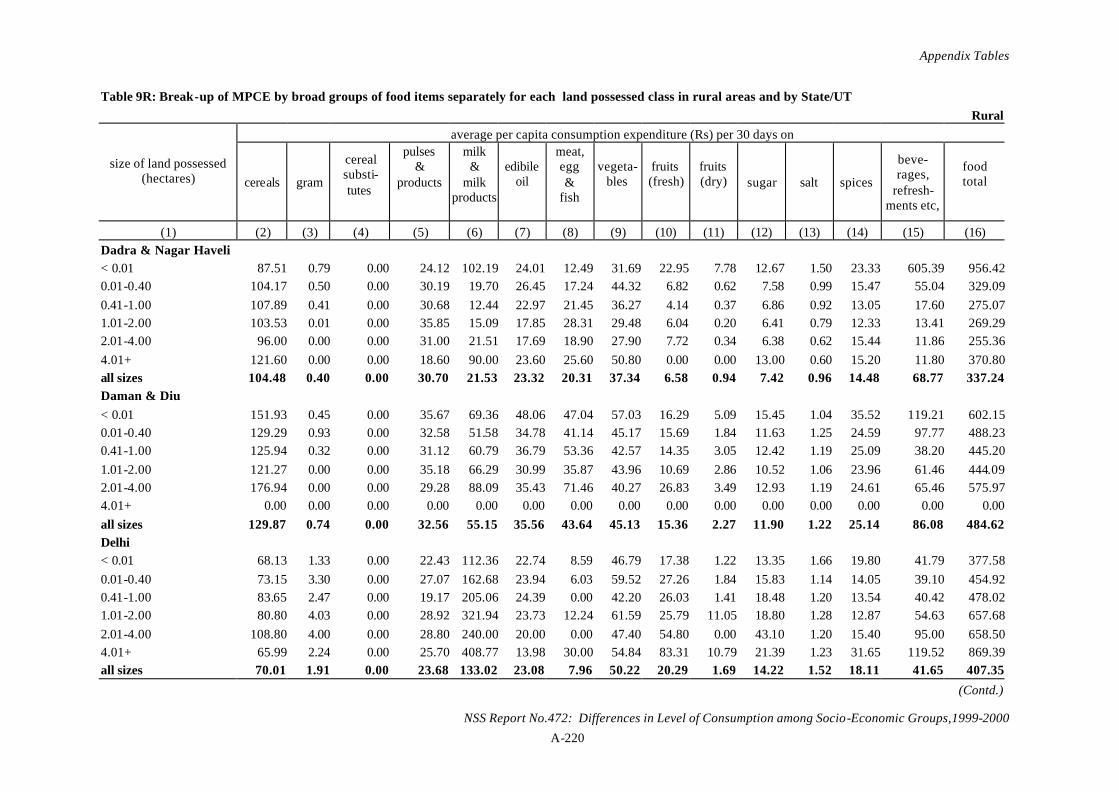
Appendix Tables
NSS Report No.472: Differences in Level of Consumption among Socio-Economic Groups,1999-2000 A-220
Table 9R: Break-up of MPCE by broad groups of food items separately for each land possessed class in rural areas and by State/UT Rural
average per capita consumption expenditure (Rs) per 30 days on
size of land possessed (hectares) cereals gram
cereal substi- tutes
pulses &
products
milk &
milk products
edibile oil
meat, egg &
fish
vegeta- bles
fruits (fresh)
fruits (dry)
sugar salt spices
beve- rages,
refresh- ments etc,
food total
(1) (2) (3) (4) (5) (6) (7) (8) (9) (10) (11) (12) (13) (14) (15) (16) Dadra & Nagar Haveli < 0.01 87.51 0.79 0.00 24.12 102.19 24.01 12.49 31.69 22.95 7.78 12.67 1.50 23.33 605.39 956.42 0.01-0.40 104.17 0.50 0.00 30.19 19.70 26.45 17.24 44.32 6.82 0.62 7.58 0.99 15.47 55.04 329.09 0.41-1.00 107.89 0.41 0.00 30.68 12.44 22.97 21.45 36.27 4.14 0.37 6.86 0.92 13.05 17.60 275.07 1.01-2.00 103.53 0.01 0.00 35.85 15.09 17.85 28.31 29.48 6.04 0.20 6.41 0.79 12.33 13.41 269.29 2.01-4.00 96.00 0.00 0.00 31.00 21.51 17.69 18.90 27.90 7.72 0.34 6.38 0.62 15.44 11.86 255.36 4.01+ 121.60 0.00 0.00 18.60 90.00 23.60 25.60 50.80 0.00 0.00 13.00 0.60 15.20 11.80 370.80 all sizes 104.48 0.40 0.00 30.70 21.53 23.32 20.31 37.34 6.58 0.94 7.42 0.96 14.48 68.77 337.24 Daman & Diu < 0.01 151.93 0.45 0.00 35.67 69.36 48.06 47.04 57.03 16.29 5.09 15.45 1.04 35.52 119.21 602.15 0.01-0.40 129.29 0.93 0.00 32.58 51.58 34.78 41.14 45.17 15.69 1.84 11.63 1.25 24.59 97.77 488.23 0.41-1.00 125.94 0.32 0.00 31.12 60.79 36.79 53.36 42.57 14.35 3.05 12.42 1.19 25.09 38.20 445.20 1.01-2.00 121.27 0.00 0.00 35.18 66.29 30.99 35.87 43.96 10.69 2.86 10.52 1.06 23.96 61.46 444.09 2.01-4.00 176.94 0.00 0.00 29.28 88.09 35.43 71.46 40.27 26.83 3.49 12.93 1.19 24.61 65.46 575.97 4.01+ 0.00 0.00 0.00 0.00 0.00 0.00 0.00 0.00 0.00 0.00 0.00 0.00 0.00 0.00 0.00 all sizes 129.87 0.74 0.00 32.56 55.15 35.56 43.64 45.13 15.36 2.27 11.90 1.22 25.14 86.08 484.62 Delhi < 0.01 68.13 1.33 0.00 22.43 112.36 22.74 8.59 46.79 17.38 1.22 13.35 1.66 19.80 41.79 377.58 0.01-0.40 73.15 3.30 0.00 27.07 162.68 23.94 6.03 59.52 27.26 1.84 15.83 1.14 14.05 39.10 454.92 0.41-1.00 83.65 2.47 0.00 19.17 205.06 24.39 0.00 42.20 26.03 1.41 18.48 1.20 13.54 40.42 478.02 1.01-2.00 80.80 4.03 0.00 28.92 321.94 23.73 12.24 61.59 25.79 11.05 18.80 1.28 12.87 54.63 657.68 2.01-4.00 108.80 4.00 0.00 28.80 240.00 20.00 0.00 47.40 54.80 0.00 43.10 1.20 15.40 95.00 658.50 4.01+ 65.99 2.24 0.00 25.70 408.77 13.98 30.00 54.84 83.31 10.79 21.39 1.23 31.65 119.52 869.39 all sizes 70.01 1.91 0.00 23.68 133.02 23.08 7.96 50.22 20.29 1.69 14.22 1.52 18.11 41.65 407.35
(Contd.)

Appendix Tables
NSS Report No.472: Differences in Level of Consumption among Socio-Economic Groups,1999-2000 A-221
Table 9R: Break-up of MPCE by broad groups of food items separately for each land possessed class in rural areas and by State/UT Rural
average per capita consumption expenditure (Rs) per 30 days on
size of land possessed (hectares) cereals gram
cereal substi- tutes
pulses &
products
milk &
milk products
edibile oil
meat, egg &
fish
vegeta- bles
fruits (fresh)
fruits (dry)
sugar salt spices
beve- rages,
refresh- ments etc,
food total
(1) (2) (3) (4) (5) (6) (7) (8) (9) (10) (11) (12) (13) (14) (15) (16) Lakshadweep < 0.01 89.74 1.06 0.00 14.20 6.36 28.50 85.49 54.13 51.07 2.98 23.58 1.79 28.05 74.04 460.96 0.01-0.40 112.35 3.01 0.00 10.84 30.01 30.60 109.28 35.39 57.25 3.04 32.67 1.42 23.69 96.37 545.92 0.41-1.00 124.60 0.00 0.00 21.20 36.00 56.00 68.00 30.00 43.20 0.00 74.00 1.60 48.40 112.00 615.00 1.01-2.00 0.00 0.00 0.00 0.00 0.00 0.00 0.00 0.00 0.00 0.00 0.00 0.00 0.00 0.00 0.00 2.01-4.00 131.33 10.00 0.00 9.33 33.00 27.00 85.42 42.17 80.00 0.00 28.67 3.00 23.25 106.67 579.83 4.01+ 0.00 0.00 0.00 0.00 0.00 0.00 0.00 0.00 0.00 0.00 0.00 0.00 0.00 0.00 0.00 all sizes 112.03 3.08 0.00 10.95 29.30 30.54 107.86 36.14 57.47 2.97 32.42 1.47 23.91 95.89 544.02 Pondicherry < 0.01 82.59 2.72 0.29 17.64 15.14 9.88 24.88 30.23 5.65 1.07 4.10 1.50 20.88 60.71 277.30 0.01-0.40 102.36 1.42 0.04 21.95 26.33 14.82 36.15 34.81 11.03 0.91 6.37 1.59 22.95 41.60 322.34 0.41-1.00 136.13 3.61 0.00 28.10 52.75 18.01 74.11 42.66 23.74 2.82 10.60 1.60 26.26 43.08 463.47 1.01-2.00 114.67 3.26 0.01 29.30 55.54 15.24 32.88 50.67 24.47 4.76 10.99 1.95 31.05 35.18 409.97 2.01-4.00 182.12 2.92 0.00 34.99 51.94 25.17 64.93 39.66 25.81 1.89 10.05 1.49 26.16 42.96 510.09 4.01+ 184.53 1.82 0.34 49.11 76.44 27.90 38.05 45.92 16.70 1.37 16.90 1.45 26.36 34.74 521.63 all sizes 106.63 1.69 0.05 22.99 29.62 15.21 38.66 35.88 12.41 1.18 6.90 1.59 23.44 42.04 338.30 all-India < 0.01 95.31 0.74 0.41 19.04 35.74 19.34 13.95 31.67 6.39 1.62 11.12 1.10 13.83 31.98 282.22 0.01-0.40 107.78 0.59 0.38 16.82 30.92 17.43 18.64 30.29 6.98 1.14 10.12 1.11 13.75 21.26 277.22 0.41-1.00 110.67 0.59 0.28 18.49 40.70 17.86 15.89 29.99 6.31 1.29 10.84 1.09 12.39 16.68 283.07 1.01-2.00 109.38 0.64 0.31 20.09 51.59 18.24 13.89 29.32 6.70 1.65 12.56 1.04 12.14 17.18 294.73 2.01-4.00 107.58 0.71 0.39 21.74 66.08 19.68 12.54 29.12 7.33 2.23 15.11 1.03 14.42 19.62 317.59 4.01+ 106.14 0.96 0.43 22.86 92.70 21.43 9.73 28.66 8.45 3.08 18.48 1.04 13.59 23.19 350.75 all sizes 107.75 0.64 0.36 18.50 42.56 18.16 16.14 29.98 6.89 1.47 11.57 1.09 13.32 20.38 288.80

Appendix Tables
NSS Report No.472: Differences in Level of Consumption among Socio-Economic Groups,1999-2000 A-224
Table 10R: Break-up of MPCE by broad groups of non-food items for each household type in rural areas and by State/UT Rural
average per capita consumption expenditure (Rs) per 30 days on
size of land possessed (hectares)
pan, tobacco &
intoxicants
fuel &
light
clothing
footwear
misc. goods &
services
durable goods
non food total
all
clothing (second hand)
durable (second hand)
no. of sample hhs reporting consumption
(1) (17) (18) (19) (20) (21) (22) (23) (24) (25) (26) (27) Andhra Pradesh <0.01 15.23 35.23 29.55 2.82 81.82 4.64 169.29 441.19 0.12 0.09 235 0.01-0.40 17.07 29.99 25.39 2.71 87.51 6.17 168.83 439.16 0.06 0.03 2656 0.41-1.00 20.21 27.27 27.20 3.03 84.29 5.13 167.12 429.74 0.06 0.00 914 1.00-2.00 24.17 28.03 32.28 3.65 90.52 6.66 185.31 458.97 0.12 0.89 581 2.01-4.00 24.02 30.04 39.27 4.21 98.37 14.08 210.00 505.16 0.06 0.05 433 4.01+ 21.68 35.32 49.89 5.65 155.48 25.08 293.10 637.67 0.04 0.08 362 all sizes 19.26 29.64 28.94 3.14 90.75 7.42 179.16 453.61 0.07 0.13 5181 Arunachal Pradesh <0.01 46.66 71.08 47.57 11.03 141.13 9.32 326.79 735.96 0.00 0.00 110 0.01-0.40 68.87 112.98 32.04 8.10 88.13 41.04 351.16 811.08 0.46 0.00 138 0.41-1.00 54.50 111.73 27.48 6.08 144.47 16.40 360.66 713.66 0.13 0.00 151 1.00-2.00 53.22 70.52 22.11 4.95 65.08 13.28 229.16 572.32 0.13 0.01 157 2.01-4.00 54.43 68.30 21.17 5.71 75.22 27.71 252.54 578.68 0.12 0.67 146 4.01+ 42.92 47.10 17.59 4.22 60.48 8.23 180.54 459.03 0.00 0.00 125 all sizes 54.30 83.50 26.95 6.43 96.38 20.22 287.78 648.00 0.15 0.13 827 Assam <0.01 10.63 26.69 19.25 2.81 35.41 8.59 103.38 324.81 0.00 0.00 119 0.01-0.40 18.87 29.89 25.53 4.12 45.30 6.78 130.49 393.93 0.20 0.02 1630 0.41-1.00 17.93 32.90 26.57 4.22 49.11 7.87 138.60 439.55 0.10 0.01 765 1.00-2.00 19.11 28.66 26.66 4.50 60.14 9.81 148.88 466.53 0.01 0.03 643 2.01-4.00 22.31 29.32 29.17 5.28 61.30 12.20 159.59 507.66 0.01 0.22 225 4.01+ 22.22 27.96 30.12 6.77 87.65 12.25 186.96 521.25 0.05 0.00 80 all sizes 18.76 30.16 26.12 4.30 50.46 8.12 137.92 426.13 0.12 0.03 3462
(Contd.)

Appendix Tables
NSS Report No.472: Differences in Level of Consumption among Socio-Economic Groups,1999-2000 A-225
Table 10R: Break-up of MPCE by broad groups of non-food items for each household type in rural areas and by State/UT Rural
average per capita consumption expenditure (Rs) per 30 days on
size of land possessed (hectares)
pan, tobacco &
intoxicants
fuel &
light
clothing
footwear
misc. goods &
services
durable goods
non food total
all
clothing (second hand)
durable (second hand)
no. of sample hhs reporting consumption
(1) (17) (18) (19) (20) (21) (22) (23) (24) (25) (26) (27) Bihar <0.01 7.58 28.57 21.97 1.89 47.89 4.44 112.33 332.54 0.12 0.00 767 0.01-0.40 7.69 28.46 23.94 2.45 53.50 6.62 122.66 365.55 0.06 0.01 3901 0.41-1.00 8.10 28.21 27.18 3.34 60.25 7.66 134.73 404.93 0.03 0.02 1265 1.00-2.00 7.95 28.37 27.22 3.41 62.04 7.06 136.06 419.02 0.04 0.01 740 2.01-4.00 9.09 29.47 33.29 4.51 79.75 10.24 166.34 481.91 0.02 0.06 331 4.01+ 10.89 32.08 41.22 6.40 94.54 19.03 204.17 558.15 0.02 0.03 307 all sizes 7.91 28.53 25.51 2.84 57.24 7.07 129.10 385.09 0.06 0.02 7311 Goa <0.01 35.15 64.82 56.58 11.84 300.69 19.72 488.80 1096.07 0.00 0.00 18 0.01-0.40 33.10 55.13 48.46 9.93 228.42 31.85 406.90 868.72 0.02 1.90 152 0.41-1.00 15.93 44.04 40.13 7.78 156.76 14.10 278.73 749.89 0.00 0.00 16 1.00-2.00 55.91 45.20 47.16 8.36 245.29 10.87 412.79 1025.51 0.00 0.00 5 2.01-4.00 3.50 46.22 21.46 1.92 45.99 0.68 119.77 396.35 0.00 0.00 1 4.01+ 0.00 0.00 0.00 0.00 0.00 0.00 0.00 0.00 0.00 0.00 0 all sizes 31.98 54.58 47.86 9.72 224.86 28.92 397.92 868.77 0.02 1.58 192 Gujarat <0.01 12.62 37.27 32.73 5.42 105.50 11.91 205.44 505.44 1.54 0.57 301 0.01-0.40 14.39 40.05 32.94 5.64 91.88 12.28 197.18 499.55 1.04 0.27 980 0.41-1.00 13.80 39.98 33.33 6.10 112.52 11.62 217.34 530.99 0.67 0.10 343 1.00-2.00 13.48 40.36 37.25 6.59 109.66 17.29 224.63 569.54 0.46 0.98 316 2.01-4.00 15.58 45.09 42.10 7.64 121.91 23.59 255.92 649.01 0.41 0.69 264 4.01+ 15.30 48.44 52.17 9.24 156.13 33.92 315.21 739.80 0.23 0.00 275 all sizes 14.18 41.04 36.24 6.34 107.80 15.93 221.52 551.33 0.82 0.39 2479
(Contd.)

Appendix Tables
NSS Report No.472: Differences in Level of Consumption among Socio-Economic Groups,1999-2000 A-226
Table 10R: Break-up of MPCE by broad groups of non-food items for each household type in rural areas and by State/UT Rural
average per capita consumption expenditure (Rs) per 30 days on
size of land possessed (hectares)
pan, tobacco &
intoxicants
fuel &
light
clothing
footwear
misc. goods &
services
durable goods
non food total
all
clothing (second hand)
durable (second hand)
no. of sample hhs reporting consumption
(1) (17) (18) (19) (20) (21) (22) (23) (24) (25) (26) (27) Haryana <0.01 13.20 62.26 38.38 8.05 112.22 7.79 241.90 621.35 3.57 4.81 55 0.01-0.40 17.61 56.47 42.56 11.84 146.52 8.86 283.87 631.88 0.06 0.33 505 0.41-1.00 16.19 67.54 51.97 12.89 218.98 12.22 379.79 807.27 0.00 0.00 141 1.00-2.00 16.73 68.29 48.70 13.56 139.95 9.11 296.34 740.00 0.00 0.08 139 2.01-4.00 17.53 65.50 55.34 15.13 190.57 22.77 366.84 809.31 0.00 0.24 157 4.01+ 18.79 63.17 59.85 15.18 231.21 18.03 406.23 896.18 0.00 0.26 135 all sizes 17.27 61.26 47.62 12.78 166.89 12.01 317.83 714.38 0.18 0.43 1132 Himachal Pradesh <0.01 19.87 48.43 66.15 20.30 264.19 20.31 439.26 934.09 1.30 0.00 61 0.01-0.40 16.74 51.69 46.54 14.82 150.00 14.74 294.53 671.01 0.37 0.06 830 0.41-1.00 17.50 50.33 49.73 16.23 130.26 18.27 282.33 666.72 0.22 0.16 429 1.00-2.00 15.39 49.17 55.72 18.28 146.23 27.80 312.59 701.70 0.09 0.00 200 2.01-4.00 15.23 42.34 49.93 19.31 179.87 41.20 347.87 728.98 0.14 0.00 88 4.01+ 13.01 51.22 66.83 21.45 178.49 18.31 349.31 724.21 0.48 0.00 26 all sizes 16.67 50.38 49.75 16.20 149.02 19.16 301.17 684.50 0.30 0.07 1634 Jammu & Kashmir <0.01 21.17 37.55 51.21 15.03 124.21 11.37 260.54 619.73 0.00 0.00 18 0.01-0.40 13.15 40.98 42.66 11.43 128.86 25.24 262.32 682.76 0.02 0.22 597 0.41-1.00 15.16 45.07 48.35 12.99 112.71 23.99 258.28 702.37 0.01 0.00 573 1.00-2.00 17.48 46.94 40.46 10.55 107.17 25.46 248.05 671.14 0.12 0.00 194 2.01-4.00 36.62 43.65 42.80 12.22 128.08 18.72 282.09 684.48 0.06 0.00 74 4.01+ 20.27 25.43 29.56 10.76 67.22 14.92 168.18 525.85 0.00 0.00 16 all sizes 16.70 42.56 43.55 11.88 115.36 23.64 253.68 677.60 0.03 0.07 1472
(Contd.)

Appendix Tables
NSS Report No.472: Differences in Level of Consumption among Socio-Economic Groups,1999-2000 A-227
Table 10R: Break-up of MPCE by broad groups of non-food items for each household type in rural areas and by State/UT Rural
average per capita consumption expenditure (Rs) per 30 days on
size of land possessed (hectares)
pan, tobacco &
intoxicants
fuel &
light
clothing
footwear
misc. goods &
services
durable goods
non food total
all
clothing (second hand)
durable (second hand)
no. of sample hhs reporting consumption
(1) (17) (18) (19) (20) (21) (22) (23) (24) (25) (26) (27) Karnataka <0.01 23.73 42.11 29.56 4.53 127.75 1.99 229.67 518.15 0.00 0.00 102 0.01-0.40 21.12 38.35 34.41 4.18 99.69 7.91 205.67 496.44 0.09 0.05 1081 0.41-1.00 16.50 34.36 33.62 3.72 86.47 9.11 183.79 462.21 0.05 0.05 502 1.00-2.00 16.04 34.01 36.64 4.09 94.02 11.74 196.54 492.16 0.03 0.03 419 2.01-4.00 17.66 33.46 41.72 4.60 97.67 22.84 217.94 531.05 0.01 0.00 321 4.01+ 14.32 33.51 43.57 5.04 105.31 26.83 228.57 550.19 0.00 0.03 338 all sizes 18.23 35.77 36.41 4.23 97.31 12.59 204.53 499.78 0.05 0.04 2763 Kerala <0.01 35.59 71.81 52.55 10.95 384.81 45.32 601.04 1101.06 0.00 2.14 46 0.01-0.40 20.33 44.25 39.43 5.56 172.11 43.80 325.49 720.27 0.07 3.27 1996 0.41-1.00 12.31 50.53 52.88 7.41 242.48 101.59 467.20 928.40 0.06 3.72 318 1.00-2.00 12.20 53.60 55.56 8.10 229.33 67.87 426.65 927.64 0.08 1.73 164 2.01-4.00 13.41 53.58 69.34 8.62 312.24 87.15 544.35 1057.90 0.00 0.00 62 4.01+ 30.34 75.10 153.31 31.39 684.69 243.65 1218.47 1969.34 0.00 0.00 18 all sizes 19.11 45.90 42.62 6.06 188.32 52.51 354.51 765.71 0.07 3.17 2604 Madhya Pradesh <0.01 14.17 35.66 29.77 4.83 83.29 8.83 176.54 402.59 0.23 0.21 349 0.01-0.40 13.21 32.89 29.17 4.31 71.00 8.02 158.59 371.52 0.12 0.06 1307 0.41-1.00 11.61 33.76 27.61 3.68 60.44 8.03 145.13 363.30 0.12 0.04 952 1.00-2.00 12.74 32.95 28.95 4.15 65.50 9.98 154.26 387.22 0.05 0.11 914 2.01-4.00 12.58 32.92 32.04 4.65 74.59 11.84 168.63 412.86 0.05 0.02 835 4.01+ 17.34 36.84 39.41 6.57 122.37 22.25 244.78 531.40 0.03 0.12 787 all sizes 13.24 33.69 30.61 4.52 75.35 10.86 168.27 401.50 0.09 0.07 5144
(Contd.)

Appendix Tables
NSS Report No.472: Differences in Level of Consumption among Socio-Economic Groups,1999-2000 A-228
Table 10R: Break-up of MPCE by broad groups of non-food items for each household type in rural areas and by State/UT Rural
average per capita consumption expenditure (Rs) per 30 days on
size of land possessed (hectares)
pan, tobacco &
intoxicants
fuel &
light
clothing
footwear
misc. goods &
services
durable goods
non food total
all
clothing (second hand)
durable (second hand)
no. of sample hhs reporting consumption
(1) (17) (18) (19) (20) (21) (22) (23) (24) (25) (26) (27) Maharashtra <0.01 13.30 38.11 42.67 7.23 161.41 7.35 270.06 565.29 0.12 0.01 390 0.01-0.40 11.57 38.65 34.83 4.96 115.77 11.99 217.76 481.81 0.14 0.01 1547 0.41-1.00 10.71 35.61 35.12 4.76 104.87 13.88 204.95 466.52 0.34 0.08 629 1.00-2.00 10.70 33.53 36.51 5.01 116.66 13.18 215.58 484.60 0.04 0.10 603 2.01-4.00 10.04 33.76 37.91 5.66 117.53 13.55 218.45 492.79 0.02 0.47 508 4.01+ 12.52 35.90 48.58 6.49 140.58 27.00 271.08 570.99 0.01 0.08 444 all sizes 11.35 36.45 37.43 5.38 121.02 13.37 224.99 496.77 0.13 0.10 4121 Manipur <0.01 29.14 34.48 37.54 14.47 162.45 0.84 278.93 620.14 0.00 0.00 7 0.01-0.40 17.59 54.89 25.34 7.94 95.80 14.89 216.46 571.61 0.18 1.68 282 0.41-1.00 14.67 50.96 23.07 7.68 76.09 13.38 185.84 522.08 0.35 0.05 238 1.00-2.00 15.34 48.95 20.13 6.71 77.94 14.04 183.12 505.75 0.03 0.15 148 2.01-4.00 16.54 41.32 22.62 8.27 79.54 15.24 183.53 501.64 0.09 0.00 53 4.01+ 11.24 63.06 28.91 9.53 117.13 9.96 239.84 536.61 0.00 0.00 10 all sizes 16.18 51.40 23.50 7.70 85.49 14.10 198.36 537.80 0.19 0.71 738 Meghalaya <0.01 65.80 50.07 33.92 11.28 132.17 5.09 298.33 671.63 5.61 0.00 39 0.01-0.40 54.03 35.49 32.42 8.48 81.57 9.39 221.38 543.20 5.42 0.00 191 0.41-1.00 40.84 26.60 37.87 6.61 74.77 10.52 197.21 527.42 6.59 0.00 324 1.00-2.00 47.01 32.27 41.33 8.96 87.25 13.73 230.55 581.62 4.51 0.39 235 2.01-4.00 59.24 33.12 39.60 9.64 84.83 15.99 242.41 596.00 5.05 0.00 125 4.01+ 68.14 34.35 39.74 10.03 85.57 12.11 249.95 634.78 3.73 0.00 19 all sizes 49.40 31.95 37.90 8.33 83.48 11.84 222.90 563.41 5.46 0.11 933
(Contd.)

Appendix Tables
NSS Report No.472: Differences in Level of Consumption among Socio-Economic Groups,1999-2000 A-229
Table 10R: Break-up of MPCE by broad groups of non-food items for each household type in rural areas and by State/UT Rural
average per capita consumption expenditure (Rs) per 30 days on
size of land possessed (hectares)
pan, tobacco &
intoxicants
fuel &
light
clothing
footwear
misc. goods &
services
durable goods
non food total
all
clothing (second hand)
durable (second hand)
no. of sample hhs reporting consumption
(1) (17) (18) (19) (20) (21) (22) (23) (24) (25) (26) (27) Mizoram <0.01 133.96 68.72 47.47 18.85 237.83 38.14 544.97 1256.96 0.64 0.00 6 0.01-0.40 44.44 75.77 48.74 23.45 142.13 24.99 359.52 852.13 0.05 0.11 85 0.41-1.00 38.42 73.72 36.84 19.15 91.45 11.19 270.76 698.79 0.24 0.00 186 1.00-2.00 37.82 59.10 42.33 19.90 101.12 9.53 269.80 662.24 0.00 0.00 99 2.01-4.00 38.36 63.67 56.89 22.48 126.53 18.15 326.08 744.00 0.00 0.55 47 4.01+ 47.90 93.95 63.89 21.88 69.22 1.02 297.85 843.90 0.00 0.00 5 all sizes 39.71 68.49 43.56 20.53 107.33 13.76 293.38 721.84 0.11 0.10 428 Nagaland <0.01 44.00 43.21 133.74 26.34 414.89 13.60 675.77 1503.60 3.28 0.00 6 0.01-0.40 45.34 67.36 57.63 15.70 173.80 10.00 369.82 910.72 3.56 0.00 51 0.41-1.00 28.30 70.37 57.07 17.63 192.31 13.98 379.66 963.35 5.21 0.00 56 1.00-2.00 25.07 73.82 55.44 16.68 168.23 9.37 348.61 890.32 4.91 0.00 112 2.01-4.00 23.84 79.59 60.21 18.14 200.24 13.92 395.93 947.15 6.69 0.00 183 4.01+ 20.20 73.22 78.50 21.69 229.43 28.36 451.39 1025.74 5.72 0.00 72 all sizes 26.48 75.04 60.67 17.90 192.47 14.07 386.62 941.31 5.64 0.00 480 Orissa <0.01 13.45 38.88 37.45 5.84 160.66 12.34 268.62 600.66 0.05 0.00 56 0.01-0.40 10.09 30.26 23.12 1.84 49.98 11.78 127.07 360.77 0.03 0.01 1825 0.41-1.00 9.53 28.02 24.05 1.77 54.35 11.71 129.44 361.27 0.01 0.03 835 1.00-2.00 10.94 31.49 26.81 2.44 61.92 14.54 148.15 402.71 0.00 0.04 430 2.01-4.00 8.96 30.33 26.41 2.39 59.74 12.18 140.01 390.41 0.02 0.00 208 4.01+ 9.24 29.40 32.87 3.07 81.26 17.63 173.48 453.72 0.02 0.00 123 all sizes 9.98 29.88 24.48 2.01 55.25 12.32 133.92 373.17 0.02 0.02 3477
(Contd.)

Appendix Tables
NSS Report No.472: Differences in Level of Consumption among Socio-Economic Groups,1999-2000 A-230
Table 10R: Break-up of MPCE by broad groups of non-food items for each household type in rural areas and by State/UT Rural
average per capita consumption expenditure (Rs) per 30 days on
size of land possessed (hectares)
pan, tobacco &
intoxicants
fuel &
light
clothing
footwear
misc. goods &
services
durable goods
non food total
all
clothing (second hand)
durable (second hand)
no. of sample hhs reporting consumption
(1) (17) (18) (19) (20) (21) (22) (23) (24) (25) (26) (27) Punjab <0.01 13.46 63.95 43.98 9.43 168.96 17.20 316.98 661.11 0.13 0.89 176 0.01-0.40 14.28 70.88 41.80 10.34 148.40 12.90 298.61 628.24 0.15 0.10 1090 0.41-1.00 14.96 78.45 55.93 13.84 189.51 29.07 381.75 827.74 0.00 0.03 188 1.00-2.00 11.55 78.89 54.84 14.85 187.69 22.89 370.71 811.71 0.00 0.00 187 2.01-4.00 15.16 79.89 62.46 15.57 239.37 43.82 456.27 971.39 0.02 18.43 229 4.01+ 22.61 84.13 71.90 18.51 290.96 32.29 520.39 1008.13 0.03 0.30 282 all sizes 15.00 74.17 49.85 12.43 182.10 21.00 354.55 742.82 0.09 2.14 2152 Rajasthan <0.01 22.41 45.53 37.84 7.10 96.27 11.08 220.24 493.09 0.02 0.21 57 0.01-0.40 18.35 47.11 37.90 8.00 97.57 12.72 221.65 528.01 0.12 0.02 876 0.41-1.00 17.40 48.91 37.20 7.33 83.71 13.79 208.34 501.78 0.01 0.99 577 1.00-2.00 17.18 47.38 38.70 8.10 88.62 13.48 213.46 533.68 0.01 1.64 534 2.01-4.00 18.70 48.93 40.98 9.06 95.87 12.96 226.50 576.98 0.05 0.09 490 4.01+ 18.35 46.98 40.55 10.29 107.31 15.02 238.50 605.47 0.02 0.12 695 all sizes 18.08 47.73 39.00 8.57 95.33 13.58 222.28 548.88 0.05 0.52 3229 Sikkim <0.01 22.06 43.98 60.50 16.49 215.93 3.27 362.24 758.41 1.03 0.00 175 0.01-0.40 27.52 49.02 44.05 12.07 118.48 4.47 255.61 568.94 2.08 0.00 252 0.41-1.00 42.44 40.79 39.76 11.46 53.85 3.90 192.19 460.00 2.50 0.01 334 1.00-2.00 27.49 38.97 39.57 10.50 59.40 8.86 184.80 475.39 1.26 0.01 175 2.01-4.00 37.86 40.27 41.61 10.35 68.46 11.86 210.42 494.10 2.80 0.00 87 4.01+ 45.40 39.21 46.58 13.32 96.54 16.67 257.72 593.11 0.67 0.00 33 all sizes 33.05 42.77 43.60 11.99 92.69 5.86 229.97 531.85 1.96 0.01 1056
(Contd.)

Appendix Tables
NSS Report No.472: Differences in Level of Consumption among Socio-Economic Groups,1999-2000 A-231
Table 10R: Break-up of MPCE by broad groups of non-food items for each household type in rural areas and by State/UT Rural
average per capita consumption expenditure (Rs) per 30 days on
size of land possessed (hectares)
pan, tobacco &
intoxicants
fuel &
light
clothing
footwear
misc. goods &
services
durable goods
non food total
all
clothing (second hand)
durable (second hand)
no. of sample hhs reporting consumption
(1) (17) (18) (19) (20) (21) (22) (23) (24) (25) (26) (27) Tamil Nadu <0.01 18.24 36.23 30.98 2.89 132.38 8.95 229.66 547.02 0.02 0.82 356 0.01-0.40 18.91 35.13 27.65 3.05 110.35 10.98 206.07 501.54 0.03 0.05 2540 0.41-1.00 14.33 31.73 30.97 3.17 104.91 15.37 200.49 488.18 0.02 0.25 630 1.00-2.00 9.44 31.84 33.11 3.53 117.08 11.61 206.61 530.14 0.00 0.00 296 2.01-4.00 11.14 38.07 39.86 4.40 151.38 16.98 261.84 622.91 0.00 0.78 212 4.01+ 13.83 40.94 53.80 5.60 280.58 27.47 422.21 844.90 0.10 0.06 139 all sizes 17.23 34.67 29.56 3.16 115.59 11.94 212.16 514.06 0.03 0.17 4173 Tripura <0.01 48.79 45.56 36.73 3.68 100.87 8.55 244.19 644.27 0.00 0.00 18 0.01-0.40 21.62 36.00 30.69 4.27 77.51 7.87 177.97 505.32 0.09 0.02 689 0.41-1.00 21.29 38.14 32.63 5.43 83.90 6.50 187.89 560.94 0.05 0.01 243 1.00-2.00 20.80 32.39 32.94 4.20 90.29 9.78 190.40 563.47 0.02 0.00 53 2.01-4.00 31.65 33.78 36.31 13.97 166.67 28.44 310.82 743.19 0.00 0.00 20 4.01+ 34.97 45.23 50.17 4.16 82.41 3.86 220.80 652.25 0.00 0.00 8 all sizes 22.26 36.53 31.63 4.60 81.09 7.80 183.90 528.41 0.08 0.02 1031 Uttar Pradesh <0.01 14.02 39.66 32.03 5.31 108.24 10.03 209.28 475.99 0.19 1.04 437 0.01-0.40 11.61 33.65 31.52 4.80 87.24 10.16 178.98 424.54 0.15 0.10 4280 0.41-1.00 11.68 34.55 33.94 5.33 91.22 11.47 188.20 456.20 0.08 0.10 2155 1.00-2.00 12.24 34.20 38.74 6.23 106.80 17.49 215.71 497.62 0.03 0.47 1320 2.01-4.00 13.36 35.25 43.39 7.46 126.70 25.97 252.13 579.78 0.11 2.58 820 4.01+ 17.66 38.26 54.62 9.12 161.07 43.85 324.58 681.06 0.32 0.00 420 all sizes 12.14 34.45 34.98 5.53 97.62 13.98 198.70 466.64 0.12 0.40 9432
(Contd.)

Appendix Tables
NSS Report No.472: Differences in Level of Consumption among Socio-Economic Groups,1999-2000 A-232
Table 10R: Break-up of MPCE by broad groups of non-food items for each household type in rural areas and by State/UT Rural
average per capita consumption expenditure (Rs) per 30 days on
size of land possessed (hectares)
pan, tobacco &
intoxicants
fuel &
light
clothing
footwear
misc. goods &
services
durable goods
non food total
all
clothing (second hand)
durable (second hand)
no. of sample hhs reporting consumption
(1) (17) (18) (19) (20) (21) (22) (23) (24) (25) (26) (27) West Bengal <0.01 15.56 40.12 29.59 3.37 66.35 5.62 160.61 467.96 0.00 0.00 231 0.01-0.40 10.78 35.69 28.68 7.88 60.16 4.82 148.01 435.39 0.13 0.04 2955 0.41-1.00 10.14 37.16 34.99 3.84 80.06 6.48 172.68 503.00 0.10 0.02 740 1.00-2.00 10.23 34.19 33.10 4.08 78.37 9.13 169.10 491.82 0.09 0.35 391 2.01-4.00 10.69 34.00 36.71 5.24 84.37 8.39 179.40 516.66 0.45 0.00 166 4.01+ 14.80 38.98 33.92 5.21 96.24 19.70 208.86 568.57 0.37 7.68 67 all sizes 10.83 35.95 30.32 6.68 65.87 5.63 155.27 454.80 0.12 0.10 4550 A. & N. Islands <0.01 39.05 45.34 52.54 12.62 184.12 47.08 380.75 907.03 1.61 0.00 40 0.01-0.40 37.25 48.97 52.81 12.95 162.74 37.67 352.40 865.96 0.00 0.07 110 0.41-1.00 48.62 38.95 44.38 8.14 99.26 24.70 264.06 763.72 0.00 0.44 42 1.00-2.00 39.09 34.24 37.66 9.09 88.20 17.05 225.31 633.79 0.00 4.79 43 2.01-4.00 31.07 36.09 40.11 9.18 91.30 15.55 223.29 678.53 0.00 0.00 32 4.01+ 25.00 30.25 29.29 6.96 113.81 25.55 230.85 608.03 0.00 0.00 6 all sizes 37.32 42.06 46.13 10.83 133.32 30.24 299.90 780.21 0.19 0.78 273 Chandigarh <0.01 35.54 60.69 42.29 10.15 245.18 157.22 551.07 993.11 1.81 1.63 114 0.01-0.40 18.57 53.19 42.75 11.38 202.94 14.69 343.51 733.16 1.99 0.00 52 0.41-1.00 9.01 70.63 59.63 12.67 768.28 79.58 999.81 1522.48 0.00 0.00 4 1.00-2.00 16.55 91.60 75.13 9.14 316.55 28.20 537.17 1028.72 0.00 0.00 6 2.01-4.00 137.72 39.00 45.31 9.44 277.73 173.58 682.78 1415.26 0.00 0.00 3 4.01+ 26.67 76.11 95.89 31.05 448.60 21.10 699.42 1307.66 0.00 0.00 1 all sizes 45.27 56.11 43.97 10.49 245.54 114.74 516.12 989.19 1.53 0.86 180
(Contd.)

Appendix Tables
NSS Report No.472: Differences in Level of Consumption among Socio-Economic Groups,1999-2000 A-233
Table 10R: Break-up of MPCE by broad groups of non-food items for each household type in rural areas and by State/UT Rural
average per capita consumption expenditure (Rs) per 30 days on
size of land possessed (hectares)
pan, tobacco &
intoxicants
fuel &
light
clothing
footwear
misc. goods &
services
durable goods
non food total
all
clothing (second hand)
durable (second hand)
no. of sample hhs reporting consumption
(1) (17) (18) (19) (20) (21) (22) (23) (24) (25) (26) (27) Dadra & Nagar Haveli <0.01 30.62 65.66 40.97 4.26 332.45 20.36 494.32 1450.74 0.09 0.00 14 0.01-0.40 24.13 45.06 32.63 5.40 125.99 10.53 243.74 572.83 0.00 4.04 67 0.41-1.00 36.92 37.17 25.57 3.96 70.78 6.60 181.00 456.07 0.00 0.00 78 1.00-2.00 46.25 31.82 25.58 4.93 78.39 11.84 198.82 468.11 0.62 5.63 24 2.01-4.00 50.00 31.61 23.93 4.41 69.22 4.75 183.92 439.28 2.35 0.00 8 4.01+ 52.40 25.80 39.62 5.51 41.27 27.34 191.93 562.73 0.00 0.00 1 all sizes 34.14 40.70 28.75 4.55 106.45 9.35 223.94 561.18 0.15 1.91 192 Daman & Diu <0.01 60.63 91.30 71.11 10.43 342.42 5.05 580.94 1183.09 0.00 0.00 8 0.01-0.40 32.20 56.35 52.93 7.50 239.94 25.75 414.67 902.90 0.09 0.00 134 0.41-1.00 42.24 59.50 58.94 7.55 183.65 26.86 378.73 823.93 0.00 0.00 30 1.00-2.00 34.31 55.72 60.56 9.71 229.08 18.46 407.84 851.93 0.00 0.00 6 2.01-4.00 98.97 50.11 67.61 13.09 278.73 22.88 531.39 1107.36 0.00 0.00 2 4.01+ 0.00 0.00 0.00 0.00 0.00 0.00 0.00 0.00 0.00 0.00 0 all sizes 36.12 58.39 55.36 7.82 234.57 24.61 416.86 901.48 0.06 0.00 180 Delhi <0.01 38.41 56.38 56.30 16.40 312.84 33.60 513.93 891.52 0.01 0.00 84 0.01-0.40 5.72 64.71 49.89 14.30 351.86 14.81 501.28 956.20 0.24 1.16 77 0.41-1.00 12.99 65.15 53.52 14.67 298.78 12.19 457.29 935.31 0.00 0.00 10 1.00-2.00 10.58 65.43 59.17 16.03 288.69 25.67 465.57 1123.25 0.00 7.70 11 2.01-4.00 0.00 84.00 184.11 31.23 997.17 172.60 1469.12 2127.62 0.00 0.00 1 4.01+ 262.80 96.69 115.21 35.37 701.47 117.16 1328.70 2198.09 0.00 0.00 4 all sizes 29.65 58.89 54.91 15.88 321.93 28.60 509.86 917.21 0.06 0.51 187
(Contd.)

Appendix Tables
NSS Report No.472: Differences in Level of Consumption among Socio-Economic Groups,1999-2000 A-234
Table 10R: Break-up of MPCE by broad groups of non-food items for each household type in rural areas and by State/UT Rural
average per capita consumption expenditure (Rs) per 30 days on
size of land possessed (hectares)
pan, tobacco &
intoxicants
fuel &
light
clothing
footwear
misc. goods &
services
durable goods
non food total
all
clothing (second hand)
durable (second hand)
no. of sample hhs reporting consumption
(1) (17) (18) (19) (20) (21) (22) (23) (24) (25) (26) (27) Lakshadweep <0.01 6.18 42.05 56.56 7.74 279.10 3.43 395.06 856.02 0.00 0.00 9 0.01-0.40 28.46 66.56 46.93 8.11 138.25 32.78 321.10 867.02 0.00 0.00 73 0.41-1.00 94.00 71.40 71.84 16.44 300.38 180.82 734.88 1349.88 0.00 0.00 1 1.00-2.00 0.00 0.00 0.00 0.00 0.00 0.00 0.00 0.00 0.00 0.00 0 2.01-4.00 25.00 51.67 98.08 8.22 241.92 246.58 671.46 1251.30 0.00 0.00 1 4.01+ 0.00 0.00 0.00 0.00 0.00 0.00 0.00 0.00 0.00 0.00 0 all sizes 27.86 65.46 48.39 8.13 145.63 36.70 332.17 876.19 0.00 0.00 84 Pondicherry <0.01 68.68 28.92 30.52 2.19 79.44 5.44 215.19 492.49 0.00 0.32 15 0.01-0.40 22.16 41.16 33.77 3.84 126.24 12.03 239.21 561.55 0.00 0.00 219 0.41-1.00 16.53 44.48 51.87 7.81 186.30 26.58 333.57 797.04 0.00 0.00 22 1.00-2.00 5.33 50.54 66.86 8.22 302.87 36.00 469.82 879.79 0.00 0.00 12 2.01-4.00 30.84 41.88 71.29 10.59 331.46 130.17 616.22 1126.31 0.00 0.00 10 4.01+ 4.89 44.32 49.03 5.19 252.23 15.98 371.64 893.27 0.00 0.00 10 all sizes 22.69 41.32 36.65 4.31 138.91 15.46 259.33 597.63 0.00 0.01 288 all-India <0.01 15.17 38.51 33.17 5.34 116.02 9.69 217.90 500.12 0.30 0.38 4419 0.01-0.40 13.74 36.17 30.41 4.98 89.08 10.77 185.14 462.37 0.14 0.24 33168 0.41-1.00 13.06 35.44 32.60 4.84 87.70 12.07 185.72 468.79 0.13 0.17 13691 1.00-2.00 13.70 35.62 34.84 5.47 93.55 13.35 196.53 491.27 0.08 0.39 9157 2.01-4.00 14.92 37.80 39.26 6.54 107.92 17.94 224.39 541.98 0.12 1.07 6142 4.01+ 16.89 42.02 46.24 8.42 138.51 25.00 277.07 627.82 0.08 0.15 4808 all sizes 13.96 36.56 33.28 5.37 95.42 12.76 197.36 486.16 0.14 0.32 71385
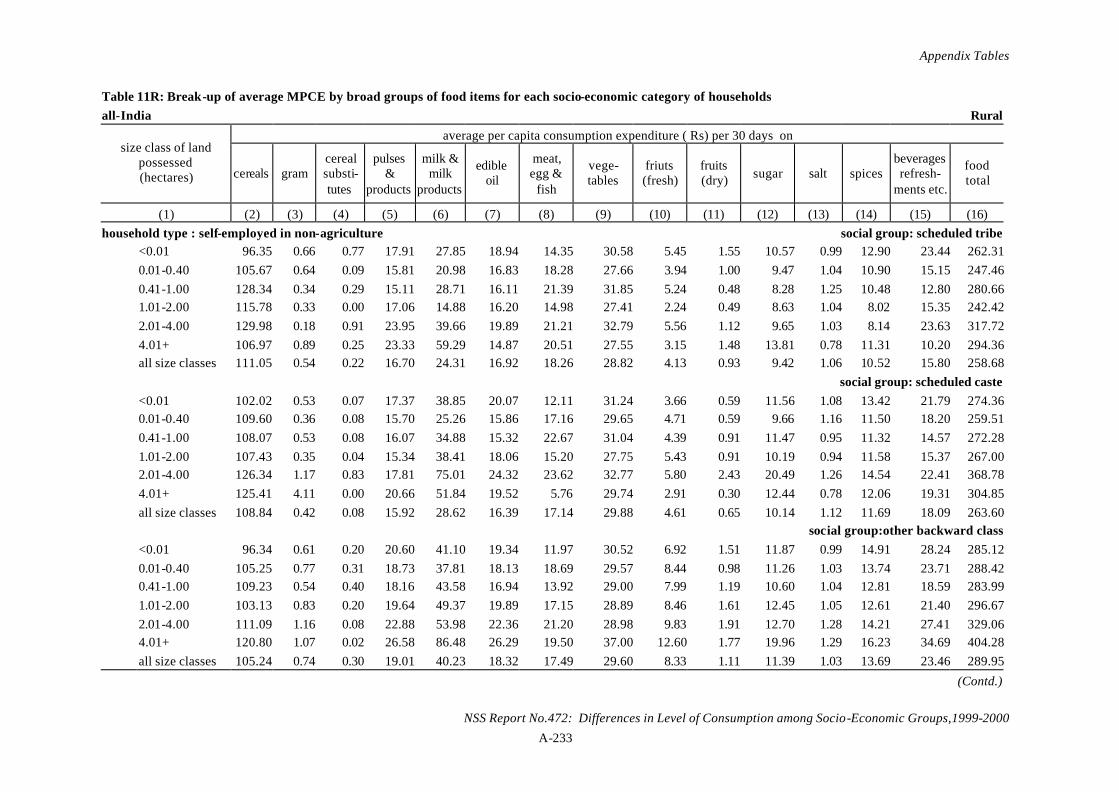
Appendix Tables
NSS Report No.472: Differences in Level of Consumption among Socio-Economic Groups,1999-2000 A-233
Table 11R: Break-up of average MPCE by broad groups of food items for each socio-economic category of households all-India Rural
average per capita consumption expenditure ( Rs) per 30 days on size class of land
possessed (hectares) cereals gram
cereal substi- tutes
pulses &
products
milk & milk
products
edible oil
meat, egg &
fish
vege- tables
friuts (fresh)
fruits (dry) sugar salt spices
beverages refresh-
ments etc.
food total
(1) (2) (3) (4) (5) (6) (7) (8) (9) (10) (11) (12) (13) (14) (15) (16) household type : self-employed in non-agriculture social group: scheduled tribe <0.01 96.35 0.66 0.77 17.91 27.85 18.94 14.35 30.58 5.45 1.55 10.57 0.99 12.90 23.44 262.31 0.01-0.40 105.67 0.64 0.09 15.81 20.98 16.83 18.28 27.66 3.94 1.00 9.47 1.04 10.90 15.15 247.46 0.41-1.00 128.34 0.34 0.29 15.11 28.71 16.11 21.39 31.85 5.24 0.48 8.28 1.25 10.48 12.80 280.66 1.01-2.00 115.78 0.33 0.00 17.06 14.88 16.20 14.98 27.41 2.24 0.49 8.63 1.04 8.02 15.35 242.42 2.01-4.00 129.98 0.18 0.91 23.95 39.66 19.89 21.21 32.79 5.56 1.12 9.65 1.03 8.14 23.63 317.72 4.01+ 106.97 0.89 0.25 23.33 59.29 14.87 20.51 27.55 3.15 1.48 13.81 0.78 11.31 10.20 294.36 all size classes 111.05 0.54 0.22 16.70 24.31 16.92 18.26 28.82 4.13 0.93 9.42 1.06 10.52 15.80 258.68 social group: scheduled caste <0.01 102.02 0.53 0.07 17.37 38.85 20.07 12.11 31.24 3.66 0.59 11.56 1.08 13.42 21.79 274.36 0.01-0.40 109.60 0.36 0.08 15.70 25.26 15.86 17.16 29.65 4.71 0.59 9.66 1.16 11.50 18.20 259.51 0.41-1.00 108.07 0.53 0.08 16.07 34.88 15.32 22.67 31.04 4.39 0.91 11.47 0.95 11.32 14.57 272.28 1.01-2.00 107.43 0.35 0.04 15.34 38.41 18.06 15.20 27.75 5.43 0.91 10.19 0.94 11.58 15.37 267.00 2.01-4.00 126.34 1.17 0.83 17.81 75.01 24.32 23.62 32.77 5.80 2.43 20.49 1.26 14.54 22.41 368.78 4.01+ 125.41 4.11 0.00 20.66 51.84 19.52 5.76 29.74 2.91 0.30 12.44 0.78 12.06 19.31 304.85 all size classes 108.84 0.42 0.08 15.92 28.62 16.39 17.14 29.88 4.61 0.65 10.14 1.12 11.69 18.09 263.60 social group:other backward class <0.01 96.34 0.61 0.20 20.60 41.10 19.34 11.97 30.52 6.92 1.51 11.87 0.99 14.91 28.24 285.12 0.01-0.40 105.25 0.77 0.31 18.73 37.81 18.13 18.69 29.57 8.44 0.98 11.26 1.03 13.74 23.71 288.42 0.41-1.00 109.23 0.54 0.40 18.16 43.58 16.94 13.92 29.00 7.99 1.19 10.60 1.04 12.81 18.59 283.99 1.01-2.00 103.13 0.83 0.20 19.64 49.37 19.89 17.15 28.89 8.46 1.61 12.45 1.05 12.61 21.40 296.67 2.01-4.00 111.09 1.16 0.08 22.88 53.98 22.36 21.20 28.98 9.83 1.91 12.70 1.28 14.21 27.41 329.06 4.01+ 120.80 1.07 0.02 26.58 86.48 26.29 19.50 37.00 12.60 1.77 19.96 1.29 16.23 34.69 404.28 all size classes 105.24 0.74 0.30 19.01 40.23 18.32 17.49 29.60 8.33 1.11 11.39 1.03 13.69 23.46 289.95
(Contd.)

Appendix Tables
NSS Report No.472: Differences in Level of Consumption among Socio-Economic Groups,1999-2000 A-234
Table 11R: Break-up of average MPCE by broad groups of food items for each socio-economic category of households all-India Rural
average per capita consumption expenditure ( Rs) per 30 days on size class of land
possessed (hectares) cereals gram
cereal substi- tutes
pulses &
products
milk & milk
products
edible oil
meat, egg &
fish
vege- tables
friuts (fresh)
fruits (dry) sugar salt spices
beverages refresh-
ments etc.
food total
(1) (2) (3) (4) (5) (6) (7) (8) (9) (10) (11) (12) (13) (14) (15) (16) household type : self-employed in non-agriculture social group: others <0.01 96.13 0.82 0.63 21.22 56.06 22.95 19.69 37.33 9.88 2.37 13.24 1.23 15.45 33.14 330.12 0.01-0.40 115.92 0.54 0.26 17.57 40.68 19.97 25.58 34.73 9.11 1.69 10.99 1.18 12.96 22.74 313.92 0.41-1.00 123.72 0.95 0.59 20.74 54.00 22.53 27.51 36.10 10.56 1.94 12.51 1.14 13.33 23.70 349.32 1.01-2.00 111.16 0.80 0.54 21.70 72.70 23.52 19.61 34.71 11.42 4.07 15.57 1.07 12.79 28.91 358.57 2.01-4.00 110.96 0.92 1.18 23.40 88.78 31.87 17.69 33.07 11.36 5.02 21.72 1.38 13.97 31.91 393.22 4.01+ 108.96 2.27 0.67 22.32 124.59 23.54 10.74 28.78 12.08 7.59 20.74 1.12 13.53 36.78 413.73 all size classes 114.98 0.66 0.38 18.69 47.63 21.08 24.67 34.98 9.57 2.06 12.01 1.18 13.22 24.40 325.52 social group: not recorded <0.01 79.06 1.97 0.00 16.46 48.49 16.35 13.77 27.11 7.57 0.00 6.79 0.75 7.79 18.03 244.13 0.01-0.40 180.99 0.00 0.00 37.12 25.45 22.89 17.14 36.10 18.77 0.00 9.50 2.37 11.21 12.58 374.13 0.41-1.00 116.91 0.95 0.00 16.74 38.94 23.74 29.69 40.25 6.01 0.00 17.91 1.34 12.64 14.09 319.21 1.01-2.00 119.77 0.00 0.00 22.44 69.91 43.95 92.22 29.14 0.76 3.06 16.28 2.35 21.10 13.82 434.78 2.01-4.00 0.00 0.00 0.00 0.00 0.00 0.00 0.00 0.00 0.00 0.00 0.00 0.00 0.00 0.00 0.00 4.01+ 108.00 0.00 0.00 20.00 36.00 11.40 26.00 26.70 7.80 0.00 6.80 1.50 9.50 8.00 261.70 all size classes 104.62 1.12 0.00 19.67 46.06 21.65 29.00 30.76 7.45 0.41 10.49 1.31 11.03 15.17 298.76 social group: all <0.01 97.29 0.68 0.33 19.92 44.87 20.59 14.58 32.80 7.10 1.57 12.12 1.08 14.58 28.05 295.54 0.01-0.40 109.85 0.61 0.24 17.63 35.73 18.27 20.75 31.31 7.78 1.15 10.79 1.11 12.93 21.99 290.13 0.41-1.00 115.22 0.67 0.41 18.60 45.18 18.66 20.48 32.01 8.21 1.37 11.31 1.07 12.65 19.48 305.33 1.01-2.00 107.88 0.69 0.27 19.40 52.19 20.59 17.88 30.52 8.31 2.22 12.78 1.04 12.10 22.31 308.19 2.01-4.00 114.02 0.96 0.70 22.86 69.14 26.39 19.84 31.41 9.78 3.22 16.86 1.29 13.51 28.64 358.61 4.01+ 114.41 1.76 0.31 23.85 95.18 22.98 15.07 31.73 10.41 3.97 18.70 1.12 14.08 30.91 384.50 all size classes 109.54 0.65 0.28 18.22 39.95 18.86 19.97 31.49 7.88 1.34 11.29 1.10 13.01 22.43 296.00
(Contd.)

Appendix Tables
NSS Report No.472: Differences in Level of Consumption among Socio-Economic Groups,1999-2000 A-235
Table 11R: Break-up of average MPCE by broad groups of food items for each socio-economic category of households all-India Rural
average per capita consumption expenditure ( Rs) per 30 days on size class of land
possessed (hectares) cereals gram
cereal substi- tutes
pulses &
products
milk & milk
products
edible oil
meat, egg &
fish
vege- tables
friuts (fresh)
fruits (dry) sugar salt spices
beverages refresh-
ments etc.
food total
(1) (2) (3) (4) (5) (6) (7) (8) (9) (10) (11) (12) (13) (14) (15) (16) household type: agricultural labour social group: scheduled tribe <0.01 83.20 0.40 0.33 17.83 15.62 19.70 11.34 30.60 3.21 1.98 10.90 1.08 11.48 13.56 221.23 0.01-0.40 99.85 0.26 0.31 14.40 10.84 14.31 12.78 25.72 2.96 0.89 7.35 1.14 10.60 11.28 212.69 0.41-1.00 97.14 0.30 0.20 13.46 12.09 12.94 10.62 22.59 2.85 0.90 6.82 1.02 10.24 9.06 200.22 1.01-2.00 92.36 0.54 0.31 18.33 10.94 13.97 10.11 22.26 2.74 1.01 8.43 0.86 10.79 10.77 203.42 2.01-4.00 85.27 0.67 0.17 22.90 13.81 13.16 10.28 18.51 2.52 0.81 8.62 0.74 10.98 9.85 198.29 4.01+ 100.43 0.00 0.00 9.52 9.21 5.72 10.27 17.83 1.07 0.00 4.95 1.02 6.34 4.41 170.78 all size classes 97.01 0.32 0.28 14.92 11.55 14.21 11.81 24.70 2.90 0.97 7.57 1.07 10.56 10.74 208.59 social group: scheduled caste <0.01 101.00 0.68 0.12 16.31 20.74 15.76 11.82 27.52 3.40 0.57 8.64 1.12 12.29 14.37 234.36 0.01-0.40 102.93 0.46 0.20 15.11 20.11 14.76 13.74 27.08 3.94 0.63 8.85 1.04 12.26 15.44 236.55 0.41-1.00 98.88 0.32 0.12 15.53 17.81 13.92 12.08 23.64 4.17 1.02 7.60 0.94 11.77 13.78 221.58 1.01-2.00 95.78 0.33 0.33 16.02 29.10 13.78 9.90 22.27 3.92 1.32 10.10 0.92 12.17 12.84 228.79 2.01-4.00 98.42 0.20 0.32 21.91 20.44 15.10 20.28 22.35 3.83 2.24 10.37 0.88 10.97 16.48 243.78 4.01+ 97.60 0.00 1.01 15.67 27.88 18.74 2.11 21.31 2.76 0.59 12.32 0.96 13.41 16.05 230.41 all size classes 102.00 0.46 0.19 15.36 20.20 14.74 13.27 26.52 3.91 0.71 8.74 1.03 12.19 15.07 234.40 social group:other backward class <0.01 97.50 0.61 0.27 18.57 22.19 18.83 10.32 31.50 4.22 1.07 9.62 1.00 13.43 17.18 246.32 0.01-0.40 103.26 0.65 0.41 16.07 21.52 15.73 14.52 27.78 5.59 1.01 8.48 1.09 18.66 17.47 252.24 0.41-1.00 100.43 0.53 0.24 17.31 24.09 15.25 12.92 25.60 5.51 1.41 9.12 1.00 13.08 17.61 244.13 1.01-2.00 99.95 0.31 0.58 19.28 21.60 14.65 9.40 22.13 4.08 2.18 10.84 0.90 11.46 13.72 231.07 2.01-4.00 91.40 0.07 0.70 21.37 24.86 15.27 10.08 20.70 3.75 2.95 10.44 0.98 11.33 13.67 227.57 4.01+ 98.08 1.12 0.00 15.09 38.19 17.58 16.31 40.01 3.40 2.29 6.21 0.90 7.75 25.90 272.82 all size classes 101.90 0.59 0.38 16.77 22.10 15.83 13.51 27.27 5.34 1.19 8.86 1.05 16.70 17.18 248.69
(Contd.)

Appendix Tables
NSS Report No.472: Differences in Level of Consumption among Socio-Economic Groups,1999-2000 A-236
Table 11R: Break-up of average MPCE by broad groups of food items for each socio-economic category of households all-India Rural
average per capita consumption expenditure ( Rs) per 30 days on size class of land
possessed (hectares) cereals gram
cereal substi- tutes
pulses &
products
milk & milk
products
edible oil
meat, egg &
fish
vege- tables
friuts (fresh)
fruits (dry) sugar salt spices
beverages refresh-
ments etc.
food total
(1) (2) (3) (4) (5) (6) (7) (8) (9) (10) (11) (12) (13) (14) (15) (16) household type: agricultural labour social group: others <0.01 103.01 0.52 0.41 18.27 30.09 19.14 13.79 31.44 3.92 1.68 11.07 1.10 14.08 17.62 266.13 0.01-0.40 117.15 0.32 0.43 14.17 19.75 17.06 20.34 31.23 4.85 1.03 9.09 1.09 11.32 16.25 264.06 0.41-1.00 104.53 0.59 0.76 19.47 31.31 19.31 12.40 27.24 6.12 3.00 12.54 1.03 12.35 16.62 267.28 1.01-2.00 95.17 0.32 0.93 20.43 31.05 17.80 8.79 21.02 6.04 4.21 13.18 0.90 12.68 15.57 248.09 2.01-4.00 101.23 0.37 0.95 23.27 32.85 18.05 7.10 21.00 4.20 6.60 14.68 1.01 12.59 37.67 281.57 4.01+ 138.07 2.28 0.15 25.37 53.93 31.38 10.72 29.90 6.44 2.14 26.30 1.10 13.78 20.69 362.24 all size classes 113.22 0.37 0.51 15.67 22.88 17.59 17.98 29.97 5.01 1.61 10.06 1.07 11.73 16.82 264.47 social group: not recorded <0.01 130.30 0.00 0.00 29.11 18.82 8.10 76.75 49.09 0.83 0.00 5.42 0.47 13.84 13.44 346.17 0.01-0.40 123.60 0.36 0.00 18.15 20.68 19.07 11.93 31.43 3.93 0.15 9.62 1.23 10.02 8.15 258.31 0.41-1.00 67.81 0.00 0.00 39.74 7.50 21.88 0.00 26.04 3.50 9.57 7.92 1.77 10.04 4.90 200.68 1.01-2.00 0.00 0.00 0.00 0.00 0.00 0.00 0.00 0.00 0.00 0.00 0.00 0.00 0.00 0.00 0.00 2.01-4.00 72.50 0.00 0.00 16.25 22.50 15.00 0.00 13.25 0.00 0.00 8.00 2.00 11.00 4.50 165.00 4.01+ 0.00 0.00 0.00 0.00 0.00 0.00 0.00 0.00 0.00 0.00 0.00 0.00 0.00 0.00 0.00 all size classes 116.20 0.27 0.00 21.61 19.06 18.17 16.53 31.94 3.44 1.20 8.96 1.24 10.43 8.17 257.23 social group: all <0.01 98.09 0.60 0.24 17.55 22.00 17.74 11.62 29.81 3.73 1.06 9.58 1.07 12.84 15.70 241.62 0.01-0.40 105.56 0.47 0.32 15.16 19.46 15.49 15.20 27.99 4.55 0.86 8.61 1.08 13.96 15.79 244.49 0.41-1.00 99.90 0.44 0.28 16.33 20.87 15.02 12.10 24.67 4.66 1.45 8.74 0.99 11.98 14.53 231.97 1.01-2.00 96.47 0.37 0.53 18.64 22.28 14.91 9.55 21.98 4.09 2.11 10.56 0.89 11.66 13.20 227.25 2.01-4.00 93.84 0.29 0.58 22.26 23.80 15.51 11.14 20.59 3.62 3.31 11.13 0.92 11.52 19.49 238.01 4.01+ 108.24 0.78 0.23 15.66 29.64 16.87 10.07 26.12 3.17 1.11 11.70 1.00 9.78 15.15 249.53 all size classes 103.40 0.47 0.32 15.83 20.13 15.57 14.04 27.17 4.46 1.08 8.87 1.05 13.39 15.50 241.29
(Contd.)

Appendix Tables
NSS Report No.472: Differences in Level of Consumption among Socio-Economic Groups,1999-2000 A-237
Table 11R: Break-up of average MPCE by broad groups of food items for each socio-economic category of households all-India Rural
average per capita consumption expenditure ( Rs) per 30 days on size class of land
possessed (hectares) cereals gram
cereal substi- tutes
pulses &
products
milk & milk
products
edible oil
meat, egg &
fish
vege- tables
friuts (fresh)
fruits (dry) sugar salt spices
beverages refresh-
ments etc.
food total
(1) (2) (3) (4) (5) (6) (7) (8) (9) (10) (11) (12) (13) (14) (15) (16) household type: other labour social group: scheduled tribe <0.01 109.86 0.86 0.23 18.99 26.66 13.44 13.90 24.57 6.27 1.51 13.33 0.87 11.29 25.79 267.56 0.01-0.40 98.12 0.39 0.43 15.01 22.59 14.40 15.12 25.67 3.98 0.74 8.87 1.28 13.32 17.66 237.58 0.41-1.00 99.91 0.36 0.18 13.36 24.74 12.67 11.31 19.79 2.80 0.78 8.71 1.16 12.75 11.58 220.10 1.01-2.00 95.83 0.52 0.10 13.66 28.60 9.93 7.72 19.58 3.34 0.28 9.45 0.85 10.70 12.38 212.93 2.01-4.00 89.07 0.91 0.00 10.61 27.64 9.87 6.33 18.04 1.50 0.00 7.29 0.77 8.19 9.74 189.97 4.01+ 76.27 0.00 0.00 19.38 54.08 18.00 4.66 38.07 9.54 0.00 21.08 1.73 13.95 35.76 292.52 all size classes 98.67 0.42 0.32 14.55 23.98 13.53 13.31 23.49 3.67 0.73 9.06 1.19 12.82 15.86 231.61 social group: scheduled caste <0.01 93.75 0.99 0.32 19.05 28.80 18.99 16.54 29.67 5.18 1.27 12.36 1.09 14.39 33.70 276.09 0.01-0.40 98.76 0.66 0.39 15.97 28.27 16.04 16.46 27.57 5.27 0.74 10.91 0.99 13.15 21.58 256.77 0.41-1.00 102.20 0.31 0.10 17.62 34.89 14.92 9.04 26.25 3.71 0.83 10.05 0.95 11.60 10.95 243.42 1.01-2.00 107.83 0.38 0.00 16.48 46.02 13.69 7.42 26.10 2.91 0.57 12.89 1.07 14.12 13.60 263.10 2.01-4.00 123.08 0.00 0.00 17.02 77.52 17.50 6.80 28.09 2.63 0.93 16.98 1.17 13.45 19.48 324.64 4.01+ 121.54 0.00 0.00 12.07 66.50 15.80 6.05 25.69 2.60 0.13 15.54 1.24 13.78 9.53 290.47 all size classes 99.02 0.66 0.34 16.50 30.09 16.30 15.48 27.69 5.03 0.81 11.18 1.00 13.21 22.01 259.33 social group:other backward class <0.01 92.99 1.41 1.23 20.73 32.37 19.23 19.45 30.44 7.52 2.20 11.41 0.94 14.22 28.01 282.14 0.01-0.40 102.32 0.68 0.96 16.63 30.20 17.43 22.94 28.69 11.18 1.16 10.04 1.01 15.04 32.07 290.36 0.41-1.00 100.85 0.32 0.32 16.85 42.31 16.11 15.94 24.25 6.80 1.13 11.26 0.96 13.12 24.50 274.73 1.01-2.00 112.36 0.19 0.07 23.42 48.71 22.85 9.22 30.55 4.80 0.96 14.41 1.34 15.64 17.70 302.21 2.01-4.00 103.86 0.92 0.25 17.49 67.13 18.23 12.41 25.93 7.37 1.01 14.69 1.20 17.01 27.66 315.18 4.01+ 111.37 0.00 0.00 12.78 92.28 15.97 0.00 32.01 2.32 0.00 16.43 0.71 13.68 18.06 315.60 all size classes 101.57 0.71 0.88 17.38 33.03 17.72 21.10 28.50 10.00 1.26 10.56 1.01 14.80 30.18 288.70
(Contd.)

Appendix Tables
NSS Report No.472: Differences in Level of Consumption among Socio-Economic Groups,1999-2000 A-238
Table 11R: Break-up of average MPCE by broad groups of food items for each socio-economic category of households all-India Rural
average per capita consumption expenditure ( Rs) per 30 days on size class of land
possessed (hectares) cereals gram
cereal substi- tutes
pulses &
products
milk & milk
products
edible oil
meat, egg &
fish
vege- tables
friuts (fresh)
fruits (dry) sugar salt spices
beverages refresh-
ments etc.
food total
(1) (2) (3) (4) (5) (6) (7) (8) (9) (10) (11) (12) (13) (14) (15) (16) household type: other labour social group: others <0.01 109.96 1.05 1.38 23.12 41.85 21.90 28.04 34.50 12.27 4.87 12.62 1.30 18.19 48.03 359.08 0.01-0.40 112.40 0.75 1.27 16.03 36.02 19.38 29.28 33.52 11.88 1.79 11.61 1.20 13.48 30.76 319.36 0.41-1.00 114.69 0.62 0.77 16.89 37.71 19.28 18.63 32.88 8.77 1.63 13.09 1.14 13.83 20.04 299.97 1.01-2.00 104.89 0.46 0.42 15.64 45.48 17.74 16.58 25.43 6.91 0.52 12.01 1.07 12.52 26.82 286.48 2.01-4.00 91.90 1.28 1.69 24.57 58.12 25.20 7.70 34.05 5.09 4.39 18.59 1.51 12.12 18.30 304.52 4.01+ 111.74 0.85 0.00 12.13 90.57 20.01 15.21 22.95 3.86 1.50 18.15 1.31 12.73 14.02 325.02 all size classes 111.97 0.76 1.21 16.82 37.47 19.61 27.58 33.26 11.40 2.05 11.94 1.20 13.92 31.16 320.35 social group: not recorded <0.01 0.00 0.00 0.00 0.00 0.00 0.00 0.00 0.00 0.00 0.00 0.00 0.00 0.00 0.00 0.00 0.01-0.40 128.33 0.00 0.00 26.00 13.33 25.00 13.33 21.83 0.00 0.00 9.10 1.00 8.17 5.33 251.43 0.41-1.00 0.00 0.00 0.00 0.00 0.00 0.00 0.00 0.00 0.00 0.00 0.00 0.00 0.00 0.00 0.00 1.01-2.00 0.00 0.00 0.00 0.00 0.00 0.00 0.00 0.00 0.00 0.00 0.00 0.00 0.00 0.00 0.00 2.01-4.00 0.00 0.00 0.00 0.00 0.00 0.00 0.00 0.00 0.00 0.00 0.00 0.00 0.00 0.00 0.00 4.01+ 0.00 0.00 0.00 0.00 0.00 0.00 0.00 0.00 0.00 0.00 0.00 0.00 0.00 0.00 0.00 all size classes 128.33 0.00 0.00 26.00 13.33 25.00 13.33 21.83 0.00 0.00 9.10 1.00 8.17 5.33 251.43 social group: all <0.01 97.74 1.17 0.92 20.63 33.05 19.49 20.15 30.83 7.75 2.46 12.08 1.07 15.03 34.23 296.58 0.01-0.40 103.54 0.66 0.84 16.15 30.46 17.27 22.07 29.34 9.08 1.17 10.57 1.08 13.97 27.54 283.73 0.41-1.00 103.44 0.38 0.32 15.99 34.96 15.49 13.82 24.96 5.43 1.07 10.64 1.05 12.86 17.38 257.79 1.01-2.00 106.86 0.34 0.14 18.70 43.76 17.70 10.16 26.61 4.63 0.67 12.70 1.14 13.78 17.88 275.06 2.01-4.00 103.61 0.75 0.39 17.19 60.16 17.54 8.96 26.26 4.60 1.36 14.43 1.16 13.49 20.36 290.25 4.01+ 111.10 0.21 0.00 13.13 77.84 17.15 6.58 28.13 3.66 0.42 17.08 1.17 13.51 15.98 305.95 all size classes 103.08 0.67 0.75 16.69 32.28 17.32 20.28 28.86 8.29 1.27 10.89 1.08 13.94 26.60 282.01
(Contd.)

Appendix Tables
NSS Report No.472: Differences in Level of Consumption among Socio-Economic Groups,1999-2000 A-239
Table 11R: Break-up of average MPCE by broad groups of food items for each socio-economic category of households all-India Rural
average per capita consumption expenditure ( Rs) per 30 days on size class of land
possessed (hectares) cereals gram
cereal substi- tutes
pulses &
products
milk & milk
products
edible oil
meat, egg &
fish
vege- tables
friuts (fresh)
fruits (dry) sugar salt spices
beverages refresh-
ments etc.
food total
(1) (2) (3) (4) (5) (6) (7) (8) (9) (10) (11) (12) (13) (14) (15) (16) household type: self-employed in agriculture social group: scheduled tribe <0.01 121.54 0.00 0.00 13.27 11.88 15.28 26.07 28.09 5.14 0.16 7.59 1.26 9.50 11.19 250.98 0.01-0.40 123.68 0.42 0.32 15.24 26.06 15.59 22.66 33.06 5.00 0.60 9.61 1.26 11.85 15.54 280.89 0.41-1.00 118.94 0.26 0.47 13.70 28.00 14.99 19.36 30.71 3.73 0.51 8.40 1.18 10.54 12.46 263.27 1.01-2.00 117.52 0.48 0.33 15.31 27.05 14.72 18.81 27.43 4.20 1.02 8.51 1.14 9.91 14.57 261.00 2.01-4.00 108.58 0.53 0.10 17.02 27.59 15.88 16.87 27.07 4.47 1.18 9.32 1.07 10.15 12.88 252.72 4.01+ 104.38 0.69 0.26 20.13 40.71 17.24 13.81 25.11 5.44 2.43 12.51 1.13 10.91 14.91 269.67 all size classes 114.36 0.46 0.29 15.89 28.80 15.41 18.09 28.13 4.33 1.07 9.18 1.14 10.32 13.69 261.17 social group: scheduled caste <0.01 104.01 0.00 0.00 26.66 37.77 19.58 20.14 27.02 4.85 0.56 14.79 1.02 14.39 19.56 290.35 0.01-0.40 111.20 0.67 0.07 19.53 33.32 17.45 14.95 30.89 4.32 0.94 10.71 1.05 13.13 14.28 272.51 0.41-1.00 111.90 0.25 0.06 17.14 31.64 16.45 15.14 29.14 4.58 0.55 9.07 0.98 11.12 11.47 259.49 1.01-2.00 110.67 0.44 0.06 18.72 33.92 16.55 15.88 27.65 4.59 0.71 10.52 1.05 11.61 12.85 265.24 2.01-4.00 105.38 0.52 0.09 18.04 52.42 16.87 10.55 25.72 5.08 1.39 13.11 0.94 11.86 12.81 274.79 4.01+ 106.50 0.79 0.33 22.40 67.20 17.81 14.05 24.17 5.86 1.80 18.54 1.03 13.48 19.59 313.56 all size classes 110.18 0.44 0.08 18.46 37.68 16.79 14.66 28.20 4.69 0.85 10.92 1.01 11.84 13.04 268.83 social group:other backward class <0.01 113.43 0.57 0.44 19.11 35.67 14.59 8.76 25.83 4.14 0.11 8.65 0.87 10.38 33.18 275.73 0.01-0.40 106.60 0.59 0.43 17.63 37.72 17.35 16.78 28.27 7.70 0.62 9.97 0.99 12.53 16.04 273.22 0.41-1.00 110.16 0.68 0.09 20.01 45.11 17.91 12.45 29.56 6.22 0.95 10.65 1.01 13.01 15.05 282.86 1.01-2.00 108.27 0.65 0.21 20.48 52.69 17.74 11.21 28.53 6.54 1.28 12.04 0.97 12.40 14.96 287.96 2.01-4.00 107.67 0.63 0.29 21.08 63.37 18.90 9.34 26.82 6.42 1.56 13.93 0.95 12.67 16.98 300.62 4.01+ 105.56 0.68 0.38 21.23 90.29 20.12 7.86 26.33 7.39 2.43 16.97 0.97 13.37 20.38 333.96 all size classes 108.18 0.65 0.24 20.19 55.26 18.25 11.49 28.19 6.67 1.29 12.34 0.98 12.76 16.23 292.72
(Contd.)

Appendix Tables
NSS Report No.472: Differences in Level of Consumption among Socio-Economic Groups,1999-2000 A-240
Table 11R: Break-up of average MPCE by broad groups of food items for each socio-economic category of households all-India Rural
average per capita consumption expenditure ( Rs) per 30 days on size class of land
possessed (hectares) cereals gram
cereal substi- tutes
pulses &
products
milk & milk
products
edible oil
meat, egg &
fish
vege- tables
friuts (fresh)
fruits (dry) sugar salt spices
beverages refresh-
ments etc.
food total
(1) (2) (3) (4) (5) (6) (7) (8) (9) (10) (11) (12) (13) (14) (15) (16) household type: self-employed in agriculture social group: others <0.01 103.76 0.52 0.08 20.52 61.33 24.87 23.23 31.97 7.32 2.59 18.24 1.25 13.80 15.87 325.35 0.01-0.40 123.13 0.88 0.73 20.94 53.47 21.63 26.04 36.50 10.15 2.06 12.83 1.31 13.79 18.53 341.99 0.41-1.00 118.68 0.86 0.45 20.88 57.64 21.32 19.34 35.02 7.72 1.71 13.64 1.32 12.47 19.44 330.50 1.01-2.00 110.36 0.84 0.36 22.34 76.25 21.04 14.20 32.99 8.65 2.21 15.86 1.08 12.74 20.71 339.63 2.01-4.00 107.05 0.93 0.56 24.60 89.68 21.81 12.28 32.73 9.66 3.01 19.10 1.06 18.71 23.96 365.14 4.01+ 105.78 1.24 0.48 24.85 108.74 23.49 8.74 31.01 9.91 3.81 21.03 1.05 14.36 26.41 380.89 all size classes 112.28 0.93 0.48 22.73 77.59 21.76 15.38 33.47 8.99 2.51 16.57 1.16 14.33 21.83 350.02 social group: not recorded <0.01 0.00 0.00 0.00 0.00 0.00 0.00 0.00 0.00 0.00 0.00 0.00 0.00 0.00 0.00 0.00 0.01-0.40 130.72 0.00 0.00 21.23 9.20 16.16 5.76 29.67 3.37 0.00 10.22 1.05 8.59 13.18 249.14 0.41-1.00 161.06 9.86 0.00 40.61 150.80 34.67 16.38 22.08 9.03 0.00 17.31 1.99 12.02 20.25 496.06 1.01-2.00 118.53 2.26 0.00 19.46 97.47 23.41 19.43 43.31 2.55 0.02 7.96 1.44 13.62 21.90 371.34 2.01-4.00 175.66 0.00 0.10 27.77 40.75 22.32 35.60 33.86 7.20 0.00 7.25 1.30 12.05 39.01 402.88 4.01+ 84.84 0.72 0.00 17.09 60.42 14.52 13.37 21.34 5.92 0.00 10.49 0.71 9.36 17.88 256.64 all size classes 135.86 1.69 0.03 23.18 69.17 22.03 20.94 35.50 4.62 0.01 8.95 1.32 11.97 24.68 359.94 social group: all <0.01 109.74 0.38 0.21 20.39 40.68 18.49 16.84 28.00 5.27 0.89 12.41 1.05 12.03 23.38 289.74 0.01-0.40 113.91 0.69 0.48 18.96 42.04 18.78 20.03 31.76 7.94 1.17 11.06 1.12 13.02 16.63 297.61 0.41-1.00 114.23 0.65 0.25 19.36 46.18 18.65 15.89 31.54 6.30 1.13 11.29 1.13 12.34 15.89 294.82 1.01-2.00 110.55 0.67 0.26 20.26 55.80 18.41 13.83 29.93 6.77 1.52 12.78 1.04 12.11 16.78 300.71 2.01-4.00 107.48 0.73 0.36 21.72 68.09 19.51 11.75 29.20 7.37 2.08 15.30 1.01 14.71 18.97 318.27 4.01+ 105.60 0.96 0.42 22.97 93.89 21.41 9.12 28.41 8.38 3.08 18.65 1.03 13.64 22.82 350.37 all size classes 110.66 0.72 0.32 20.52 59.16 19.14 14.04 30.22 7.10 1.69 13.47 1.07 13.00 17.78 308.92
(Contd.)

Appendix Tables
NSS Report No.472: Differences in Level of Consumption among Socio-Economic Groups,1999-2000 A-241
Table 11R: Break-up of average MPCE by broad groups of food items for each socio-economic category of households all-India Rural
average per capita consumption expenditure ( Rs) per 30 days on size class of land
possessed (hectares) cereals gram
cereal substi- tutes
pulses &
products
milk & milk
products
edible oil
meat, egg &
fish
vege- tables
friuts (fresh)
fruits (dry) sugar salt spices
beverages refresh-
ments etc.
food total
(1) (2) (3) (4) (5) (6) (7) (8) (9) (10) (11) (12) (13) (14) (15) (16) household type: others social group: scheduled tribe <0.01 56.99 0.15 0.16 10.80 19.62 13.26 14.46 20.30 5.95 0.99 6.77 0.63 7.07 154.71 311.86 0.01-0.40 117.65 0.35 0.49 17.83 33.97 20.23 27.20 34.21 7.91 1.79 11.36 1.19 11.55 51.41 337.13 0.41-1.00 122.54 0.30 0.41 17.01 33.34 18.55 32.50 42.27 5.84 1.32 10.91 1.25 12.61 23.80 322.66 1.01-2.00 151.00 0.31 0.08 14.84 24.71 16.34 40.95 43.10 6.49 0.90 9.47 1.26 11.47 24.98 345.89 2.01-4.00 137.32 0.61 0.44 14.72 23.09 12.39 41.45 35.41 5.76 0.22 9.11 1.32 9.59 18.69 310.13 4.01+ 128.26 0.61 5.01 18.16 44.44 15.26 41.85 36.20 7.62 1.65 10.41 1.27 11.81 25.88 348.43 all size classes 116.81 0.35 0.55 16.02 29.99 17.43 30.25 35.14 6.82 1.30 10.14 1.15 10.93 52.43 329.32 social group: scheduled caste <0.01 81.26 0.71 0.21 18.64 53.39 18.93 15.91 32.08 6.68 1.60 13.04 1.07 12.82 69.31 325.65 0.01-0.40 105.22 0.95 0.10 19.69 45.98 20.93 20.01 34.76 7.52 1.45 13.49 1.21 13.70 27.65 312.67 0.41-1.00 119.32 0.42 0.44 16.96 37.46 20.53 22.15 33.60 5.85 2.55 12.66 1.14 10.85 21.58 305.51 1.01-2.00 145.91 0.18 0.06 17.30 40.47 17.00 23.96 38.06 7.37 1.01 10.01 1.02 10.62 16.55 329.53 2.01-4.00 122.31 1.04 0.58 17.83 56.35 21.80 31.47 37.49 9.02 3.00 12.92 1.12 17.62 26.50 359.06 4.01+ 97.86 0.14 0.00 16.91 53.74 21.28 11.64 31.82 5.93 1.20 14.90 0.92 13.99 19.66 289.98 all size classes 106.21 0.80 0.17 19.00 45.81 20.46 20.07 34.43 7.18 1.62 13.17 1.17 13.13 31.52 314.75 social group:other backward class <0.01 85.91 0.68 0.68 21.67 55.82 21.51 13.67 35.16 11.94 2.09 12.58 1.12 15.50 67.42 345.76 0.01-0.40 111.32 0.77 0.33 20.63 49.46 21.09 21.13 34.14 11.31 1.75 12.04 1.24 14.99 30.09 330.29 0.41-1.00 116.29 0.52 0.25 21.59 54.73 20.81 17.50 31.36 8.67 1.36 13.07 1.06 13.17 22.50 322.88 1.01-2.00 116.70 0.73 0.32 21.85 50.56 20.93 19.96 34.08 8.42 1.87 12.59 1.33 12.51 23.90 325.76 2.01-4.00 114.21 0.43 0.25 19.45 64.58 19.56 14.55 30.71 7.85 2.45 14.64 1.16 13.64 22.09 325.56 4.01+ 112.10 0.36 0.58 25.07 85.54 24.33 13.66 28.02 9.90 5.18 16.66 1.18 13.30 28.63 364.50 all size classes 110.28 0.69 0.35 21.04 52.42 21.08 19.29 33.52 10.51 1.83 12.52 1.20 14.43 31.57 330.73
(Contd.)

Appendix Tables
NSS Report No.472: Differences in Level of Consumption among Socio-Economic Groups,1999-2000 A-242
Table 11R: Break-up of average MPCE by broad groups of food items for each socio-economic category of households all-India Rural
average per capita consumption expenditure ( Rs) per 30 days on size class of land
possessed (hectares) cereals gram
cereal substi- tutes
pulses &
products
milk & milk
products
edible oil
meat, egg &
fish
vege- tables
friuts (fresh)
fruits (dry) sugar salt spices
beverages refresh-
ments etc.
food total
(1) (2) (3) (4) (5) (6) (7) (8) (9) (10) (11) (12) (13) (14) (15) (16) household type: others social group: others <0.01 86.50 1.09 0.68 21.90 71.33 24.47 13.07 40.33 12.82 3.25 14.10 1.46 16.26 64.96 372.21 0.01-0.40 114.65 0.98 0.47 21.40 70.26 24.31 26.59 40.10 14.76 2.77 14.73 1.28 15.16 46.38 393.85 0.41-1.00 119.65 0.96 0.36 21.72 87.01 23.91 28.44 41.24 13.22 2.44 16.03 1.41 14.67 30.10 401.17 1.01-2.00 118.83 1.24 0.94 24.67 84.80 23.52 18.42 38.26 14.18 2.98 16.47 1.31 14.36 30.12 390.10 2.01-4.00 118.03 0.93 0.66 25.30 100.14 27.58 20.73 38.44 11.53 4.24 17.56 1.28 14.30 27.15 407.86 4.01+ 106.30 1.25 0.69 26.84 124.24 25.52 18.11 34.58 14.29 4.19 21.69 1.25 15.06 35.11 429.12 all size classes 112.41 1.02 0.53 22.13 77.07 24.43 24.11 39.89 14.09 2.92 15.33 1.32 15.10 43.56 393.92 social group: not recorded <0.01 0.00 0.00 0.00 0.00 0.00 0.00 0.00 0.00 0.00 0.00 0.00 0.00 0.00 0.00 0.00 0.01-0.40 76.50 0.00 0.00 10.00 0.00 5.50 0.00 10.50 6.00 0.00 0.00 3.00 2.00 1.25 114.75 0.41-1.00 68.00 0.00 0.00 10.38 35.83 16.00 26.25 26.67 0.00 0.00 3.83 1.00 2.83 26.25 217.04 1.01-2.00 432.00 0.00 0.00 19.90 10.00 18.90 24.00 40.70 0.00 0.00 14.88 1.60 15.20 12.00 589.18 2.01-4.00 77.75 0.00 0.00 17.67 11.67 16.67 23.33 30.17 3.67 0.00 5.67 1.00 7.67 27.67 222.92 4.01+ 0.00 0.00 0.00 0.00 0.00 0.00 0.00 0.00 0.00 0.00 0.00 0.00 0.00 0.00 0.00 all size classes 384.65 0.00 0.00 18.84 10.79 17.98 22.81 38.09 0.43 0.00 13.27 1.63 13.66 12.59 534.73 social group: all <0.01 83.22 0.83 0.56 20.44 59.80 21.80 13.85 35.88 10.98 2.45 12.92 1.23 14.76 73.11 351.83 0.01-0.40 112.04 0.88 0.36 20.70 57.53 22.47 23.64 36.91 12.07 2.16 13.46 1.25 14.70 37.85 356.01 0.41-1.00 118.63 0.68 0.33 20.64 64.25 21.90 23.96 36.71 9.97 1.97 14.09 1.23 13.43 25.69 353.49 1.01-2.00 123.86 0.86 0.54 22.02 61.90 21.28 21.53 37.03 10.60 2.17 13.74 1.29 13.05 25.97 355.85 2.01-4.00 119.80 0.75 0.51 21.72 76.71 22.84 22.40 35.73 9.52 3.10 15.28 1.24 13.66 24.49 367.73 4.01+ 109.44 0.83 1.02 24.67 99.33 23.83 18.54 32.56 11.66 4.00 18.56 1.20 14.14 31.04 390.81 all size classes 111.06 0.83 0.42 20.91 61.09 22.27 22.24 36.61 11.38 2.26 13.73 1.25 14.32 38.20 356.58
(Contd.)

Appendix Tables
NSS Report No.472: Differences in Level of Consumption among Socio-Economic Groups,1999-2000 A-243
Table 11R: Break-up of average MPCE by broad groups of food items for each socio-economic category of households all-India Rural
average per capita consumption expenditure ( Rs) per 30 days on size class of land
possessed (hectares) cereals gram
cereal substi- tutes
pulses &
products
milk & milk
products
edible oil
meat, egg &
fish
vege- tables
friuts (fresh)
fruits (dry) sugar salt spices
beverages refresh-
ments etc.
food total
(1) (2) (3) (4) (5) (6) (7) (8) (9) (10) (11) (12) (13) (14) (15) (16) household type: not recorded social group: scheduled tribe <0.01 0.00 0.00 0.00 0.00 0.00 0.00 0.00 0.00 0.00 0.00 0.00 0.00 0.00 0.00 0.00 0.01-0.40 107.87 0.00 0.00 18.98 46.77 15.70 45.56 34.48 8.97 0.00 9.99 1.13 9.29 41.22 339.96 0.41-1.00 102.00 6.80 0.00 32.30 68.00 26.50 16.00 38.60 0.00 0.00 16.30 1.44 14.40 6.30 328.64 1.01-2.00 0.00 0.00 0.00 0.00 0.00 0.00 0.00 0.00 0.00 0.00 0.00 0.00 0.00 0.00 0.00 2.01-4.00 135.71 0.00 0.00 17.86 15.71 27.43 60.00 122.86 12.86 0.00 18.14 3.43 12.14 10.71 436.86 4.01+ 111.42 0.00 0.00 17.64 21.31 15.89 8.97 30.41 1.81 0.24 7.33 1.52 7.94 10.75 235.23 all size classes 111.31 0.11 0.00 17.97 23.79 16.18 12.31 31.94 2.43 0.22 7.79 1.51 8.19 12.85 246.60 social group: scheduled caste <0.01 0.00 0.00 0.00 0.00 0.00 0.00 0.00 0.00 0.00 0.00 0.00 0.00 0.00 0.00 0.00 0.01-0.40 102.71 0.84 0.14 13.09 22.91 13.06 18.39 26.67 4.16 0.11 11.13 1.04 10.09 11.74 236.07 0.41-1.00 0.00 0.00 0.00 0.00 0.00 0.00 0.00 0.00 0.00 0.00 0.00 0.00 0.00 0.00 0.00 1.01-2.00 0.00 0.00 0.00 0.00 0.00 0.00 0.00 0.00 0.00 0.00 0.00 0.00 0.00 0.00 0.00 2.01-4.00 0.00 0.00 0.00 0.00 0.00 0.00 0.00 0.00 0.00 0.00 0.00 0.00 0.00 0.00 0.00 4.01+ 233.33 0.00 0.00 43.33 73.33 33.33 75.00 34.17 33.33 0.00 8.00 0.83 13.33 91.67 639.67 all size classes 106.18 0.82 0.13 13.90 24.25 13.60 19.89 26.87 4.94 0.10 11.04 1.03 10.18 13.86 246.79 social group:other backward class <0.01 0.00 0.00 0.00 0.00 0.00 0.00 0.00 0.00 0.00 0.00 0.00 0.00 0.00 0.00 0.00 0.01-0.40 123.12 0.21 0.00 27.91 25.64 23.33 15.80 36.21 6.82 0.00 12.41 1.23 12.61 18.37 303.65 0.41-1.00 135.44 0.00 0.00 10.53 13.51 14.13 16.96 23.51 4.09 0.00 7.46 0.95 10.75 14.38 251.71 1.01-2.00 131.86 0.00 0.00 19.86 74.29 14.36 19.14 19.71 3.43 0.00 10.29 0.86 10.14 10.86 314.79 2.01-4.00 93.37 0.00 0.00 13.83 19.00 9.08 14.93 11.04 1.17 5.41 5.13 0.62 5.06 7.70 186.34 4.01+ 115.80 0.48 0.63 18.54 24.22 17.30 58.85 40.18 18.73 0.58 10.37 1.60 8.22 28.79 344.27 all size classes 121.32 0.16 0.06 20.91 21.95 18.57 20.19 30.08 6.55 0.79 10.04 1.11 10.70 16.95 279.39
(Contd.)

Appendix Tables
NSS Report No.472: Differences in Level of Consumption among Socio-Economic Groups,1999-2000 A-244
Table 11R: Break-up of average MPCE by broad groups of food items for each socio-economic category of households all-India Rural
average per capita consumption expenditure ( Rs) per 30 days on size class of land
possessed (hectares) cereals gram
cereal substi- tutes
pulses &
products
milk & milk
products
edible oil
meat, egg &
fish
vege- tables
friuts (fresh)
fruits (dry) sugar salt spices
beverages refresh-
ments etc.
food total
(1) (2) (3) (4) (5) (6) (7) (8) (9) (10) (11) (12) (13) (14) (15) (16) household type: not recorded social group: others <0.01 43.75 0.00 0.00 22.50 57.50 42.50 0.00 19.25 7.50 0.00 16.88 3.00 8.50 12.50 233.88 0.01-0.40 111.59 0.00 0.00 18.77 160.10 7.41 8.84 32.84 5.64 0.00 12.50 1.56 11.17 34.12 404.54 0.41-1.00 137.11 0.00 0.00 17.98 52.60 22.62 26.67 37.56 7.13 3.07 10.61 0.83 14.55 10.66 341.40 1.01-2.00 136.00 0.00 0.00 16.20 30.00 15.60 33.00 24.80 2.00 0.00 19.20 0.60 23.40 12.40 313.20 2.01-4.00 0.00 0.00 0.00 0.00 0.00 0.00 0.00 0.00 0.00 0.00 0.00 0.00 0.00 0.00 0.00 4.01+ 188.21 0.36 0.00 27.84 91.35 46.41 103.30 80.55 28.72 0.30 17.46 3.48 13.88 26.35 628.24 all size classes 122.14 0.00 0.00 18.53 105.76 15.53 18.23 34.51 6.39 1.25 12.28 1.28 13.14 22.73 371.78 social group: not recorded <0.01 117.18 1.09 0.00 16.01 17.70 15.62 18.18 25.27 3.30 0.33 8.05 1.08 9.83 12.81 246.45 0.01-0.40 119.13 0.00 0.21 15.10 10.46 18.39 30.81 36.39 2.25 0.00 8.76 1.27 9.89 15.51 268.16 0.41-1.00 138.38 0.00 0.00 20.31 8.90 18.66 13.58 29.79 6.04 0.00 9.42 2.07 9.07 10.94 267.17 1.01-2.00 160.79 0.00 0.00 21.86 8.31 16.81 11.30 21.60 5.86 0.00 9.22 0.80 4.51 3.16 264.23 2.01-4.00 176.94 1.09 0.00 7.59 42.43 15.22 63.94 37.54 7.15 0.38 6.57 1.87 10.41 30.56 401.70 4.01+ 268.00 0.00 0.00 20.00 96.00 12.00 47.00 64.20 5.00 0.00 6.60 2.00 3.40 12.00 536.20 all size classes 120.82 0.76 0.05 16.04 16.04 16.39 21.44 28.33 3.22 0.23 8.28 1.15 9.63 13.24 255.63 social group: all <0.01 115.13 1.06 0.00 16.19 18.81 16.37 17.67 25.10 3.42 0.32 8.29 1.13 9.80 12.80 246.09 0.01-0.40 114.68 0.21 0.07 19.46 61.58 15.50 18.29 33.44 5.04 0.02 11.34 1.30 11.04 21.69 313.66 0.41-1.00 136.13 0.10 0.00 15.91 37.75 19.71 22.64 32.60 5.98 1.86 9.61 0.95 13.01 11.82 308.07 1.01-2.00 146.88 0.00 0.00 18.87 22.17 16.09 22.75 23.16 3.78 0.00 14.38 0.70 14.42 8.21 291.42 2.01-4.00 101.26 0.07 0.00 13.62 20.40 10.47 20.64 18.78 2.20 4.78 5.92 0.86 5.80 9.40 214.21 4.01+ 117.07 0.07 0.08 18.31 24.63 16.79 18.57 33.10 4.96 0.28 7.91 1.56 8.09 14.45 265.87 all size classes 118.77 0.37 0.04 17.74 39.53 16.41 19.03 30.51 4.66 0.57 9.70 1.22 10.49 16.18 285.21
(Contd.)

Appendix Tables
NSS Report No.472: Differences in Level of Consumption among Socio-Economic Groups,1999-2000 A-245
Table 11R: Break-up of average MPCE by broad groups of food items for each socio-economic category of households all-India Rural
average per capita consumption expenditure ( Rs) per 30 days on size class of land
possessed (hectares) cereals gram
cereal substi- tutes
pulses &
products
milk & milk
products
edible oil
meat, egg &
fish
vege- tables
friuts (fresh)
fruits (dry) sugar salt spices
beverages refresh-
ments etc.
food total
(1) (2) (3) (4) (5) (6) (7) (8) (9) (10) (11) (12) (13) (14) (15) (16) household type: all types social group: scheduled tribe <0.01 82.77 0.41 0.33 16.59 18.36 17.94 12.71 28.31 4.20 1.69 10.25 0.98 10.81 40.18 245.52 0.01-0.40 102.56 0.33 0.32 14.88 15.67 15.00 15.07 26.83 3.62 0.92 8.13 1.16 11.12 15.37 230.98 0.41-1.00 108.14 0.30 0.32 13.77 21.05 14.09 15.47 26.71 3.41 0.74 7.86 1.11 10.72 11.43 235.12 1.01-2.00 113.02 0.48 0.30 15.92 23.32 14.56 17.43 26.74 3.89 0.98 8.56 1.08 10.10 14.15 250.52 2.01-4.00 108.46 0.54 0.14 17.43 26.57 15.51 17.57 26.86 4.37 1.08 9.24 1.05 10.12 13.14 252.10 4.01+ 105.33 0.62 0.44 19.43 38.97 16.35 14.75 25.56 5.08 2.12 11.88 1.14 10.59 14.59 266.84 all size classes 105.88 0.40 0.30 15.44 21.10 14.96 15.80 26.79 3.82 1.00 8.57 1.11 10.66 14.97 240.81 social group: scheduled caste <0.01 97.90 0.70 0.15 17.24 28.37 17.25 13.11 28.87 4.08 0.79 10.17 1.11 12.85 24.49 257.09 0.01-0.40 104.03 0.52 0.19 15.85 24.44 15.67 15.11 28.30 4.51 0.72 9.66 1.07 12.39 17.45 249.90 0.41-1.00 106.70 0.31 0.11 16.46 27.24 15.59 14.75 27.37 4.45 0.89 8.99 0.97 11.38 13.20 248.42 1.01-2.00 108.92 0.40 0.11 17.82 33.91 16.05 14.76 27.00 4.59 0.85 10.46 1.02 11.75 13.21 260.86 2.01-4.00 106.40 0.51 0.16 18.48 50.02 17.10 12.93 26.08 5.03 1.58 13.09 0.96 12.12 14.35 278.81 4.01+ 106.99 0.80 0.32 21.22 63.56 18.08 12.65 24.78 5.47 1.56 17.60 1.02 13.46 19.05 306.55 all size classes 104.46 0.49 0.17 16.40 27.44 15.91 14.75 27.96 4.50 0.80 9.90 1.05 12.23 16.94 253.00 social group:other backward class <0.01 94.94 0.75 0.47 19.90 33.96 19.36 12.66 31.59 6.63 1.50 10.89 1.00 14.18 29.98 277.82 0.01-0.40 104.96 0.69 0.44 17.50 31.55 17.32 17.56 29.12 7.85 1.06 9.92 1.07 15.92 22.03 277.00 0.41-1.00 107.99 0.61 0.17 19.20 40.75 17.34 13.18 28.54 6.42 1.11 10.49 1.01 13.02 16.83 276.65 1.01-2.00 107.56 0.61 0.26 20.43 48.54 17.77 11.77 28.14 6.41 1.43 12.00 0.99 12.37 15.73 284.01 2.01-4.00 107.17 0.61 0.30 21.05 61.06 18.84 10.05 26.71 6.46 1.68 13.73 0.98 12.73 17.48 298.84 4.01+ 106.20 0.68 0.37 21.42 89.43 20.40 8.52 26.87 7.58 2.49 16.93 0.98 13.39 21.13 336.39 all size classes 105.69 0.66 0.35 18.93 41.81 17.80 14.40 28.65 7.15 1.28 11.11 1.03 14.30 20.02 283.17
(Contd.)

Appendix Tables
NSS Report No.472: Differences in Level of Consumption among Socio-Economic Groups,1999-2000 A-246
Table 11R: Break-up of average MPCE by broad groups of food items for each socio-economic category of households all-India Rural
average per capita consumption expenditure ( Rs) per 30 days on size class of land
possessed (hectares) cereals gram
cereal substi- tutes
pulses &
products
milk & milk
products
edible oil
meat, egg &
fish
vege- tables
friuts (fresh)
fruits (dry) sugar salt spices
beverages refresh-
ments etc.
food total
(1) (2) (3) (4) (5) (6) (7) (8) (9) (10) (11) (12) (13) (14) (15) (16) household type: all types social group: others <0.01 96.26 0.86 0.67 20.92 53.18 22.43 16.90 36.42 9.63 2.81 13.01 1.29 15.68 41.83 331.86 0.01-0.40 116.50 0.61 0.51 17.42 40.77 19.98 24.48 34.71 9.23 1.74 11.38 1.19 13.00 25.66 317.17 0.41-1.00 117.47 0.84 0.50 20.66 56.45 21.41 20.29 34.75 8.43 1.98 13.61 1.27 12.82 20.65 331.12 1.01-2.00 109.94 0.83 0.45 22.26 73.26 21.09 14.46 32.57 9.00 2.47 15.67 1.08 12.86 21.55 337.49 2.01-4.00 107.69 0.91 0.61 24.56 88.28 22.45 12.86 32.74 9.65 3.29 18.93 1.09 18.00 24.91 365.96 4.01+ 106.16 1.27 0.49 24.84 109.34 23.64 9.28 31.10 10.12 3.90 21.08 1.07 14.36 26.97 383.61 all size classes 112.88 0.79 0.52 20.37 60.49 21.12 19.21 33.94 9.19 2.30 14.21 1.17 13.76 24.87 334.83 social group: not recorded <0.01 108.38 1.26 0.00 16.75 25.37 15.44 19.90 26.87 4.24 0.23 7.61 0.97 9.52 14.13 250.67 0.01-0.40 126.66 0.17 0.07 18.83 16.15 18.79 17.69 32.98 4.23 0.07 9.38 1.29 9.85 11.39 267.54 0.41-1.00 114.66 2.18 0.00 27.06 47.50 24.58 18.08 32.21 5.88 2.38 14.25 1.64 11.41 12.62 314.46 1.01-2.00 143.39 1.51 0.00 20.23 79.20 26.34 32.44 38.75 2.32 0.57 10.06 1.56 14.35 18.21 388.95 2.01-4.00 165.85 0.04 0.09 25.96 39.01 21.38 33.31 32.10 6.53 0.01 7.29 1.39 11.87 35.51 380.35 4.01+ 107.23 0.32 0.00 18.70 50.53 12.83 21.61 26.55 6.79 0.00 8.44 1.18 9.07 12.67 275.92 all size classes 123.13 0.93 0.03 19.42 34.18 19.05 21.89 31.14 4.35 0.39 9.04 1.24 10.61 15.19 290.61 social group: all <0.01 95.31 0.74 0.41 19.04 35.74 19.34 13.95 31.67 6.39 1.62 11.12 1.10 13.83 31.98 282.22 0.01-0.40 107.78 0.59 0.38 16.82 30.92 17.43 18.64 30.29 6.98 1.14 10.12 1.11 13.75 21.26 277.22 0.41-1.00 110.67 0.59 0.28 18.49 40.70 17.86 15.89 29.99 6.31 1.29 10.84 1.09 12.39 16.68 283.07 1.01-2.00 109.38 0.64 0.31 20.09 51.59 18.24 13.89 29.32 6.70 1.65 12.56 1.04 12.14 17.18 294.73 2.01-4.00 107.58 0.71 0.39 21.74 66.08 19.68 12.54 29.12 7.33 2.23 15.11 1.03 14.42 19.62 317.59 4.01+ 106.14 0.96 0.43 22.86 92.70 21.43 9.73 28.66 8.45 3.08 18.48 1.04 13.59 23.19 350.75 all size classes 107.75 0.64 0.36 18.50 42.56 18.16 16.14 29.98 6.89 1.47 11.57 1.09 13.32 20.38 288.80

Appendix Tables
NSS Report No.472: Differences in Level of Consumption among Socio-Economic Groups,1999-2000 A-247
Table 11U: Break-up of average MPCE by broad groups of food items for each socio-economic category of households
all-India Urban average per capita consumption expenditure (Rs) per 30 days on
social group cereals gram
cereal substitutes
pulses &
products
milk & milk
products
edible oil
meat, egg &
fish
vege- tables
friuts (fresh)
fruits (dry) sugar salt spices
beverages refresh-
ments etc.
food total
(1) (2) (3) (4) (5) (6) (7) (8) (9) (10) (11) (12) (13) (14) (15) (16) household type: self-employed
SC 110.62 0.74 0.22 20.47 49.52 22.35 26.26 39.12 10.47 2.79 11.90 1.27 13.76 36.44 345.93 ST 99.84 0.73 0.16 19.66 44.21 20.74 21.21 36.81 7.84 1.31 12.10 1.17 13.28 26.97 306.04
OBC 103.23 0.86 0.23 22.34 56.32 22.18 24.29 35.94 12.55 2.01 12.62 1.21 26.00 37.68 357.44 others 104.44 1.02 0.31 24.96 96.20 29.27 25.73 47.65 20.41 5.33 15.12 1.41 15.72 59.40 446.98
not recorded 106.68 0.19 0.10 25.27 67.76 19.62 16.30 34.19 13.25 2.56 14.15 1.18 12.52 48.78 362.56 all groups 103.71 0.93 0.27 23.46 76.72 25.90 24.80 42.50 16.31 3.77 13.92 1.31 18.80 48.43 400.83
household type: regular wage/salary earning SC 118.06 0.80 0.46 23.89 61.55 26.90 37.32 45.52 13.36 4.52 13.23 1.48 15.41 44.99 407.48 ST 106.25 0.90 0.24 24.24 59.26 27.14 29.56 43.88 12.47 2.69 14.18 1.57 15.83 45.10 383.32
OBC 110.67 1.05 0.38 26.64 67.18 26.34 29.32 43.53 16.42 3.30 13.36 1.42 18.42 56.26 414.29 others 109.84 1.10 0.51 27.62 100.40 32.92 30.80 52.53 23.07 6.69 16.09 1.56 17.85 70.64 491.62
not recorded 118.80 1.09 1.50 21.20 82.58 28.39 38.13 47.79 16.88 2.54 12.64 1.61 16.70 66.77 456.60 all groups 109.85 1.05 0.43 26.76 84.80 30.22 30.49 48.78 19.54 5.19 15.02 1.52 17.62 62.49 453.77
household type: casual labour
SC 104.15 0.33 0.13 17.76 19.43 16.48 17.89 28.63 4.71 0.73 8.87 1.11 11.85 22.03 254.10 ST 94.33 0.67 0.14 18.01 29.24 18.35 16.23 31.86 6.10 0.91 11.71 1.12 13.95 25.08 267.70
OBC 96.92 0.71 0.44 18.92 33.95 18.95 21.43 32.04 9.69 0.87 10.31 1.10 16.36 33.87 295.55 others 99.99 0.65 0.40 19.25 37.46 21.82 25.20 33.93 8.72 2.06 11.36 1.27 14.34 33.70 310.14
not recorded 178.54 0.40 0.92 16.29 25.89 18.92 29.20 29.83 13.58 1.44 6.71 1.19 14.69 57.06 394.67 all groups 97.63 0.66 0.33 18.68 32.75 19.43 20.82 32.31 8.14 1.20 10.90 1.15 14.86 30.73 289.60
(Contd.)

Appendix Tables
NSS Report No.472: Differences in Level of Consumption among Socio-Economic Groups,1999-2000 A-248
Table 11U: Break-up of average MPCE by broad groups of food items for each socio-economic category of households
all-India Urban average per capita consumption expenditure (Rs) per 30 days on
social group cereals gram
cereal substitutes
pulses &
products
milk & milk
products
edible oil
meat, egg &
fish
vege- tables
friuts (fresh)
fruits (dry) sugar salt spices
beverages refresh-
ments etc.
food total
(1) (2) (3) (4) (5) (6) (7) (8) (9) (10) (11) (12) (13) (14) (15) (16) household type: others
SC 120.73 0.42 0.08 20.92 40.68 20.29 38.79 45.91 11.44 2.61 11.53 1.57 13.03 93.39 421.40 ST 88.69 0.60 0.22 17.82 42.83 19.99 18.92 33.19 9.03 1.70 11.00 1.08 12.52 97.78 355.37
OBC 105.12 1.08 0.23 24.21 69.10 24.92 30.29 39.84 16.60 3.60 13.81 1.36 22.48 72.27 424.91 others 113.06 1.19 0.44 29.00 105.56 31.28 30.12 55.51 25.01 5.57 16.88 1.55 17.97 101.73 534.87
not recorded 142.36 0.37 0.00 21.34 70.88 30.20 4.51 42.62 5.30 2.82 13.31 1.01 13.14 18.09 365.96 all groups 108.55 1.06 0.34 26.07 85.58 27.78 29.27 48.23 20.28 4.46 15.14 1.45 18.41 92.53 479.13
household type: not recorde d
SC 120.85 0.67 0.00 29.23 83.20 27.89 49.39 45.08 13.65 5.47 14.49 2.08 16.89 43.83 452.73 ST 92.29 1.89 0.00 20.19 50.04 20.37 21.66 33.55 6.97 0.51 11.98 1.16 16.13 21.38 298.11
OBC 96.46 1.54 1.25 19.30 38.01 19.75 19.05 30.11 11.14 4.52 11.13 1.02 15.43 27.62 296.33 others 101.66 1.75 0.27 22.35 89.69 24.95 23.78 44.84 13.82 1.15 12.77 1.61 14.81 40.46 393.92
not recorded 77.84 1.20 0.00 16.40 47.29 14.90 9.26 37.65 6.93 0.89 12.41 1.16 8.87 34.80 269.62 all groups 97.31 1.49 0.50 20.92 60.01 21.43 22.58 37.34 11.01 2.67 12.25 1.34 14.53 33.23 336.62
household type: all
SC 113.08 0.64 0.28 21.37 46.91 22.71 30.11 39.86 10.39 3.02 11.72 1.35 13.96 41.25 356.64 ST 100.23 0.78 0.19 20.90 45.86 22.53 22.97 38.00 9.22 1.75 12.75 1.31 14.43 36.97 327.89
OBC 104.65 0.91 0.32 23.25 56.58 23.13 25.78 37.97 13.56 2.34 12.51 1.27 21.48 45.19 368.95 others 107.07 1.04 0.41 25.97 94.22 30.44 28.22 49.29 21.00 5.69 15.38 1.47 16.70 65.31 462.21
not recorded 116.26 0.81 0.59 19.45 57.88 21.08 21.58 38.76 11.76 1.84 11.78 1.28 12.93 48.71 364.71 all groups 105.58 0.95 0.35 24.25 74.17 26.81 26.78 43.90 16.67 4.01 14.00 1.38 17.73 54.28 410.84

Appendix Tables
NSS Report No.472: Differences in Level of Consumption among Socio-Economic Groups,1999-2000 A-263
Table 12U: Break-up of average MPCE by broad groups of non-food items for each socio-economic category of households all-India Urban
average per capita consumption expenditure (Rs) per 30 days on
social group pan, tobacco & intoxicants
fuel and light clothing footwear
misc. goods & services
durable goods
non-food total all
clothing (second hand)
durable goods
(second hand)
no. of sample hhs reporting consump tion
(1) (2) (3) (4) (5) (6) (11) (12) (13) (14) (15) (16) household type : self-employed
ST 18.85 50.66 42.47 8.60 173.20 22.69 316.48 662.40 0.43 0.18 777 SC 17.29 47.23 34.69 6.26 120.82 10.54 236.83 542.88 0.16 0.60 1572
OBC 14.39 50.42 41.50 6.83 184.85 19.75 317.74 675.18 0.15 0.27 5391 others 16.14 69.77 58.61 12.26 310.45 39.01 506.24 953.22 0.12 0.49 9864
not recorded 12.84 67.72 37.56 5.89 116.59 13.27 253.87 616.43 0.12 0.00 22 all groups 15.74 60.68 50.17 9.78 246.59 29.39 412.34 813.17 0.14 0.42 17626
18.85 50.66 42.47 8.60 173.20 22.69 316.48 662.40 0.43 0.18 777 household type: regular wage/salary earning
ST 23.01 59.32 54.34 10.57 246.86 33.62 427.72 835.20 0.35 0.32 1471 SC 21.55 54.57 46.96 8.78 212.94 26.77 371.57 754.89 0.21 0.76 2399
OBC 15.19 59.69 52.62 9.58 276.93 31.28 445.29 859.58 0.11 0.45 4862 others 15.68 74.86 65.95 13.85 393.38 45.94 609.66 1101.27 0.18 0.87 11600
not recorded 9.72 52.50 64.51 11.56 361.78 9.15 509.22 965.82 0.03 0.00 27 all groups 16.63 67.59 59.49 11.94 333.27 39.05 527.95 981.72 0.17 0.72 20359
household type: casual labour
ST 22.49 38.01 26.91 4.08 73.27 5.82 170.59 424.69 0.76 0.54 526 SC 18.94 40.35 28.31 4.57 94.85 9.08 196.10 463.80 0.40 0.40 1569
OBC 18.67 127.13 29.89 4.50 121.30 11.39 312.88 608.43 0.18 0.23 2184 others 17.64 44.42 33.02 5.28 126.73 11.62 238.71 548.85 0.16 0.09 1727
not recorded 10.27 34.61 28.86 4.11 115.01 0.99 193.86 588.52 0.49 0.00 18 all groups 18.66 74.68 30.13 4.71 112.61 10.46 251.26 540.86 0.27 0.26 6024
(Contd.)

Appendix Tables
NSS Report No.472: Differences in Level of Consumption among Socio-Economic Groups,1999-2000 A-264
Table 12U: Break-up of average MPCE by broad groups of non-food items for each socio-economic category of households all-India Urban
average per capita consumption expenditure (Rs) per 30 days on
social group pan, tobacco & intoxicants
fuel and light clothing footwear
misc. goods & services
durable goods
non-food total all
clothing (second hand)
durable goods
(second hand)
no. of sample hhs reporting consump tion
(1) (2) (3) (4) (5) (6) (11) (12) (13) (14) (15) (16) household type: others
ST 17.30 56.61 43.11 10.43 216.37 43.13 386.94 808.34 0.32 0.28 400 SC 12.67 46.58 38.68 7.19 174.64 14.57 294.32 649.69 0.37 0.02 433
OBC 12.22 62.16 52.06 8.89 272.31 28.36 435.99 860.91 0.11 0.03 1187 others 9.95 87.06 73.35 14.51 446.84 41.41 673.13 1208.00 0.03 0.36 2726
not recorded 9.07 78.48 30.73 3.52 117.97 3.92 243.69 609.65 0.00 0.00 4 all groups 11.20 74.30 62.19 11.94 357.47 34.82 551.92 1031.06 0.10 0.23 4750
household type: not recorded
ST 29.39 57.18 51.47 11.38 247.76 15.70 412.88 865.61 0.16 0.00 28 SC 12.16 42.71 30.23 9.83 179.06 44.38 318.38 616.49 0.00 0.00 12
OBC 20.19 37.22 39.68 6.17 131.58 15.73 250.56 546.89 0.24 0.24 44 others 9.40 61.64 46.86 10.49 256.76 13.93 399.08 793.00 0.00 0.00 49
not recorded 15.03 46.14 34.40 8.52 189.83 18.36 312.28 581.89 0.14 0.00 32 all groups 16.51 48.11 41.00 8.73 193.20 19.16 326.71 663.33 0.12 0.08 165
household type: all
ST 21.45 51.75 43.78 8.51 183.93 24.72 334.13 690.77 0.47 0.33 3202 SC 19.17 48.13 37.88 6.83 152.33 16.77 281.10 608.99 0.26 0.57 5985
OBC 15.33 68.01 43.73 7.44 209.01 22.57 366.09 735.04 0.14 0.31 13668 others 15.60 71.27 60.89 12.58 342.32 40.09 542.76 1004.97 0.14 0.61 25966
not recorded 11.97 51.40 41.86 7.79 206.46 10.91 330.39 695.09 0.16 0.00 103 all groups 16.22 66.26 51.76 10.05 268.93 30.85 444.07 854.92 0.17 0.50 48924

Appendix Tables
NSS Report No.472: Differences in Level of Consumption among Socio-Economic Groups,1999-2000 A-249
Table 12R: Break-up of average MPCE by broad groups non-food of items for each socio-economic category of households all-India Rural
average per capita consumption expenditure (Rs) per 30 days on size class of land
possessed (hectares)
pan, tobacco & intoxicants
fuel and light clothing footwear
misc. goods & services
durable goods
non-food total all
clothing (second hand)
durable goods
(second hand)
no. of sample hhs reporting consumption
(1) (2) (3) (4) (5) (6) (11) (12) (13) (14) (15) (16) household type : self-employed in non-agriculture social group: scheduled tribe <0.01 25.11 37.25 27.55 7.11 99.74 5.22 201.98 464.28 0.36 0.00 40 0.01-0.40 17.31 32.63 27.61 3.54 67.97 9.77 158.83 406.29 0.32 0.09 302 0.41-1.00 17.96 31.44 28.39 4.59 74.23 11.38 167.99 448.65 0.07 0.02 123 1.01-2.00 15.89 24.61 23.03 3.14 43.79 5.81 116.27 358.68 0.22 0.52 73 2.01-4.00 25.30 25.30 25.51 4.47 79.55 30.61 190.74 508.46 0.23 0.00 34 4.01+ 20.81 30.43 36.43 4.86 92.27 9.02 193.82 488.18 0.19 0.00 27 all sizes 18.46 31.41 27.35 4.06 70.21 10.20 161.69 420.37 0.26 0.12 599 social group: scheduled caste <0.01 12.74 37.06 29.36 4.62 88.55 12.63 184.96 459.33 0.13 2.84 173 0.01-0.40 13.62 35.33 28.88 4.29 78.47 8.30 168.88 428.40 0.18 0.12 1312 0.41-1.00 16.29 34.52 30.14 4.77 80.54 8.93 175.18 447.46 0.26 0.00 170 1.01-2.00 18.82 37.10 32.61 5.65 77.24 12.97 184.39 451.39 0.44 0.13 66 2.01-4.00 32.83 41.84 45.52 8.56 78.37 15.44 222.56 591.34 0.00 1.44 23 4.01+ 11.69 37.06 30.36 3.07 61.10 8.58 151.87 456.72 0.00 0.00 10 all sizes 14.18 35.55 29.36 4.45 79.49 9.04 172.07 435.67 0.19 0.38 1754 social group:other backward class <0.01 16.84 39.84 33.98 4.77 124.93 11.11 231.46 516.59 0.17 0.00 317 0.01-0.40 12.84 36.88 32.51 4.59 99.44 14.24 200.51 488.93 0.09 0.10 2927 0.41-1.00 11.14 36.97 33.16 4.88 91.96 10.09 188.20 472.19 0.04 0.12 536 1.01-2.00 11.82 36.38 37.94 5.36 105.63 16.73 213.86 510.53 0.03 0.51 205 2.01-4.00 18.95 40.45 42.71 6.13 149.80 33.16 291.20 620.26 0.03 0.49 105 4.01+ 22.87 48.05 45.55 8.36 177.50 58.54 360.87 765.15 0.00 2.16 58 all sizes 13.10 37.29 33.32 4.75 102.57 14.38 205.41 495.36 0.08 0.14 4148
(Contd.)

Appendix Tables
NSS Report No.472: Differences in Level of Consumption among Socio-Economic Groups,1999-2000 A-250
Table 12R: Break-up of average MPCE by broad groups non-food of items for each socio-economic category of households all-India Rural
average per capita consumption expenditure (Rs) per 30 days on size class of land
possessed (hectares)
pan, tobacco & intoxicants
fuel and light clothing footwear
misc. goods & services
durable goods
non-food total all
clothing (second hand)
durable goods
(second hand)
no. of sample hhs reporting consumption
(1) (2) (3) (4) (5) (6) (11) (12) (13) (14) (15) (16) household type : self-employed in non-agriculture social group: others <0.01 25.56 46.98 40.05 8.69 147.67 19.66 288.59 618.71 0.06 0.97 315 0.01-0.40 11.09 38.74 35.09 5.62 108.83 13.01 212.38 526.30 0.06 0.46 2560 0.41-1.00 12.26 43.28 40.03 6.75 133.47 18.31 254.10 603.42 0.74 1.51 535 1.01-2.00 15.31 41.02 44.42 8.17 149.15 18.77 276.84 635.41 0.00 0.00 243 2.01-4.00 13.41 49.02 46.56 9.64 170.61 27.34 316.60 709.82 0.09 3.45 134 4.01+ 17.63 55.44 54.60 11.72 175.24 63.11 377.74 791.47 0.10 0.00 81 all sizes 12.70 40.57 37.16 6.32 119.59 15.56 231.90 557.42 0.14 0.69 3868 social group: not recorded <0.01 14.81 33.24 33.52 4.01 116.55 5.38 207.51 451.63 0.00 0.00 8 0.01-0.40 29.75 27.83 36.19 4.20 138.85 17.68 254.49 628.62 0.00 0.00 2 0.41-1.00 3.99 43.44 65.26 9.93 98.78 10.91 232.32 551.53 0.00 0.00 3 1.01-2.00 34.47 28.84 64.30 6.18 260.89 6.27 400.94 835.72 0.00 0.00 2 2.01-4.00 0.00 0.00 0.00 0.00 0.00 0.00 0.00 0.00 0.00 0.00 0 4.01+ 7.00 35.76 26.94 1.15 52.40 11.51 134.76 396.46 0.00 0.00 1 all sizes 16.03 34.35 43.45 5.19 128.38 8.37 235.76 534.53 0.00 0.00 16 social group: all <0.01 19.06 41.31 34.61 6.08 123.03 13.82 237.91 533.45 0.13 0.93 853 0.01-0.40 12.54 37.07 32.51 4.85 97.47 12.48 196.93 487.06 0.10 0.23 7103 0.41-1.00 12.63 38.57 35.00 5.53 104.05 12.90 208.69 514.02 0.32 0.59 1367 1.01-2.00 14.67 36.87 37.95 6.14 110.51 15.67 221.81 530.00 0.10 0.27 589 2.01-4.00 18.15 42.73 42.83 7.66 146.75 29.14 287.26 645.87 0.07 1.79 296 4.01+ 19.29 47.88 46.62 8.77 154.85 49.68 327.09 711.59 0.06 0.81 177 all sizes 13.40 37.85 33.67 5.21 102.80 13.59 206.52 502.52 0.13 0.37 10385
(Contd.)

Appendix Tables
NSS Report No.472: Differences in Level of Consumption among Socio-Economic Groups,1999-2000 A-251
Table 12R: Break-up of average MPCE by broad groups non-food of items for each socio-economic category of households all-India Rural
average per capita consumption expenditure (Rs) per 30 days on size class of land
possessed (hectares)
pan, tobacco & intoxicants
fuel and light clothing footwear
misc. goods & services
durable goods
non-food total all
clothing (second hand)
durable goods
(second hand)
no. of sample hhs reporting consumption
(1) (2) (3) (4) (5) (6) (11) (12) (13) (14) (15) (16) household type: agricultural labour social group: scheduled tribe <0.01 15.86 30.24 25.58 2.89 61.47 3.88 139.92 361.15 1.04 0.21 188 0.01-0.40 15.68 28.52 23.09 2.47 47.01 4.92 121.68 334.37 0.38 0.01 1697 0.41-1.00 14.94 27.59 22.98 2.52 47.36 6.20 121.61 321.83 0.24 0.00 669 1.01-2.00 14.91 28.05 24.33 2.71 59.74 5.30 135.04 338.46 0.44 0.00 205 2.01-4.00 13.71 24.84 22.85 3.43 62.75 4.01 131.58 329.88 0.01 0.12 52 4.01+ 9.42 20.94 15.33 1.32 42.74 3.53 93.30 264.08 0.00 0.00 20 all sizes 15.34 28.21 23.28 2.55 49.59 5.18 124.15 332.74 0.38 0.02 2831 social group: scheduled caste <0.01 13.39 32.45 23.94 2.90 65.12 4.35 142.14 376.50 0.43 0.04 658 0.01-0.40 16.50 32.24 25.06 3.30 62.40 5.90 145.40 381.96 0.16 0.04 4590 0.41-1.00 14.66 27.57 25.48 3.06 60.30 5.12 136.19 357.77 0.08 0.01 600 1.01-2.00 13.55 24.76 29.46 4.03 73.89 7.36 153.04 381.83 0.07 0.00 139 2.01-4.00 14.77 28.30 35.28 3.76 66.36 10.64 159.12 402.90 0.00 0.00 38 4.01+ 7.85 29.79 32.32 4.97 108.24 8.11 191.29 421.69 0.00 0.00 9 all sizes 15.86 31.45 25.23 3.26 62.88 5.75 144.44 378.84 0.17 0.04 6034 social group:other backward class <0.01 12.44 32.26 25.33 2.91 71.55 5.31 149.80 396.12 0.60 0.03 593 0.01-0.40 12.12 31.18 25.73 2.96 68.55 6.38 146.93 399.17 0.14 0.04 4441 0.41-1.00 13.35 31.28 29.24 3.35 71.52 7.74 156.47 400.60 0.09 0.05 999 1.01-2.00 12.05 27.79 27.81 3.35 67.56 4.88 143.44 374.51 0.05 0.07 289 2.01-4.00 13.13 28.11 29.81 4.12 68.51 4.75 148.43 376.00 0.16 0.00 74 4.01+ 8.16 30.71 22.61 3.64 73.29 5.51 143.91 416.74 0.00 0.00 10 all sizes 12.36 31.02 26.48 3.07 69.24 6.40 148.57 397.27 0.17 0.04 6406 (Contd.)

Appendix Tables
NSS Report No.472: Differences in Level of Consumption among Socio-Economic Groups,1999-2000 A-252
Table 12R: Break-up of average MPCE by broad groups non-food of items for each socio-economic category of households all-India Rural
average per capita consumption expenditure (Rs) per 30 days on size class of land
possessed (hectares)
pan, tobacco & intoxicants
fuel and light clothing footwear
misc. goods & services
durable goods
non-food total all
clothing (second hand)
durable goods
(second hand)
no. of sample hhs reporting consumption
(1) (2) (3) (4) (5) (6) (11) (12) (13) (14) (15) (16) household type: agricultural labour social group: others <0.01 13.67 39.19 27.32 3.67 81.25 5.05 170.15 436.28 0.15 0.00 261 0.01-0.40 11.60 33.48 27.55 3.27 65.47 5.59 146.97 411.03 0.13 0.06 2522 0.41-1.00 11.77 34.75 30.35 4.11 86.24 7.20 174.42 441.71 0.08 0.00 413 1.01-2.00 15.48 31.55 31.32 4.32 86.53 3.92 173.12 421.22 0.05 0.00 150 2.01-4.00 12.04 32.47 34.66 4.57 105.99 7.77 197.50 479.07 0.44 0.00 55 4.01+ 10.76 41.08 33.03 7.67 233.44 10.60 336.58 698.82 0.00 0.00 13 all sizes 11.96 33.90 28.27 3.50 71.69 5.74 155.07 419.54 0.13 0.05 3414 social group: not recorded <0.01 2.44 32.89 33.28 2.30 60.52 0.00 131.43 477.61 0.00 0.00 2 0.01-0.40 7.24 24.36 17.99 2.76 56.56 5.58 114.48 372.79 0.05 0.00 9 0.41-1.00 0.00 38.58 25.99 2.33 222.70 0.00 289.60 490.27 0.00 0.00 1 1.01-2.00 0.00 0.00 0.00 0.00 0.00 0.00 0.00 0.00 0.00 0.00 0 2.01-4.00 0.00 51.25 44.90 5.65 146.75 6.17 254.71 419.71 0.00 0.00 1 4.01+ 0.00 0.00 0.00 0.00 0.00 0.00 0.00 0.00 0.00 0.00 0 all sizes 5.70 27.72 21.30 2.76 78.83 4.42 140.73 397.96 0.04 0.00 13 social group: all <0.01 13.39 33.11 25.10 3.01 69.21 4.72 148.53 390.15 0.52 0.05 1702 0.01-0.40 14.00 31.72 25.55 3.09 63.28 5.88 143.52 388.01 0.17 0.04 13259 0.41-1.00 13.79 30.04 27.03 3.21 65.55 6.64 146.26 378.23 0.12 0.02 2682 1.01-2.00 13.65 27.96 27.95 3.51 70.45 5.28 148.80 376.05 0.15 0.03 783 2.01-4.00 13.24 28.62 30.59 4.03 76.68 6.41 159.57 397.57 0.17 0.02 220 4.01+ 9.16 29.52 24.40 4.03 107.11 6.52 180.75 430.29 0.00 0.00 52 all sizes 13.87 31.31 25.95 3.14 64.84 5.88 145.00 386.29 0.19 0.04 18698 (Contd.)

Appendix Tables
NSS Report No.472: Differences in Level of Consumption among Socio-Economic Groups,1999-2000 A-253
Table 12R: Break-up of average MPCE by broad groups non-food of items for each socio-economic category of households all-India Rural
average per capita consumption expenditure (Rs) per 30 days on size class of land
possessed (hectares)
pan, tobacco & intoxicants
fuel and light clothing footwear
misc. goods & services
durable goods
non-food total all
clothing (second hand)
durable goods
(second hand)
no. of sample hhs reporting consumption
(1) (2) (3) (4) (5) (6) (11) (12) (13) (14) (15) (16) household type: other labour social group: scheduled tribe <0.01 23.51 31.58 30.76 6.32 108.84 6.21 207.23 474.79 0.15 0.00 37 0.01-0.40 19.51 37.47 27.54 4.13 59.81 6.44 154.90 392.48 0.11 0.03 447 0.41-1.00 18.45 41.21 27.57 4.34 60.88 9.91 162.36 382.46 0.04 2.95 157 1.01-2.00 18.27 31.00 33.40 4.05 54.35 7.86 148.93 361.87 0.28 0.24 28 2.01-4.00 22.32 31.07 32.39 3.95 68.98 6.99 165.70 355.67 0.32 0.00 14 4.01+ 5.64 42.22 80.53 10.90 98.30 29.82 267.40 559.92 0.00 0.00 5 all sizes 19.28 37.83 28.38 4.30 62.12 7.63 159.55 391.16 0.10 0.88 688 social group: scheduled caste <0.01 15.26 40.13 31.90 4.56 94.99 9.46 196.30 472.39 0.13 0.65 181 0.01-0.40 17.15 37.22 27.66 4.70 82.96 8.45 178.14 434.91 0.10 0.05 959 0.41-1.00 13.66 32.00 28.12 4.78 67.87 11.90 158.33 401.75 0.17 0.00 107 1.01-2.00 16.41 39.64 31.62 6.46 70.75 7.61 172.50 435.60 0.00 0.00 25 2.01-4.00 37.69 39.97 39.53 6.59 76.09 4.83 204.69 529.33 0.40 0.00 13 4.01+ 19.42 31.54 39.06 5.27 60.93 1.74 157.97 448.44 0.00 0.00 5 all sizes 16.85 37.23 28.55 4.75 82.81 8.75 178.94 438.27 0.11 0.12 1290 social group:other backward class <0.01 16.43 42.67 33.39 5.34 121.12 8.27 227.21 509.36 0.03 1.23 191 0.01-0.40 17.75 36.15 30.12 4.37 101.34 17.37 207.10 497.45 0.14 0.09 1477 0.41-1.00 20.78 34.66 32.77 4.68 83.42 20.55 196.85 471.58 0.43 0.09 151 1.01-2.00 17.11 37.50 33.05 5.23 96.22 9.28 198.40 500.62 0.49 0.73 59 2.01-4.00 22.64 38.55 34.65 6.42 84.01 5.76 192.03 507.21 0.00 0.00 17 4.01+ 24.20 41.43 37.85 8.65 43.84 8.65 164.62 480.22 0.00 0.00 7 all sizes 17.96 36.83 30.95 4.58 101.17 16.18 207.67 496.37 0.17 0.24 1902 (Contd.)

Appendix Tables
NSS Report No.472: Differences in Level of Consumption among Socio-Economic Groups,1999-2000 A-254
Table 12R: Break-up of average MPCE by broad groups non-food of items for each socio-economic category of households all-India Rural
average per capita consumption expenditure (Rs) per 30 days on size class of land
possessed (hectares)
pan, tobacco & intoxicants
fuel and light clothing footwear
misc. goods & services
durable goods
non-food total all
clothing (second hand)
durable goods
(second hand)
no. of sample hhs reporting consumption
(1) (2) (3) (4) (5) (6) (11) (12) (13) (14) (15) (16) household type: other labour social group: others <0.01 19.56 46.53 42.97 7.47 154.64 16.23 287.39 646.46 0.01 1.66 176 0.01-0.40 17.68 40.46 33.52 5.60 114.05 15.76 227.06 546.43 0.15 0.02 1157 0.41-1.00 14.54 39.98 34.35 6.09 114.52 28.24 237.73 537.70 0.00 0.42 129 1.01-2.00 22.41 34.63 33.71 5.33 107.35 30.14 233.57 520.05 0.03 1.96 34 2.01-4.00 11.06 30.70 38.82 8.99 122.21 4.61 216.39 520.91 1.42 0.00 10 4.01+ 12.63 39.71 39.17 8.91 198.77 6.07 305.26 630.28 0.00 0.00 3 all sizes 17.65 40.73 34.58 5.86 118.27 17.21 234.30 554.66 0.13 0.27 1509 social group: not recorded <0.01 0.00 0.00 0.00 0.00 0.00 0.00 0.00 0.00 0.00 0.00 0 0.01-0.40 10.00 19.17 30.30 14.25 71.08 0.00 144.79 396.23 0.00 0.00 1 0.41-1.00 0.00 0.00 0.00 0.00 0.00 0.00 0.00 0.00 0.00 0.00 0 1.01-2.00 0.00 0.00 0.00 0.00 0.00 0.00 0.00 0.00 0.00 0.00 0 2.01-4.00 0.00 0.00 0.00 0.00 0.00 0.00 0.00 0.00 0.00 0.00 0 4.01+ 0.00 0.00 0.00 0.00 0.00 0.00 0.00 0.00 0.00 0.00 0 all sizes 10.00 19.17 30.30 14.25 71.08 0.00 144.79 396.23 0.00 0.00 1 social group: all <0.01 17.05 42.21 34.91 5.60 119.41 10.34 229.51 526.09 0.07 1.08 585 0.01-0.40 17.73 37.66 30.08 4.75 95.73 13.51 199.47 483.20 0.13 0.05 4041 0.41-1.00 17.60 37.07 30.69 4.87 79.84 17.29 187.36 445.14 0.18 0.96 544 1.01-2.00 18.32 36.06 33.00 5.25 86.10 13.10 191.82 466.88 0.26 0.76 146 2.01-4.00 24.35 36.04 36.12 6.40 85.52 5.58 194.01 484.27 0.41 0.00 54 4.01+ 17.37 37.44 43.64 7.73 95.22 7.94 209.34 515.30 0.00 0.00 20 all sizes 17.74 37.99 30.89 4.91 95.95 13.47 200.96 482.96 0.14 0.29 5390 (Contd.)

Appendix Tables
NSS Report No.472: Differences in Level of Consumption among Socio-Economic Groups,1999-2000 A-255
Table 12R: Break-up of average MPCE by broad groups non-food of items for each socio-economic category of households all-India Rural
average per capita consumption expenditure (Rs) per 30 days on size class of land
possessed (hectares)
pan, tobacco & intoxicants
fuel and light clothing footwear
misc. goods & services
durable goods
non-food total all
clothing (second hand)
durable goods
(second hand)
no. of sample hhs reporting consumption
(1) (2) (3) (4) (5) (6) (11) (12) (13) (14) (15) (16) household type: self-employed in agriculture social group: scheduled tribe <0.01 24.82 37.72 30.18 3.13 49.77 1.55 147.18 398.17 0.27 0.00 22 0.01-0.40 22.03 44.70 29.92 5.05 70.22 8.77 180.68 461.57 0.67 0.00 407 0.41-1.00 19.60 34.95 26.87 4.44 58.35 9.86 154.07 417.34 0.53 0.04 1442 1.01-2.00 18.71 31.46 26.58 3.96 56.13 8.64 145.47 406.47 0.30 0.02 1501 2.01-4.00 19.69 29.11 28.29 4.14 58.28 8.77 148.26 400.98 0.43 0.04 1021 4.01+ 18.79 28.52 33.52 5.07 78.40 16.66 180.96 450.63 0.14 0.06 436 all sizes 19.36 31.99 28.02 4.29 60.27 9.81 153.74 414.91 0.39 0.03 4829 social group: scheduled caste <0.01 17.97 39.84 30.41 4.23 73.30 13.09 178.84 469.19 0.00 1.25 14 0.01-0.40 12.67 35.54 30.82 4.55 83.26 6.92 173.76 446.26 0.09 0.07 425 0.41-1.00 14.05 32.58 28.94 3.98 74.93 9.09 163.58 423.06 0.09 0.18 836 1.01-2.00 14.64 33.21 31.05 4.48 77.97 10.78 172.14 437.38 0.04 0.04 584 2.01-4.00 15.84 34.87 33.94 5.27 84.73 11.65 186.29 461.08 0.06 0.01 314 4.01+ 22.05 36.77 36.11 7.01 95.08 11.51 208.53 522.09 0.12 0.00 182 all sizes 14.78 33.83 30.97 4.58 79.69 9.75 173.60 442.43 0.07 0.09 2355 social group:other backward class <0.01 15.05 31.87 23.69 2.47 45.32 4.90 123.30 399.03 0.00 0.00 29 0.01-0.40 10.33 34.08 30.84 4.03 82.59 18.87 180.74 453.96 0.15 0.74 1216 0.41-1.00 10.69 33.41 32.40 4.46 86.44 12.80 180.20 463.06 0.05 0.09 2673 1.01-2.00 12.02 34.16 35.11 5.08 89.27 12.74 188.38 476.34 0.02 0.45 2316 2.01-4.00 13.86 35.90 37.28 5.95 94.26 14.98 202.23 502.85 0.09 0.11 1655 4.01+ 15.62 39.69 44.39 7.68 122.31 22.84 252.54 586.49 0.10 0.08 1449 all sizes 12.22 34.94 35.32 5.25 92.56 15.19 195.49 488.22 0.07 0.27 9338 (Contd.)

Appendix Tables
NSS Report No.472: Differences in Level of Consumption among Socio-Economic Groups,1999-2000 A-256
Table 12R: Break-up of average MPCE by broad groups non-food of items for each socio-economic category of households all-India Rural
average per capita consumption expenditure (Rs) per 30 days on size class of land
possessed (hectares)
pan, tobacco & intoxicants
fuel and light clothing footwear
misc. goods & services
durable goods
non-food total all
clothing (second hand)
durable goods
(second hand)
no. of sample hhs reporting consumption
(1) (2) (3) (4) (5) (6) (11) (12) (13) (14) (15) (16) household type: self-employed in agriculture social group: others <0.01 16.39 38.17 45.93 6.69 99.95 19.67 226.80 552.15 0.00 0.00 24 0.01-0.40 10.86 43.56 37.54 6.06 123.89 15.61 237.52 579.51 0.06 0.03 1246 0.41-1.00 11.38 41.08 38.35 6.41 106.24 14.93 218.39 548.89 0.03 0.13 2740 1.01-2.00 13.07 41.07 40.02 7.13 113.85 18.01 233.15 572.78 0.04 0.76 2439 2.01-4.00 13.89 43.28 46.03 8.15 136.31 25.83 273.49 638.63 0.02 2.71 2016 4.01+ 17.20 46.43 50.88 9.78 165.20 28.97 318.46 699.35 0.04 0.18 2117 all sizes 13.30 42.71 42.50 7.51 126.49 20.53 253.05 603.07 0.04 0.84 10582 social group: not recorded <0.01 0.00 0.00 0.00 0.00 0.00 0.00 0.00 0.00 0.00 0.00 0 0.01-0.40 9.21 32.45 16.88 2.78 41.50 1.22 104.04 353.18 0.00 0.00 5 0.41-1.00 31.34 74.37 42.66 11.76 101.06 21.87 283.07 779.13 0.00 0.00 5 1.01-2.00 15.43 39.80 49.80 6.43 89.09 8.09 208.63 579.98 0.00 0.00 10 2.01-4.00 10.89 29.13 26.19 5.85 93.79 15.35 181.21 584.09 0.00 0.00 4 4.01+ 17.39 36.23 37.41 4.25 188.78 6.70 290.77 547.41 0.00 0.00 6 all sizes 14.46 37.83 36.90 5.89 91.65 9.77 196.50 556.44 0.00 0.00 30 social group: all <0.01 17.02 35.81 31.85 4.06 66.44 10.26 165.43 455.18 0.03 0.25 89 0.01-0.40 11.40 38.12 33.13 4.86 96.57 15.50 199.59 497.20 0.13 0.36 3299 0.41-1.00 12.21 36.16 33.53 5.09 89.31 12.79 189.09 483.91 0.10 0.11 7696 1.01-2.00 13.59 36.20 35.32 5.61 92.47 13.88 197.07 497.78 0.07 0.46 6850 2.01-4.00 14.85 37.84 39.29 6.53 105.49 18.27 222.28 540.55 0.11 1.15 5010 4.01+ 16.99 41.89 46.22 8.45 138.24 24.74 276.53 626.90 0.08 0.13 4190 all sizes 13.68 37.50 36.84 5.95 100.77 16.09 210.82 519.75 0.09 0.44 27134 (Contd.)

Appendix Tables
NSS Report No.472: Differences in Level of Consumption among Socio-Economic Groups,1999-2000 A-257
Table 12R: Break-up of average MPCE by broad groups non-food of items for each socio-economic category of households all-India Rural
average per capita consumption expenditure (Rs) per 30 days on size class of land
possessed (hectares)
pan, tobacco & intoxicants
fuel and light clothing footwear
misc. goods & services
durable goods
non-food total all
clothing (second hand)
durable goods
(second hand)
no. of sample hhs reporting consumption
(1) (2) (3) (4) (5) (6) (11) (12) (13) (14) (15) (16) household type: others social group: scheduled tribe <0.01 9.52 26.47 43.33 8.08 116.40 17.93 221.73 533.59 0.33 0.00 157 0.01-0.40 19.73 39.99 39.31 6.55 121.84 17.56 244.98 582.12 0.26 0.31 389 0.41-1.00 20.72 43.83 36.03 6.35 98.34 13.42 218.68 541.35 0.46 0.45 191 1.01-2.00 31.81 42.07 36.25 7.47 138.44 11.90 267.94 613.84 0.85 0.00 146 2.01-4.00 25.43 37.45 31.09 7.24 89.88 11.22 202.31 512.45 0.82 3.17 162 4.01+ 34.42 41.02 38.20 6.83 117.46 28.11 266.04 614.47 0.34 0.00 113 all sizes 21.14 38.90 37.91 6.92 114.75 15.84 235.44 564.76 0.44 0.56 1158 social group: scheduled caste <0.01 8.83 39.55 46.08 8.69 167.87 9.39 280.40 606.05 0.06 0.05 186 0.01-0.40 15.63 47.00 38.17 35.27 129.43 14.73 280.23 592.90 0.12 0.03 865 0.41-1.00 11.64 36.46 37.25 6.61 106.14 17.50 215.59 521.10 0.43 0.30 154 1.01-2.00 12.44 40.79 35.52 5.83 95.53 16.64 206.74 536.27 0.03 0.10 58 2.01-4.00 11.20 41.42 43.11 9.32 180.24 15.73 301.02 660.08 0.00 0.00 31 4.01+ 7.62 33.46 42.47 6.99 104.79 7.94 203.28 493.26 0.00 0.00 16 all sizes 13.87 44.03 39.09 25.69 130.25 14.44 267.37 582.12 0.15 0.07 1310 social group:other backward class <0.01 22.29 48.16 45.87 9.73 212.31 21.19 359.55 705.31 0.35 0.07 298 0.01-0.40 10.28 44.95 38.72 6.02 140.40 13.71 254.09 584.38 0.18 0.42 1747 0.41-1.00 11.11 39.34 32.77 5.84 121.46 16.27 226.79 549.68 0.05 0.00 410 1.01-2.00 9.61 39.44 39.85 6.20 137.17 18.87 251.14 576.89 0.01 0.18 232 2.01-4.00 12.41 39.78 41.10 7.12 132.87 20.69 253.97 579.53 0.03 0.31 131 4.01+ 12.20 40.55 47.90 10.15 165.93 23.53 300.27 664.76 0.12 0.00 77 all sizes 11.65 43.55 38.88 6.50 144.32 15.83 260.73 591.46 0.15 0.29 2895 (Contd.)

Appendix Tables
NSS Report No.472: Differences in Level of Consumption among Socio-Economic Groups,1999-2000 A-258
Table 12R: Break-up of average MPCE by broad groups non-food of items for each socio-economic category of households all-India Rural
average per capita consumption expenditure (Rs) per 30 days on size class of land
possessed (hectares)
pan, tobacco & intoxicants
fuel and light clothing footwear
misc. goods & services
durable goods
non-food total all
clothing (second hand)
durable goods
(second hand)
no. of sample hhs reporting consumption
(1) (2) (3) (4) (5) (6) (11) (12) (13) (14) (15) (16) household type: others social group: others <0.01 10.90 50.23 53.71 10.75 259.56 15.58 400.72 772.94 0.03 0.12 517 0.01-0.40 12.91 52.27 48.83 9.36 189.03 27.35 339.75 733.60 0.08 1.99 2411 0.41-1.00 17.60 48.62 53.55 9.66 160.48 27.13 317.05 718.22 0.03 0.00 627 1.01-2.00 11.86 47.28 44.79 8.68 162.11 27.75 302.47 692.57 0.00 0.47 348 2.01-4.00 12.60 47.85 53.16 9.48 187.75 22.19 333.04 740.90 0.10 0.03 231 4.01+ 17.67 55.60 68.55 10.69 172.29 29.06 353.85 782.97 0.05 0.56 139 all sizes 13.38 50.99 50.55 9.55 190.46 25.77 340.69 734.60 0.06 1.23 4273 social group: not recorded <0.01 0.00 0.00 0.00 0.00 0.00 0.00 0.00 0.00 0.00 0.00 0 0.01-0.40 0.75 7.25 6.37 0.62 20.94 0.00 35.93 150.68 0.00 0.00 1 0.41-1.00 0.00 22.25 45.00 11.99 85.86 0.00 165.10 382.14 0.00 0.00 1 1.01-2.00 15.00 43.10 34.15 2.47 33.60 2.88 131.19 720.37 0.00 0.00 1 2.01-4.00 25.83 56.83 34.11 3.15 89.62 3.56 213.11 436.03 0.00 0.00 1 4.01+ 0.00 0.00 0.00 0.00 0.00 0.00 0.00 0.00 0.00 0.00 0 all sizes 13.81 40.56 33.20 2.86 37.15 2.60 130.18 664.91 0.00 0.00 4 social group: all <0.01 13.79 46.00 49.30 9.89 219.04 16.33 354.35 706.18 0.15 0.08 1158 0.01-0.40 12.76 48.37 43.17 12.51 159.52 20.15 296.48 652.49 0.13 1.05 5413 0.41-1.00 14.69 43.22 42.43 7.60 133.95 20.80 262.68 616.17 0.13 0.08 1383 1.01-2.00 12.81 43.15 41.24 7.33 144.02 21.81 270.36 626.21 0.08 0.28 785 2.01-4.00 14.21 43.71 46.05 8.48 158.03 19.87 290.36 658.09 0.17 0.54 556 4.01+ 16.83 47.92 57.37 9.85 159.63 25.60 317.20 708.01 0.10 0.30 345 all sizes 13.34 46.67 44.08 10.81 161.05 20.07 296.02 652.59 0.13 0.69 9640 (Contd.)

Appendix Tables
NSS Report No.472: Differences in Level of Consumption among Socio-Economic Groups,1999-2000 A-259
Table 12R: Break-up of average MPCE by broad groups non-food of items for each socio-economic category of households all-India Rural
average per capita consumption expenditure (Rs) per 30 days on size class of land
possessed (hectares)
pan, tobacco & intoxicants
fuel and light clothing footwear
misc. goods & services
durable goods
non-food total all
clothing (second hand)
durable goods
(second hand)
no. of sample hhs reporting consumption
(1) (2) (3) (4) (5) (6) (11) (12) (13) (14) (15) (16) household type: not recorded social group: scheduled tribe <0.01 0.00 0.00 0.00 0.00 0.00 0.00 0.00 0.00 0.00 0.00 0 0.01-0.40 20.63 34.99 31.12 9.47 75.38 3.15 174.72 514.68 0.00 0.00 4 0.41-1.00 12.00 27.00 37.56 6.58 200.33 0.00 283.47 612.11 0.00 0.00 1 1.01-2.00 0.00 0.00 0.00 0.00 0.00 0.00 0.00 0.00 0.00 0.00 0 2.01-4.00 21.43 61.29 19.49 35.23 44.06 0.00 181.50 618.35 0.00 0.00 1 4.01+ 7.59 25.10 21.55 2.54 59.66 6.48 122.91 358.14 0.93 0.00 13 all sizes 8.76 26.27 22.46 3.49 62.80 6.06 129.83 376.43 0.84 0.00 19 social group: scheduled caste <0.01 0.00 0.00 0.00 0.00 0.00 0.00 0.00 0.00 0.00 0.00 0 0.01-0.40 4.61 42.96 37.00 3.61 78.59 3.66 170.43 406.50 0.02 0.00 11 0.41-1.00 0.00 0.00 0.00 0.00 0.00 0.00 0.00 0.00 0.00 0.00 0 1.01-2.00 0.00 0.00 0.00 0.00 0.00 0.00 0.00 0.00 0.00 0.00 0 2.01-4.00 0.00 0.00 0.00 0.00 0.00 0.00 0.00 0.00 0.00 0.00 0 4.01+ 0.00 122.50 136.99 23.29 216.00 41.10 539.88 1179.54 0.00 0.00 1 all sizes 4.49 45.07 39.65 4.14 82.24 4.65 180.24 427.03 0.02 0.00 12 social group:other backward class <0.01 0.00 0.00 0.00 0.00 0.00 0.00 0.00 0.00 0.00 0.00 0 0.01-0.40 8.50 37.59 31.62 3.68 57.75 8.35 147.49 451.14 0.00 0.00 15 0.41-1.00 14.64 37.60 30.49 3.05 46.91 4.21 136.90 388.61 0.00 0.00 8 1.01-2.00 20.29 22.57 29.11 4.06 77.10 8.76 161.89 476.67 0.00 0.00 1 2.01-4.00 0.14 25.28 28.62 6.99 78.69 11.92 151.62 337.96 0.00 0.00 2 4.01+ 15.11 26.58 32.74 5.41 81.68 3.20 164.72 508.99 2.44 0.00 6 all sizes 9.52 34.76 31.04 4.15 60.46 7.35 147.29 426.68 0.24 0.00 32 (Contd.)

Appendix Tables
NSS Report No.472: Differences in Level of Consumption among Socio-Economic Groups,1999-2000 A-260
Table 12R: Break-up of average MPCE by broad groups non-food of items for each socio-economic category of households all-India Rural
average per capita consumption expenditure (Rs) per 30 days on size class of land
possessed (hectares)
pan, tobacco & intoxicants
fuel and light clothing footwear
misc. goods & services
durable goods
non-food total all
clothing (second hand)
durable goods
(second hand)
no. of sample hhs reporting consumption
(1) (2) (3) (4) (5) (6) (11) (12) (13) (14) (15) (16) household type: not recorded social group: others <0.01 3.00 52.00 12.33 8.22 303.46 55.68 434.70 668.57 0.00 0.00 1 0.01-0.40 13.94 50.64 52.70 8.51 82.24 8.05 216.08 620.62 0.00 0.00 10 0.41-1.00 11.62 42.64 32.82 3.92 78.09 8.80 177.90 519.30 0.00 0.00 7 1.01-2.00 0.00 54.80 0.00 0.00 83.16 4.93 142.89 456.09 0.00 0.00 1 2.01-4.00 0.00 0.00 0.00 0.00 0.00 0.00 0.00 0.00 0.00 0.00 0 4.01+ 45.84 76.04 83.35 6.66 224.43 17.06 453.38 1081.62 0.00 0.00 3 all sizes 12.33 47.97 41.03 6.17 88.91 9.72 206.12 577.90 0.00 0.00 22 social group: not recorded <0.01 14.03 27.44 25.94 3.09 69.26 6.92 146.68 393.13 0.03 0.00 31 0.01-0.40 8.70 22.78 32.83 5.47 69.96 5.75 145.48 413.64 0.00 0.00 13 0.41-1.00 11.43 41.30 37.42 9.17 68.26 3.22 170.78 437.95 0.00 0.00 3 1.01-2.00 11.93 18.89 26.39 3.36 58.67 5.49 124.72 388.95 0.00 0.00 2 2.01-4.00 47.02 74.49 20.08 2.36 42.75 0.00 186.70 588.40 0.00 0.00 3 4.01+ 20.00 81.20 16.93 3.78 108.00 0.00 229.91 766.11 0.00 0.00 1 all sizes 12.83 27.00 27.85 3.84 69.15 6.41 147.08 402.71 0.02 0.00 53 social group: all <0.01 13.72 28.13 25.56 3.23 75.81 8.28 154.74 400.83 0.03 0.00 32 0.01-0.40 9.71 39.11 39.02 5.62 71.90 6.69 172.05 485.70 0.00 0.00 53 0.41-1.00 12.60 40.71 32.39 3.97 69.25 6.88 165.79 473.86 0.00 0.00 19 1.01-2.00 6.16 37.44 12.98 1.67 71.98 5.34 135.58 426.99 0.00 0.00 4 2.01-4.00 4.44 30.51 27.56 8.18 74.42 10.48 155.58 369.79 0.00 0.00 6 4.01+ 9.33 28.22 25.55 3.27 68.17 6.59 141.14 407.01 1.09 0.00 24 all sizes 10.82 34.67 31.65 4.41 71.95 7.18 160.68 445.89 0.18 0.00 138 (Contd.)
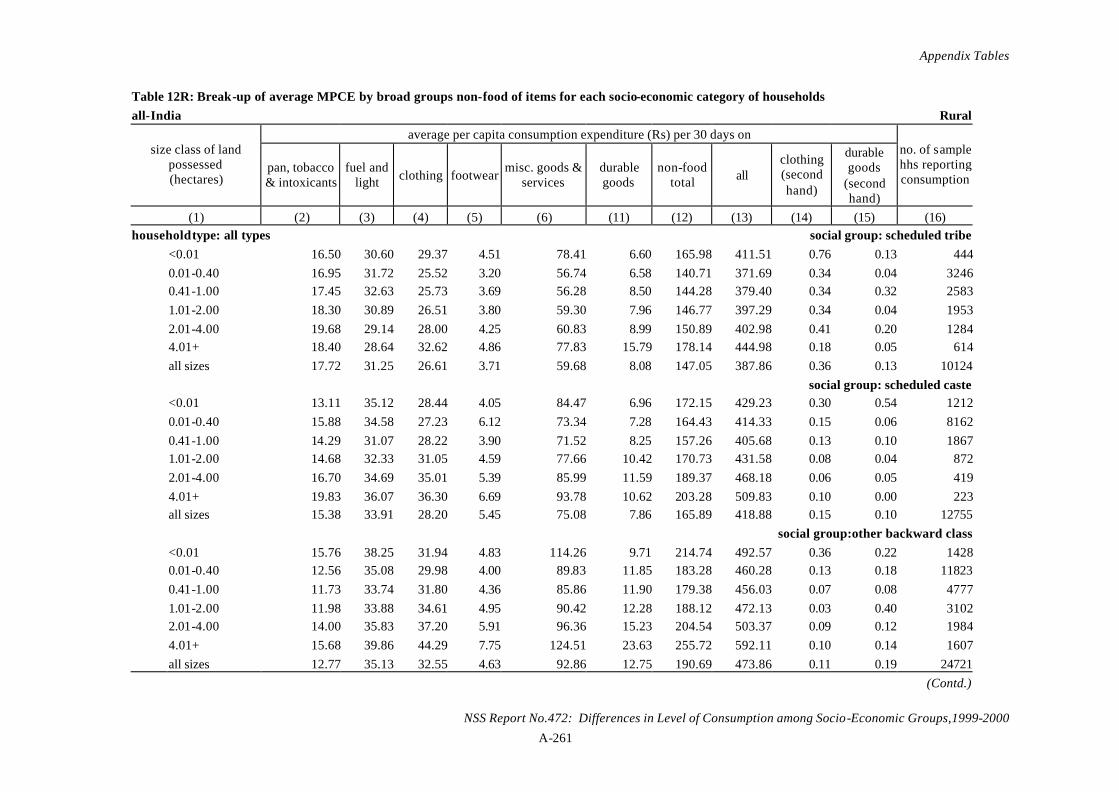
Appendix Tables
NSS Report No.472: Differences in Level of Consumption among Socio-Economic Groups,1999-2000 A-261
Table 12R: Break-up of average MPCE by broad groups non-food of items for each socio-economic category of households all-India Rural
average per capita consumption expenditure (Rs) per 30 days on size class of land
possessed (hectares)
pan, tobacco & intoxicants
fuel and light clothing footwear
misc. goods & services
durable goods
non-food total all
clothing (second hand)
durable goods
(second hand)
no. of sample hhs reporting consumption
(1) (2) (3) (4) (5) (6) (11) (12) (13) (14) (15) (16) household type: all types social group: scheduled tribe <0.01 16.50 30.60 29.37 4.51 78.41 6.60 165.98 411.51 0.76 0.13 444 0.01-0.40 16.95 31.72 25.52 3.20 56.74 6.58 140.71 371.69 0.34 0.04 3246 0.41-1.00 17.45 32.63 25.73 3.69 56.28 8.50 144.28 379.40 0.34 0.32 2583 1.01-2.00 18.30 30.89 26.51 3.80 59.30 7.96 146.77 397.29 0.34 0.04 1953 2.01-4.00 19.68 29.14 28.00 4.25 60.83 8.99 150.89 402.98 0.41 0.20 1284 4.01+ 18.40 28.64 32.62 4.86 77.83 15.79 178.14 444.98 0.18 0.05 614 all sizes 17.72 31.25 26.61 3.71 59.68 8.08 147.05 387.86 0.36 0.13 10124 social group: scheduled caste <0.01 13.11 35.12 28.44 4.05 84.47 6.96 172.15 429.23 0.30 0.54 1212 0.01-0.40 15.88 34.58 27.23 6.12 73.34 7.28 164.43 414.33 0.15 0.06 8162 0.41-1.00 14.29 31.07 28.22 3.90 71.52 8.25 157.26 405.68 0.13 0.10 1867 1.01-2.00 14.68 32.33 31.05 4.59 77.66 10.42 170.73 431.58 0.08 0.04 872 2.01-4.00 16.70 34.69 35.01 5.39 85.99 11.59 189.37 468.18 0.06 0.05 419 4.01+ 19.83 36.07 36.30 6.69 93.78 10.62 203.28 509.83 0.10 0.00 223 all sizes 15.38 33.91 28.20 5.45 75.08 7.86 165.89 418.88 0.15 0.10 12755 social group:other backward class <0.01 15.76 38.25 31.94 4.83 114.26 9.71 214.74 492.57 0.36 0.22 1428 0.01-0.40 12.56 35.08 29.98 4.00 89.83 11.85 183.28 460.28 0.13 0.18 11823 0.41-1.00 11.73 33.74 31.80 4.36 85.86 11.90 179.38 456.03 0.07 0.08 4777 1.01-2.00 11.98 33.88 34.61 4.95 90.42 12.28 188.12 472.13 0.03 0.40 3102 2.01-4.00 14.00 35.83 37.20 5.91 96.36 15.23 204.54 503.37 0.09 0.12 1984 4.01+ 15.68 39.86 44.29 7.75 124.51 23.63 255.72 592.11 0.10 0.14 1607 all sizes 12.77 35.13 32.55 4.63 92.86 12.75 190.69 473.86 0.11 0.19 24721 (Contd.)

Appendix Tables
NSS Report No.472: Differences in Level of Consumption among Socio-Economic Groups,1999-2000 A-262
Table 12R: Break-up of average MPCE by broad groups non-food of items for each socio-economic category of households all-India Rural
average per capita consumption expenditure (Rs) per 30 days on size class of land
possessed (hectares)
pan, tobacco & intoxicants
fuel and light clothing footwear
misc. goods & services
durable goods
non-food total all
clothing (second hand)
durable goods
(second hand)
no. of sample hhs reporting consumption
(1) (2) (3) (4) (5) (6) (11) (12) (13) (14) (15) (16) household type: all types social group: others <0.01 16.45 45.92 42.03 7.95 170.15 14.10 296.60 628.46 0.06 0.49 1294 0.01-0.40 12.29 40.42 35.46 5.64 112.61 13.98 220.39 537.57 0.10 0.54 9906 0.41-1.00 12.26 41.28 38.99 6.48 112.44 15.93 227.38 558.50 0.11 0.25 4451 1.01-2.00 13.37 40.81 39.92 7.08 117.27 17.95 236.40 573.89 0.04 0.66 3215 2.01-4.00 13.71 43.38 46.12 8.17 139.98 24.92 276.28 642.25 0.05 2.45 2446 4.01+ 17.17 47.01 51.61 9.85 166.41 29.57 321.63 705.24 0.05 0.19 2356 all sizes 13.22 41.80 39.71 6.77 123.69 17.55 242.73 577.56 0.08 0.69 23668 social group: not recorded <0.01 13.67 29.14 28.17 3.28 80.54 6.20 161.00 411.67 0.02 0.00 41 0.01-0.40 9.43 24.93 24.01 3.88 64.57 5.82 132.63 400.17 0.02 0.00 31 0.41-1.00 8.67 47.33 48.17 8.29 126.43 9.19 248.08 562.53 0.00 0.00 13 1.01-2.00 18.61 36.30 49.49 5.86 114.40 7.19 231.85 620.80 0.00 0.00 15 2.01-4.00 11.26 32.88 27.71 5.70 96.78 13.92 188.24 568.59 0.00 0.00 9 4.01+ 12.43 38.70 31.03 2.70 116.80 8.67 210.33 486.24 0.00 0.00 8 all sizes 12.51 31.09 31.77 4.39 87.12 7.11 173.99 464.59 0.01 0.00 117 social group: all <0.01 15.17 38.51 33.17 5.34 116.02 9.69 217.90 500.12 0.30 0.38 4419 0.01-0.40 13.74 36.17 30.41 4.98 89.08 10.77 185.14 462.37 0.14 0.24 33168 0.41-1.00 13.06 35.44 32.60 4.84 87.70 12.07 185.72 468.79 0.13 0.17 13691 1.01-2.00 13.70 35.62 34.84 5.47 93.55 13.35 196.53 491.27 0.08 0.39 9157 2.01-4.00 14.92 37.80 39.26 6.54 107.92 17.94 224.39 541.98 0.12 1.07 6142 4.01+ 16.89 42.02 46.24 8.42 138.51 25.00 277.07 627.82 0.08 0.15 4808 all sizes 13.96 36.56 33.28 5.37 95.42 12.76 197.36 486.16 0.14 0.32 71385