Differences between Liver and Hepatoma Cells in Their ... · PDF fileDifferences between Liver...
9
THE JOURNAL OFBIOLOGICAL CHEMISTRY Vol. 249, No. 18, Issue of September 25, pp. 5755-5762, 1974 Printed in U.S.A. Differences between Liver and Hepatoma Cells in Their Complements of Adenosine 3’ : SMonophosphate- binding Proteins and Protein Kinases* (Received for publication, November 8, 1973) CHARLES W. MACKENZIE, III,% AND ROBERT H. STELLWAGEN From the Department of Biochemistry, University of Southern California School of Medicine, Los Angeles, California 90033 SUMMARY The soluble fractions from both rat liver and an estab- lished hepatoma cell line (HTC cells) contain protein kinases and proteins which bind adenosine 3’: 5’-monophosphate (cyclic AMP). Liver cytosol exhibits somewhat more bind- ing activity and less protein kinase activity than HTC cells. Protein kinase activity from both sources is stimulated by cyclic AMP. Scatchard plots for the binding of cyclic AMP have been compared at pH 4 and 6.5. At both pH values, liver shows nonlinear plots which are increased in curvature and apparent aflinities by prior dialysis of the samples, mostly because of the removal of endogenous cyclic AMP. For HTC cells the Scatchard plot at pH 4 is also nonlinear and exhibits high binding affinity (KD < 0.5 naa), but prior dialysis is unneces- sary and the shape of the curve differs from that of liver. At pH 6.5, the binding affinity observed in HTC extracts (KD > 10 IBM) is lower than seen with liver and is insensi- tive to dialysis for a day or 2. However, this binding can be partially converted to higher affinity by aging or by over- night treatment at pH 4. The binding activity present in liver extracts is considerably less stable than that from HTC cells at pH 4 in the absence of cyclic AMP. Increasing the pH and adding cyclic AMP stabilize the binding activities from both sources. Much of the nonlinearity observed in the Scatchard binding plots is in the opposite direction from that caused by the instability of binding components at low concentrations of cyclic AMP. Chromatography on DEAE-cellulose shows that HTC ex- tracts lack one of two major cyclic AMP-stimulated protein kinase fractions which are present in liver. The deficiency seems to be due primarily to the absence of a cyclic AMP- binding fraction. Chromatographically analogous protein kinase peaks are present in both HTC and liver extracts, although their proportions differ. The cyclic AMP-binding fraction which is present only in liver is very labile at pH 4 and accounts for the greater instability of binding activity in * This investigation was supported by grants from the United States Public Health Service (CA 12563) and the Diabetes Associa- tion of Southern California. 1 Supported in part by a graduate fellowship from Bio-Science Laboratories, Van Nuys, California. liver extracts compared with HTC samples. HTC cells and liver also differ in the properties of the cyclic AMP-stimu- lated protein kinase fraction which is common to both. The activity of this chromatographic fraction from HTC cells is less responsive to cyclic AMP and has a lower binding affinity than that from liver. This lower HTC binding affinity can be increased by the same treatments which are effective with unfractionated extracts. The HTC? cell line m-as established in tissue culture by Thomp- son et al. (1) from a chemically induced rat hepatoma and still expresses some, though not all, functions characteristic of liver. The cells resemble liver in having an inducible tyrosine aminotransferase but differ in the hormonal inducers which are active. Whereas either glucocorticoids (2)) insulin (3)) glucagon (3), or catecholamines (4) can induce tyrosine aminotransferase in liver, only glucocorticoids and insulin have been found effec- tive in HTC cells (1, 5-7). In liver, glucagon and catechol- amines stimulate adenylate cyclase (8) and thereby cause an increase in the concentration of cyclic AMP (9). Cyclic AMP, in turn, brings about the intracellular effects of these hormones (lo), including the induction of tyrosine aminotransferase (4, 11). The very low adenylate cyclase activity detected in HTC cells (6, 12) may account for their failure to respond to glucagon and catecholamines. We have been investigating whether HTC cells also differ from liver in other aspects of the cyclic AMP system. The cell line has apparently retained at least some of the components needed to respond to cyclic AMP, since Stellwagen (7) has demonstrated that its tyrosine aminotransferase can be induced by exogenously added N6,02’-dibutyryl cyclic AMP (but not by cyclic AMP itself). However, the response requires rather high concentrations of the cyclic AMP derivative and is smaller than the induction in liver, which suggests possible differences in the cellular machinery mediating the effect. Since it is not known how cyclic AMP induces enzymes in eukaryotes, we 1 The abbreviations used are: HTC, hepatoma tissue culture; cyclic AMP, adenosine 3’:5’-monophosphate. 5755 by guest on May 2, 2018 http://www.jbc.org/ Downloaded from
Transcript of Differences between Liver and Hepatoma Cells in Their ... · PDF fileDifferences between Liver...
THE JOURNAL OF BIOLOGICAL CHEMISTRY Vol. 249, No. 18, Issue of September 25, pp. 5755-5762, 1974
Printed in U.S.A.
Differences between Liver and Hepatoma Cells in Their Complements of Adenosine 3’ : SMonophosphate- binding Proteins and Protein Kinases*
(Received for publication, November 8, 1973)
CHARLES W. MACKENZIE, III,% AND ROBERT H. STELLWAGEN
From the Department of Biochemistry, University of Southern California School of Medicine, Los Angeles, California 90033
SUMMARY
The soluble fractions from both rat liver and an estab- lished hepatoma cell line (HTC cells) contain protein kinases and proteins which bind adenosine 3’: 5’-monophosphate (cyclic AMP). Liver cytosol exhibits somewhat more bind- ing activity and less protein kinase activity than HTC cells. Protein kinase activity from both sources is stimulated by cyclic AMP.
Scatchard plots for the binding of cyclic AMP have been compared at pH 4 and 6.5. At both pH values, liver shows nonlinear plots which are increased in curvature and apparent aflinities by prior dialysis of the samples, mostly because of the removal of endogenous cyclic AMP. For HTC cells the Scatchard plot at pH 4 is also nonlinear and exhibits high binding affinity (KD < 0.5 naa), but prior dialysis is unneces- sary and the shape of the curve differs from that of liver. At pH 6.5, the binding affinity observed in HTC extracts (KD > 10 IBM) is lower than seen with liver and is insensi- tive to dialysis for a day or 2. However, this binding can be partially converted to higher affinity by aging or by over- night treatment at pH 4. The binding activity present in liver extracts is considerably less stable than that from HTC cells at pH 4 in the absence of cyclic AMP. Increasing the pH and adding cyclic AMP stabilize the binding activities from both sources. Much of the nonlinearity observed in the Scatchard binding plots is in the opposite direction from that caused by the instability of binding components at low concentrations of cyclic AMP.
Chromatography on DEAE-cellulose shows that HTC ex- tracts lack one of two major cyclic AMP-stimulated protein kinase fractions which are present in liver. The deficiency seems to be due primarily to the absence of a cyclic AMP- binding fraction. Chromatographically analogous protein kinase peaks are present in both HTC and liver extracts, although their proportions differ. The cyclic AMP-binding fraction which is present only in liver is very labile at pH 4 and accounts for the greater instability of binding activity in
* This investigation was supported by grants from the United States Public Health Service (CA 12563) and the Diabetes Associa- tion of Southern California.
1 Supported in part by a graduate fellowship from Bio-Science Laboratories, Van Nuys, California.
liver extracts compared with HTC samples. HTC cells and liver also differ in the properties of the cyclic AMP-stimu- lated protein kinase fraction which is common to both. The activity of this chromatographic fraction from HTC cells is less responsive to cyclic AMP and has a lower binding affinity than that from liver. This lower HTC binding affinity can be increased by the same treatments which are effective with unfractionated extracts.
The HTC? cell line m-as established in tissue culture by Thomp- son et al. (1) from a chemically induced rat hepatoma and still expresses some, though not all, functions characteristic of liver. The cells resemble liver in having an inducible tyrosine aminotransferase but differ in the hormonal inducers which are active. Whereas either glucocorticoids (2)) insulin (3)) glucagon (3), or catecholamines (4) can induce tyrosine aminotransferase in liver, only glucocorticoids and insulin have been found effec- tive in HTC cells (1, 5-7). In liver, glucagon and catechol- amines stimulate adenylate cyclase (8) and thereby cause an increase in the concentration of cyclic AMP (9). Cyclic AMP, in turn, brings about the intracellular effects of these hormones (lo), including the induction of tyrosine aminotransferase (4, 11). The very low adenylate cyclase activity detected in HTC cells (6, 12) may account for their failure to respond to glucagon and catecholamines.
We have been investigating whether HTC cells also differ from liver in other aspects of the cyclic AMP system. The cell line has apparently retained at least some of the components needed to respond to cyclic AMP, since Stellwagen (7) has demonstrated that its tyrosine aminotransferase can be induced by exogenously added N6,02’-dibutyryl cyclic AMP (but not by cyclic AMP itself). However, the response requires rather high concentrations of the cyclic AMP derivative and is smaller than the induction in liver, which suggests possible differences in the cellular machinery mediating the effect. Since it is not known how cyclic AMP induces enzymes in eukaryotes, we
1 The abbreviations used are: HTC, hepatoma tissue culture; cyclic AMP, adenosine 3’:5’-monophosphate.
5755
by guest on May 2, 2018
http://ww
w.jbc.org/
Dow
nloaded from
5756
have compared liver and HTC cells with the idea that differences between them might provide insight into the mechanism of this process.
In this comparison, we have emphasized cyclic AMP-binding proteins since they would seem to be essential for mediating the actions of cyclic AMP. One function of such proteins is clearly to serve as regulatory subunits for cyclic AMP-stimulated protein kinases (13-19). Consequently, we have also examined protein kinases in HTC cells and liver. Whether the kinases are involved in enzyme induction is not known, although this has been postulated (14, 20). The idea is supported by the recent finding that lymphoma cell mutants which are deficient in cyclic AMP-stimulated protein kinase also fail to show the usual induction of phosphodiesterase by cyclic AMP (21). A function has also been proposed for cyclic AMP-binding protein apart from protein kinases in the release of newly synthesized tyrosine aminotransferase from neonatal rat liver polysomes (22). By analogy with the results in bacteria (23), there may be still other functions for cyclic AMP-binding proteins.
The study reported here delineates the differences we have observed between liver and HTC cells in both cyclic AMP binding proteins and protein kinases. In making this com- parison, we have also observed some generally unrecognized properties of cyclic AMI-binding proteins. These include non- linear Scatchard (24) binding plots and extremely high apparent affinities for cyclic AMP. A more detailed examination of these properties and their potential significance is presented in an accompanying paper (25).
EXPERIMENTAL PROCEDURES
Materials-Cyclic AMP was purchased from Calbiochem. The cyclic [3H]AMP (22.1 to 24.1 Ci per mmole), [Y-~~P]ATP (5 to 10 Ci per mmole), and Omnifluor were obtained from New England Nuclear Corp. Bovine serum albumin and DEAE-cellulose (medium mesh, 0.89 meq per g) were from Sigma. Calf thymus histones (unfractionated) were from Schwarz-Mann, and AG 5OW-X4 resin (100 to 200 mesh) was purchased from Bio-Rad Labo- ratories. Sera and powdered medium for tissue culture were ob- tained from Grand Island Biological Co. Rats were purchased from Microbiological Associates, Inc., and were killed by decapita- tion before livers were removed and nlaced on ice. Adult male Buffalo rats were used since this is the type of rat from which HTC cells were derived (1). A culture of HTC cells was obtained from Dr. Gordon M. Tdmkins (University of California, San Francisco, Calif.).
Growoth of Cells-HTC cells were grown in spinner cultures at 37” in Swim’s 77 medium modified to contain (per liter) 50 mmoles of Tricine (N-tris(hydroxymethyl)methylglycine), 3 g of glucose, 0.5 g of NaHCOa, 0.3 g of n-glutamine, and 13.8 mg of n-cystine (26). Bovine and fetal calf sera which had been heated for 30 min at 56” were added at concentrations of 5% each. No antibiotics were present, and periodic tests of the cultures for mycoplasma (Microbiological Associates, Inc.) and bacteria were negative.
Cells were collected by centrifugation and washed with 0.14 M NaCl-O.01 M potassium-phosphate buffer, pH 7.6.
Cell Eztracts-Homoeenates of HTC cells and liver were nre- pared in 10 rnM Tris.HCl-O.5 rnM dithiothreitol, pH 7.6, wib a Dounce homogenizer. In most of the experiments described here, fresh samples were used for homogenization. However, the use of frozen cells or tissue yielded fairly similar results. A postmito- chondrial supernatant fraction was obtained by centrifuging for 15 min at 27,000 X g. This fraction was centrifuged for 90 min at 105,ooO X g to obtain the postmicrosomal supernatant fraction. All preparative procedures were performed at 0 to 4”. Protein concentrations were determined by the method of Lowry et al. (27) with bovine serum albumin as a standard.
Chromatographic Fractionationa-Postmicrosomal supernatant fractions were applied to a column (0.9 X 24 cm) of DEAE-cellu- lose equilibrated with 10 mM Tris. HC1-0.5 mM dithiothreitol buffer, pH 7.6. Elution was begun with the equilibrating buffer at a
flow rate of 40 ml per hour, and 5-ml fractions were collected. After at least 60 ml had been collected, a linear gradient of 0 to 0.4 M KC1 was applied in the eluting buffer (total volume = 240 ml). The salt concentration in the effluent was measured by con- ductivity.
Binding Assays-The binding of cyclic AMP to proteins was measured by a modification of the membrane filtration method of Gilman (28) as described in detail in the accompanying paper (25). For routine assays, the binding was allowed to take place forat least 2 hours at 0’;pH 4.0, and 17% nM cyclic AMP. Data for Scatchard bindine nlots were obtained at either DH 4.0 or 6.5 with binding times of-16 to 24 hours and cyclic AMP concentrations ranging from 0.1 to 175 nM. Blank values were measured by omitting protein (25). For Scatchard plots, the amount of cyclic AMP bound was corrected for this blank and the amount free was corrected for the presence of some radioactivity which was not cyclic AMP (about 5% of the total radioactivity added).
Protein Kinase Assays-Protein kinase was assayed in a final volume of 150 ~1 which contained 50 mM sodium glycerol phosphate buffer (pH 6.5), 10 mM magnesium acetate, 0.3 mM EGTA, 2 mM theophylline, 30 pg of histones (unfractionated), and either 2.5 or 100 JAM ]Y-~~P]ATP (0.1 to 0.7 &i per assay). Cyclic AMP (when present) was-5 PM, and enzyme was added-as 50 /;1 of the total vol- ume. The reaction was initiated bv adding the ~T-~~PIATP and cyclic AMP (when present). Incubations were carried out for 5 to 20 min at 30” with shaking (109 rpm). The reaction was termi- nated by transferring 100 ~1 to a numbered filter paper disc (What- man No. 3MM filter naner. 2.3 cm) and immersing the disc in a beaker of cold 200% t&hioroacetic acid. When all ihe paper discs from an experiment had been collected in the beaker, they were washed three times with cold 20% trichloroacetic acid, heated 15 min at 90” in 20% trichloroacetic acid, washed twice more with cold 20% trichloroacetic acid, washed twice with ethanol, and finally with ether. The paper discs were then dried and counted in 5 ml of 0.4% (w/v) Omnifluor in toluene. The counting efficiency using a Beckman LS-245 liquid scintillation spectrometer was greater than 95yn. The assay was used under conditions of approximate linearity with respect to time and enzyme concentration.
Phosphodiesterase Assays and Measurements of Cyclic AMP Breakdown-Phosphodiesterase was assayed at 37” in 40 mM Tris. HCl buffer, pH 8.0, containing 2 mM MgCls and 0.1 mM cyclic L3H]AMP (0.5 pCi) in a final volume of 100 ~1. The reaction was stopped by adding 100 ~1 of cold 10% trichloroacetic acid. After centrifugation for 5 min at 1000 X g, an aliquot (about 20~1) of the supernatant fraction was applied to Whatman No. 1 filter paper with carrier amounts of cyclic AMP, 5’.AMP, and adenosine. Ascending chromatography was performed at room temperature in a solvent composed of 30% (v/v) 1 M ammonium acetate and 70% (v/v) ethanol. Spots were detected by ultraviolet light, cut out, and counted as described elsewhere (25) for membrane filters. With all HTC extracts and with the chromatographic fractions from liver, the major reaction product was 5’-[aHlAMP. HOW- ever, crude liver extracts produced mainly [3H]adenosine, pre- sumably because of phosphatase action on 5’-[sH]AMP. In all cases, the reaction was linear with both time and enzyme concen- tration when the two breakdown products were summed.
To measure the breakdown of cyclic [“HIAMP during binding assays, protein was precipitated with 0.1 volume of 55% trichloro- acetic acid. This treatment was shown to release protein-bound radioactivity into the supernatant fraction. An aliquot of the supernatant fraction was then analyzed by the chromatographic procedure described above for phosphodiesterase assays.
Assay of Cyclic AMP-Cyclic AMP was assayed essentially by the method of Gilman (28), as modified by Manganiello and Vaughan (29). Cyclic AMP was extracted with 1.5 ml of 5% tri- chloroacetic acid, diluted to 3 ml after addition of cyclic PHIAMP tracer plus 150 pl of 1 N HCI, and applied to an AG 5OW-X4 column (6 X 0.5 cm) equilibrated with 0.05 N HCl. The column was
washed with 4 ml of 0.05 N HCI. The cyclic AMP was eluted with 5 ml of water, lyophilized, and reconstituted with 0.5 ml of 100 mre sodium phosphate buffer, pH 6.4. To 100 ~1 of the unknown was added 100 ~1 of Tris-dithiothreitol buffer containing 0.5 rg of protein kinase (Sigma), 5 ag of protein kinase inhibitor (Sigma), and 2 nM cyclic [“HIAMP to give a final pH of 6.5. Binding was determined after overnight incubation at 0” as described else- where (25).
by guest on May 2, 2018
http://ww
w.jbc.org/
Dow
nloaded from

RESULTS
Comparison of Amounts of Activity in Unpurijied Extracts- Extracts from both liver and HTC cells contain components which bind cyclic AMP. As shown in Table I, the specific activity is somewhat higher in liver although the difference is not large. In both cases the binding is extremely specific for cyclic AMP, as is shown in the accompanying paper (25). Protein kinases are also present in both liver and HTC cells, and in this case HTC cells exhibit the higher specific activity (Table I). Stimulation by cyclic AMP in these unpurified extracts is comparable in the two cases. The measurements of binding and protein kinase activities were made at saturating concentrations of cyclic AMP and ATP, respectively. The specific activities in both low and high speed supernatant frac- tions are fairly similar (Table I). Although the binding activity is quite stable in the refrigerator for several days, the protein kinase activity has some tendency to increase above the values shown in Table I during storage, especially with HTC extracts.
Comparison of Scatchard Plots for Cyclic AMP Binding-To compare the binding components in liver and HTC cells more thoroughly, we measured the binding as a function of the cyclic AMP concentration and used the data to construct Scatchard plots (24). We have employed a wide range of cyclic AMP concentrations in order to look for potential heterogeneity in the binding and have examined unpurified postmitochondrial super- natant fractions to minimize the possible loss of components. The binding reaction was allowed to take place overnight, which we found to be adequate for all the cyclic AMP concen- trations used (25). The presence of phosphodiesterase activity in the extracts restricted the pH values which could be employed in the absence of high concentrations of theophylline. Even though the assays were carried out at O”, a high percentage of the cyclic AMP was broken down during overnight incubations at pH values between 7 and 8. The problem was circumvented by lowering the pH. We have selected pH values of 4.0 and 6.5 for the binding studies shown here. At pH 4.0, the break- down of cyclic AMP is very low (about 1 y0 per day). We chose pH 6.5 as a second pH for study because it is close to physiological values and yet the cyclic AMP breakdown (in the absence of added Mg*f) is still sufficiently small (1 to 5% per day for liver and 2 to 13% per day for HTC cells) to allow bind- ing to be determined in the absence of theophylline.
When examining binding in unpurified preparations, the effect of endogenous cyclic AMP must also be considered.
TABLE I
Amounts of cyclic AMP-binding and protein kinase activities in extracts from liver and HTC cells
Binding activity was determined in an overnight incubation at pH 4 with 175 no cyclic [“HIAMP. Protein kinase was measured by 5 min of incubation with 100 PM [+P]ATP, either in the pres- ence or absence of cyclic AMP. Activities are expressed per mg of protein in the extract.
I Source of extract supernatant
fraction used
- I
Liver. 27,000 X g Liver. _. . 105,000 X g HTC. 27,000 x g HTC. 105,000 X g
‘rotein kinase activity
+ Cyclic AMP
pmoles/ $holes/ ?nin/mg min/mg
23 46 23 44 76 130 48 97
Binding activity
6.6 7.5 5.2 5.1
5757
Such unlabeled cyclic AMP would dilute the radioactive com- pound used to detect binding and might also mask some binding sites. For this reason, Scatchard plots were determined after dialysis of the extracts for various times. It was anticipated that prolonged dialysis might be needed, since others have reported difficulty in completely removing bound cyclic AMP (22, 30, 31) and we have found very slow release rates for some of the binding in HTC cells and liver (25).
The results of our binding measurements are shown in Fig. 1. For liver, the Scatchard plots at both pH 4 and 6.5 are mark- edly affected by prior dialysis (Fig. 1, A and C). In each case, dialysis increases the curvature and the apparent affinities (negative slopes) of the nonlinear plots obtained. The changes produced by the first day of dialysis are consistent with the removal of endogenous cyclic AMP amounting to 1 to 2 nM in the final binding assay. This is a reasonable level to expect since the reported cyclic AMP concentration in unstimulated liver is about 1 PM (9, 28, 32) and we have used a 700-fold dilu- t.ion in these assays. We have also measured the cyclic AMP present in a separate liver extract made under the same condi- tions and found 1 to 1.5 nM after dilution to the concentration of the assay. This endogenous cyclic AMP would substantially dilute the lower concentrations of cyclic [3H]AMP used and reduce the radioactivity bound, resulting in the lower apparent
A
I ) LIVER C pli 6.5
BOW
HTC B pti 41)
HTC cl Pii6.5
Most points are the average of duplicate binding assays.
FIG. 1. Scatchard plots for the binding of cyclic AMP in ex- tracts of liver and HTC cells. The concentration of cyclic [3H]- AMP bound was measured at the pH values indicated in 27,000 X g supernatant fractions which had been dialyzed for various times against Tris-dithiothreitol buffer at pH 7.6. A, liver assayed at pH 4.0 after dialysis for 0 (O--O), 1 (t - -m), or 10 (A-A) days. B, HTC cells assayed at pH 4.0 without dialysis. C, liver assayed at pH 6.5 after dialysis for 0 (O-O), 1 (C--m), 3 (V-Y), or 10 (A- --A) days. D, HTC cells assayed at pH
6.5afterdialysisforO(O---O),l(~~),or5(A---A)days.
by guest on May 2, 2018
http://ww
w.jbc.org/
Dow
nloaded from
5758
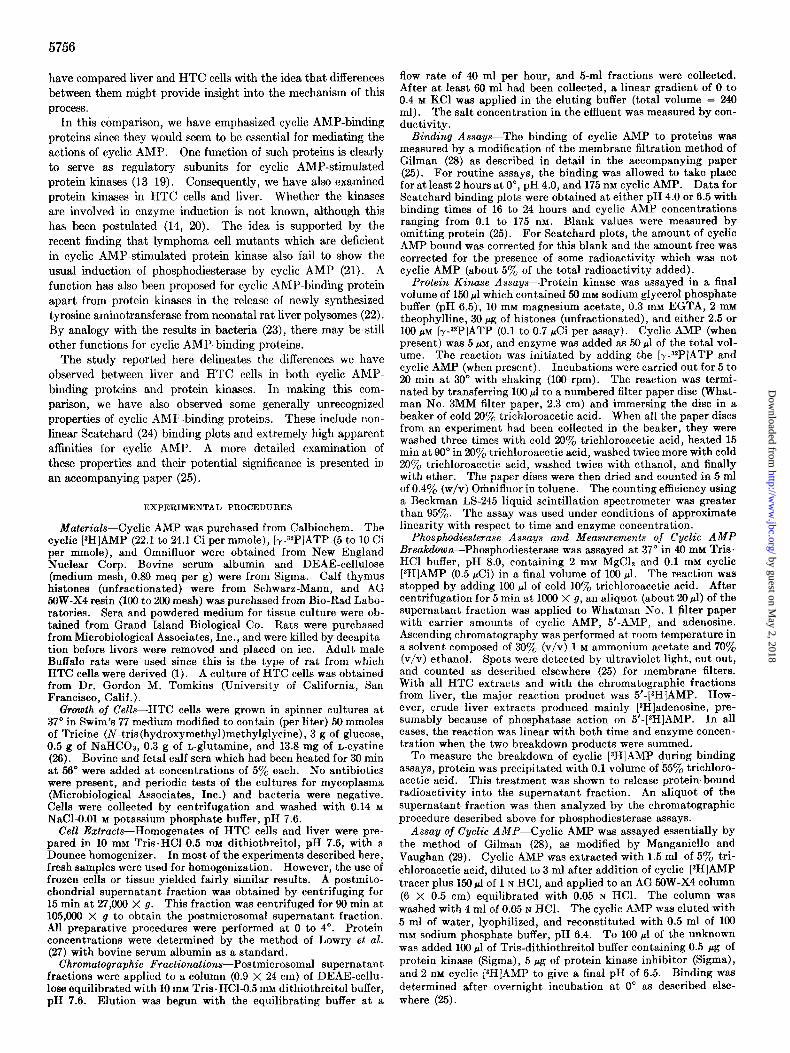
affinities observed and masking very high affinity binding. Dilution would be insignificant at the higher concentrations of cyclic [aH]AMP; and thus, the intercept on the “bound” axis would not be changed by endogenous cyclic AMP, provided that complete exchange occurred between bound endogenous cyclic AMP and free cyclic [aH]AMP. At pH 4 the “bound” intercept is fairly constant; but, at pH 6.5, it increases with dialysis (Fig. 1, A and C). This could be the result of less complete equilibration between endogenous and radioactive cyclic AMP resulting from the slower release rates observed at the latter pH (25).
Unlike liver, HTC extracts show high affinity binding at pH 4 without prior dialysis (Fig. lB), and the shape of the curve is not altered by dialysis (data not shown). This is consistent with the presence of less cyclic AMP in the HTC extracts, either because of a lower endogenous level (6) or a greater rate of breakdown during sample preparation. Indeed, our measure- ments of the endogenous cyclic AMP level in HTC cells (0.04 to 0.2 pmole per mg of total protein) correspond to <0.2 nM at the dilution used in the binding assay. The binding observed in HTC extracts at pH 6.5 is also unaffected by dialysis for a day or 2 (Fig. 1D). However, this binding is of much lower affinity than that found in liver (Fig. 1C).
The apparent binding affinity in HTC extracts at pH 6.5 does eventually increase if very prolonged dialysis is used (Fig. ID). The curve then becomes decidedly nonlinear and resembles somewhat more the HTC curve at pH 4 and the liver curves at pH 6.5 after dialysis. The increased curvature at pH 6.5 can be brought about more rapidly and more completely by exposing HTC extracts to pH 4 overnight (Fig. 2). The extremely long times required to obtain the effect by dialysis and its occurrence at pH 4 suggest that it does not involve the removal of cyclic AMP, but rather some other kind of alteration. A major con- trast between liver and HTC cells seems to be the difference in apparent affinities at pH 6.5. Even before dialysis, liver has higher apparent affinity and its difference from HTC extracts in- creases markedly with dialysis for a few days. High affinity binding in HTC cells is revealed only by pH 4 treatment or by extremely long dialysis (or storage) at pH 7.6. Preparation of the HTC extract with 0.25 M sucrose-3.3 mM CaC&-6 mM mercap- toethanol and diisopropyl fluorophosphate treatment as de- scribed by Kumon et al. (33) does not affect the low affinity bind- ing at pH 6.5 or its activation. Once the high affinity binding has been produced by pH 4 treatment of HTC extracts, it is not reversed by reincubating at pH 7.6 (Fig. 2).
The binding curves for liver and HTC cells at pH 4.0 also differ considerably in shape and are decidedly nonlinear (Fig. 1, A and B). In order to observe these nonlinear curves, it is essential to examine the binding at low concentrations of free cyclic AMP (<0.5 nM). The nonlinearity is not dependent upon our particular conditions for preparing extracts, since similar nonlinear results are obtained when the usual Tris- dithiothreitol homogenization buffer is modified by removal of dithiothreitol or by addition of sucrose, MgClz, or EDTA. Simi- lar binding has been observed in whole homogenates, postmito- chondrial and postmicrosomal supernatant fractions, and extracts from both frozen and fresh tissue. These results with crude ex- tracts are also not qualitatively altered by diisopropyl fluoro- phosphate treatment as described above. There are several possible reasons for this nonlinear behavior, and these are dis- cussed more fully in the accompanying article (25).
Stability of Binding Components-Although the binding activ- ity is very stable at pH 7.6, we have found that the stability is
FIG. 2 (left). The activation of high affinity binding in HTC extracts by treatment at pH 4.0. Binding was measured at pH 6.5 in undialyzed 27,000 X g supernatant fractions from HTC cells. The extracts were treated in the following ways before adjusting to pH 6.5 and adding cyclic [3H]AMP: O-O, no prior treat- ment; A--A, 24 hours at pH 4.0 (10 mM acetate); W---m, 24 hours at pH 4.0 followed by 24 hours at pH 7.6.
FIG. 3 (right). Effect of cyclic AMP on the stability of the bind- ing activity in extracts of liver and HTC cells. Supernatant frac- tions (27,000 X g) from liver (O-0, e-m) or HTC cells (O-0, O--U) were incubated in duplicate with various con- centrations of cyclic PHIAMP under the usual binding conditions at either (A) pH 6.5 or (B) pH 4.0. The liver supernatant fraction was dialyzed for several days before use. One set of duplicate samples was filtered after about 20 hours, and the measured amounts of bound cyclic [gH]AMP were used to calculate the con- centrations of free cyclic [3H]AMP. After 20 hours each tube in the second set of duplicate samples received enough cyclic [aH]AMP to bring the concentration to 175 nrvr. After incubating for an additional 2 hours, these samples were filtered to determine the total binding activity remaining. Losses are expressed as percentage of the binding observed in the samples which contained 175 nM cyclic AMP throughout the experiment.
lower at the pH values used in the assay, especially at pH 4. The stability in the assay is directly related to the concentration of cyclic AMP present, as shown in Fig. 3. Jn all cases, the bind- ing is stable at concentrations above 100 nM cyclic AMP. At pH 6.5, the loss of activity even at the lowest concentrations of cyclic AMP is fairly small (<S% for HTC cells and < 18% for liver). However, at pH 4 there is a large loss ( > 50%) of bind- ing activity in the liver preparation at the lowest cyclic AMP concentrations, but substantially less loss (<24%) in HTC ex- tracts. In contrast, preincubation of HTC extracts at pH 4.0 results in an increase in pH 6.5 binding measured at 175 nM cyclic AMP (Fig. 2). This is probably related to the activation phenomenon. Preincubation at pH 4.0 without cyclic AMP for a second day does result in the loss of 16% of the binding ob- served after the first day (data not shown).
The effect of the binding losses on the Scatchard plots shown in Fig. 1 would be to cause the observed binding to be too low at low concentrations of cyclic AMP. The plots would have had an even stronger upward curvature if no binding losses had occurred. Thus, these binding losses cannot account for the upward’curva- ture seen in most of our Scatchard plots. However, the binding instability could account for some of the complexity apparent in the curve for liver at pH 4 (Fig. IA). The middle range of this curve shows a partial plateau in bound/free ratio as the amount bound decreases. This change is in the direction ex- pected if a binding component were being increasingly lost as the
by guest on May 2, 2018
http://ww
w.jbc.org/
Dow
nloaded from

5759
cyclic AMP concentration decreased. The exact shape would depend upon the relative rates of loss and of binding, since cyclic AMP, once bound, appears to stabilize the binding sites. As the concentration of cyclic AMP is decreased below the middle range of the curve, the bound/jm value again increases, suggesting that binding is occurring to some other sites having greater sta- bility or a more rapid rate of binding.
Chromafographic Fractionation of Binding Proteins and Protein Kinuses-Additional comparisons of HTC cells and liver were based upon the elution profiles of binding and kinase activities from DEAE-cellulose. Fig. 4, A and C, illustrates the chromato- graphic differences between undialyzed extracts from the two sources. The liver elution profile has two regions where protein kinase and cyclic AMP-binding activities coincide (Fractions I and 4 in Fig. 4A). As shown below, these kinase fractions are stimulated by cyclic AMP. They probably correspond to cyclic AMP-stimulated protein kinases Bl and B2 observed in liver by Kumon et al. (33) and to the two kinases resolved by other workers from liver (34, 35) and other tissues (16, 36-38). In addition, the liver profile contains kinase activity, but no signifi- cant amount of binding, in the void volume and in Fraction 1. There is reduced binding relative to protein kinase activity in the trailing portion of the liver profile (Fraction 5). Finally, there is a major region of binding activity which appears free of kinase (Fructim 3). This is probably the R protein of Kumon et al. (33). Many of these fractions appear chromatographically heterogeneous.
As shown in Fig. 4C, the results with HTC cells are different. There is almost no binding activity in the position corresponding to kinase Bl of liver (Fraction .2), there is no peak of binding which appears separate from kinase activity, and kinase Fraction 5 is much larger than in liver. The apparent differences between the liver and HTC profiles were substantiated by mixing experi- ments. When liver Fraction %’ and HTC Fraction 4 were com- bined and rechromatographed, they remained as two distinct peaks. Liver binding Fraction S was eluted ahead of the HTC binding peaks (Fractions 4 and 5) when chromatographed with an HTC extract.
In order to determine whether differences in endogenous cyclic AMP or salts were contributing to the differences in elution pro- files, extracts were also chromatographed after dialysis at pH 7.6. This treatment did not affect the HTC profile except to eliminate the protein kinase peak in the void volume and increase somewhat the size of Fraction 1 (data not shown). The salt concentration in the undialyzed sample may have been high enough to prevent some of the kinase in Fraction 1 from binding to the resin. As shown in Fig. 4B, there were some additional changes in the elution profile for liver after dialysis. The free protein kinase peak in the void volume disappeared and that in Fraction 1 was greatly reduced. In addition, there was a relative increase in the first cyclic AMP-stimulated kinase (Froxfion 2) and a decrease in the free binding peaks (Fraction S). These results suggest the possible reassociation of some regulatory and catalytic subunits upon dialysis. Despite these changes, the liver profile is still very different from that obtained with HTC cells. Similar chromatographic differences between liver and HTC cells were also observed in extracts treated with diisopropyl fluorophosphate as described by Kumon et al. (33).
We wondered whether any of the cyclic AMP-binding peaks in these profiles might correspond to cyclic AMP phosphodies- terases. When phosphodiesterase was measured in the chro- matographic fractions, the major peak of activity in both HTC cells and liver was found in Fradion 5. However, the tubes of
6 I
Mialyzed)
HTC
FRACTION NUMBER
FIG. 4. Chromatographic comparison of cyclic AMP-binding proteins and protein kinases from liver and HTC cells. Post- microsomal supernatant fractions were chromatographed on DEAE-cellulose as described under “Experimental Procedures.” The KC1 gradient was begun at Fraction 21 in each case. Binding activity (O- - -0) was measured at pH 4 with 106,.J aliquots of effluent. Protein kinase activity (O---O) was determined in 50-J aliquots with a 15-min assay containing cyclic AMP and 2.5 pM [Y-~~P]ATP. Blank values have not been subtracted. The following samples were chromatographed: A, a fresh undialyzed extract from 1.8 g (wet weight) of liver; B, an extract identical with that in (A) but which had been dialyzed for 3 days against several changes of Tris-dithiothreitol buffer, pH 7.6; C, a fresh undialyzed extract from 1.6 X lo9 HTC cells. The solid bars indi- cate the grouping of fractions for further analysis.
maximum activity were offset from the nearest cyclic AMP bind- ing peaks. In liver, there was an additional minor peak of phos- phodiesterase activity which overlapped parts of Fractions S and 4.
by guest on May 2, 2018
http://ww
w.jbc.org/
Dow
nloaded from
5760
TABLE II
Effect of cyclic AMP on protein kinase fractions obtained from litter and HTC cells
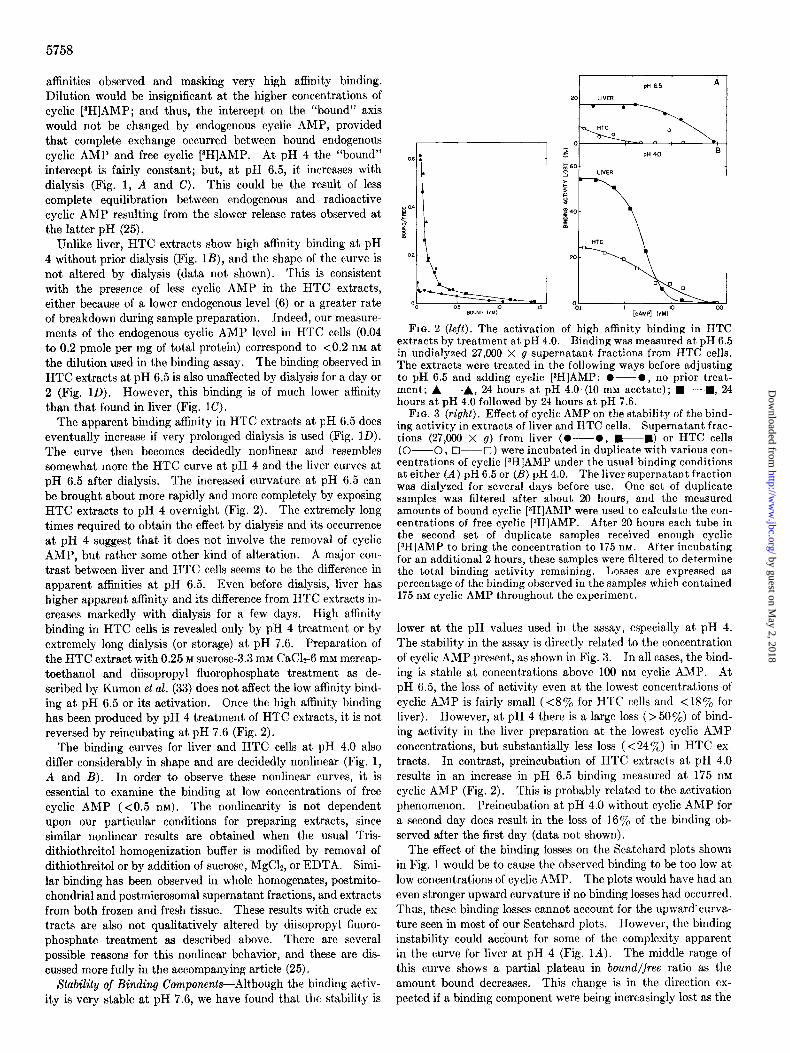
Protein kinase activity was determined by a 5-min reaction containing 2.5 NM [-@aP]ATP either with or without cyclic AMP. Stimulation is defined as the percentage of increase in activity caused by cyclic AMP. Each reaction contained enough kinase activit.v to transfer at least 0.1 pmole of phosphate per min. The samples were from tubes near the centers of the chromato- graphic fractions designated in Fig. 4 and were dialyzed for several days before analysis.
Stimulation by cyclic AMP Chromatographic fraction
Liver HTC
% % 1 0 4 2 710 6 4 225 85 5 0 15
-
Properties of Separated Protein Kinase Fractions-The protein kmases resolved by DEAE-cellulose chromatography were tested for their ability to be stimulated by cyclic AMP with histones as substrates (Table II). As expected, those kinase fractions which contain no binding activity (liver Fraction 1, HTC Fractions 1 and %‘) are not affected by cyclic AMP. The data in Table II also show that Fraction 5 from both liver and HTC cells is largely unresponsive to cyclic AMP. Although this fraction is not com- pletely separated from binding activity, its ratio of kinase to binding activity is very high. This protein kinase fraction is especially prominent in HTC cells, and its position of elution is similar to the “casein kinase” referred to by Kumon et al. (33). The protein kinase fractions which correspond to major peaks of binding activity (liver Fractions d and 4, HTC Fraction 4) are stimulated by cyclic AMP (Table II). The greatest effect is shown by liver Fraction 9, while HTC Fraction 4 is less responsive than the analogous liver fraction. The somewhat limited stimu- lation (<a-fold) given by the HTC fraction was not enhanced by increasing the cyclic AMP concentration used in the assay.
Properties of Separated Cyclic AMP Binding Fractions-The binding characteristics of the fractions resolved by chromatog- raphy were compared with each other and with the properties of the original extract. Since salt has a strong influence on the binding at pH 4 for both liver and HTC cells (25), the fractions were dialyzed before analysis. The Scatchard plots for liver Fraction B at pH 4 and at pH 6.5 are shown in Fig. 5. At pH 4, the curve passes through a maximum and then declines sharply as the concentration of bound cyclic AMP decreases. The de- cline is probably due to the extreme lability of this fraction at low concentrations of cyclic AMP, as demonstrated by the broken curve in Fig. 5A. At pH 6.5, binding Fraction 2 is more stable at all concentrations of cyclic AMP; and the Scatchard plot is more nearly linear, although there is still some downward curvature at very low cyclic AMP concentrations (Fig. 5B). The apparent KD for the linear part of the curve is 1.2 nM. Liver FractianS resembles Fraction 8 in its binding properties, although the lability at pH 4 and the curvature of the Scatchard plot are less severe (data not shown). The lability of liver Fractions 2 and S at pH 4 is reminiscent of that of part of the unfractionated liver binding activity. In contrast, the HTC chromatographic profile contains no binding components that are thii unstable at pH 4, in agreement with the greater stability of the binding in the original HTC extract (Fig. 3).
FIG. 5. Scatchard binding plots for liver chromatographic Fra& tion 8. Binding (O--O )-was determined at either ;H 4.0 (A) or DH 6.5 (B) on samnles which had been dialvzed for several davs against Tris-dithiothieitol buffer, pH 7.6.
., The activity remaining
(O---O) at the end of the incubation was determined with a duplicate set of samples by adding 175 nM cyclic [sH]AMP for the final 2 hours of the reaction time.
LIVER A
?
a5 1.0 1.5 BOUI
HTC 0
FIG. 6. Comparison of Scatchard binding plots at pH 6.5 for liver and HTC chromatographic Fraction 4. Binding of cyclic AMP was measured either immediately after chromatography (A- - -A) or following dialysis against Tris-dithiothreitol buffer
at pH 7.6 for 7 days (O--O). The activity remaining at the end of the binding assay (O--O) was determined with the dia- lyzed samples as described in the legend to Fig. 5. A, liver; B, HTC cells.
For Fraction 4 from both liver and HTC cells, the Scatchard plots obtained after dialysis are similar to each other. At both pH 6.5 (Fig. 6) and pH 4 (data not shown) the plots demonstrate upward curvature and apparent KD values less than 1 nM at the lowest cyclic AMP concentrations. The binding activity is relatively stable at pH 6.5 (Fig. 6). At pH 4, Fro&on 4 shows about 45% loss of binding activity at the lowest cyclic AMP concentrations, but this is still considerably less loss than observed with liver Fruc- lions 1 (Fig. 5A) or S. The binding properties of Fraction 5 were similar to those of Fraction 4 (data not shown). Little evidence was found for changes in the shape of the Scatchard plot with the position of elution within Fractions 4 and 5. Whatever factors contribute to the nonlinearity of these plots are apparently not resolved by the chromatographic system.
by guest on May 2, 2018
http://ww
w.jbc.org/
Dow
nloaded from

5761
Since the Scatchard plot obtained with the HTC chromato- graphic Fro&on 4 shows a relatively high affinity at pH 6.5 (Fig. 6B), a conversion has occurred from the low affinity form seen in crude extracts (Fig. 1D). To see whether this activation was brought about by the chromatography or by the subsequent. dialysis to remove salt, the binding was also analyzed within 1 day after elution from the column. This can be done without dialysis since binding at pH 6.5 is minimally affected by salt, in contrast to the marked effect at pH 4 (25). Also, the dilutions used in the binding assay were sufficient to lower the salt con- centrations below 50 mM. This experiment showed (lower curve in Fig. 6B) that activation was not brought about by chromatog- raphy itself, but required dialysis for several days after elution. The activation also occurred during storage without dialysis and seemed to take place somewhat more readily in the column fractions than in the crude extract. Unlike the HTC binding protein, liver Fraction 4 did not alter its Scatchard binding profile with time after chromatography (Fig. 6A). It exhibited the same nonlinear, high affinity type of plot even when analyzed soon after elution. This is in agreement with the differences between liver and HTC cells seen in the analyses of unfractionated extracts at pH 6.5 (Fig. 1, C and D).
DISCUSSION
This study has revealed several differences between HTC cells and liver. Analysis of the binding of cyclic AMP by the two cellular extracts has produced Scatchard plots which differ in shape. The added complexity of the liver binding curve at pH 4 correlates with the presence of binding component(s) which are quite labile at this pH when not complexed with cyclic AMP (25). The liver binding fraction which is especially unstable at pH 4 corresponds to the-first of two cyclic AMP-stimulated pro- tein kmases eluted from DEAE-cellulose (both of which may be heterogeneous). This chromatographic fraction is missing from HTC cells, which also have less labile binding in extracts ex- amined at pH 4.
Extracts from liver and HTC cells have fairly similar levels of binding activity relative to the total amounts of soluble protein they contain (about 30% greater for liver). However, at pH 6.5, the apparent afhnity of binding in HTC extracts is much lower than that in liver extracts. This difference becomes quite substantial after dialysis of the liver extracts for a few days, apparently due to removal of endogenous cyclic AMP. Such short times of dialysis do not increase the binding afhnity ob- served in preparations from HTC cells, which contain very little endogenous cyclic AMP. However, the higher affiity binding at pH 6.5 can be caused to appear in HTC extracts by aging or treatment at pH 4. Even the chromatographic fraction which is common to both HTC cells and liver (Fraction 4) appears to have lower affinity in the HTC case before activation. The need for this activation process, which seems to be irreversible, sug- gests that HTC cells may contain lower affinity binding than liver in tiuo.
The specific activity of protein kinase in HTC extracts is higher than that in liver preparations (by greater than a-fold). Upon elution from DEAE-cellulose, HTC samples contain all the pro- tein kinase peaks observed in liver, although the proportions differ. There is a large increase in HTC extracts of a protein kinase which appears late in the elution profile and is not stimu- lated by cyclic AMP. There are also two early eluting protein kinase fractions which do not respond to cyclic AMP The first of these corresponds to an unstimulated protein kinase peak in the liver profile, but the second HTC fraction differs from the
second liver fraction in that it lacks binding activity and is not stimulated by cyclic AMP. This is the binding fraction which appears to be missing from HTC cells. We do not know whether the free protein kinase in the first position in the HTC profile is analogous to the catalytic subunit of the first cyclic AMP- stimulated kinase in liver. However, the hepatic catalytic sub- unit found by Kumon et al. (33) does elute in this approximate position from DEAE-Sephadex.
A decrease compared to liver in a cyclic AMP-stimulated pro- tein kinase fraction has recently been observed in two rapidly growing hepatomas by Criss and Morris (39). Measurements of cyclic AMP-binding and protein kinase activities in HTC ex- tracts have also been made by Granner (40). Our studies agree with his observation that the ratio of binding protein to protein kinase activity is lower in HTC cells than in liver. However, his report differs quantitatively from ours in detecting only about 10% as much binding activity in HTC cells as in liver. One possible reason for this difference is the lower affinity we have observed for the HTC binding at pH 6.5. Granner’s assays were done at pH 5, where we also observe the binding affinity to be lower for HTC extracts than for liver.* His assay procedure, which involved a correction to eliminate nonspecific binding, may have underestimated the HTC binding because of its lower affinity. However, despite its lower affinity, we believe the HTC binding to be analogous to some of that observed in liver because it can be activated to higher affinity, resembles some liver components chromatographically, and has a high degree of specificity for cyclic AMP (25).
At this point, we can only speculate on the significance of the differences in binding properties between liver and HTC cells. Since derivatives of cyclic AMP can still induce tyrosine amino- transferase in HTC cells (7), components able to mediate this event must be present. Thus, the binding protein which is missing from HTC cells would appear to be excluded from a compulsory role in the induction process. Also the fact that the magnitude of the induction in HTC cells is rather low (7) could correlate with the less dramatic stimulation by cyclic AMP of their protein kinase fraction compared to liver. The lower affinity shown by HTC binding protein at pH 6.5, if also true in tiuo, could be the reason HTC cells respond only to very high doses of cyclic nucleotides (7). Thus, many of the characteris- tics of protein kinases and binding proteins from HTC cells do seem reasonably consistent with the physiological responses of the cells.
Acknowledgment-We wish to thank Mrs. Kulwant Kohli for her excellent technical assistance.
1.
2. 3.
4. 5.
6.
7.
8.
REFERENCES
THOMPSON, E. B., TOMKINS, G. M., AND CURRAN, J. F. (1966) Proc. Nat. Acad. Sci. U. S. A. 66, 296-303
KENNEY, F. T. (1962) J. Biol. Chem. 237, 34953498 HOLTEN, D., AND KENNEY, F. T. (1967) J. Biol. Chem. 34%
43724377 WICKS, W. D. (1969) J. Biol. Chem. 244, 3941-3950 GELEHRTI~R, T. D., AND TOMKINS, G. M. (1970) Proc. Nat.
Acad. Sci. U. S. A. 66, 39&397 GRANNER, D., CHASE, L. R., AURBACH, G. D., AND TOMKINS,
G. M. (1968) Science 162, 1018-1020 STELLWAGEN, R. H. (1972) Biochem. Biophys. Res. Commun.
47, 1144-1150 MAKMAN, M. H., AND SUTHERLAND, E. W. (1964) Endocrinol-
ogy 76. 127-134
2 C. W. Mackenzie, III. and R. H. Stellwagen, unpublished data.
by guest on May 2, 2018
http://ww
w.jbc.org/
Dow
nloaded from

9. EXTON, J. H., ROBISON, G. A., SUTHERLAND, E. W., AND PARK, 25. MACKENZIE, C. W., III, AND STELLWAGEN, R. H. (1974) C. R. (1971) J. Biol. Chem. 246, 6166-6177 J. Biol. Chem. 249, 5763-5771
10. ROBISON, G. A., BUTCHER, R. W., AND SUTHERLAND, E. W. 26. GARDNER, R. S. (1969) J. Cell Biol. 42, 320-321 (1971) Cyclic AMP, Ch. 6 and 7, Academic Press, New York 27. LOWRY, 0. H., ROSEBROUGH, N. J., FARR, A. L., AND RAN-
11. WICKS, W. D., KENNEY, F. T., AND LEE, K.-L. (1969) J. BioZ. DALL, R. J. (1951) J. BioZ. Chem. 193, 265-275 Chem. 244, 600&6013 28. GILMAN, A. G. (1970) Proc. Nat. Acad. Sci. U. S. A. 67, 305-
12. MAKMAN. M. H. (1971) Proc. Nat. Acad. Sci. U. S. A. 66, 2127- 312 2130
13. WALSH, D. A., PERKINS, J. P., AND KREBS, E. G. (1968) J. BioZ. Chem. 243, 3763-3765
14. Kuo, J. F., AND GREENGARD, P. (1969) Proc. Nat. Acad. Sci. U. S. A. 64. 1349-1355
15. GILL, G. N., AND GARREN, L. D. (1970) Biochem. Biophys. Res. Commun. 39, 335-343
16. TAO, M., SALAS, M. L., AND LIPMANN, F. (1970) Proc. Nat. Acad. Sci. U. S. A. 67, 40%414
17. KUMON, A., YAMAMURA, H., AND NISHIZUKA, Y. (1970) Bio- them. Biophys. Res. Commun. 41, 129&1297
18. REIMANN, E. M., BROSTROM, C. O., CORBIN, J. D., KING, C. A., AND KREBS, E. G. (1971) Biochem. Biophys. Res. Commun. 42. 187-194
19. ERLICHMAN, J., HIRSCH, A. H., AND ROSEN, 0. M. (1971) Proc. Nat. Acad. Sci. U. S. A. 66, 731-735
20. LANGAN, T. A. (1969) Proc. Nat. Acad. Sci. U. S. A. 64, 1276- 1283
21. BOURNE, H. R., TOMKINS, G. M., AND DION, S. (1973) Science 181, 952-954
22. DONOVAN, G., AND OLIVER, I. T. (1972) Biochemistry 11, 3904-3910
23. PASTAN, I., AND PERLMAN, R. (1970) Science 169, 339-344 24. SCATCHARD, G. (1949) Ann. N. Y. Acad. Sci. 61, 66&672
29. MANGANIELLO, V., AND VAUGHAN, M. (1972) Proc. Nat. Acad. Sci. U. S. A. 69, 269-273
30. WALTON, G. M., AND GARREN, L. D. (1970) Biochemistry 9, 4223-4229
31. BROSTROM, C. O., CORBIN, J. D., KING, C. A., AND KREBS, E. G. (1971) Proc. Nat. Acad. Sci. U. S. A. 66, 2444-2447
32. STEINER; A. L., PAGLIARA, A. S., CHASE, L. R., AND KIPNIS, D. M. (1972) J. BioZ. Chem. 247. 1114-1120
33. KUMON, A., N~SHIYAMA, K., YAM.&JRA, H, AND NISHIZUKA, Y. (1972) J. Biol. Chem. 247, 3726-3735
34. CHEN, L. J., AND WALSH, D. A. (1971) Biochemistry 10, 3614- 3621
35. EIL, C., AND WOOL, I. G. (1971) Biochem. Biophys. Res. Com- mun. 43, 100-1009
36. REIMANN, E. M., WALSH, D. A., AND KRERS, E. G. (1971) J. BioZ. Chem. 246, 1986-1995
37. SPAULDING, S. W., AND BURROW, G. N. (1972) Endocrinology 91 l 1343-1349
38. TRAUGH, J. A., MUMBY, M., AND TRAUT, R. R. (1973) Proc. Nat. Acad. Sci. U. S. A. 70, 373-376
39. CRISS, W. E., AND MORRIS, H. P. (1973) Biochem. Biophys. Res. Commun. 64, 380-386
40. GRANNER, D. K. (1972) Biochem. Biophys. Res. Commun. 46, 1516-1522
by guest on May 2, 2018
http://ww
w.jbc.org/
Dow
nloaded from
Charles W. Mackenzie III and Robert H. StellwagenAdenosine 3':5'-Monophosphatebinding Proteins and Protein Kinases
Differences between Liver and Hepatoma Cells in Their Complements of
1974, 249:5755-5762.J. Biol. Chem.
http://www.jbc.org/content/249/18/5755Access the most updated version of this article at
Alerts:
When a correction for this article is posted•
When this article is cited•
to choose from all of JBC's e-mail alertsClick here
http://www.jbc.org/content/249/18/5755.full.html#ref-list-1
This article cites 0 references, 0 of which can be accessed free at
by guest on May 2, 2018
http://ww
w.jbc.org/
Dow
nloaded from