Dieses Dokument wurde von einer Papierkopie gescannt und ... · BMT/3/2 page 5 1 8 9 enzymes have...
23
d:\users\renardy\appdata\local\microsoft\windows\temporary internet files\content.outlook\57qo7ps0\disclaimer_scanned_documents.docx Disclaimer: unless otherwise agreed by the Council of UPOV, only documents that have been adopted by the Council of UPOV and that have not been superseded can represent UPOV policies or guidance. This document has been scanned from a paper copy and may have some discrepancies from the original document. _____ Avertissement: sauf si le Conseil de l’UPOV en décide autrement, seuls les documents adoptés par le Conseil de l’UPOV n’ayant pas été remplacés peuvent représenter les principes ou les orientations de l’UPOV. Ce document a été numérisé à partir d’une copie papier et peut contenir des différences avec le document original. _____ Allgemeiner Haftungsausschluß: Sofern nicht anders vom Rat der UPOV vereinbart, geben nur Dokumente, die vom Rat der UPOV angenommen und nicht ersetzt wurden, Grundsätze oder eine Anleitung der UPOV wieder. Dieses Dokument wurde von einer Papierkopie gescannt und könnte Abweichungen vom Originaldokument aufweisen. _____ Descargo de responsabilidad: salvo que el Consejo de la UPOV decida de otro modo, solo se considerarán documentos de políticas u orientaciones de la UPOV los que hayan sido aprobados por el Consejo de la UPOV y no hayan sido reemplazados. Este documento ha sido escaneado a partir de una copia en papel y puede que existan divergencias en relación con el documento original.
Transcript of Dieses Dokument wurde von einer Papierkopie gescannt und ... · BMT/3/2 page 5 1 8 9 enzymes have...

d:\users\renardy\appdata\local\microsoft\windows\temporary internet files\content.outlook\57qo7ps0\disclaimer_scanned_documents.docx
Disclaimer: unless otherwise agreed by the Council of UPOV, only documents that have been adopted by the Council of UPOV and that have not been superseded can represent UPOV policies or guidance. This document has been scanned from a paper copy and may have some discrepancies from the original document. _____ Avertissement: sauf si le Conseil de l’UPOV en décide autrement, seuls les documents adoptés par le Conseil de l’UPOV n’ayant pas été remplacés peuvent représenter les principes ou les orientations de l’UPOV. Ce document a été numérisé à partir d’une copie papier et peut contenir des différences avec le document original. _____ Allgemeiner Haftungsausschluß: Sofern nicht anders vom Rat der UPOV vereinbart, geben nur Dokumente, die vom Rat der UPOV angenommen und nicht ersetzt wurden, Grundsätze oder eine Anleitung der UPOV wieder.
Dieses Dokument wurde von einer Papierkopie gescannt und könnte Abweichungen vom Originaldokument aufweisen. _____ Descargo de responsabilidad: salvo que el Consejo de la UPOV decida de otro modo, solo se considerarán documentos de políticas u orientaciones de la UPOV los que hayan sido aprobados por el Consejo de la UPOV y no hayan sido reemplazados. Este documento ha sido escaneado a partir de una copia en papel y puede que existan divergencias en relación con el documento original.

'i 8 5
BMT/3/2 ( UPOV) ORIGINAL : English
DATE: July 5, 1995
IN!ERNATIONAL UNION FOR THE PROTECTION OF NEW VARIETIES OF PLANTS
GENEVA
WORKING GROUP ON BIOCHEMICAL AND MOLECULAR TECHNIQUES
AND DNA-PROFILING IN PARTICULAR
Third Session
Wageningen, Netherlands, September 19 to 21, 1995
IDENTIFICATION METHODS BASED ON MOLECULAR TECHNIQUES
Document prepared by experts from Belgium

'] 8 6 BMT/3/2 page 2
Identification methods based on molecular techniques
M. De Loose<1> and G. Gheysen<2>
<1> Rijksstation voor Plantenveredeling - Centrum voor Landbouwkundig Onderzoek Burg. Van Gansberghelaan 109, B-9820 Merelbeke, Belgium
<2> Laboratorium voor Genetica- Universiteit Gent K. Ledeganckstraat 35, B-9000 Gent, Belgium
1. Introduction
Plant breeding and plant identification have been carried out by man already for a very long time. By making crosses between individual plants with a better yield or a better taste, people tried to produce varieties that were more attractive for consumption. The first selections have been carried out many years ago and modem breeders were able to improve these selections resulting in high productive arable crops. Because the lack of knowledge on the genes involved in the expression of economically important traits, the development was based on the selection of individual plants with the desired phenotype. Also the registration and identification of varieties is till now based on phenotypic characteristics; e.g. morphological and physiological characteristics. However the phenotype is only partially determined by the genetic information (the DNA). The impact of the genotype can be masked by environmental factors. By using molecular identification techniques it becomes possible to detect directly specific fragments of genetic information and to follow these fragments in crossing experiments. This will make the breeding process more efficient and faster. The molecular DNA marker technology makes it possible to characterise and identify individual plants, ecotypes and plant varieties at the genotypic level. This allows in a very quick way to distinguish plants and varieties, and to determine relationships.
2. Molecular markers
The heritable information of each organism is present in its genes. These are distributed over the chromosomes. The information is coded by the succession of bases in the DNA. The controlled expression of the genes determines the development and the properties of an organism. Expression of a gene (via a messenger RNA) results in the synthesis of a protein. Two main groups of proteins can be distinguished: structural proteins and proteins which have enzymatic activity. The enzymes are essential for the metabolic processes in the cell, by which molecules are biochemically changed. The organised production of proteins and metabolites results in the differentiation of certain cell types and finally in the specific properties of an organism. All genetically determined differences between individuals are a reflection of changes in DNA sequences. These DNA changes can be demonstrated in different ways: directly on the DNA or indirectly via the gene products or metabolites (changes in proteins, enzymes, metabolites or visual properties). Under molecular identification techniques in the broad sense one can classify all methods by which molecules are being analyzed: DNA, a direct gene product (RNA and protein) or metabolites. All these molecules can be used as markers to follow a certain property or to identify plants and varieties. However most of the time

BMT/3/2 page 3
1 8 ?
one uses the more strict meaning in which molecular markers are synonym for DNA markers (Philips & Vasil, 1994).
3. Protein polymorphisms
Differences in proteins can be detected after separation by gelelectrophoresis. Total protein extracts can be separated according to their molecular weight by denaturing sodiumdodecylsulphate gelelectrophoresis (SDS-PAGE). After staining a very informative but complex pattern is obtained, which however can be very strongly influenced by non-genetic parameters. For the analysis of iso-enzymes (Fig.1) total protein extracts are separated by non-denaturing gelelectrophoresis. After incubation with a chromogenic substrate a coloured band will be formed at the position where the specific enzyme activity is located (Selander et al., 1986). In this way migration differences between iso-enzymes can be detected. This method is easy to apply and quite reliable. The reproducibility however depends on the developmental stage and the conditions of the plant tissues used in the analysis. A few examples of applications with plants have been described by Manganaris & Alston (1988) and Rajora et al. (1991).
Figure 1 : Schematic overview of an iso-enzyme analysis. At the position where the enzyme is migrated after electrophoresis the chromogenic substrate changes in a coloured visual band. Amino acid changes in the enzyme can lead to a different migration which result in a coloured band in another position.
4. DNA polymorphisms
The genome length is very different for the different plant species. It varies from 108
(Arabidopsis thaliana) to more than 1010 (wheat, tulip) base pairs (Arumuganathan & Earle, 1991), which are distributed over a specific number of chromosomes. Each diploid individual contains two copies of each chromosome, one copy originates from the mother and the other copy from the father. These copies are nearly identical except for small differences. The differences between the maternal and the paternal copy are variations in the DNA sequence. These are the so called DNA sequence polymorphisms. These polymorphisms are the molecular basis of the genetically determined phenotypical differences between the individuals. DNA sequence polymorphisms can be divided into different classes: 1 Base pair polymorphisms: changes, addition or deletion of a base 2 DNA sequence reorganisations: deletion, insertion, inversion or duplication of a DNA segment. 3 Expansion - contraction polymorphisms: head-to-tail (tandem) repetitions of a certain sequence motif (1 to a few bases long per unit). There exists a big variation in the number of repetitions. DNA polymophisms occur much more frequently than protein polymorphisms. The first reason is that not all changes in the DNA sequence in a gene are leading to a (detectable) difference in the corresponding protein. The second and ~ore important reason is the fact that in most of the plants 95% of the DNA is not coding for any protein.
'j 8 8 BMT/3/2 page 4
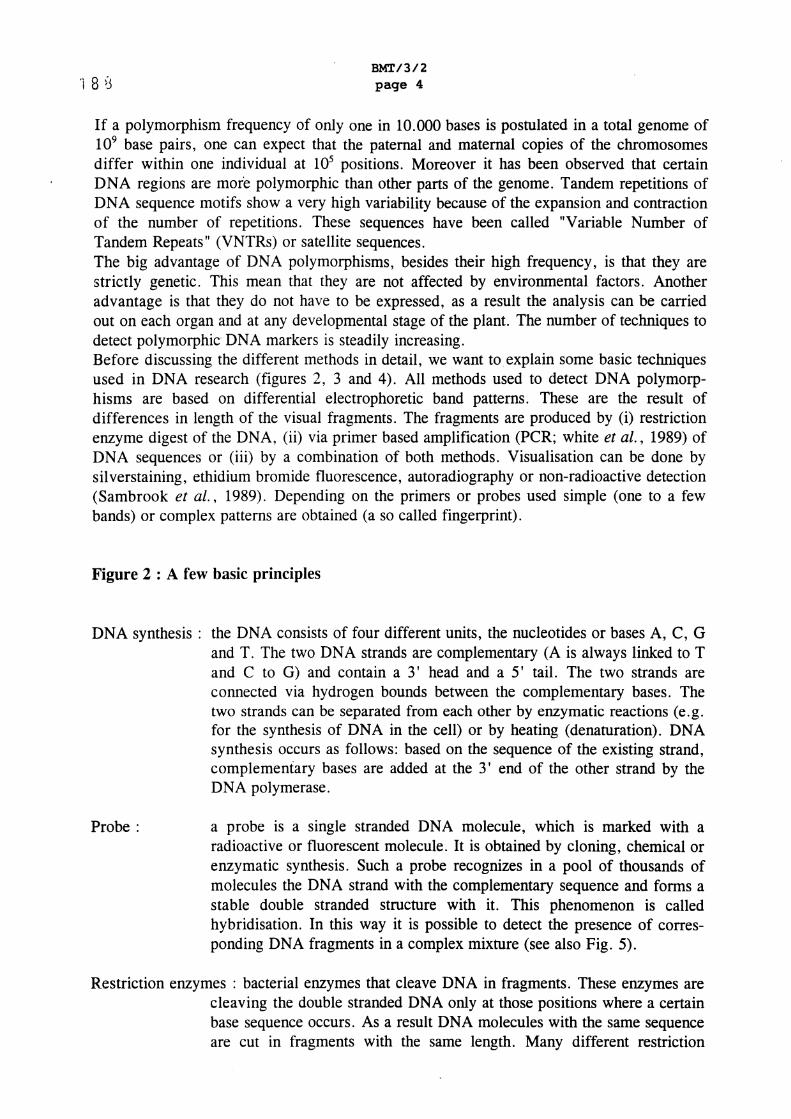
If a polymorphism frequency of only one in 10.000 bases is postulated in a total genome of 109 base pairs, one can expect that the paternal and maternal copies of the chromosomes differ within one individual at 105 positions. Moreover it has been observed that certain DNA regions are more polymorphic than other parts of the genome. Tandem repetitions of DNA sequence motifs show a very high variability because of the expansion and contraction of the number of repetitions. These sequences have been called "Variable Number of Tandem Repeats" (VNTRs) or satellite sequences. The big advantage of DNA polymorphisms, besides their high frequency, is that they are strictly genetic. This mean that they are not affected by environmental factors. Another advantage is that they do not have to be expressed, as a result the analysis can be carried out on each organ and at any developmental stage of the plant. The number of techniques to detect polymorphic DNA markers is steadily increasing. Before discussing the different methods in detail, we want to explain some basic techniques used in DNA research (figures 2, 3 and 4). All methods used to detect DNA polymorphisms are based on differential electrophoretic band patterns. These are the result of differences in length of the visual fragments. The fragments are produced by (i) restriction enzyme digest of the DNA, (ii) via primer based amplification (PCR; white et al., 1989) of DNA sequences or (iii) by a combination of both methods. Visualisation can be done by silverstaining, ethidium bromide fluorescence, autoradiography or non-radioactive detection (Sambrook et al., 1989). Depending on the primers or probes used simple (one to a few bands) or complex patterns are obtained (a so called fingerprint).
Figure 2 : A few basic principles
DNA synthesis : the DNA consists of four different units, the nucleotides or bases A, C, G and T. The two DNA strands are complementary (A is always linked toT and C to G) and contain a 3' head and a 5' tail. The two strands are connected via hydrogen bounds between the complementary bases. The two strands can be separated from each other by enzymatic reactions (e.g. for the synthesis of DNA in the cell) or by heating (denaturation). DNA synthesis occurs as follows: based on the sequence of the existing strand, complementary bases are added at the 3' end of the other strand by the DNA polymerase.
Probe : a probe is a single stranded DNA molecule, which is marked with a radioactive or fluorescent molecule. It is obtained by cloning, chemical or enzymatic synthesis. Such a probe recognizes in a pool of thousands of molecules the DNA strand with the complementary sequence and forms a stable double stranded structure with it. This phenomenon is called hybridisation. In this way it is possible to detect the presence of corresponding DNA fragments in a complex mixture (see also Fig. 5).
Restriction enzymes : bacterial enzymes that cleave DNA in fragments. These enzymes are cleaving the double stranded DNA only at those positions where a certain base sequence occurs. As a result DNA molecules with the same sequence are cut in fragments with the same length. Many different restriction

BMT/3/2 page 5
1 8 9
enzymes have been discovered, for example EcoRI recognises and cuts the sequence GAATTC.
Figure 3 : Cloning One of the most important breakthroughs of molecular genetics was the possibility to isolate and amplify specific DNA fragments via cloning (Sambrook et al., 1989). By the use of a restrictionenzyme a plasmid can be cut at a specific site. In this position a piece of DNA from whatever kind of organism can be added. The result is a recombinant plasmid (a new combination of DNA fragments that has been made in vitro). Successively the recombinant plasmid can be introduced in a host cell (e.g. bacteria). After culturing these bacteria on selective media, colonies with identical cells are formed.
Figure 4 : Polymerase Chain Reaction The polymerase chain reaction is a fast way to amplify specific DNA fragments enzymatically in a test tube (Saiki et al., 1985). Therefor one needs two short single stranded DNA fragments (primers), which can hybridize before and after the desired DNA fragment. The amplification procedure exists of a cycle which is repeated several times. This cycle contains a heating step, by which the complementary strands are separated and single stranded DNA is formed (denaturation), followed by a renaturation step to allow the primers to hybridise to the complementary DNA sequence (A). The primer/DNA complexes are the starting position for chain elongation by the Taq DNA polymerase (B). During each cycle the DNA will be doubled because each product from the chain elongation can be used as starting material for the next cycle (C). By repeating this cycle several times this reaction results in the exponential increase of the DNA between the primers. In this way it is possible to obtain in a few hours time millions of copies of the specific DNA piece (D).
Figure 5 : Detection of RFLPs Corresponding pieces of DNA (e.g. homologous chromosomes) may differ for certain restriction sites. In this example chromosome A2 has an extra recognition site for a specific restriction enzyme. After incubation with the restriction enzyme, gelelectrophoresis and transfer of the DNA to a membrane (Southern blot), this polymorphism can be detected by a probe. Chromosome Al shows a big fragment that in the case of A2 is cut in two smaller fragments. For the five lines it is possible to determine which is the diploid genotype for this chromosomal locus: AlAI, A1A2 or A2A2. The detection is achieved by the use of a radioactive probe which can hybridise to the DNA fragment. The radioactive irradiation causes - after autoradiography - black spots on a sensitive film at the position where the probe is bound.

BMT/3/2 1 9 1~l page 6
Figure 6 : Detection of restriction site polymorphisms after DNA amplification (CAPS) By this method, like for RFLP, restriction site polymorphisms are being visualised. In this case the detection is not performed by the hybridisation of a probe against a restriction digest, but by PCR amplification of the whole DNA fragment and successive digestion with restriction enzymes. The detection occurs directly in the gel after electrophoresis and staining of the DNA by ethidium bromide.
5. Restriction Fragment Length Polymorphism or RFLP
RFLPs arise by variations in the DNA sequence, which result in extra recognition sites, in the loss of similar recognition sites or in a change of the number of bases between these restriction sites. A classical RFLP analysis is carried out as follows (Fig.5):
(1) Genomic DNA is treated with a certain restriction enzyme, which cuts the DNA in pieces with well defined lengths. The polymorphisms will in this case result in fragments with a different length. (2) The fragments are separated by gelelectrophoresis. Because the large number of fragments it is impossible to distinguish them in a gel. They are continuously distributed from the top till the bottom of the gel. (3) Therefore the DNA is transferred to a filter which is suitable for hybridisation. (4) After hybridisation with a specific probe only a subset of the fragments is visualised (e.g. by autoradiography when radioactive probes are used).
The probes which are used to detect RFLPs are cloned sequences. These can be part of known genes or random genomic fragments. It is not necessary to know the sequence of the probe for using it in an RFLP experiment. The only requirement is that the probe can detect polymorphisms. This is empirically determined by using cloned sequences as a probe against different restriction digests of several individuals.
The biggest advantage of RFLP markers is their reproducibility and the possibility to score them co-dominantly. This means that each allele can be visualised in different genomic combinations (Tanksley et al. , 1989).
6. Restriction digest after selective amplification: "Cleaved Amplified Polymorphic Sequences" (CAPS)
As an alternative for the above described method and to avoid the expensive and time consuming hybridisation step, it is possible to detect the same restriction site polymorphisms by PCR amplification. For this it is necessary to know the flanking sequences of these DNA polymorphisms. On the basis of these sequences specific primers (20- 30 bases long) are made which allow to amplify the intervening sequence. The amplification products are treated with restriction enzymes. The resulting fragments are then directly analyzed on gel (Fig. 6). The amplification has the same effect as the hybridisation: lighting up of specific fragments from the background (Fig. 7).

BMT/3/2 page 7
1 9 'I
These markers are co-dominant and allele specific like RFLPs, but it is easier and faster to detect them (Konieczny & Ausubel, 1993). However, more analyse have to be carried out, because DNA sequence information is necessary.
Figure 7 : Comparison of RFLP and CAPS Both methods analyze the presence of polymorphic restnct10n sites. Specific polymorphisms are selected and detected either by hybridisation with one particular probe (RFLP) or by amplification with specific primers (CAPS). The two alleles of the homologous chromosomes can be visualised together.
7. Amplification of anonymous sequences using one short primer: Random Amplified Polymorphic DNA (RAPD)
Normal PCR technology requires knowledge of DNA sequence information for the synthesis of primers which are specific for amplifying of the fragment. To obtain the desired specificity primers containing 20 to 30 bases are used (a sequence of 20 bases statistically occurs every 420 = 1012 bases). If on the contrary shorter primers are used, the probability increases that the same sequence occurs by chance in the opposite orientation within one to a few kilobases. A few related techniques are based on the amplification of certain genomic fragments by using just one primer and low annealing temperatures: Random Amplification of Polymorphic DNA or RAPD (Williams et al., 1990) Arbitrarily Primed PCR or AP-PCR (Welsh and McClelland, 1990) DNA Amplification Fingerprinting or DAF (Caetano-Anolles et al., 1991)
This primer can bind at different positions distributed over the genome. Each primer can be used for DNA synthesis, but only these sequences will be amplified for which the primer binding sites on the complementary strands are located within a short distance. For RFLPs the polymorphisms are due to differences in the DNA sequence of the restriction sites or to changes in the distance between them. RAPD polymorphisms are due to DNA changes in the primer binding sites or in the distance between them (Fig. 8). The big advantage of the RAPD technique is that no information is needed to generate polymorphic markers. The DNA is mixed with a random short primer and after PCR the products are separated and visualised on a gel. Depending on the primer and reaction conditions, simple (only a few bands) or more complex patterns are obtained. The applied low temperature in combination with short primers has a negative effect on the reproducibility of this method (e.g. it is very difficult to reproduce the same patterns in different labs even if the same reaction parameters are used - PCR equipment and quality of the genomic DNA are very important). Another disadvantage for genetic analysis is that RAPD bands are dominant and in most of the cases only one of both alleles is detected. Polymorphisms are mainly due to the absence of one of the primer binding sites.
Figure 8 : The origin of amplification polymorphisms

1 9 2 BMT/3/2 page 8
Polymorphisms can be detected by the amplification of DNA from two related organisms using one short random primer.Amplification products will be obtained only from DNA fragments for which the primer finds two primer binding sites which are directed towards each other on the opp.osite strand and with the appropriate distance in between. Polymorphisms (see also Fig. 10) are revealed by a difference in length of the PCR products (e.g. (a) because of a small insertion) but most of the time by the presence or absence of a band (e.g. (b) because of a deletion and (c) because of a basepair mutation of the primer binding site). Therefore with this technique it is mostly only possible to detect just one of both alleles (b and c do not give a PCR product for A2).
8. Selective amplification after restriction digest: Selected Restriction Fragment Amplification (SRF A) or Amplified Fragment Length Polymorphisms (AFLP®)
This technique based on the PCR method combines characteristics from RFLP and RAPD (Zabeau & Vos, 1993). This method is based on the amplification of a subset of genomic restriction fragments (Fig.9). First the DNA is digested by a combination of two restriction enzymes. Specific adaptors are ligated at the sticky ends. Afterwards the obtained fragments are amplified using primers which are homologous to the adaptors. By amplifying all the fragments a continuous smear is obtained. To be able to reveal only a limited number of bands, the primers are extended with one to three arbitrary bases. When for example a G is added to a primer only 114 of the fragments are amplified. Each extra base, which is added to a primer, reduces the amount of fragments with a factor 4. The obtained fragments depend on the restriction enzymes and primer extensions used. The method is labour intensive and relative expensive per experiment. However this method has a lot of advantages over other techniques. No sequence data are necessary and reproducible results are obtained. Per reaction a large number of polymorphic markers can be scored. For the moment it is probably the fastest method to construct a genomic map.
Figure 10 : Comparison of amplification polymorphisms Both amplification methods are using primers to amplify particular fragments from the total DNA. In the RAPD reaction only one arbitrary short primer is used. For the SRF A or AFLP longer primers are based on the adaptor sequences which are linked to restriction ends. Because longer primers are used in the AFLP reaction, this method is more reproducible. Moreover it is mostly possible to determine whether the marker is present in the homozygous or heterozygous state. This can be achieved by determining the relative intensity of the bands. For RAPD this is quite difficult to realise.
9. Satellite or VNTR (Variable Number or Tandem Repeats)
In eucaryotic genomes hypervariable domains can be observed. They exist of tandem repetitions of particular sequence motifs. Depending on the length of the motif they are classified as macro- ( > 100 bases), micro- (1 to a few bases) en mini- (in-between) satellites. A few examples of the studied microsatellite loci in plants are (GT)n (fig. 11) or (AG)n in maize and (GT)n or (GGC)n in rice (Zhao & Kocl;lert, 1992).

BMT/3/2 page 9
1 9 3
A restriction fragment that contains a block of these repetitions is different in length for all different alleles because the number of repetitions is very variable. The detection of VTNRs via restriction digest and hybridisation is a special form of RFLP analysis. A probe which contains the motif hybridizes against all similar fragments distributed over the genome. The resulting pattern is specific for a certain organism or individual. As a result it is called a .multilocus DNA fingerprint.
Figure 11: Detection of microsatellite polymorphisms by PCR In this figure four different alleles from a microsatellite locus are schematically presented (only a small number of repetitions are drawn, while in reality there are much more). Microsatellites are highly polymorphic because of the expansion contraction of the number of repetitions. Because microsatellites of the type (GT)n are distributed over the genome, a (GT)n probe will detect many bands. Analysis of one specific locus can be carried out by the synthesis of specific primers that are flanking the microsatellite repetitions. The different length of the alleles can be detected as amplified fragments of different sizes.
For certain studies a multi locus analysis is too complicated. An alternative is a single locus analysis (Fig. 12). To detect VNTR alleles from only one locus it is necessary to clone first the sequences flanking the VNTR. On the basis of the sequence information a probe or primer set can be made which can specifically detect this one VNTR locus (fig. 11). Because their high degree of polymorphism, VNTR alleles appear to be very interesting for the comparative analysis of closely related genotypes.
Figure 12 : Satellite polymorphisms
Literature
Arumuganathan, K. and Earle, E.D. 1991. Nuclear DNA content of some important plant species. Plant Mol. Bioi. Reporter, 9 : 208-218.
Caetano-Anolles, G., Bassam, B.J. and Gresshoff, P.M. 1991. DNA amplification fingerprinting: a strategy for genome analysis. Plant Mol. Biol. Reporter, 9 : 294-307.
Depicker, A., De Loose, M. and Van Bockstaele, E. 1994. The role of biotechnology in plant breeding. Acta Horticul., 355: 195-207.
Konieczny, A. and Ausubel, F.M. 1993.A procedure for mapping Arabidopsis mutations using co-dominant ecotype-specific PCR-based markers. Plant J., 4: 403-410.
Manganaris, A. G. and Alston, F.H. 1988. Inheritance and linkage relationships of glutamate oxaloacetate transaminase isoenzymes in apple. 2. The genes GOT-2 and GOT-4. Theor. Appl. Genet., 76: 449-454.
Phillips, R.L. and Vasil, I.K. 1994. DNA-based Markers in Plant, (Advances in Cellular and Molecular Biology of Plant, Vol. 1). Dordrecht, Kluwer Academic Publishers.
Rajora, O.P., Dancik, B.P. and Aleksiuk, M. 1991. Associations of genes encoding allozymes peroxidase and superoxide dismutase in poplar ans spruce species. Theor. Appl. Genet., 81 : 729-734.

I 9 4 BMT/3/2 page 10
Saiki, R.K., Qcharf, S., Faloona, F., Mullis, K.B., Jom, G.T., Erlich, H.A. and Amheim, N. 1985. Enzymatic amplification of P-globin genomic sequences and restriction site analysis for diagnosis of sickle cell anemia. Science, 230 : 1350-1354.
Sambrook, J., Fritsch, E.F. and Maniatis, T. 1989. Molecular cloning, a laboratory manual, 2nd ed. Cold Spring Harbor, Cold Spring Harbor Laboratory Press.
Selander, R.K., Caugant, D.A., OCHMAN, H., Musser, J.M., Gilmour, M.N. and Whittam, T.S. 1986. methods of multilocus enzyme electrophoresis for bacterial population genetics and systematics. App. Environm. Microbial., 51 : 873-884.
Tanksley, S.D., Young, N.D., Paterson, A.H. and Bonierbale, M.W. 1989. PFLP mapping in plant breeding: new tools for an old science. Bio/technology, 7 : 257-264.
Welsh, J. and McClelland, M. 1990. Fingerprinting genomes using PCR with arbitrary primers. Nucl. Acids Res., 18 : 7213-7218.
White, T.J., Arnheim, N. and Erlich, H.A. 1989. The polymerase chain reaction. Trends Genet., 5 : 185-189.
Williams, J.G.K., Kubelik, A.R., Livak, K.J., Rafalski, J.A. and Tingey, S.V. 1990. DNA polymorphisms amplified by arbitrary primers are useful as genetic markers. Nucl. Acids Res., 18: 6531-6535.
Zabeau, X. and Kochert, G. 1992. Selective restriction fragment amplification: a general method for DNA fingerprinting. European Patent Application EP 534858Al.
Zhao, X. and Kochert, G. 1992. Characterization and genetic mapping of a short, highly repeated, interspersed D.A. sequence from rice (Oryza sativa L.). Mol. Gen. Genet., 231 : 353-359.

BMT/3/2 page 11
Figure 1 : Schematic overview of an iso-enzyme analysis.
Gelelectrophoresis of protein extracts
1 2 3 4 5
1 Incubation of chromogenic
substrate for specific enzyme
1 2 3 4 5
1 9 5

I 9 6 BMT/3/2 page 12
Figure 2 : A few basic principles
5' A
+---DNA synthesis c~
+---- T G +----
8
c
1

Figure 3 : Cloning
bacterie
+
BMT/3/2 page 13
recombinant plasmid
cloned plant DNA
l chromosome
1 9 7

BMT/3/2 page 14
Figure 4 : Polymerase Chain Reaction
POLYMERASE CHAIN REACTION
A
8
c
----------+------+ ----------
+----
--+ ---------+----
--+ ---------+----
--+
pol, primers, bases, buffer
D --------- +---- final --+ --------- product

BMT/3/2 page 15
Figure 5 : Detection of RFLPs
RFLP A 1 111--••-•••••••1 restriction sites
A2 1 1 l probe
DNA extraction Incubation with restriction enzymes
Gel electrophoresis
1 1 2 3 4 5
marking recombinant plasmid for probe
0 \ Squthern blot j
Autoradiography
1 2 3 4 5
- ----------A1 A1 A2A2 A1 A2 A1 A2 A2A2
1 9 9

BMT/3/2 page 16
Figure 6 : Detection of restriction site polymorphisms after DNA amplification (CAPS)
·CAPS
A1 A2
restriction site
! PCR amplification !
Restriction digest Gel electrophoresis
\ I 1 2
- --

BMT/3/2 page 17
Figure 7 : Comparison of RFLP and CAPS
Restriction Fragment Length Polymorphism
RFLP CAPS Method
Restriction digest of genomic DNA
I Detection
Hybridization of blots
Polymorphism
Restriction sites
Restriction digest of amplified DNA
I EtBr staining of DNA ! fragments
Restriction sites
Schematic overview
A1A1 A1A2 A2A2 A1A1 A1A2 A2A2
-···- -··--··----.:·- --
2 0 'I

2 0 .. ~ BMT/3/2 page 18
Figure 8 : The origin of amplification polymorphisms
RAPD
Template A1
a b c Products
Template A2
a b c Products

Figure 9
1 ste digest (hexacutter, EcoRI)
t f f f
BMT/3/2 page 19
TOTAL DNA
f
f f f f f f
Msel ~ .J ~
2nd digest (tetracutter, Msel)
"'------/ "'
Ligation of Msel & EcoRI adaptors
PCR amplification
.---. .___... - -+- -.---. .--+ = - = -+-
I
+-.. -.--+ +-= -+-
-
203

204 BMT/312 page 20
Figure 10: Comparison of amplification polymorphisms
Amplified Polymorphic DNA
RAPD Method
Amplification with non-specific primers
SRFA (AFLP)
Amplification of subsets : of restriction fragments
I Detection
EtBr stainining of Autoradiography of amplified DNA fragments labelled fragments
I Polymorphism Primer binding sites Restriction/primer
binding sites
Schematic overview A1A1 A1A2 A2A2 A1A1 A1A2 A2A2
·.·. -···-···- ---------------·- --------------···-·.·- --------------·.·-···- -····-··--···-··- ----

BMT/3/2 page 21
Figure 11 Detection of microsatellite polymorphisms by PCR
Microsatellites genome 1 genome 2
--+ -TGTGTGTGTGTGT-
-ACACACACACAC-
+---+
-TGTGTGTGTGTGTGT-
-CACACACACACACACA-
+-
PCR en gel '\.. electrophoresis ~ 1
..=:t.aTGTGTGTGTGTGTGTGT
--CACACACACACACACACA-
+---+ -TGTGTGTGTGT--
-CACACACACACA--
+-
2 / ...--------.....

206 BMT/3/2 page 22
Figure 12 : Satellite polymorphisms
Satellite Polymorphisms multi locus fingerprint
I method Restriction digest of genomic DNA
I Detection
! Single locus I
! fingerprint
i Specific amplification or : restriction digest !
Hybridization of blots with . Hybridization of blots or "satellite" probes EtBr staining of DNA
fragments
I Polymorphism number of "repeats" number of "repeats"
Schematic overview A1A1 A1A2 A2A2 A1A1 A1A2 A2A2
-·--------.·-·--····-''·------·---···--------··- ----·------.·-··--·'- -·-----------------
[End of document]