Did tariffs stifle Spanish agriculture before 1936?
23
European Review of Economic History, I, 65-87. © 1997 Cambridge University Press Did tariffs stifle Spanish agriculture before 1936? JAMES SIMPSON Faculdad de Ciencias Sociales y Juridicas, Universidad Carlos III de Madrid, c\. Madrid, 28903 Getafe, Madrid, Spain This paper challenges the widely held view that tariff protection was the major factor in explaining the poor performance of Spanish agriculture in the half century prior to the 1936 Civil War. After examining the general level of tariffs, it is argued that these were not sufficient in themselves to explain either the poor diets or weak demand for manufactured goods. Secondly, fanners were slow to switch resources out of cereals, not so much because of the tariffs, but rather because of the limited export opportunities for alternative crops, especially olive oil and wine. Finally, the evidence suggests that those areas which saw a significant increase in the area of cereals were just as likely to see a decline in the agricultural population as those that did not, suggesting that the rural exodus was determined by factors other than the tariff. 1. Introduction Agriculture is often blamed for the poor performance of the Spanish economy in the half century or so prior to the 1936-9 Civil War. 1 Crop yields were some of Europe's lowest, and output per male labourer was just 39 per cent of that in the United Kingdom in 1930, 44 per cent of that in France, or 38 per cent of that in Germany. 2 Working capital was minimal, as reflected in the widespread use of the traditional 'roman' scratch plough, the low chemical fertilizer usage, and the low ratios of animal power per hectare. 3 The cause of agriculture's poor performance is much debated, but perhaps the most fre- quent explanation is tariff protection, especially that which cereal producers enjoyed. Thus Tortella, after posing the question of why the transition from See, for example, Maluquer de Motes 1987, p. 75, Nadal 1973, pp. 553-67, Tortella 1987^ PP- 55-9 and 1994b, p. 8. For yields, see Tortella 1994a, Table 5 and Simpson 1995a, Table 12.1; for labour productivity, O'Brien and Prados de la Escosura 1992, Table 6. Female agricultural labour is ignored because of measurement difficulties. However, that does not imply there was no change, as illustrated in, for example, Gallego 1986.
Transcript of Did tariffs stifle Spanish agriculture before 1936?

European Review of Economic History, I, 65-87. © 1997 Cambridge University Press
Did tariffs stifle Spanish agriculturebefore 1936?JAMES SIMPSONFaculdad de Ciencias Sociales y Juridicas, Universidad Carlos III de Madrid,c\. Madrid, 28903 Getafe, Madrid, Spain
This paper challenges the widely held view that tariff protection was themajor factor in explaining the poor performance of Spanish agriculture inthe half century prior to the 1936 Civil War. After examining the generallevel of tariffs, it is argued that these were not sufficient in themselves toexplain either the poor diets or weak demand for manufactured goods.Secondly, fanners were slow to switch resources out of cereals, not somuch because of the tariffs, but rather because of the limited exportopportunities for alternative crops, especially olive oil and wine. Finally,the evidence suggests that those areas which saw a significant increase inthe area of cereals were just as likely to see a decline in the agriculturalpopulation as those that did not, suggesting that the rural exodus wasdetermined by factors other than the tariff.
1. Introduction
Agriculture is often blamed for the poor performance of the Spanish economyin the half century or so prior to the 1936-9 Civil War.1 Crop yields weresome of Europe's lowest, and output per male labourer was just 39 per cent ofthat in the United Kingdom in 1930, 44 per cent of that in France, or 38 percent of that in Germany.2 Working capital was minimal, as reflected in thewidespread use of the traditional 'roman' scratch plough, the low chemicalfertilizer usage, and the low ratios of animal power per hectare.3 The cause ofagriculture's poor performance is much debated, but perhaps the most fre-quent explanation is tariff protection, especially that which cereal producersenjoyed. Thus Tortella, after posing the question of why the transition from
See, for example, Maluquer de Motes 1987, p. 75, Nadal 1973, pp. 553-67, Tortella1987̂ PP- 55-9 and 1994b, p. 8.For yields, see Tortella 1994a, Table 5 and Simpson 1995a, Table 12.1; for labourproductivity, O'Brien and Prados de la Escosura 1992, Table 6. Female agriculturallabour is ignored because of measurement difficulties.However, that does not imply there was no change, as illustrated in, for example, Gallego1986.

66 European Review of Economic History
'traditional to modern agriculture' was so slow, answers categorically: 'Thereis a simple answer: protectionism'.4
In this article I look at three areas where agricultural protection is usuallyconsidered as having had a negative effect on economic development. InSection 2, I argue that bread prices were not significantly above those ofother more developed European countries where farmers also enjoyedprotection. Furthermore, if diets were poor, they were not significantly moreso than in other Mediterranean countries. In Section 3 I show that therewere few alternatives to cereals given the limited opportunities for expand-ing wine and olive oil output. Furthermore, the poor pastures found overmuch of the country made intensive livestock difficult. In the final section Iargue that, at least prior to the first decade of the twentieth century, tariffshad only a weak impact in retaining labour in the sector. After this date,farm labour was just as likely to migrate from areas which saw a significantincrease in the area of cereals (Castilla-Leon) as it was to remain (theSouth). I conclude that the direct contribution of cereal protection inexplaining the low productivity of the sector was probably much less than isusually thought by economic historians.
2. Protection and the Spanish consumer
... the higher the level of GNP per capita in 1913 or 1929, the lower thenominal protection of agriculture. It seems that the lower-incomecountries of Eastern and Southern Europe gave heavy protection to bothagriculture and manufacturing.5
The Spanish economy saw some major changes in the half century or soprior to the Civil War. In particular, Prados de la Escosura has estimatedthat GDP per head exactly doubled between 1859-61 and I933-35-6 Thisincrease in GDP was accompanied by structural changes, with a growth inurbanization and a decline in agricultural employment. But there can belittle doubt that Spain was still a poor country in 1936, both in absoluteterms, and in comparison with other western European countries. Thus,real GDP per capita in 1929 was only 68 per cent of that in Italy, 40 per centof that in Great Britain, 46 per cent of that in France and 57 per cent of thatin Germany.7 In addition, Palafox has identified other indicators - per capitaconsumption of cotton and energy, numbers of letters or telegrams sent, andliteracy, where Spain once more performs noticeably worse than thecontinent's leading economies.8
4 Tortella, 1987, pp. 51-2 and 1994b, p. 58. In fact Tortella also gives considerable weightto the question of natural resources, see 1994b, pp. 6-10.
s Emphasis in the original. Lindert 1989, p. 12.6 This is equivalent to an annual increase of 0.94 per cent. Carreras (1989) gives a more modest
growth of 59 per cent, or an annual 0.65 per cent. Prados de la Escosura 1993, Table D2.7 Prados de la Escosura 1992, p. 36.8 Palafox 1991, p. 25. For literacy, see also Nunez 1992, ch. 2.
Did tariffs stifle Spanish agriculture before 1936? 67
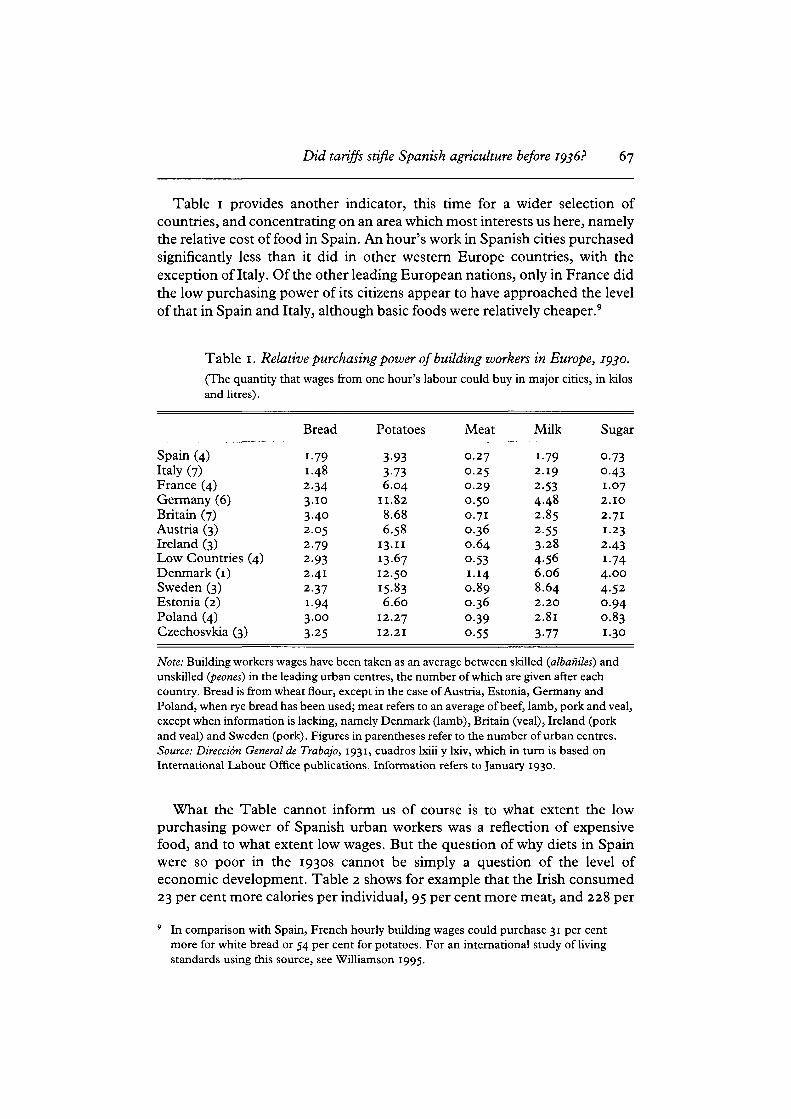
Table 1 provides another indicator, this time for a wider selection ofcountries, and concentrating on an area which most interests us here, namelythe relative cost of food in Spain. An hour's work in Spanish cities purchasedsignificantly less than it did in other western Europe countries, with theexception of Italy. Of the other leading European nations, only in France didthe low purchasing power of its citizens appear to have approached the levelof that in Spain and Italy, although basic foods were relatively cheaper.9
Table 1. Relative purchasing power of building workers in Europe, 1930.(The quantity that wages from one hour's labour could buy in major cities, in kilosand litres).
Spain (4)Italy (7)France (4)Germany (6)Britain (7)Austria (3)Ireland (3)Low Countries (4)Denmark (1)Sweden (3)Estonia (2)Poland (4)Czechosvkia (3)
Bread
1.791.482.343-io3.402.052.792.932.412.371.943.003-25
Potatoes
3-933-736.04
11.828.686.58
13.1113.6712.5015.836.60
12.2712.21
Meat
0.270.250.290.500.710.360.640.531.140.890.360.390.55
Milk
1.792.192-534.482.852-553.284.566.068.642.202.813-77
Sugar
0.730.431.072.102.711.232.431.744.004.520.940.831.30
Note: Building workers wages have been taken as an average between skilled (albaniles) andunskilled (peones) in the leading urban centres, the number of which are given after eachcountry. Bread is from wheat flour, except in the case of Austria, Estonia, Germany andPoland, when rye bread has been used; meat refers to an average of beef, lamb, pork and veal,except when information is lacking, namely Denmark (lamb), Britain (veal), Ireland (porkand veal) and Sweden (pork). Figures in parentheses refer to the number of urban centres.Source: Direction General de Trabajo, 1931, cuadros lxiii y lxiv, which in turn is based onInternational Labour Office publications. Information refers to January 1930.
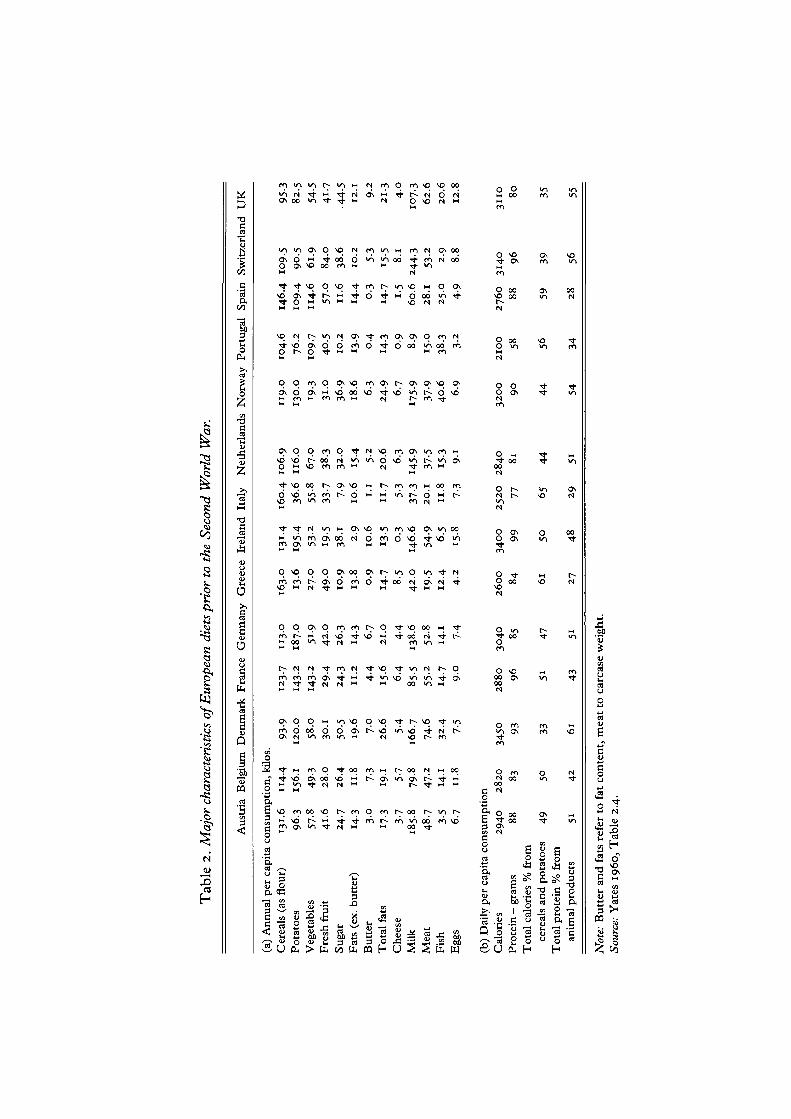
What the Table cannot inform us of course is to what extent the lowpurchasing power of Spanish urban workers was a reflection of expensivefood, and to what extent low wages. But the question of why diets in Spainwere so poor in the 1930s cannot be simply a question of the level ofeconomic development. Table 2 shows for example that the Irish consumed23 per cent more calories per individual, 95 per cent more meat, and 228 per
9 In comparison with Spain, French hourly building wages could purchase 31 per centmore for white bread or 54 per cent for potatoes. For an international study of livingstandards using this source, see Williamson 1995.
Tab
le 2
. Maj
or c
hara
cter
isti
cs o
f Eur
opea
n di
ets
prio
r to
the
Sec
ond
Wor
ld W
ar.
Aus
tria
Bel
gium
(a)
An
nu
al p
er c
apit
a co
nsu
mp
tio
n,
kilo
s.
Cer
eals
(as
flou
r)P
ota
toes
Veg
etab
les
Fre
sh f
ruit
Su
gar
Fat
s (e
x. b
utt
er)
Bu
tter
To
tal
fats
Ch
eese
Mil
kM
eat
Fis
hE
ggs
131.
696
.3
57.8
41.6
24
.7
14-3 3.0
17-3
3-7
185.
84
8.7 3-5
6.7
114.
415
6.1
49-3
28.0
26.4
11.8 7-3
19.1 5-7
79-8
47.2
14.1
11.8
(b)
Dai
ly p
er c
apit
a co
nsu
mp
tio
nC
alo
ries
Pro
tein
- g
ram
s2
94
088
2820
83
Den
mar
k
93-9
120.0
58.0
30.1
50.5
19.6
7.0
26.6 5-4
166.
774
.632
.4 7-5
345O 93
Fra
nce
123.7
143.2
143.2
29
.42
4.3
11.2
4.4
15.6
6.4
85.5
55-2
14-7
9.0
28
80
96
Ger
man
y
113.0
187.0
51-9
42.0
26.3
14-3 6.7
21.0
4-4
138.
652
.814.1 7-4
30
40
85
Gre
ece
163.0
13.6
27.0
49
.010.9
13.8
0.9
14-7 8.5
42
.0
19-5
12.4
4.2
2600
84
Irel
and
I3I-
419
5-4
53-2
19-5
38.1
29
10.6
13-5
0.3
146.
6
54-9 6.5
15.8
34
00
99
Ital
y
160.4
36
.6
55-8
33-7 7-9
10.6
1.1
11.7
5-3
37-3
20.1
11.8
7-3
25
20
77
Net
her
lan
ds
106.9
116.0
67
.0
38.3
32.0
15-4 5-2
20.6 6-3
145-
937
-515
-39
-i
28
40
81
No
rway
119.0
130.0
19.3
31.0
36
918
.66.
32
4.9
6.7
175-
937
-94
0.6 6.9
32
00
90
Po
rtu
gal
104.6
76.2
109.7
40
.510.2
13.9
0.4
14-3
0.9
8-9
15.0
38.3
3-2
2100
58
Sp
ain
146.
410
9.4
114.
657
.011.6
14.4
0.3
14.7 i-5
60
.628.1
25
.0
4-9
27
60
88
Sw
itze
rlan
d
109.
59
0.5
61.9
84
.03
8.6
10.2 5-3
15-5
8.1
24
4.3
53.2
2.9 8.8
3140 96
UK 95
-382
.5
54-5
4i-
744
-512.1
9-2
21.3
4.0
107.3
62
.6
20
.6
12.8
3110 80
To
tal
calo
ries
% f
rom
cere
als
and
po
tato
es
49
50
33
51
47
61
50
65
44
44
56
59
39
35
To
tal
pro
tein
% f
rom
anim
al p
rod
uct
s 51
42
61
43
51
27
48
29
51
54
34
28
56
55
Not
e: B
utt
er a
nd
fats
ref
er t
o f
at
con
ten
t, m
eat
to c
arca
se w
eig
ht.
Sour
ce:
Yat
es 1
96
0,
Tab
le 2
.4.

Did tariffs stifle Spanish agriculture before 1936? 69
cent more sugar3 even though per capita income in the two countries was notvery different. However, Table 2 also shows that the low calorie intake, andshortage of animal protein, was a feature of the Mediterranean diet ingeneral, rather than just that of the Spanish. In the rest of this section, Ioutline first, the major characteristics of cereal protection in Spain andsecond, whether tariff protection was sufficiently high to explain thedifferences noted in Tables 1 and 2.
As Sanchez Albornoz has shown, from 1820 government policy success-fully reserved the internal and colonial markets for domestic cerealproducers.10 However, by the 1880s the impact of falling production costs inthe newly settled temperate countries and the decline in rail and sea freight,threatened to dislodge Spanish wheat farmers from their traditional marketsof the periphery (Barcelona, Valencia etc.). Competition was restored by acombination of a depreciating peseta, and an increase in import duties.11
Thus the tariff of 4.54 pesetas/100 kilos was increased to 8 pesetas inDecember 1891, and again to 10.5 pesetas in February 1895. It then tendedto fall, but with higher levels becoming operational if the domestic wheatprice fell below certain levels.12 The first World War saw an extension ofgovernment intervention, with attempts to fix maximum and minimumprices.13 By the end of the War, Spain had become virtually self sufficient inwheat and the tariff was supplemented from November 1921 by strictimport quotas, which were accompanied by maximum and minimumdomestic prices. In only three years between 1922 and 1935 did imports riseabove 5 per cent of the national harvest (1928, 1929 and 1932), beingnegligible in the rest.14 Despite the dubious success in becoming self-sufficient in wheat and stabilizing consumer prices, the clamour for stillgreater protection, and reports of distress amongst thousands of wheatfarmers during the 1920s, questions this as a suitable policy measure, apoint examined elsewhere.15
If from the late nineteenth century Spain was not alone in protecting itswheat growers, levels were considered exceptionally high, and helpedproduce some of Europe's highest bread prices. To compare the real level ofprotection between countries is notoriously difficult, given the variety ofmethods that protection might take, problems in converting currencies, and
10 Sanchez-AlbornoZj 1963. See also Nadal 1985, pp. 93-4.11 See especially Grupo de Estudios de Historic/, Rural (hereafter GEHR), 1980.12 See El Progreso Agricolay Pecuario (EPAPM), abril 1928, no. 1529, pp. 257-60.13 The royal decree of August 1914 allowed, briefly, imported wheat to enter duty free if
prices remained above 29 pesetas per 100 kilos. This was reintroduced between Marchand June, and November of 1915. Finally, the decree of January 1916 established dutyfree imports until April 1921. Maximum and minimum prices for wheat were introducedin November 1915.
14 Montojo Sureda, 1945. See also Pinilla Navarro, 1992, pp. 418-20.15 See Simpson 1995a, pp. 222-31.

70 European Review of Economic History
the significant dietary variations. Comparing tariff levels alone is not enough(column i, Table 3).16 For example, Spain supplemented its tariffs from
Table 3. Indices of wheat protection and self-sufficiency infive European importing nations, 1925-9.
Percentages
SpainFranceGermany*ItalyGt. Britain
(1)
19.623.029.027.0—
(2)
96.986.283.974.021.2
(3)
19.27.88.0
5.69.2
Notes and Sources:(1) Duties on imported wheat in 1927, Liepmann (1938).(2) Level of self-sufficiency in wheat. * Includes both wheat andrye. The level of wheat self-sufficiency was 61.3% and rye 99.7%.Source: International Institute of Agriculture, various years.(3) Income from customs receipts as a percentage of total imports.Refers to period 1922-30. Tena (1992), p. 333.
November 1921 with import quotas for wheat and maize and, therefore, inthe words of Liepmann, 'Spain's corn duties . . . had only limited practicalvalue for judging her corn-import policy, and the large decreases of her cornimports in post-War periods'. A better reflection of the protection thatSpanish farmers enjoyed is in column 2, which shows the country to havebeen virtually self-sufficient in wheat in comparison to other countries.17 IfSpanish wheat producers had been competitive in international markets,then domestic self-sufficiency would not be a good indicator of protection.But Spain was not competitive, achieving yields that were little different tothose in the United States, but requiring considerably more labour.18
Finally, column 3 indicates the generally higher level of protection in Spainacross both agriculture and industry compared to other Europeannations.19
Domestic self-sufficiency in wheat was achieved at a cost to the con-sumer, as domestic prices remained above international ones. Figure 1compares the internal wheat price in Spain with the English price, which istaken as the 'world price', and has been converted into pesetas at the current
16 Liepmann, 1938, p. 101. For Spanish tariff policy see EPAPM 1928, pp. 257-60 andMontojo Sureda 1945, pp. 15-47.
17 The I.I.A. does not allow a figure for 1909-13 to be calculated as production figures referto post first World War boundaries, whilst imports to those before the War.
18 Spain had 8.9 hectares of land per male worker in 1930, against 48.7 hectares in theUnited States. O'Brien and Prados de la Escosura 1992, Table 5.
19 For a general study of tariffs in this period, see especially Tena, forthcoming.

Did tariffs stifle Spanish agriculture before 1936? 71
exchange rate.20 Whereas between 1870-77 Spanish wheat prices werecheaper than 'world' prices, this would not be the case for the rest of theperiod. Only during the first World War, when British prices rose onaccount of shipping difficulties, did the price difference fall much below 20per cent.
Other countries, such as France or Germany, also protected their farmers,so Spain was not alone. In the case of France, Lindert has shown that thesilver price of wheat grew from being 5 per cent higher than in Englandduring the 1870s, to around 26 or 27 per cent by the 1890s and 1900s. Inother words, not so very different from the Spanish experience.21 Lindertalso reminds us that the English Corn Laws kept the domestic price of wheatfrom around 1710 to 1846 significantly above that of other Europeancountries. Indeed, the gap between Britain and other countries in this earlierperiod appears remarkably similar to that identified in Figure 1, betweenSpain and the 'world price'.22 It seems unlikely that higher bread pricescaused by tariff protection could make a really significant difference tohousehold budgets in Spain in the period 1891-1936.23 However, even if
160
1870 1880 1890 1900 1910 1920 1930
Figure I. Spanish wheat prices as a percentage of 'world' prices.Note: Figures given as 3 year averages.Sources: For prices, Mitchell and Deane 1962, GEHR 1980 and Paris Eguilaz1943. Exchange rates, Carreras (ed.), 1989, pp. 390-1.
20 As much of wheat consumed in Britain was imported, there is no need to include freightin the calculation. Unlike GEHR, 1980, who showed the costs (and profits) of shippingfrom England to Barcelona, our interest here is simply to illustrate the price 'gap'between the two countries. A moving three year price average is used. For a widercomparison of international wheat prices between 1880 and 1905, see Palafox 1991,cuadro 1.3.
21 Lindert 1991, Table 2.4.22 Ibid. Table 2.4.23 Fraile 1993.

72 European Review of Economic History
cereal protection in Spain was not significantly above that of its neighbours,the low incomes of the country implied that its relative impact on aggregatedemand was greater than in, say, Germany or France. Bread inevitably had agreater weight in the family budget of the lower income countries of theMediterranean.
3. Tariffs and the allocation of resources within agriculture
It follows that the best policy for European countries during the GreatDepression was to carry out a shift from crop production to livestock.Countries which were able and far-sighted enough to do this stood amuch better chance of overcoming the crisis that those which, in the faceof the new trends, persevered with former habits.24
Peter Lindert has stressed that governments in recent decades frequentlydistort their economies by anti-trade policies, as governments 'tend to taxexportable-good agriculture and protect import-competing agriculture'.25 Inthis respect Spain does not appear to have been very different. Spanishproducers of oranges, olive oil, olives, wine, grapes, raisins, soft fruits,nuts and early vegetables all suffered to some degree as they had to payhigher prices for wheat, meat, rice, sugar, machinery and consumer goodsbecause of import duties. Whilst it is true that most export crops werethemselves protected from imports in the domestic market, it seems un-likely that they would have faced any serious competition without thisprotection.26
It has often been argued that the high concentration of resources incereals was a major cause of Spanish agriculture's low productivity. There-fore in circa 1910, cereals and legumes made up 34.7 per cent of Spain'sagricultural final output, but only 23 per cent in France, 22 per cent in Italy,19 per cent in Germany and 12 per cent in the United Kingdom.27 Toconsider whether tariffs delayed the switch out of cereals and into othercrops, I shall consider the problem from two angles, namely the question oflost export opportunities and, as suggested by Tracy's quote above, thedelay in transferring resources to livestock farming. I argue that, rather thana misguided tariff policy, it was lack of alternative crops to cereals, incontrast to elsewhere in western Europe, that was the principal obstacle tochange.
24 Tracy 1989, p. 19.25 Linden 1991, p. 29.26 One important exception is the question of substitutes. In this respect wine producers
benefited from taxes on imported alcohol, which was often used as a base for theproduction of other drinks, and olive oil producers from taxes on imports of ediblevegetable oils.
27 O'Brien and Prados de la Escosura 1992, Table 3. Output is valued in nationalcurrencies.

Did tariffs stifle Spanish agriculture before 1936? 73
In 19353 87.3 per cent of Spain's wheat production was produced usingdry farming techniques, 10.2 per cent using irrigation, and just 2.4 per centunder conditions which would be considered as normal in northernEurope.28 In the absence of irrigation, the major alternative crops to cerealsin Spain were vines and olives. By the early twentieth century increaseddomestic demand depended mainly on population growth, with per capitaconsumption growing by just 8.3 per cent in the case of olive oil, and fallingby 1.4 per cent for wine, between 1897-1901 and 1929-33.29 Both crops hadimportant export markets, and it is here that we shall look for lostopportunities because of the protection which cereal farming enjoyed.
The vine was Spain's major export crop throughout the period.30 Theintensive nature of viticulture made it well suited to the small family farms ofthe Mediterranean area, and the lack of capital often associated with peasantfarming was alleviated in the pre-phylloxera period by the fact that off-farminputs were minimal. Low entry costs and extensive areas of suitable land forits cultivation were offset only by the bulky nature of the product, and itsperishability, as most wines in their natural state frequently becameundrinkable within a few months of production. The railways helped lift thegeographic restrictions on production, and the addition of alcohol to thewine greatly increased the product's life.
Spanish exports grew rapidly from the early 1870s on account of theseverely diminished harvests in France, caused by phylloxera (Table 4). Theincrease in wine prices encouraged a switch away from marginal cereals andpasture, with the area of vines increasing from perhaps 1.5 m. hectares ini860 to about 2.0 m. in the mid 1880s.31 However, the boom was short lived.By the turn of the twentieth century, replanting with disease resistantvarieties had allowed French domestic output to recover, and it was the turnfor Spanish producers to suffer the widespread destruction by phylloxera.Without the benefit of an abnormal short-fall in a major producing country,Spanish growers needed either to increase market share, or to extend the sizeof the market. They failed to do either, and the country's share of the worldtrade in wine slipped from approximately half in the 1880s to less than aquarter by 1925-29.
Spanish exports were severely limited because France, by far the biggestwine market with 62 per cent of world imports in 1925-29, establishedpreferential trade agreements with Algeria. Furthermore, if every producer
28 Ministerio de Agricukura, 1936, p. 8. Only in the north of the country (Galicia, Asturias3
Santander, Guipuzcoa and Vizcaya) was it possible to crop annually without irrigation.Dry farming implied that land was left fallow at least once every two years.
29 Simpson 1989, cuadro 5.30 At its peak in 1880-4, 45 per cent of all exports were products of the vine (Prados de la
Escosura 1982, p. 41).31 For the difficulties in measuring the area of vines, see especially Pan-Montojo 1994, pp.
384-93 and Simpson 1996, pp. 224-7.

74 European Review of Economic History
Table
1861-651866-701871-751876-801881-851886-901891-951896-19001901-051906-101911-151916-201921-25
4. Exports
Totalexports
88.7111.5160.6302.4682.7825.6636.4534-6208.4140.1269.9445-5278.6
of Spanish
ExportstoFrance
9-913.030.8
180.1547-9698.0444-5372.0143-342.7
141.8275-7166.2
bulk wines.
Exportsto othercountries
78.898.5
129.8122.2134.8127.6I9I-9162.665.197-4
128.1169.8112.4
% t oFrance
1112
196080
857070
69305362,60
Spanishwineprice
23.219.420.226.035-526.016.519.320.715.827.430.423.2
IndexExportsby value
100105158382
11781043
510501
210108
359658314
Notes: Exports in millions of litres. Wine price refers to San Pere de Ribes (Barcelona).Index of exports obtained by multiplying total exports by wine price; 1861-65 = I 0 ° -Source: Estadistica (s) de Comercio Exterior and Balcells 1980, pp. 375-9.
country restricted imports to protect domestic growers, non-producers alsofrequently placed high tariffs on wines to protect other domestically pro-duced alcoholic drinks, severely reducing the market for cheap table winesoutside France. Even if Spanish growers had managed to improve productquality and establish brand names, which some did, it is unlikely that theywould have widened the market significantly.32
On the supply side, if producers appear to have responded quickly to anoutward movement of the demand curve in the 1870s and 1880s, they foundit less easy to reduce output in periods of depressed demand, as taking vinesout of production implied the destruction of costly assets. However, thereappear to have been other factors which strictly limited long term profits inviticulture, as wine producers in the pre-phylloxera period experiencedconditions not dissimilar to those faced by tropical agricultural producers atthis time, namely low entry costs and elastic supplies of land and labour.33
Phylloxera raised entry costs by demanding greater inputs of skilled labourand capital, but much of the world's over-production of wine during the firstthird of the twentieth century stemmed from the extension of vines inregions such as central Spain and Algeria, where the crop's opportunity
32 In France, for example, the exports of quality wines declined from roughly 60 per cent ofproduction of vins de cm in 1869-77, to 30 per cent in 1913, and 10 per cent in 1939.Warner i960, p. 85.
33 For tropical producers, see Lewis 1978, especially chapter 7.

Did tariffs stifle Spanish agriculture before 1936? 75
costs were low, labour cheap and phylloxera's presence minimal.34 Fur-thermore, as alcohol produced from grapes was more expensive than thatproduced from other sources, product adulteration remained a majorproblem, especially when wine prices showed a tendency to rise. Finally, asillustrated in Figure 2, with the brief exception of the period surrounding thefirst World War, there was no long term price incentive for cereal farmers toswitch to viticulture. This is reflected in the fact that the contribution of theviticulture to agricultural output, far from growing, actually declined from12 per cent in 1891-95 to 8 per cent in 1929-33.35
180
1870 1880 1890 1900 1910 1920 1930
wine olive oil
Figure 2. Long run changes in relative prices of wheat> wine and oliveoil.Sources: Carreras (ed.), 1989, pp. 115-16 and Balcells 1980, pp. 376-8. Wheatprices for 1907-12 have been taken as an average of the September price inValladolid and Barcelona (Anuario estadistico 1920, pp. 190-1 and 1934, pp.258-9). Olive oil prices for 1908 and 1909 are the average for Barcelona {Anuarioestadistico 1920, pp. 190-1).
The olive was another crop of major importance both for the domesticand external market, with about a fifth of total output exported in thedecade prior to the Civil War. Between 1901-12 and 1926-35, the areaunder olives grew by a third, agricultural yields increased by 28 per cent, but
34 Opportunity costs are difficult to measure, although for La Mancha (Albacete, CiudadReal, Cuenca and Toledo) wheat yields averaged only 0.6 tons per hectare in 1909-14(Torres 1944, pp. 247-72), against a national average of 0.9 in Spain, 0.7 in Algeria, 1.1in Italy, 1.3 in France and 2.2 in the British Isles (calculated from Malenbaum 1953, pp.236-9). Lewis notes a figure of 7001b per acre (0.8 tons per hectare) for tropicalcountries in 1900 (1978, p. 188). In some regions of Algeria and central Spain, phylloxerawas still absent in the 1920s.
35 Simpson 1995b, appendix id.

76 European Review of Economic History
industrial yields in the manufacture of olive oil saw virtually no change.These movements in productivity are deceptive however, for whilst animportant part of the increase in agricultural yields appears to have beenachieved by simply having a greater proportion of the nation's trees in fullproduction, and by farmers increasing annual variable costs to take advan-tage of favourable prices (extra ploughings, hoeings, greater care in harvest-ing, etc.)j the most significant change in this sector during the period waswithout doubt the modernization of the olive mills and presses.
In the nineteenth century, most Spanish olive oil exported was of poorquality, and used for industrial purposes, namely lighting, as a raw materialin the manufacture of soap, and as a lubricant for machinery. The growth ofother cheaper vegetable substitutes implied that, to retain markets, pro-ducers had to improve product quality, switching from the industrial to theedible oil market, which in turn required considerable investment in newplant. From a low of 16.7 thousand tons of olive oil exported in the decade1886-95, exports grew to 74.4 thousand tons in 1926-35. However, the sixmajor markets for Spanish olive oil between 1865 and 1935, namely Italy,France, Cuba, Argentina, United States and Great Britain, illustrate onceagain the limitations of the export market for Spanish producers, as five ofthe six countries were either Mediterranean countries (and therefore pro-ducers themselves), or had large Mediterranean immigrant populations.Market size was therefore limited by taste and cultural experiences.36
Olive oil processing required a cash investment which could not be easilysubstituted by labour and which, by allowing economies of scale, gave thelarger producer an advantage over the smaller one. This led to a greaterconcentration of production as small producers sold their fruit to the largermanufacturer.37 However, although the technical change in manufacturingincreased product quality and opened up new markets, the greater part ofthe value added was obtained in the growing and harvesting of the crop.Government estimates in 1921 suggest that only 10 per cent of the price ofolive oil could be attributed to the manufacturing process.38 Therefore 90per cent of the cost of olive oil was based on the use of extensive areas ofrelatively unfertile soil, and some of Europe's cheapest casual agriculturallabour.
As with the viticulture, Spanish olive oil producers found increasingcompetition from other cheap cost producers in the Mediterranean, and by1929-33 Greece, Tunisia and Algeria had captured a third of internationaltrade.39 However, competition from countries with labour cheaper thanSpain's was only part of the problem. The difficulties in mechanizing olive
36 The sixth country, Britain, was of declining importance from the late nineteenth centuryas cheaper vegetable oils were used for industrial purposes.
37 For the example of the company Carbonell in Cordoba, Zambrana 1987, chapter 4.38 Direction General de Agriculturay Montes, 1923.39 Zambrana 1987, p. 296.

Did tariffs stifle Spanish agriculture before 1936? JJ
growing, especially the harvest, led to growers facing competition eitherdirectly from other, cheaper vegetable oils, or indirectly through the mixingof them with olive oil. This played an important part in depressing prices,and limited the switch of land away from cereals into olives. As a result, ifcereals and legumes accounted for 62 per cent of arable land, and 55 percent of crop output in 1891-5, the area remained unchanged at 62 per centin 1931, although output fell slightly to 45 per cent.40
As suggested by Tracy, a major factor in productivity growth in northernEurope's agriculture from the late nineteenth century was the movement ofresources away from the production of bread cereals, where demand tendedto be stagnant and producers faced growing international competition, andinto livestock products. Thus in Great Britain the area devoted to wheat fellby a half and the number of cattle increased by 30 per cent between 1870and 1910. In France, whilst the value of cereals stagnated, the output ofmeat and dairy produce increased by 48 per cent between 1865-74 and1905-14. In Italy, the number of cattle increased by 40 per cent between1880 and 1910, and there were significant increases in the numbers of pigs,sheep and goats.41 If in Germany there was no fall in the area of wheat andrye, the number of cattle rose by a third between 1873 and 1913.42 In Spain,the situation is harder to establish on account of the lack of reliable censuses,and the problem of calculating suitable production coefficients. In general,however, livestock numbers do not appear so very different in 1929 as theywere in 1917 or 1865.43 By contrast, the area of wheat grew throughout mostof the nineteenth century, and increased by 24 per cent and production by34 per cent between 1905-9 and 1930-4.
There can be few doubts that this failure to switch resources out of breadgrains and into meat and dairy produce was a major cause of the lowproductivity in the agricultural sector in Spain. That said, it is much moredifficult to establish to what extent the failure was the result of tariffs, and towhat extent other factors should be blamed.
The question however, is not one of free trade or protection for cereals, asSpanish livestock producers also enjoyed strict controls on imports. Popu-lation growth, improvements in per capita incomes, real wages and growingurbanization over the period 1865-1936 might be expected to have pro-duced an increase in demand for livestock produce. The virtual stagnationin herd size as shown in the censuses of 1865, 1917 and 1933 suggests,
40 GEHR 1983a, pp. 243-4. Fallow land has been excluded.41 The number of pigs increased by 28 per cent, sheep by 40 per cent and goats by 36 per
cent, Mitchell 1992, pp. 347-8.42 Statistical Abstract for the United Kingdom, Toutain 1961, Statistisches Jahrbuch fur das
Deutsche Recish, all cited in Tracy, 1989 pp. 51, 76 and 100-1.43 Taking the herd size (live weight) to have been 100 in 1865, it was 98 in 1750, 87 in 1917
and 105 in 1929. Garrabou and Sanz (1985) cuadro 20 and GEHR (1978) apendice. Seealso Simpson, 1995a, p. 180.

78 European Review of Economic History
however, that per capita supply fell. If demand for meat was indeed risingfaster than supply, then prices would be expected to be rising against thoseof bread. Figure 3 shows that this indeed was the case in Madrid from themid i88os, with growth being especially strong after the first World War.The trend for Paris, although moving in the same direction, was lessattractive to livestock producers. In response to these changes in prices,Spanish farmers started to switch resources away from bread grains and intofeed. As early as 1926, Flores de Lemus had noted the growing importanceof feed grains compared to bread, and suggested that this was the onlyfeasible alternative for cereal farmers, given the stagnation in domesticdemand and the impossibility of exporting wheat.44 The government alsoreacted to rising meat prices by allowing annual imports of 283 thousandtons of maize between 1920-33, the equivalent of 44 per cent of thedomestic harvest. The value of livestock output increased by 30 per centbetween 1909-13 and 1929-33.45
0 . 6 • 1 1 1 1 1 . 1 1 1 • • 1 1 1 1 1 1 1 1 M . . • 1 . 1 •. . 1 1 11850 1860 1870 1880 1890 1900 1910 1920 1930
Paris Madrid
Figure 3. Meat-Bread price ratio in Madrid and Paris, 1850-1930.Note: 1848-52 = 1.005. Year averages have been used.Source: Calculated from Singer-Kerel 1961, pp. 462-4 and Reher and Ballesteros
I993> PP- 139-42.
In theory, lower prices for bread, achieved through a more liberal tariffpolicy, might have released more land for feed grains which could have beendiverted towards livestock produce. In reality, such a policy is likely to havehad limited results, and for two reasons. First, whereas the arrival of cheapgrain allowed a re-orientation of western European agriculture, the possibil-ities in the Mediterranean countries, and Spain in particular, were much
44 Flores de Lemus 1926. See also Jimenez Blanco 1986 and GEHR 1988, p. 61.45 Simpson 1995b, Table 2.

Did tariffs stifle Spanish agriculture before 1936? 79
less. On the secano, which covers about four fifths of Spain, naturalconditions were inappropriate for intensive livestock farming as practiced inEurope prior to the second World War. Second, natural pastures werenotoriously poor, and artificial pastures virtually absent.46 Until the develop-ment of intensive, stall feeding technologies, which could be adapted toMediterranean type climates, Spain's meat consumption would remainlow.
An alternative policy would have permitted free trade in both grains andlivestock produce, thereby hastening considerably the rural exodus. If thisalternative would have been regarded as far fetched by contemporaries in thepre-Civil War period, evidence presented below suggests that the size of theexpected rural exodus would have been smaller than is often supposed.
4. Tariffs: an obstacle to off-farm migration?
The belief that tariff policy in Spain slowed the rural exodus is frequentlyfound in the literature.47 Likewise, it is argued that protection, in its variousforms, is essential to understanding why the area under cereals and legumesincreased by 1.47 million hectares, or 18.3 per cent, between 1886-90 and1930-5.48 While there can be no question that farmers increased output inresponse to favourable prices, or that the rural exodus would have beenfaster if the government had not favoured the sector, a closer look at bothquestions is required.
Between 1887 and 1910, the number of male workers in agricultureincreased by 16 per cent, from 4.0 millions to 4.7 millions; by contrast,between 1910 and 1930 the figure fell by 18 per cent, to 3.8 millions.Whereas between 1887 and 1910 agriculture accounted for about two thirdsof the active population, the figure in 1930 had fallen to 45 per cent. Recentwork by Sanchez Alonso suggests that emigration was weak before about1904, but thereafter increased significantly. However, within a decade, themain attraction for agricultural labour was Spain's rapidly growing cities.49
Sanchez Alonso argues that the main explanation to account for the rapidincrease in emigration after 1904 was the decline in the real level ofprotection that cereal farmers enjoyed, on account of the strengthening ofthe peseta.50 However, tariffs were increased across the board in 1906, and
46 See especially Tortella 1994a, and Galassi 1986. In 1931 the area of artifical pastures inSpain was 374 thousand hectares, or 2.4 per cent of the total. GEHR 1983a.
47 Tortella 1987, p. 52, Prados de la Escosura 1988, p. 102 Sanchez Alonso 1995, pp.184-5.
48 GEHR 1983b.49 Between 1882 and 1904 Spain had a net emigration of just 185,000, compared to the
819,000 between 1904 and 1913. Between 1914 and 1930 there was a net return of108,000. Sanchez Alonso 1995, pp. 45-7 and Table A3.6. See also Tortella 1987, p. 52and Perez Moreda 1987, p. 36.
50 GEHR 1980, p. 98 and Sanchez Alonso 1995, pp. 185-6.

8o European Review of Economic History
Tena has shown that agriculture was the sector that benefited most.51 Cerealfarmers would also benefit, as we have seen, from direct government priceintervention during the interwar period. Yet the years prior to the first WorldWar do appear to be a watershed, as not only does the rural exodus begin tostart in earnest, but this also marks the timing of a significant increase in thearea of cereals and legumes.
If tariffs encouraged an increase in cereal output, which under conditionsfound in Spain implied an extension in the area cultivated,52 we might expectpopulation to be retained in agriculture in those areas which saw a growth inthe area cultivated, and released where there was no increase, or where itwas minimal. However, at first glance, Table 5 suggests this was not thecase. Between 1886-90 and 1902-12 the total area sown with cereals andlegumes declined slightly, whereas the labour force grew by 15 per cent. Bycontrast, between 1902-12 and 1930-5 the area grew by 20 per cent whilethe labour force fell by the same amount. Nevertheless, a closer look atregional changes in the Table, together with a consideration of widerchanges that were taking place, allows us to learn more about the nature ofprotection, and its impact on Spanish agriculture.
Between 1886-90 and 1902-12 the rural labour force grew faster inprecisely those areas where the area under cereals and legumes declined,namely in the south of the country (La Mancha, eastern Andalucia andExtremadura).53 This was caused, at least in part, by the increase in othercrops suitable to these regions, namely the olive (especially in easternAndalucia) and the vine (La Mancha). Nationally, output per male workerstagnated between 1891-5 and 1909-13, caused by a combination of failingto increase cereal output, switching resources more quickly into other highervalue crops, or mechanization.54 However, it would be difficult to argue, onthe basis of Table 5, that protection for cereal farmers was a significantrestraint to the rural exodus in this first period.
By contrast, the period between 1902-12 and 1930-5 does suggest thatcereal protection did play some role in determining the speed of the ruralexodus. Thus, with the exception of Castilla-Leon, off-farm migration wasfastest in those areas which saw the smallest growth in the area of cereals andlegumes. In the south of the country (Andalucia, La Mancha and Extrem-adura), the area cultivated grew significantly, but the rural population fellonly very slightly. However, this poses a paradox, as it implies that in areasof small farms (most notably Castilla-Leon) tariffs encouraged both anextension in the area sown and a significant fall in farm population; by
51 Tena forthcoming.52 For an explanation of why Spanish cereal farmers increased the area cultivated, as oppose
to trying to improve yields, see Simpson 1995a, pp. 119-24.53 Table 5 refers to areas of dry farming, and therefore excludes the northern provinces.
The choice of dates has been determined, at least in part, by the availability of sources.54 Output increased by just 12 per cent. Simpson 1995b, p. 200.

Did tariffs stifle Spanish agriculture before 1936? 81
Table 5. Changes in areas sown of cereals-legumes and ruralpopulation.
(a) 1886/90-1902/12.
Western AndaluciaCastilla-LeonEbro valleyPais ValencianoCatalufiaLa ManchaEastern AndaluciaExtremaduraSPAIN
(b) 1902/12-1930/5.
La ManchaExtremaduraCastilla-LeonEastern AndaluciaWestern AndaluciaEbro valleyCatalufiaPais ValencianoSPAIN
% change insown
+ 13.0+2.3+ 1.9-0-3-2 .3
-12.4-13.7-11.3- i - 3
% change inarea sown
+54-8+29.1+22.0+20.9+ 18.6+ 18.1+ 14.1+ 8.0
+ 19.8
% change infarm population
+4.8+ 16.4-0 .3
+23.6+ 17.4+20.3+22.2+ 15.8+ 15.0
% change infarm population
-3.6-15-3-35-3-5-5-0 .7
-19.1-24.3-28.0-20.3
% total area1902-12
8.423-310.2
5.65-9
14.19-4
11.688.5
% total area1930
18.212.523.7
9-48.3
10.15.65-i
92.9
Notes: Farm population refers to male labour only.
Regions: Ebro valley (Alava, Huesca, Navarra, Rioja, Teruel and Zaragoza), La Mancha(Albacete, Ciudad Real, Cuenca and Toledo), Extremadura (Badajoz, Caceres andSalamanca); Western Andalucia (Cadiz, Cordoba, Huelva and Sevilla); Castilla-Leon(Avila, Burgos, Guadalajara, Leon, Madrid, Palencia, Segovia, Soria, Valladolid andZamora); Pais Valenciano (Alicante, Castellon, Murcia and Valencia), Catalufia (Baleares,Barcelona, Girona, Lleida and Tarragona) and Eastern Andalucia (Almeria, Jaen, Granadaand Malaga).
The Canary Islands and the north of Spain has been excluded, except for the total area ofcereals and legumes.
Sources: GEHR 1983b and Censos de poblacion.
contrast, it was in the areas of latifundios (large estates) and day labourers, inthe south of the country, where the extension in cultivation was accom-panied by a growth in the labour force.55 To examine this paradox, we have
55 See especially Bernal, 1985, pp. 243-8.

82 European Review of Economic History
to consider very briefly the political economy of tariffs, and the widerdeterminants of migration.
In the face of low cereal prices, the choice of tariffs (or some other systemof price support), was just one potential policy option. In other countries,such as Canada or France, agricultural policy was strongly influenced by theinterests of the family farmer, as reflected by the dominant role of cooper-atives.56 In Spain, cooperatives appeared, especially after the first WorldWar, and helped the diffusion of new machinery and artificial fertilizers, butthey never seriously influenced government policy. The choice of anagricultural policy based essentially on price intervention reflects the dis-tribution of political power. Protection was the optimal policy choice for thelarge cereal farmers, and Bernal has argued that the level of protection wasdeliberately set so that the small family farms in Castilla-Leon, withgenerally poorer quality land than in Andalucia, would remain profitable.57
However, for the family farm to remain viable, it was necessary to increasethe land:labour ratio and this was done, as reflected in Table 5, by bothexpelling labour and increasing the area cultivated. As I have shownelsewhere, it was in the areas of small farmers where the diffusion of thereapers was fastest before the Civil War.58 The example of Castilla-Leon,which accounted for 26 per cent of the increase in the area cultivatedbetween 1902-12 and 1930-35, and 27 per cent of the decline in theagricultural labour force, suggests that a simple argument relating cerealprotection with restricting off-farm migration is incorrect. In the south bycontrast, the large estates benefited from cheap labour which frequentlymade such mechanization unprofitable. Here the over-reliance on systemsof price support to maintain farm profitability delayed farm mechanization,which in turn depressed productivity growth. Thus, whilst labour productiv-ity in Castilla-Leon was 16 per cent greater than in Andalucia in 1909-13,the difference had increased to 52 per cent by 1929-33.59 Yet the fact thatland:labour ratios in Andalucia were only approximately half those else-where, and that wages and living conditions were notoriously poor even withtariffs, suggests that something other than just the price of wheat wasdetermining the rate of off-farm migration.60 A policy which would haveallowed cereal prices to fall to levels such as those in England would no56 See, for example, the study by deary 1989, for France, and that by Solberg 1987, for
Canada.57 Bernal 1985, p. 261.58 Simpson 1995a, pp. 158-67.59 In Castilla-Leon, labour productivity grew by an annual 2.5 per cent beween 1910 and
1930, compared to only 1.1 per cent in Andalucia. Calculated from Simpson 1995b,Table 7 and Appendix 2.
60 In 1930, there were 5 hectares of cultivated land per male worker in Andalucia, comparedto about 10 hectares in the interior of the country. In the Mediterranean region, thefigure was 4 hectares, but this would include an important area of high value fruit treesand irrigated land. Simpson 1995a, Table 10.2.

Did tariffs stifle Spanish agriculture before 1936? 83
doubt have reduced living standards even further in Andalucia, but wouldnot have done anything to have increased those other factors, such thesupply of information, education, potential access to land, etc., which areoften considered as helpful in encouraging rural labour to migrate. Even inthe south, tariffs are insufficient to explain the delay in the rural exodus.
Conclusion
The aim of this paper is to question the importance of tariffs, especiallythose for cereals, in explaining the backward nature of Spanish agriculture.Despite obvious changes in the economy, not least in the agricultural sectoritself, Spain was still a poor country in 1936. However, if diets were poor incomparison to those in northern Europe, this was a characteristic that thecountry shared with other Mediterranean countries. Yet if tariffs, and otherforms of price intervention, pushed prices higher than those on the inter-national market, internal wheat prices in Spain were not so different fromthose in France or Germany. By contrast, whereas farmers in these twocountries reacted to cheap imports both by protection and by switchingresources into other commodities, this did not happened to any great extentin Spain. This was due not to the inefficiency of Spanish farmers, but ratherthe limited market opportunities for alternative crops such as the vine andolive, and the technical difficulties in introducing intensive livestock farmingsystems in a country which suffered long summer droughts.
In the final section, I argue that tariffs and price intervention cannot explainadequately the speed of the rural exodus. Between 1886-90 and 1902-12, aperiod which saw the introduction of few labour-saving farm machines, theregions which saw the biggest decline in cereals also experienced the biggestincrease in their farm populations. By contrast, the period between 1902-12and 1930-5 shows a better correlation between changes in the area croppedand the release of labour, suggesting perhaps that tariffs might have acted as abrake on off-farm migration. However, nationally, the active population inagriculture declined rapidly, from about two thirds in 1910, to 45 per cent in1930, implying that at best the influence of tariffs must have been weak. Moreimportantly, within Spain itself, the response to price intervention was verydistinct. In Castilla-Leon, the policy appears to have been a stimulus to bothoff-farm migration and technical change.61 By contrast, in the south, the size ofthe labour force declined only slowly, but the area cropped increased.
If tariffs cannot be considered as the major factor in explaining the poorperformance of Spanish agriculture prior to the Civil War, what can?Certainly natural resources were not favourable for the type of intensive
61 In a different context, Clarke 1994, has argued that intervention by the government wascrucial in providing the necessary investment climate, so that farmers could takeadvantages of the new technologies from the 1930s, which produced the rapid growth inagricultural productivity in the United States.

84 European Review of Economic History
agriculture as increasingly found in northern Europe. But this type ofargument has only limited explanatory value, not least because naturalresources would not be any different in the 1960's when Spanish agriculturestarted to modernize rapidly. The poverty and low productivity of the southmentioned above highlights the failure of government policy. However, toblame this on protection, and prescribe less government as being a betteralternative, also seems insufficient. Slow productivity growth was just asmuch a question of the country's poor roads, its inefficient railways, thelimited area of irrigation, low investment in elementary schooling or indeveloping new crops and plant strains, all of which would have required afundamental overhaul of the country's finances, and an active, not passiverole for the state. Whereas it is certainly true that tariffs, whether onagricultural or industrial produce, were easy policy choices, they were alsopolitical decisions, and therefore susceptible to the influence of pressuregroups.62 If Spanish farmers were not encouraged to switch out of cerealsbecause of the higher prices they received because of protection, moreserious was the failure of government to provide the lead in developingalternative crops, or in investing in basic infrastructure.
Acknowledgement
I am grateful to Lluis Argemi, Pedro Fraile, Tim Hatton, Enrique Uopis,Leandro Prados de la Escosura, Antonio Tena, Gabriel Tortella, FranciscoZambrana and to two anonymous referees for helpful comments. The usualdisclaimer applies. Financial support was provided by DGICYT PS94-0005.
References
BALCELLS, A. (1980). Elproblema agrario en Cataluna. La cuestion Rabassaire.Madrid: Ministerio de Agricultura.BERNAL, A. M. (1985). La llamada crisis finisecular (1872-1919). In GarciaDelgado (ed.), Espana de la Restauracion. Madrid: Siglo XXI.CARRERAS, A. (ed.), (1989). Estadistica historicas de Espana siglos XIX—XX.Barcelona: Fundacion Banco Exterior.CLARKE, S. H. (1994). Regulation and the Revolution in United States FarmProductivity. Cambridge, UK: Cambridge, University Press.CLEARY, M. C. (1989). Peasants, Politicians and Producers: The Organisation ofAgriculture in France since 1918. Cambridge, UK: Cambridge University Press.DIRECCI6N GENERAL DE AGRICULTURA Y MONTHS (1923). El aceite de oliva.Madrid.DIRECCI6N GENERAL DE TRABAJO, (1931). Estadistica de salariosy jornadas detrabajo referidas alperiodo 1914—1930. Madrid.EPAPM, El Progreso Agricola y Pecuario (1928). Madrid.
62 See especially Varela Ortega 1977, and Fraile 1991.
Did tariffs stifle Spanish agriculture before 1936? 85
FLORES DE LEMUS, A. (1926). Sobre una direction fundamental de la productionrural espanola. Reprinted in Moneday Credito, 1951, 36, pp. 141-68.FRAILE, P. (1991). Industrializationy grupos de presion. La economia politica de laprotection en Espana 1900-1950. Madrid: Alianza.FRAILE, P. (1993). La economia del proteccionismo. Paper presented at the VCongreso de la Asociacion de Historia Economical San Sebastian.GALASSI, F. (1986). Reassessing Mediterranean agriculture: retardation andgrowth in Tuscany, 1870-1914. Rivista de storia economica, 3, pp. 91-121.GALLEGO, D. (1986). Tranformaciones tecnicas de la agricultura espanola en elprimer tercio del siglo XX. In R. Garrabou, C. Barciela and I. Jimenez Blanco(eds), Historia agraria de la Espana contempordnea, 3. Elfin de la agriculturatraditional (1900-1960). Barcelona: Editorial Critica.GARRABOU, R. and SANZ, J. (eds). (1985). Historia agraria de la Espanacontempordnea, 2. Expansion y crisis (1850-1900). Barcelona: Editorial Critica.GRUPO DE ESTUDIOS DE HISTORIA RURAL (GEHR). (1978). Contribution alanalisis historico de la ganaderia espanola, 1865-1929. Agricultura y Sociedad, 8,pp. 129-82.GEHR, (1980). Los precios del trigoy la cebada en Espana, 1891-1907. Madrid:Banco de Espana.GEHR, (1983a). Notas sobre la production agraria espanola, 1891-1931. Revistade Historia Economica, 1, pp. 185-252.GEHR, (1983b). Evolution de la superficie cultivada de cereales y leguminosas enEspana, 1886-1935. Agriculturay Sociedad, 29, pp. 285-325.GEHR, (1988). La crisis agricola en Castilla la Vieja y Andalucia: los casos deltrigo y el olivar. In R. Garrabou (ed.). La crisis agraria defines del siglo XIX.Barcelona: Editorial Critica.JIMENEZ BLANCO, J. I. (1986). Flores de Lemus y la production rural de sutiempo. In G. Delgado (ed.) La crisis de la Restauracion: Espana, entre la primeraguerra mundialy la II Republica. Madrid: Siglo XXI.LEWIS, W. A. (1978). Growth and Fluctuations, 1870-1913. London: George Allen &Unwin.LIEPMANN, H. (1938). Tariff Levels and the Economic Unity of Europe. London:George Allen & Unwin.LINDERT, P. (1989). Economic Influences on the History of Agricultural Policy.Working Paper, Agricultural History Center, University of California.LINDERT, P. (1991). Historical Patterns of Agricultural Policy. In C. P. Timmer,Agriculture and the State: Growth, Employment, and Poverty in Developing Countries.Ithaca: Cornell University Press.MALENBAUM, W. (1953). The World Wheat Economy, 1885-1939. Cambridge, MA:Harvard University Press.MALUQUER DE MOTES, J. (1987). De la crisis colonial a la guerra europea: veinteanos de economia espanola. In J. Nadal, A. Carreras and C. Sudria (eds), Laeconomia espanola en el siglo XX, Una perspectiva historica. Barcelona: Ariel.MINISTERIO DE AGRICULTURA, (1936). Anuario Estadistico de las ProduccionesAgricolas, Ano 1935. Madrid.MITCHELL, B. R. (1992). International Historical Statistics. Cambridge, UK:Cambridge University Press.

86 European Review of Economic History
MITCHELL, B. R. and DEANE, P. (1962). Abstract of British Historical Statistics.Cambridge, UK: Cambridge University Press.MONTOJO SUREDA, J. (1945). La politica espahola sobre trigosy harinas (Anos1900-194$). Madrid.NADAL, J. (1973). The failure of the Industrial Revolution in Spain, 1830-1914. InThe Fontana Economic History of Europe, 4(2). Glasgow: Fontana/Collins.NADAL, J. (1985). Un siglo de industrializacion en Espafia en el siglo xix. In N.Sanchez-Albornoz (ed.), La modernization economica de Espafia. Madrid: Alianza.NUNEZ, C. E. (1992). Lafuente de la riqueza. Education y desarrollo economico en laEspafia Contempordnea. Madrid: Alianza.O'BRIEN, P. K. and PRADOS DE LA ESCOSURA, L. (1992). Agricultural product-ivity and European industrialization, 1890-1980. Economic History Review, 45,514-36.PALAFOX, J. (1991). Atraso economicoy democracia. La Segunda Republicay laeconomia espanola, 1892-1936. Barcelona: Editorial Critica.PAN-MONTOJO, J. L. (1994). La Bodega delMundo. La vidy el vino en Espafia,1800-1936. Madrid: Alianza.PARIS EGUILAZ, H. (1943). El movimiento deprecios en Espafia. Madrid: CSIC.PEREZ MOREDA, V. (1987). Spain's demographic modernization: 1800-1930. In N.Sanchez-Albornoz (ed.) The Economic Modernization of Spain, 1830-1930. NewYork: New York University Press.PINILLA NAVARRO, V. (1992). La produccion agraria en Aragon (1850-1935).Revista de Historia Economica, io, pp. 399-429.PRADOS DE LA ESCOSURA, L. (1982). Comercio exteriory crecimiento en Espafia1826-1913. Madrid: Banco de Espafia.PRADOS DE LA ESCOSURA, L. (1988). De imperio a nation. Crecimientoy atrasoeconomico en Espafia (1780-1930). Madrid: Alianza.PRADOS DE LA ESCOSURA, L. (1992). Crecimiento, atraso y convergencia enEspafia e Italia: introduccion. In L. Prados de la Escosura and V. Zamagni (eds),El desarrollo economico en la Europa del sur. Madrid: Alianza, pp. 27-55.PRADOS DE LA ESCOSURA, L. (1993). Spain's Gross Domestic Product, 1850-1990:A New Series. Documento de Trabajo, Ministerio de Economia y Hacienda.REHER, D. Y BALLESTEROS, E. (1993). Precios y salarios en Castilla la Nueva: Laconstruction de un indice de salarios reales, 1501-1991. Revista de HistoriaEconomica, 11, pp. 101-151.SANCHEZ-ALBORNOZ, N. (1963). Las crisis de subsistencias de Espafia en el siglo XIX.Rosario, Argentina: Instituto de Investigaciones Historicas.SANCHEZ ALONSO, B. (1995). Las causas de la emigration espanola 1880-1930.Madrid: Alianza Universidad.SIMPSON, J. (1989). La produccion agraria y el consumo espafiol en el siglo xix.Revista de Historia Economica, 7, pp. 355-88.SIMPSON, J. (1995a). Spanish Agriculture: The Long Siesta, 1765-1965. Cambridge,UK: Cambridge University Press.SIMPSON, J. (1995b). Spanish agricultural production and productivity 1890-1936.In P. Martin-Acena and J. Simpson (eds), The Economic Development of Spain since1870. Aldershot, UK: Edward Elgar.SIMPSON, J. (1996). La oferta y la demanda de vinos espafioles en el siglo XIX. In

Did tariffs stifle Spanish agriculture before 1936? 87
A. Gomez Mendoza, Economia y sociedad en la Espana moderna y contempordnea.Madrid: Editorial Sintesis.SINGER-KEREL, J. (1961). Le com de la vie a Paris de 1840 a 1954 (Vol. 3 ofRecherches sur l'economie francaise of the Service d'etude de l'activiteeconomique de la FNSP). Paris: Armand Colin.SOLBERG, C. E. (1987). The Prairies and the Pampas. Agricultural Policy in Canadaand Argentina. Stanford, CA: Stanford University Press.TENA, A. (1992). Proteccion y competitividad en Espana e Italia, 1890-1960. InL. Prados de la Escosura and V. Zamagni (eds), El desarrollo economico en la Europadel sur. Madrid: Alianza.TENA, A. (forthcoming). La proteccion nominal en Espana 1870-1930: nuevosindicadores e interpretaciones. Madrid: Banco de Espana.TORRES, M. DE (1944). Elproblema trigueroy otras cuestiones fundamentales de laAgricultura espanola. Madrid: CSIC.TORTELLA, G. (1987). Agriculture: a slow-moving sector, 1830-1935. In N.Sanchez-Albornoz, The Economic Modernization of Spain, 1830-1930. New York:New York University Press.TORTELLA, G. (1994a). Patterns of economic retardation and recovery in south-western Europe in the nineteenth and twentieth centuries. Economic HistoryReview, 47, pp. 1-24.TORTELLA, G. (1994b). El desarrollo de la Espana contempordnea. Historia economicade los siglos XIXy XX. Madrid: Alianza.TOUTAIN, J. C. (1961). Le produit d'l'agriculture francaise de 1700 a 1958. Cahiersde I'lSEA, AF4.TRACY, M. (1989). Government and Agriculture in Western Europe 1880—1988.London: Harvester Wheatsheaf.VARELA ORTEGA, J. (1977). Los amigos politicos. Partidos, eleccionesy caciquismo en laRestauracion (1875-1900) . Madrid: Alianza.WARNER, C. K. (i960). The Winegrowers of France and Government since 1875. NewYork: Columbia University Press.WILLIAMSON, J. G. (1995). The evolution of global labor markets since 1830:background evidence and hypotheses. Explorations in Economic History, 32, pp.141-96.YATES, P. L. (i960). Food, Land and Manpower in Western Europe. London:Macmillan.ZAMBRANA, J. F. (1987). Crisis y modernizacion del olivar espanol, 1870—1930.Madrid: Ministerio de Agricultura.