Diamond-like carbon for data and beer storage · fraction of diamond-like (sp3) bonds is known as...
10
ISSN:1369 7021 © Elsevier Ltd 2007 JAN-FEB 2007 | VOLUME 10 | NUMBER 1-2 44 Diamond-like carbon for data and beer storage Carbon is a very versatile element that can crystallize in the forms of diamond or graphite. There are many noncrystalline carbons, known as amorphous carbons. An amorphous carbon with a high fraction of diamond-like (sp 3 ) bonds is named diamond-like carbon (DLC). Unlike diamond, DLC can be deposited at room temperature. Furthermore, its properties can be tuned by changing the sp 3 content, the organization of the sp 2 sites, and the hydrogen content. This makes DLC ideal for a variety of different applications. We review the use of ultrathin DLC films for ultrahigh-density data storage in magnetic and optical disks and ultralong beer storage in plastic bottles. Cinzia Casiraghi*, John Robertson, and Andrea C. Ferrari* Cambridge University, Engineering Department, 9 JJ Thomson Avenue, Cambridge CB3 OFA, UK *E-mail: [email protected]; [email protected] Carbon-based materials play a major role in today’s science and technology. Carbon is a very versatile element that can crystallize in the form of diamond and graphite. In recent years, there have been continuous and important advances in the science of carbon such as chemical vapor deposition of diamond 1 and the discovery of fullerenes 2 , carbon nanotubes 3,4 , and single-layer graphene 5 . There have also been major developments in the field of disordered carbons. In general, an amorphous carbon can have any mixture of sp 3 , sp 2 , and even sp 1 sites, with the possible presence of hydrogen and nitrogen. The compositions of nitrogen-free carbon films are conveniently shown on a ternary phase diagram (Fig. 1). An amorphous carbon with a high fraction of diamond-like (sp 3 ) bonds is known as diamond-like carbon (DLC). Unlike diamond, DLC can be deposited at room temperature, which is an important practical advantage. DLCs possess an unique set of properties, which has lead to a large number of applications such as, for example, magnetic hard disk coatings; wear-protective and antireflective coatings for tribological tools, engine parts, razor blades, and sunglasses; biomedical coatings (such as hip implants or stents); and microelectromechanical systems 6-10 . We first review the different varieties of DLCs. We then show how ultrathin DLC films enable ultrahigh-density data storage in magnetic and optical disks and ultralong shelf life for beer canned in plastic bottles. In the first case, up to ~1 Tbit/in 2 can be reached using sub-2 nm, atomically smooth films that act as a corrosion barrier to the recording medium. In the second case, hydrogenated amorphous carbons in the 100 nm thickness range provide a gas permeation barrier and enable standard polyethylene terephthalate (PET) bottles to efficiently store beer and carbonated soft drinks for tens of weeks.
Transcript of Diamond-like carbon for data and beer storage · fraction of diamond-like (sp3) bonds is known as...

ISSN:1369 7021 © Elsevier Ltd 2007JAN-FEB 2007 | VOLUME 10 | NUMBER 1-244
Diamond-like carbon for data and beer storage
Carbon is a very versatile element that can crystallize in the forms of diamond or graphite. There are many noncrystalline carbons, known as amorphous carbons. An amorphous carbon with a high fraction of diamond-like (sp3) bonds is named diamond-like carbon (DLC). Unlike diamond, DLC can be deposited at room temperature. Furthermore, its properties can be tuned by changing the sp3 content, the organization of the sp2 sites, and the hydrogen content. This makes DLC ideal for a variety of different applications. We review the use of ultrathin DLC films for ultrahigh-density data storage in magnetic and optical disks and ultralong beer storage in plastic bottles.
Cinzia Casiraghi*, John Robertson, and Andrea C. Ferrari*
Cambridge University, Engineering Department, 9 JJ Thomson Avenue, Cambridge CB3 OFA, UK
*E-mail: [email protected]; [email protected]
Carbon-based materials play a major role in today’s science
and technology. Carbon is a very versatile element that can
crystallize in the form of diamond and graphite. In recent years,
there have been continuous and important advances in the
science of carbon such as chemical vapor deposition of diamond1
and the discovery of fullerenes2, carbon nanotubes3,4, and
single-layer graphene5. There have also been major developments
in the field of disordered carbons. In general, an amorphous carbon
can have any mixture of sp3, sp2, and even sp1 sites, with the
possible presence of hydrogen and nitrogen. The compositions
of nitrogen-free carbon films are conveniently shown on a
ternary phase diagram (Fig. 1). An amorphous carbon with a high
fraction of diamond-like (sp3) bonds is known as diamond-like
carbon (DLC). Unlike diamond, DLC can be deposited at room
temperature, which is an important practical advantage. DLCs
possess an unique set of properties, which has lead to a large
number of applications such as, for example, magnetic hard
disk coatings; wear-protective and antireflective coatings for
tribological tools, engine parts, razor blades, and sunglasses;
biomedical coatings (such as hip implants or stents); and
microelectromechanical systems6-10.
We first review the different varieties of DLCs. We then show how
ultrathin DLC films enable ultrahigh-density data storage in magnetic
and optical disks and ultralong shelf life for beer canned in plastic
bottles. In the first case, up to ~1 Tbit/in2 can be reached using
sub-2 nm, atomically smooth films that act as a corrosion barrier to
the recording medium. In the second case, hydrogenated amorphous
carbons in the 100 nm thickness range provide a gas permeation
barrier and enable standard polyethylene terephthalate (PET) bottles to
efficiently store beer and carbonated soft drinks for tens of weeks.
MT1001_2p44_53.indd 44MT1001_2p44_53.indd 44 08/12/2006 11:13:3708/12/2006 11:13:37
JAN-FEB 2007 | VOLUME 10 | NUMBER 1-2 45
Dia
The amorphous carbons familyOne of the biggest hurdles in the amorphous carbon and DLC literature
is understanding what exactly is referred to with these generic terms.
Unfortunately, unlike carbon nanotubes, there are no simple indexes
to easily classify these materials. Often films with completely different
properties are called by the same name and vice versa. Thus, before
working with them, we need to introduce by name each member of the
amorphous carbon family. We also underline which carbon films can be
produced by which deposition technique.
The key parameters are: (i) the sp3 content; (ii) the clustering of the
sp2 phase; (iii) the orientation of the sp2 phase; (iv) the cross-sectional
nanostructure; and (v) the H or N content. Tetrahedral amorphous
carbon (ta-C) is the DLC with the maximum C-C sp3 content. This
material can be grown with deposition techniques involving energetic
ions, such as filtered cathodic vacuum arc (FCVA), mass-selected ion
beam deposition (MSIBD), and pulsed laser deposition (PLD)10-16. The
sp3 content mainly controls the elastic constants17, but films with the
same sp3 and H content but different sp2 clustering, sp2 orientation, or
cross-sectional nanostructure can have different optical and electronic
properties18. As we move from ordered graphite to nanocrystalline
graphite (nc-G) to amorphous carbon (a-C) and finally to sp3-bonded
ta-C, the sp2 groups become first smaller, then disordered, and finally
change from ring to chain configurations18-20. The evolution of the
sp2 phase clustering can be represented by the amorphization
trajectory18-20 (Fig. 2), consisting of three stages from graphite to ta-C.
These are as follows: (i) graphite → nc-G; (ii) nc-G → sp2 a-C; and (iii)
a-C → ta-C. Note how the sp2 clustering evolution and sp3 content
evolution follow two distinct paths (Fig. 2b).
We classify hydrogenated a-C into four types, as shown in Fig. 121:
1. a-C:H films with the highest H content (40-60 at.%). These films
can have up to 70% sp3. However, most of the sp3 bonds are
H-terminated and the material is soft and has low density6. We call
these films polymer-like a-C:H (PLCH). The bandgap ranges from
2-4 eV6. These films are usually deposited by plasma-enhanced
chemical vapor deposition (PECVD) at low bias voltage22-24.
2. a-C:H films with intermediate H content (20-40 at.%). Even if
these films have lower overall sp3 content, they have more C-C sp3
bonds than PLCH. Thus, they have better mechanical properties6.
Their optical gap is between 1 eV and 2 eV6. We call these films
Fig. 1 Ternary phase diagram of amorphous carbons. The three corners correspond to diamond, graphite, and hydrocarbons, respectively. Depending on the sp3 content and H content, DLC can be classified as: ta-C, which does not contain H and has a C-C sp3 content greater than 60%; PLCH if the H content is greater than 40 at.% and sp3 content is up to 70%; DLCH if H is 20-40 at.%; GLCH if H is below 20 at.% and the sp3 content is lower than 20%. In ta-C:H, the sp3 content can reach ~70% while the H content is 25-35% and the C-C sp3 content is much greater than in PLCH. DLCH has a lower sp3 content than ta-C:H, for a given H content.
Fig. 2 (a) Variation of the sp2 configuration along the three amorphization stages. (b) Schematic comparison of the evolution of the sp2 cluster size (La; black line) and sp3 content (red line). Note that in stages (1) and (2), a strong sp2 cluster size decrease corresponds to a relatively small sp3 increase, while the opposite is seen in stage (3).
(b)
(a)
Diamond-like carbon for data and beer storage REVIEW
MT1001_2p44_53.indd 45MT1001_2p44_53.indd 45 08/12/2006 11:13:5008/12/2006 11:13:50
JAN-FEB 2007 | VOLUME 10 | NUMBER 1-246
diamond-like a-C:H (DLCH). They are usually deposited by
PECVD21-23, electron cyclotron resonance (ECR), or reactive
sputtering at moderate bias voltage21,23-27.
3. Hydrogenated tetrahedral amorphous carbon films (ta-C:H) are
a class of DLCH in which the C-C sp3 content can be increased
while keeping a fixed H content, as in Fig. 1. Many films defined
in the literature as ta-C:H are just DLCHs. However, because of
the higher sp3 content (~70 %) and 25-30 at.% H, ta-C:H films
are really a different category as indicated by their Raman spectra,
higher density (up to 2.4 g/cm3), and Young’s modulus (up to
300 GPa)17,28. Their optical gap can reach 2.4 eV29. These films are
deposited by high-density plasma sources such as electron cyclotron
wave resonance (ECWR)29,30, and plasma beam source (PBS)31,32.
4. a-C:H with low H content (less than 20 at.%). They have a high sp2
content and sp2 clustering. The gap is under 1 eV6. We call these
films graphite-like a-C:H (GLCH). They are usually deposited by
PECVD at high bias22,23 or magnetron sputtering27.
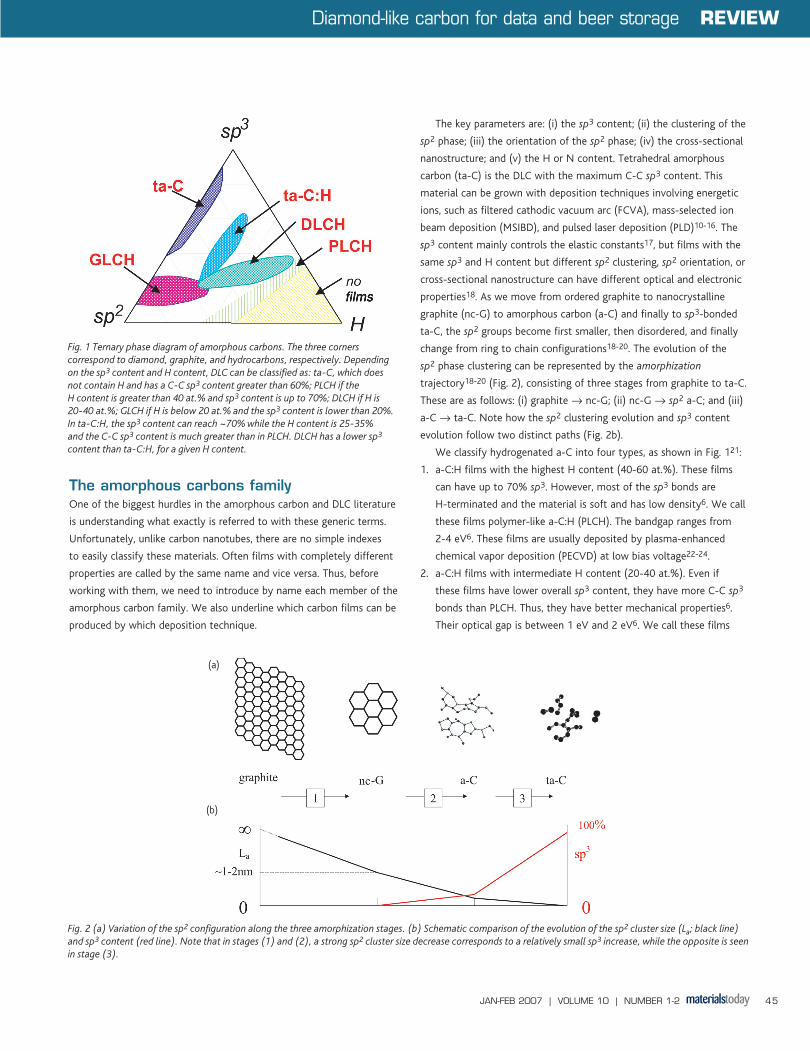
Carbon nitrides are another important class of carbon films often used
for tribological applications. As for hydrogenated amorphous carbons,
it is possible to classify the bonding in carbon nitride films into four
types, based on the bonding in the corresponding N-free films33. The
changes in the properties of the carbon nitride films as N content
is increased should be compared with the properties of the
corresponding N-free films. Thus, the variation of mechanical and
electronic properties when N is added to an sp2-bonded carbon film
differs from when N is added to a high sp3-content film. This is true
whether H is present or not. There are four basic types of carbon
nitride films, derived from sp2 a-C, ta-C, a-C:H (from polymeric to
diamond-like), and ta-C:H. Fig. 3 shows the ternary phase diagrams
that summarize the compositions of carbon nitrides with increasing N
content33:
1. a-C:N. Here N is introduced into a-C films with a high fraction of
sp2 bonds. An unusual aspect of these films is that a-C:N deposited
above 200°C can become nanostructured, with strong cross-linking
between graphitic planes, which gives an increase in mechanical
hardness and large elastic recovery34-37. This does not require,
however, an increase of the sp3 fraction (Fig. 3), but can rather
be seen as an increase in disorder35-37. This effect is exploited in
carbon nitrides used in magnetic storage, since the deposition of
the carbon layer on the disk is performed at ~200°C, the process
temperature resulting from the magnetic layer deposition.
2. ta-C:N. This group includes films deposited by MSIBD38, PLD39, or
FCVA40-43 either under N2 atmospheres or by N2-assisted beams.
Low-pressure deposition and high ionization ensure that film growth
is controlled by ions. Resistivity and optical gap decrease when
compared with pure ta-C films33. Generally, the sp3 content of
ta-C remains high at 80-90% up to about 10% N, and then the sp3
content and density fall rapidly33. This sharp decrease is the result
of the high deposition pressure44. The sp2 sites begin to cluster
together at low N contents (1%) before the sp3 to sp2 transition,
and this decreases the bandgap33. Note that, although a general
decrease of sp3 content with N is observed, the trends are different
according to the deposition systems33. This implies that the
evolution of the sp3 fraction and the degree of clustering of the sp2
phase can be different for films of the same N/C ratio33.
3. a-C:H:N. These films are usually grown by PECVD45-47. a-C:H:N
films have been deposited using a mixture of a hydrocarbon
gas, such as methane, acetylene, benzene, and N2 or NH3.
N incorporation is hindered if a high fraction of N2 or a high
substrate temperature is used. The best conditions for nitrogen
incorporation correspond to the lowest H content in the gas phase.
In contrast to a-C:N, the hardness in a-C:H:N films decreases with
N, because of the formation of more terminating groups, such as
NH2 and nitrile33. Higher substrate temperatures and substrate bias
decrease the overall N and H content, giving a more graphite-like
material. In principle, each a-C:H:N film can be further classified
as DLCHN, PLCHN, or GLCHN by considering the properties of the
‘host’ a-C:Hs and their classifications, as described above.
ta-C:N
a-C:NN
sp3
sp2
a-C:H:Nsp2
N
sp3
ta-C:H:N
Fig. 3 Ternary phase diagrams of amorphous carbon nitride alloys: (a) without hydrogen; and (b) with hydrogen. ta-C:N (H) is obtained when N is introduced in a N-free film with a high sp3 content, while a-C:N is obtained when N is introduced in graphitic N-free films. N has different effects depending on the sp3 and sp2 clustering of the N-free structure.
(b)
(a)
REVIEW Diamond-like carbon for data and beer storage
MT1001_2p44_53.indd 46MT1001_2p44_53.indd 46 08/12/2006 11:14:0108/12/2006 11:14:01
JAN-FEB 2007 | VOLUME 10 | NUMBER 1-2 47
4. ta-C:H:N. These films are prepared by a high-density plasma source,
such as ECWR48,49, ECR50,51, or helicon sources52. Introducing
N into ta-C:H induces clustering of the sp2 phase, without an
appreciable sp3 to sp2 conversion, up to ~20 at.% N, with a
corresponding increase in conductivity and decrease of optical gap.
Higher N contents cause a transition to a lower sp3 fraction and
give softer films similar to PLCHN34.
There are then many other carbon films studied in literature, which
evolve from the pattern presented so far. For example: (i) fluorinated
DLCs are used as low dielectric constant insulators for improving the
switching performances of circuits (see53, for example). (ii) Amorphous
carbon-silicon alloys (a-C1-x:Six) and hydrogenated carbon-silicon alloys
(a-C1-x:Six:Hy). These are studied both in the Si-rich and C-rich
composition range54. The Si-rich alloys have a wider bandgap than
a-Si:H and are widely used as p-type window layers in a-Si:H based
solar cells55. The C-rich alloys are of interest as luminescent materials
and as mechanical coating materials. The addition of Si to a-C:H has
the beneficial effect of reducing the grown-in compressive stress,
improving the thermal stability, and maintaining the low friction
coefficient of a-C:H to a higher relative humidity54,56,57. (iii) Metal-
incorporated films to reduce stress and wear, as well as lowering
friction (see58, for example). (iv) Nanostructured sp2 carbon films59.
These are attractive for electrochemical applications, supercapacitors,
sensors, and fuel cells. They can be produced by cathodic arc or
magnetron sputtering in the presence of a relatively high gas pressure
to favor the aggregation of sp2 clusters to be incorporated in the
films. Supersonic cluster beam deposition can also be used to grow
nanostructured thin films where the original carbon cluster structure
is substantially maintained after deposition. Peculiar to these films is
often the presence of carbon sp1 chains59.
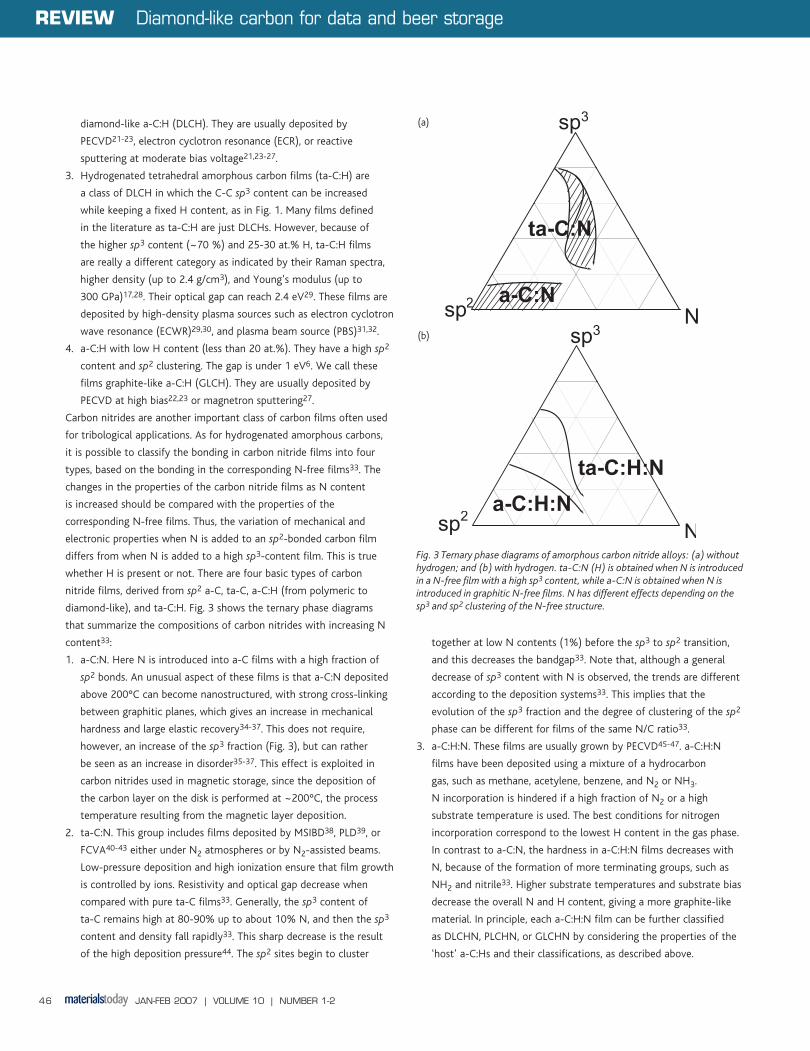
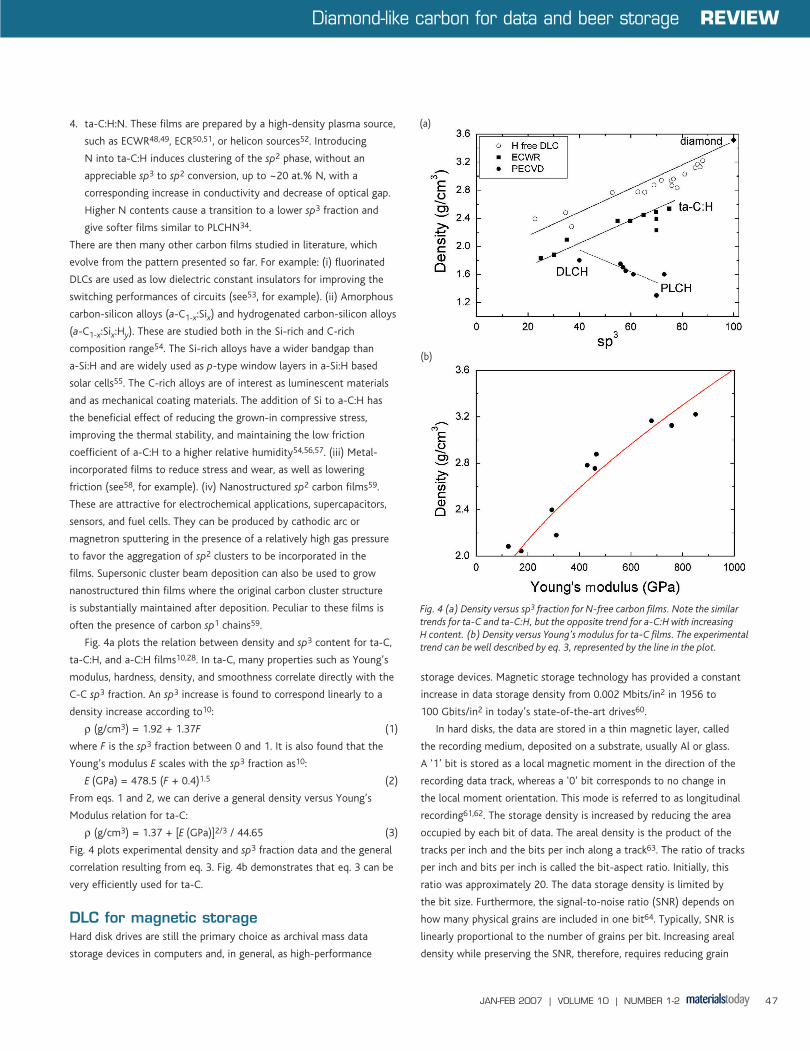
Fig. 4a plots the relation between density and sp3 content for ta-C,
ta-C:H, and a-C:H films10,28. In ta-C, many properties such as Young’s
modulus, hardness, density, and smoothness correlate directly with the
C-C sp3 fraction. An sp3 increase is found to correspond linearly to a
density increase according to10:
ρ (g/cm3) = 1.92 + 1.37F (1)
where F is the sp3 fraction between 0 and 1. It is also found that the
Young’s modulus E scales with the sp3 fraction as10:
E (GPa) = 478.5 (F + 0.4)1.5 (2)
From eqs. 1 and 2, we can derive a general density versus Young’s
Modulus relation for ta-C:
ρ (g/cm3) = 1.37 + [E (GPa)]2/3 / 44.65 (3)
Fig. 4 plots experimental density and sp3 fraction data and the general
correlation resulting from eq. 3. Fig. 4b demonstrates that eq. 3 can be
very efficiently used for ta-C.
DLC for magnetic storageHard disk drives are still the primary choice as archival mass data
storage devices in computers and, in general, as high-performance
storage devices. Magnetic storage technology has provided a constant
increase in data storage density from 0.002 Mbits/in2 in 1956 to
100 Gbits/in2 in today’s state-of-the-art drives60.
In hard disks, the data are stored in a thin magnetic layer, called
the recording medium, deposited on a substrate, usually Al or glass.
A ‘1’ bit is stored as a local magnetic moment in the direction of the
recording data track, whereas a ‘0’ bit corresponds to no change in
the local moment orientation. This mode is referred to as longitudinal
recording61,62. The storage density is increased by reducing the area
occupied by each bit of data. The areal density is the product of the
tracks per inch and the bits per inch along a track63. The ratio of tracks
per inch and bits per inch is called the bit-aspect ratio. Initially, this
ratio was approximately 20. The data storage density is limited by
the bit size. Furthermore, the signal-to-noise ratio (SNR) depends on
how many physical grains are included in one bit64. Typically, SNR is
linearly proportional to the number of grains per bit. Increasing areal
density while preserving the SNR, therefore, requires reducing grain
Fig. 4 (a) Density versus sp3 fraction for N-free carbon films. Note the similar trends for ta-C and ta-C:H, but the opposite trend for a-C:H with increasing H content. (b) Density versus Young’s modulus for ta-C films. The experimental trend can be well described by eq. 3, represented by the line in the plot.
(b)
(a)
Diamond-like carbon for data and beer storage REVIEW
MT1001_2p44_53.indd 47MT1001_2p44_53.indd 47 08/12/2006 11:14:0208/12/2006 11:14:02
JAN-FEB 2007 | VOLUME 10 | NUMBER 1-248
size. However, the thermal activation of nanoscale magnetic particles,
known as the superparamagnetic effect, precludes the continuous
reduction in grain size because the thermal energy kT can overcome
the coercive energy of the magnetic bit. This prevents further grain size
reduction, or the SNR has to be compromised. In 1995, the storage
density limit was approximately 40 Gbits/in2. This was increased to
200 Gbits/in2 by reducing the bit-aspect ratio to four and by using
materials of higher coercivity60-63,65. In principle, 1 Tbit/in2 is possible,
but using perpendicular recording, where the magnetization is normal
to the film surface, in contrast to the standard longitudinal recording,
where it is parallel to the surface60,61,64. Indeed, recent demonstrations
of perpendicular recording66,67 have reached 345-421 Gbit/in2, with
the potential for much higher values of 1 Tbit/in2.
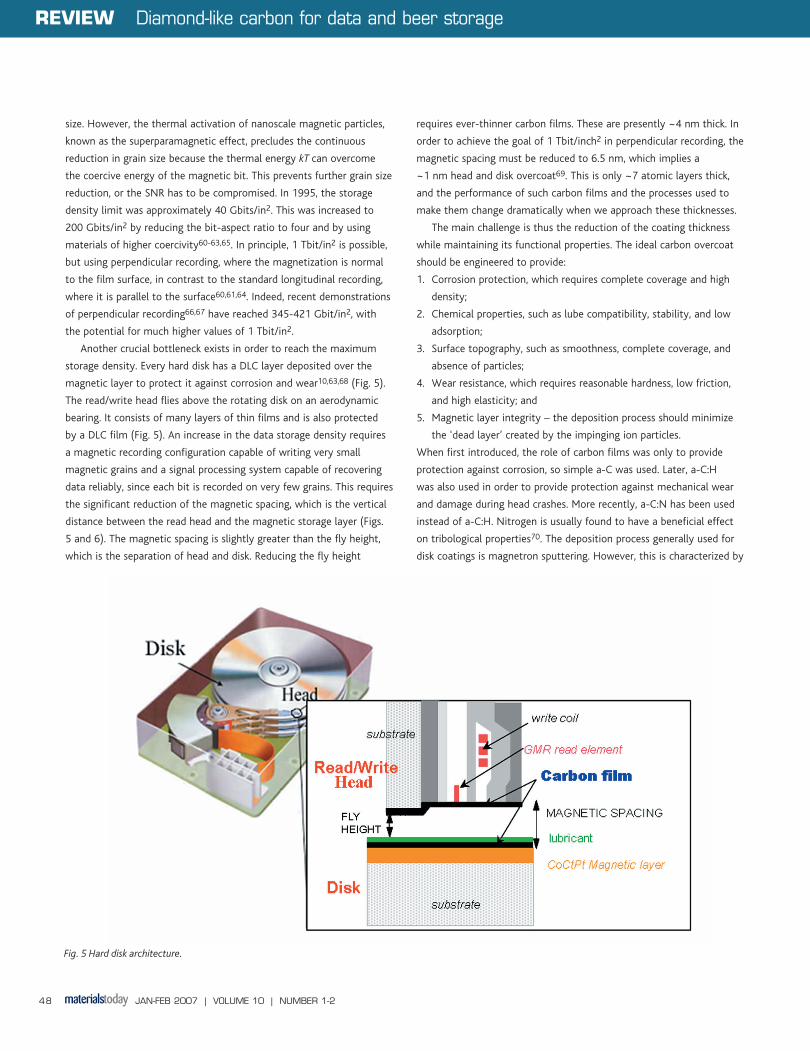
Another crucial bottleneck exists in order to reach the maximum
storage density. Every hard disk has a DLC layer deposited over the
magnetic layer to protect it against corrosion and wear10,63,68 (Fig. 5).
The read/write head flies above the rotating disk on an aerodynamic
bearing. It consists of many layers of thin films and is also protected
by a DLC film (Fig. 5). An increase in the data storage density requires
a magnetic recording configuration capable of writing very small
magnetic grains and a signal processing system capable of recovering
data reliably, since each bit is recorded on very few grains. This requires
the significant reduction of the magnetic spacing, which is the vertical
distance between the read head and the magnetic storage layer (Figs.
5 and 6). The magnetic spacing is slightly greater than the fly height,
which is the separation of head and disk. Reducing the fly height
requires ever-thinner carbon films. These are presently ~4 nm thick. In
order to achieve the goal of 1 Tbit/inch2 in perpendicular recording, the
magnetic spacing must be reduced to 6.5 nm, which implies a
~1 nm head and disk overcoat69. This is only ~7 atomic layers thick,
and the performance of such carbon films and the processes used to
make them change dramatically when we approach these thicknesses.
The main challenge is thus the reduction of the coating thickness
while maintaining its functional properties. The ideal carbon overcoat
should be engineered to provide:
1. Corrosion protection, which requires complete coverage and high
density;
2. Chemical properties, such as lube compatibility, stability, and low
adsorption;
3. Surface topography, such as smoothness, complete coverage, and
absence of particles;
4. Wear resistance, which requires reasonable hardness, low friction,
and high elasticity; and
5. Magnetic layer integrity – the deposition process should minimize
the ‘dead layer’ created by the impinging ion particles.
When first introduced, the role of carbon films was only to provide
protection against corrosion, so simple a-C was used. Later, a-C:H
was also used in order to provide protection against mechanical wear
and damage during head crashes. More recently, a-C:N has been used
instead of a-C:H. Nitrogen is usually found to have a beneficial effect
on tribological properties70. The deposition process generally used for
disk coatings is magnetron sputtering. However, this is characterized by
Fig. 5 Hard disk architecture.
REVIEW Diamond-like carbon for data and beer storage
MT1001_2p44_53.indd 48MT1001_2p44_53.indd 48 08/12/2006 11:14:0308/12/2006 11:14:03

JAN-FEB 2007 | VOLUME 10 | NUMBER 1-2 49
low energy and forms films of moderate density and hardness, failing
to provide corrosion resistance for the ultrathin films required by next-
generation hard disks71-74. The ideal material for this would be ta-C
because of its higher density and unique surface properties. The main
drawback to the use of ta-C is the filtering of the macroparticles during
deposition75. These consist of graphitic clusters produced during arcing
and, even in optimized conditions, can cover as much as 0.1% of the
surface75. If this problem is not satisfactorily solved, it may limit the
use of ta-C to head production, where an acceptable yield of particle-
free ta-C coated heads can already be achieved.
Analysis of ta-C roughness evolution has shown that ta-C has
ultralow roughness (rms roughness ~0.12 nm) that is independent of
the film thickness, thus providing films equally smooth whether 1 nm
or 100 nm thick (Fig. 7)76. These are unique properties since films
usually form in a series of stages from nucleation, to coalescence, and
possible roughening that, in general, lead to island formation for the
thinnest films. The surface properties are correlated with the growth
process, i.e. how the atoms arrive on the surface and how the layers
grow. This can be studied by using the fractal theory of self-affine
surfaces77. A self-affine surface is scale-invariant under anisotropic
transformations77. Films deposited under nonequilibrium conditions
are expected to have self-affine fractal surfaces since growth is
the result of the competition between fluctuation and smoothing
processes (excluding chemical reactions)77. In film deposition, the
fluctuations derive from the nonuniform nature of the incoming flux:
the atoms reach the surface at random positions, with random time
intervals between them. On the other hand, smoothing effects, such
as thermal diffusion, tend to eliminate the height fluctuations. These
two processes can only lead to a balancing effect on a relatively short-
range scale and a kinetic roughening of the films occurs77. This leads
the roughness R to scale with film thickness z as R ~ zβ. For a fixed
thickness77, R increases with the lateral length scale L as R~Lα. The
exponents α and β are called roughness and growth exponents and
uniquely define a growth process77. For ta-C, we found76,78 α = β = 0.
This corresponds to the Edwards-Wilkinson (EW) growth model79.
Here, the smoothing mechanism is diffusion driven by local surface
curvature78,79. Quantum and classical molecular simulations have
shown that an efficient damping of surface fluctuations is achieved
through impact-induced downhill currents, eroding hills on the
film surface, in agreement with the EW model78. This smoothing
mechanism is able to explain several experimentally observed
properties of ta-C growth78. For example, it accounts for the smoothing
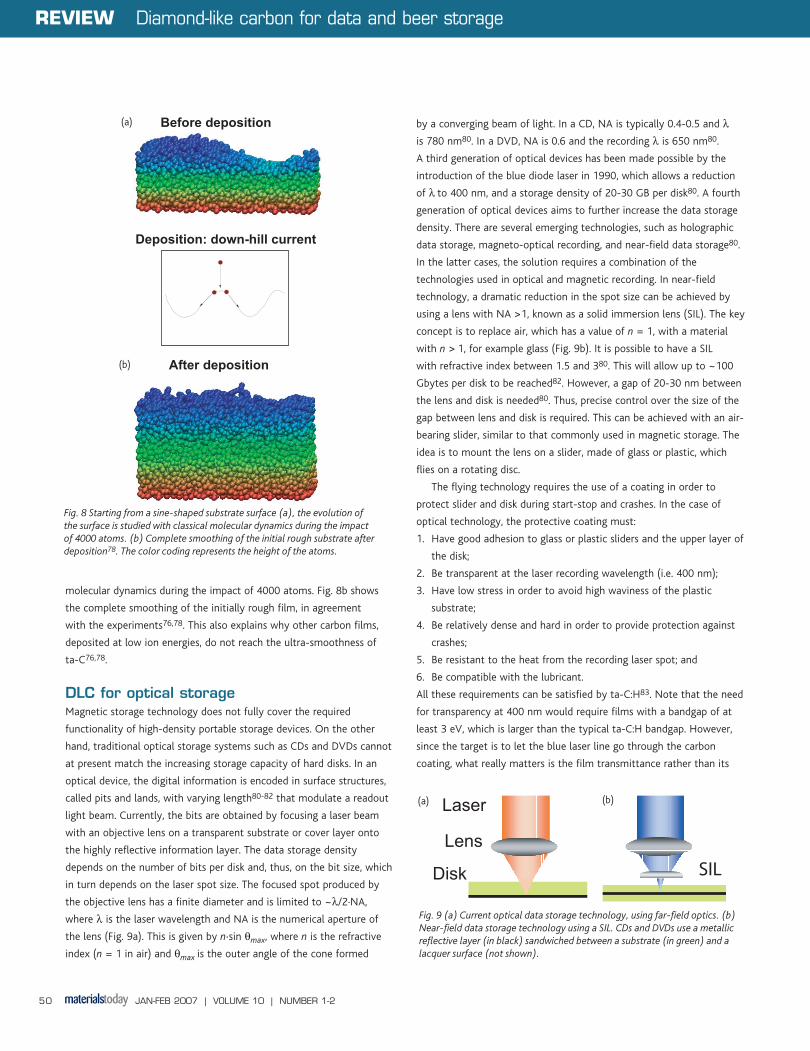
of initially rough substrates. Starting from a sine-shaped film surface
in Fig. 8a, the evolution of the surface was studied with classical
2 5 10 20 50 100 2001
23
5
10
2030
50
100
Storage density (Gbits/in2)
Spa
cing
(nm
)
Magnetic spacing
Fly height
Slider
Disk carbon
carbon
Fig. 6 Variation of carbon thickness on disk and sliders, magnetic spacing, and fly height with storage density (for longitudinal recording). For perpendicular recording, a given carbon thickness allows a much greater storage density, up to ~1 Tbit/in2.
Fig. 7 (a) Atomic force microscope image of a 0.9 nm thick ta-C film. The scan size is 500 nm x 500 nm and the vertical scale is 10 nm. (b) Roughness as a function of the thickness for ta-C deposited with two different cathodic arc systems (high current arc, or HCA ,and FCVA76). In the case of ta-C deposited by FCVA, an exponential smoothing of the initial rougher substrate is observed.
(b)
(a)
Diamond-like carbon for data and beer storage REVIEW
MT1001_2p44_53.indd 49MT1001_2p44_53.indd 49 08/12/2006 11:14:0408/12/2006 11:14:04
JAN-FEB 2007 | VOLUME 10 | NUMBER 1-250
molecular dynamics during the impact of 4000 atoms. Fig. 8b shows
the complete smoothing of the initially rough film, in agreement
with the experiments76,78. This also explains why other carbon films,
deposited at low ion energies, do not reach the ultra-smoothness of
ta-C76,78.
DLC for optical storage Magnetic storage technology does not fully cover the required
functionality of high-density portable storage devices. On the other
hand, traditional optical storage systems such as CDs and DVDs cannot
at present match the increasing storage capacity of hard disks. In an
optical device, the digital information is encoded in surface structures,
called pits and lands, with varying length80-82 that modulate a readout
light beam. Currently, the bits are obtained by focusing a laser beam
with an objective lens on a transparent substrate or cover layer onto
the highly reflective information layer. The data storage density
depends on the number of bits per disk and, thus, on the bit size, which
in turn depends on the laser spot size. The focused spot produced by
the objective lens has a finite diameter and is limited to ~λ/2·NA,
where λ is the laser wavelength and NA is the numerical aperture of
the lens (Fig. 9a). This is given by n·sin θmax, where n is the refractive
index (n = 1 in air) and θmax is the outer angle of the cone formed
by a converging beam of light. In a CD, NA is typically 0.4-0.5 and λ
is 780 nm80. In a DVD, NA is 0.6 and the recording λ is 650 nm80.
A third generation of optical devices has been made possible by the
introduction of the blue diode laser in 1990, which allows a reduction
of λ to 400 nm, and a storage density of 20-30 GB per disk80. A fourth
generation of optical devices aims to further increase the data storage
density. There are several emerging technologies, such as holographic
data storage, magneto-optical recording, and near-field data storage80.
In the latter cases, the solution requires a combination of the
technologies used in optical and magnetic recording. In near-field
technology, a dramatic reduction in the spot size can be achieved by
using a lens with NA >1, known as a solid immersion lens (SIL). The key
concept is to replace air, which has a value of n = 1, with a material
with n > 1, for example glass (Fig. 9b). It is possible to have a SIL
with refractive index between 1.5 and 380. This will allow up to ~100
Gbytes per disk to be reached82. However, a gap of 20-30 nm between
the lens and disk is needed80. Thus, precise control over the size of the
gap between lens and disk is required. This can be achieved with an air-
bearing slider, similar to that commonly used in magnetic storage. The
idea is to mount the lens on a slider, made of glass or plastic, which
flies on a rotating disc.
The flying technology requires the use of a coating in order to
protect slider and disk during start-stop and crashes. In the case of
optical technology, the protective coating must:
1. Have good adhesion to glass or plastic sliders and the upper layer of
the disk;
2. Be transparent at the laser recording wavelength (i.e. 400 nm);
3. Have low stress in order to avoid high waviness of the plastic
substrate;
4. Be relatively dense and hard in order to provide protection against
crashes;
5. Be resistant to the heat from the recording laser spot; and
6. Be compatible with the lubricant.
All these requirements can be satisfied by ta-C:H83. Note that the need
for transparency at 400 nm would require films with a bandgap of at
least 3 eV, which is larger than the typical ta-C:H bandgap. However,
since the target is to let the blue laser line go through the carbon
coating, what really matters is the film transmittance rather than its
After deposition
Deposition: down-hill current
Before deposition
Fig. 8 Starting from a sine-shaped substrate surface (a), the evolution of the surface is studied with classical molecular dynamics during the impact of 4000 atoms. (b) Complete smoothing of the initial rough substrate after deposition78. The color coding represents the height of the atoms.
Lens
Laser
Disk SIL
Fig. 9 (a) Current optical data storage technology, using far-field optics. (b) Near-field data storage technology using a SIL. CDs and DVDs use a metallic reflective layer (in black) sandwiched between a substrate (in green) and a lacquer surface (not shown).
(b)(a)
(b)
(a)
REVIEW Diamond-like carbon for data and beer storage
MT1001_2p44_53.indd 50MT1001_2p44_53.indd 50 08/12/2006 11:14:0508/12/2006 11:14:05

JAN-FEB 2007 | VOLUME 10 | NUMBER 1-2 51
optical gap. One way to increase the transmittance for a lower gap is
to decrease the film thickness10,83. Indeed, ta-C:H less than ~40 nm
thick is transparent, relatively dense, hard, and can be deposited quickly
and uniformly (70-80%) on the optical disk substrates83.
DLC for beer storagePoly(ethylene terephthalate) or PET is a very valuable plastic that can
be blown into containers and bottles. PET has more flexibility in size
and shape of packaging than metal cans. It is resealable, while metal
cans are not, and easier to transport and handle than glass. Glass is
breakable, heavy, and does not provide good portability. However, PET
has a finite gas permeability that can limit the shelf life of some food
and drink products. The addition of a gas-impermeable coating onto
the inside wall of a standard PET bottle has long been considered as
a way to improve the packaging for beer, fruit juice, and carbonated
soft drinks, where the permeation of carbon dioxide, oxygen, and water
needs to be suppressed (Fig. 10).
The International Society of Beverage Technologists defines the
shelf life as the storage time corresponding to 17.5% loss of CO2 for
soft drinks and 10% loss of CO2 for beer84. The CO2 loss during
storage is not the only important factor in order to preserve the good
taste of beer. Preventing beer from oxidation is also crucial85. The
maximum quantity of dissolved O2 acceptable for beer is 1000 ppm,
50% from the head-space during the filling and the oxygen in the
beer before the filling, and the other 50% permeating thorough the
package85.
The fruit juice and carbonated soft drinks markets are also
concerned about the transparency of the coatings because most
containers are transparent and the color of the coating may have some
impact on processing conditions and the performance of bottles when
using recycled PET material86. A suitable coating must thus:
1. Have a relatively large atomic density;
2. Be deposited at a high rate to make a viable industrial process, but
without exerting a large heat load, which would soften the PET
substrate;
3. Be recyclable and food contact safe; and
4. Be optically transparent.
DLC, in principle, satisfies all these requirements. In addition, the
optical bandgap can be varied over a wide range, so that it is possible
to form an optically semitransparent coating on colored PET bottles,
such as amber or green beer bottles, or a transparent coating for
Fig. 10 PET has a finite gas permeability that can limit the shelf life of some food and drink products. The addition of a gas impermeable coating on the inside wall of a standard PET bottle is necessary in order to minimize the permeation of CO2, O2, and H2O.
Fig. 11 Schematic of the system used to deposit DLC inside PET bottles87. The bottle is first introduced into the treatment station, then vacuum is created inside and outside the bottle, acetylene gas is introduced into the bottle, and a plasma is generated by microwaves. Thus, DLC is deposited on the inner wall of the bottle. Finally, bottle and cavity are returned to atmospheric pressure and the bottle is extracted from the cavity.
Diamond-like carbon for data and beer storage REVIEW
MT1001_2p44_53.indd 51MT1001_2p44_53.indd 51 08/12/2006 11:14:0608/12/2006 11:14:06
JAN-FEB 2007 | VOLUME 10 | NUMBER 1-252
REVIEW Diamond-like carbon films
transparent bottles, such as those used for carbonated soft drinks or
sparkling water. Ideally, ta-C would be the best material, but arc and
PLD systems are not suited to coat the interior of plastic bottles. A
plasma system, however, is ideal for this. Thus a-C:H is being used for
this purpose87-90.
One solution currently on the market is to deposit a-C:H in PET
bottles using a microwave plasma reactor87, as shown schematically in
Fig. 11. The bottle is placed neck-up inside the reactor. The pumping
system creates a vacuum pressure of 50 mbar outside the bottle. At
the same time, the inside of the bottle is pumped down to a pressure
of around 0.1 mbar. This prevents the bottle from collapsing. An open-
end tube is introduced inside the bottle to inject the acetylene process
gas87. A 2.45 GHz microwave discharge is ignited for 1-3 s at a power
of 200-500 W to deposit the films87. This allows a high deposition rate
of 60 nm/s87. This process has been industrially scaled to deposit
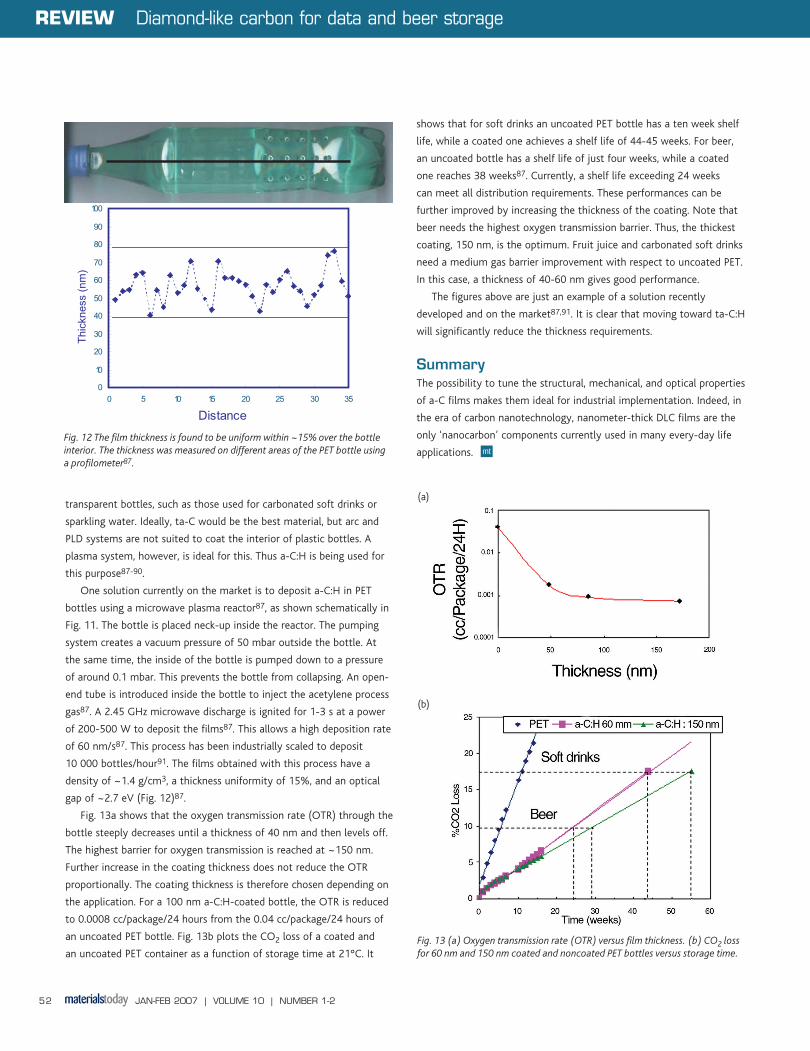
10 000 bottles/hour91. The films obtained with this process have a
density of ~1.4 g/cm3, a thickness uniformity of 15%, and an optical
gap of ~2.7 eV (Fig. 12)87.
Fig. 13a shows that the oxygen transmission rate (OTR) through the
bottle steeply decreases until a thickness of 40 nm and then levels off.
The highest barrier for oxygen transmission is reached at ~150 nm.
Further increase in the coating thickness does not reduce the OTR
proportionally. The coating thickness is therefore chosen depending on
the application. For a 100 nm a-C:H-coated bottle, the OTR is reduced
to 0.0008 cc/package/24 hours from the 0.04 cc/package/24 hours of
an uncoated PET bottle. Fig. 13b plots the CO2 loss of a coated and
an uncoated PET container as a function of storage time at 21°C. It
shows that for soft drinks an uncoated PET bottle has a ten week shelf
life, while a coated one achieves a shelf life of 44-45 weeks. For beer,
an uncoated bottle has a shelf life of just four weeks, while a coated
one reaches 38 weeks87. Currently, a shelf life exceeding 24 weeks
can meet all distribution requirements. These performances can be
further improved by increasing the thickness of the coating. Note that
beer needs the highest oxygen transmission barrier. Thus, the thickest
coating, 150 nm, is the optimum. Fruit juice and carbonated soft drinks
need a medium gas barrier improvement with respect to uncoated PET.
In this case, a thickness of 40-60 nm gives good performance.
The figures above are just an example of a solution recently
developed and on the market87,91. It is clear that moving toward ta-C:H
will significantly reduce the thickness requirements.
SummaryThe possibility to tune the structural, mechanical, and optical properties
of a-C films makes them ideal for industrial implementation. Indeed, in
the era of carbon nanotechnology, nanometer-thick DLC films are the
only ‘nanocarbon’ components currently used in many every-day life
applications.
Fig. 13 (a) Oxygen transmission rate (OTR) versus film thickness. (b) CO2 loss for 60 nm and 150 nm coated and noncoated PET bottles versus storage time.
(b)
(a)
0
10
20
30
40
50
60
70
80
90
100
0 5 10 15 20 25 30 35
Distance
Thic
knes
s (n
m)
Fig. 12 The film thickness is found to be uniform within ~15% over the bottle interior. The thickness was measured on different areas of the PET bottle using a profilometer87.
REVIEW Diamond-like carbon for data and beer storage
MT1001_2p44_53.indd 52MT1001_2p44_53.indd 52 08/12/2006 11:14:0808/12/2006 11:14:08
JAN-FEB 2007 | VOLUME 10 | NUMBER 1-2 53
AcknowledgmentsThe authors wish to thank the research team of the Mainz IBM STD plant: D. Schneider, R. Ohr, M. Von Gradowski, and H. Hilgers; M. Boutroy and the Sidel Group; C. Schug, D. Grambole, P. Gumbsch, and F. Piazza. We thank M. Moseler for the simulations in Fig. 8 and in the title page. Funding from
project ‘Innovative Reaktoren und In-Situ Analytik fur Nano-Schutzschichten’ of the German Bundesministerium für Bildung und Forshung and the EU project ‘Flyable media for slider based ultra high density optical recording’ (FAMOUS) are acknowledged. CC acknowledges support from the Oppenheimer Fund. ACF acknowledges funding from the Royal Society and the Leverhulme Trust.
REFERENCES
1. Angus, J. C., and Hayman, C. C., Science (1988) 241, 913
2. Kroto, H. W., et al., Nature (1985) 318, 167
3. Iijima, S., Nature (1991) 354, 56
4. Oberlin, A., et al., J. Cryst. Growth (1976) 32, 335
5. Novoselov, K. S., et al., Science (2004) 306, 666
6. Robertson, J., Mater. Sci. Eng. R (2002) 37, 129
7. Hauert, R., Tribol. Int. (2004) 37, 991
8. Sullivan, J. P., et al., MRS Bull. (2001) 26, 309
9. Luo, J. K., et al., Appl. Phys. Lett. (2004) 85, 5748
10. Ferrari, A. C., Surf. Coat. Technol. (2004) 180-181, 190
11. Lifshitz, Y., et al., Phys. Rev. Lett. (1994) 72, 2753
12. Voevodin, A., et al., Surf. Coat. Technol. (1997) 52, 42
13. Schwan, J., et al., J. Appl. Phys. (1996) 79, 1416
14. McKenzie, D. R., Rep. Prog. Phys. (1996) 59, 1611
15. Anders, S., et al., Appl. Phys. Lett. (1997) 71, 3367
16. Fallon, P. J., et al., Phys. Rev. B (1993) 48, 4777
17. Ferrari, A. C., et al., Appl. Phys. Lett. (1999) 75, 1893
18. Ferrari, A. C., and Robertson, J., Phys. Rev. B (2000) 61, 14095
19. Ferrari, A. C., and Robertson, J., Philos. Trans. R. Soc. London, Ser. A (2004) 362, 2477
20. Ferrari, A. C., and Robertson, J., Phys. Rev. B (2001) 64, 075414
21. Casiraghi, C., et al., Phys. Rev. B (2005) 72, 085401
22. Koidl, P., et al., Mater. Sci. Forum (1990) 52, 41
23. Tamor, M. A., et al., Appl. Phys. Lett. (1991) 58, 592
24. Yoon, S. F., et al., J. Appl. Phys. (2002) 91, 1634
25. Durand-Drouhin, O., et al., J. Appl. Phys. (2002) 91, 867
26. Schwarz-Sellinger, T., et al., J. Appl. Phys. (1999) 86, 3988
27. Popescu, B., et al., J. Non-Cryst. Solids (2000) 266-269, 803
28. Ferrari, A. C., et al., Phys. Rev. B (2000) 62, 11089
29. Morrison, N. A., et al., Thin Solid Films (1999) 337, 71
30. Weiler, M., et al., Appl. Phys. Lett. (1998) 1314, 72
31. Weiler, M., et al., Phys. Rev. B (1996) 53, 1594
32. Weiler, M., et al., Appl. Phys. Lett. (1994) 64, 2797
33. Ferrari, C., et al., Phys. Rev. B (2003) 67, 155306
34. Hellgren, N., et al., Phys. Rev. B (1999) 59, 5162
35. Jimenez, I., et al., Phys. Rev. B (2000) 62, 4261
36. Gammon, W. J., et al., Phys. Rev. B (2002) 66, 153402
37. Gammon, W. J., et al., Phys. Rev. B (2003) 68, 195401
38. Boyd, K. J., et al., J. Vac. Sci. Technol. A (1995) 13, 2110
39. Hu, J., et al., Phys. Rev. B (1998) 57, 3185
40. Davis, C. A., et al., Phil. Mag. B (1994) 69, 1133
41. Veerasamy, V. S., et al., Phys. Rev. B (1993) 48, 17954
42. Spaeth, C., et al., Diamond Relat. Mater. (1997) 6, 626
43. Kleinsorge, B., et al., J. Appl. Phys. (2000) 88, 1149
44. Rodil, S. E., et al., Appl. Phys. Lett. (2000) 77, 1458
45. Hammer, P., et al., J. Vac. Sci. Technol. A (1998) 16, 2941
46. Silva, S. R. P., et al., J. Appl. Phys. (1997) 81, 2626
47. Schwan, J., et al., J. Appl. Phys. (1998) 84, 2071
48. Rodil, S. E., et al., J. Appl. Phys. (2001) 89, 5425
49. Rodil, S. E., et al., phys. status solidi a (1999) 175, 25
50. Zhang, M., et al., Jpn. J. Appl. Phys. (1997) 36, 4897
51. Bhattacharyya, S., et al., J. Appl. Phys. (1998) 83, 4491; Bhattacharyya, S., et al., Diamond Relat. Mater. (2000) 9, 544
52. Zhang, J. Q., et al., Jpn. J. Appl. Phys. (1997) 36, 6894
53. Grill, A., Diamond Relat. Mater. (2001) 10, 234
54. Racine, B., et al., J. Appl. Phys. (2001) 90, 5002
55. Matsuda, A., and Tanaka, K., J. Non-Cryst. Solids (1987) 97, 1367
56. Oguri, K., and Arai, T., Thin Solid Films (1992) 208, 158
57. Gangopadhyay, A. K., et al., Tribol. Int. (1997) 30, 9
58. Voevodin, A. A., et al., Tribol. Int. (1996) 29, 559
59. Milani, P., et al., J. Appl. Phys. (1997) 82, 5793
60. Coufal, H., et al., MRS Bull. (2006) 31 (5), 374
61. Zhu, J.-G., Materials Today (2003) 6, 22
62. Menon, A. K., In Proceeding Symposium on Interface Tribology Towards 100 Gbits/in2, Bathia, C. S., et al., (eds.), The American Society of Mechanical Engineers, New York, (1999)
63. Goglia, P. A., et al., Diamond Relat. Mater. (2001) 10, 271
64. Wood, R., IEEE Trans. Magn. (2000) 36, 36; (2002) 38, 1171
65. Doerner, M. F., and White, R. L., MRS Bull. (1996) 9, 28
66. www.seagate.com
67. www.hitachigst.com
68. Robertson, J., Thin Solid Films (2001) 383, 81; Tribol. Int. (2003) 36, 405
69. Gui, J., IEEE Trans. Magn. (2003) 39, 716
70. Yun, X., et al., IEEE Trans. Magn. (1997) 33, 938
71. Zhang, B., et al., Data Storage (1999) 1, 25
72. Tomcik, B., et al., Diamond Relat. Mater. (2002) 11, 1409
73. Bernhard, P., et al., Surf. Coat. Technol. (2004) 180-181, 621
74. Ohr, R., et al., Surf. Coat. Technol. (2003) 174-175, 1135
75. Teo, K. B. K., et al., J. Appl. Phys. (2001) 89, 3707
76. Casiraghi, C., et al., Phys. Rev. Lett. (2003) 91, 226104
77. Barabasi, A. L., and Stanley, H. E., Fractal concepts in surface growth, Cambridge University Press, Cambridge, UK, (1995)
78. Moseler, M., et al., Science (2005) 309, 1545
79. Edwards, S., and Wilkinson, D., Proc. R. Soc. London, Ser. A (1966) 44, 1039
80. Coufal, H., and Dhar, L., MRS Bull. (2006) 31 (4), 294
81. van Houten, H., and Schleipen, J., Phys. World (1998) 10, 31
82. Hellmig, J., Phys. World (2004) 17, 21
83. Piazza, F., et al., Diamond Relat. Mater. (2005) 14, 994
84. International Society of Beverage Technologists, Voluntary Test Methods for PET bottles, Revision 1, (2003)
85. Huige, N. J., ACS Symp. Ser. (1993) 563, 64
86. National Association for PET Container Resources, Annual report on post consumer PET container recycling activity, (2004)
87. Boutroy, N., et al., Diamond Relat. Mater. (2006) 15, 921
88. Abbas, G. A., et al., Carbon (2005) 43, 303
89. Yoshida, M., et al., Surf. Coat. Technol. (2003) 174-175, 1033
90. Yamamoto, S., et al., Diamond Relat. Mater. (2005) 14, 1112
91. www.sidel.com
Diamond-like carbon for data and beer storage REVIEW
MT1001_2p44_53.indd 53MT1001_2p44_53.indd 53 08/12/2006 11:14:0908/12/2006 11:14:09