Diagnostics - Distributor Data · The documentation for the SIMATIC S7- 1500 automation system, for...
100
Transcript of Diagnostics - Distributor Data · The documentation for the SIMATIC S7- 1500 automation system, for...


___________________
___________________
___________________
___________________
___________________
___________________
___________________
SIMATIC
S7-1500, ET 200MP, ET 200SP, ET 200AL, ET 200pro Diagnostics
Function Manual
09/2016 A5E03735838-AD
Preface
Documentation guide 1
Overview of system diagnostics
2
Quick start 3
Setting and determining system diagnostics
4
System diagnostics by means of the user program
5
Alarms 6
Siemens AG Division Digital Factory Postfach 48 48 90026 NÜRNBERG GERMANY
A5E03735838-AD Ⓟ 09/2016 Subject to change
Copyright © Siemens AG 2013 - 2016. All rights reserved
Legal information Warning notice system
This manual contains notices you have to observe in order to ensure your personal safety, as well as to prevent damage to property. The notices referring to your personal safety are highlighted in the manual by a safety alert symbol, notices referring only to property damage have no safety alert symbol. These notices shown below are graded according to the degree of danger.
DANGER indicates that death or severe personal injury will result if proper precautions are not taken.
WARNING indicates that death or severe personal injury may result if proper precautions are not taken.
CAUTION indicates that minor personal injury can result if proper precautions are not taken.
NOTICE indicates that property damage can result if proper precautions are not taken.
If more than one degree of danger is present, the warning notice representing the highest degree of danger will be used. A notice warning of injury to persons with a safety alert symbol may also include a warning relating to property damage.
Qualified Personnel The product/system described in this documentation may be operated only by personnel qualified for the specific task in accordance with the relevant documentation, in particular its warning notices and safety instructions. Qualified personnel are those who, based on their training and experience, are capable of identifying risks and avoiding potential hazards when working with these products/systems.
Proper use of Siemens products Note the following:
WARNING Siemens products may only be used for the applications described in the catalog and in the relevant technical documentation. If products and components from other manufacturers are used, these must be recommended or approved by Siemens. Proper transport, storage, installation, assembly, commissioning, operation and maintenance are required to ensure that the products operate safely and without any problems. The permissible ambient conditions must be complied with. The information in the relevant documentation must be observed.
Trademarks All names identified by ® are registered trademarks of Siemens AG. The remaining trademarks in this publication may be trademarks whose use by third parties for their own purposes could violate the rights of the owner.
Disclaimer of Liability We have reviewed the contents of this publication to ensure consistency with the hardware and software described. Since variance cannot be precluded entirely, we cannot guarantee full consistency. However, the information in this publication is reviewed regularly and any necessary corrections are included in subsequent editions.

Diagnostics 4 Function Manual, 09/2016, A5E03735838-AD
Preface
Purpose of the documentation This function manual provides an overview of the diagnostics options for the automation system SIMATIC S7-1500, for CPU 1516pro-2 PN based on SIMATIC S7-1500, and for the distributed I/O systems SIMATIC ET 200MP, ET 200SP and ET 200AL.
The documentation covers the following:
● Illustration of the uniformity and consistency of system diagnostics
● Overview of the options for establishing system diagnostics information
Basic knowledge required The following knowledge is required in order to understand the function manual:
● General knowledge in the field of automation technology
● Knowledge of the industrial automation system SIMATIC
● Knowledge of working with STEP 7 and WinCC
● Knowledge about the use of Microsoft Windows operating systems
Scope of the documentation This documentation is the basic documentation for all products of the S7-1500, ET 200MP, ET 200SP and ET 200AL systems, as well as for CPU 1516pro-2 PN. The product documentation is based on this documentation.

Preface
Diagnostics Function Manual, 09/2016, A5E03735838-AD 5
What's new compared to the previous version of the function manual (06/2014 edition) What's new? What are the customer benefits? Where can I find the infor-
mation? New contents Extended functionality of the
Web server • You obtain information about:
– Know-how protection or copy pro-tection of the PLC program
– Program/communication load and cycle time
– F-collective signatures, cycle times and runtimes of the F-runtime group(s) (with an F-CPU)
• You can monitor statuses, errors, technology alarms and the current val-ues of technology objects (TOs) with the Web server.
• You can read, view and save trace recordings via the Web server and thus obtain plant and project infor-mation for diagnostics and mainte-nance without STEP 7.
• You can set four additional languages for the Web interface.
Section Diagnostics infor-mation using the web server (Page 49), Web server (http://support.automation.siemens.com/WW/view/en/59193560) function manual, Using the trace and logic ana-lyzer function (https://support.industry.siemens.com/cs/ww/en/view/64897128) function manual
Assignment of different project languages extended
You can assign up to three different pro-ject languages for comments and alarm texts to the user interface languages of display devices.
Section Editing alarms in the alarm editor (Page 78)
Changed contents
Scope of the function man-ual expanded to include CPU 1516pro-2 PN
Functions that you will be familiar with from the SIMATIC S7-1500 CPUs are implemented in the CPU 1516pro-2 PN (degree of protection IP65, IP66 and IP67).
Operating instructions CPU 1516pro-2 PN (https://support.industry.siemens.com/cs/ww/en/view/109482416)
Security events added You know which types of events are regis-tered as security events in the diagnostics buffer and can configure group alarms for them.
Section CPU diagnostics buffer (Page 43)
Influence of the value status explained
You know which factors influence the bit in the value status and can take this into account during configuration.
Section System diagnostics using process image inputs (Page 72)
Note added on the maximum configuration limits of program alarms. Section Creating alarms with the "Program_Alarm" instruc-tion (Page 76).

Preface
Diagnostics 6 Function Manual, 09/2016, A5E03735838-AD
Conventions STEP 7: We refer to "STEP 7" in this documentation as a synonym for the configuration and programming software "STEP 7 as of V12 (TIA Portal)" and subsequent versions.
This document contains illustrations of the described devices. The illustrations may differ slightly from the device supplied.
You should also pay particular attention to notes such as the one shown below:
Note
A note contains important information on the product, on the handling of the product or on the section of the documentation to which particular attention should be paid.
See also SIMATIC Portal (http://www.siemens.com/simatic-tech-doku-portal)
Catalog (http://mall.automation.siemens.com)
Security information Siemens provides products and solutions with industrial security functions that support the secure operation of plants, systems, machines and networks.
In order to protect plants, systems, machines and networks against cyber threats, it is necessary to implement – and continuously maintain – a holistic, state-of-the-art industrial security concept. Siemens’ products and solutions only form one element of such a concept.
Customer is responsible to prevent unauthorized access to its plants, systems, machines and networks. Systems, machines and components should only be connected to the enterprise network or the internet if and to the extent necessary and with appropriate security measures (e.g. use of firewalls and network segmentation) in place.
Additionally, Siemens’ guidance on appropriate security measures should be taken into account. For more information about industrial security, please visit (http://www.siemens.com/industrialsecurity).
Siemens’ products and solutions undergo continuous development to make them more secure. Siemens strongly recommends to apply product updates as soon as available and to always use the latest product versions. Use of product versions that are no longer supported, and failure to apply latest updates may increase customer’s exposure to cyber threats.
To stay informed about product updates, subscribe to the Siemens Industrial Security RSS Feed under (http://www.siemens.com/industrialsecurity).

Preface
Diagnostics Function Manual, 09/2016, A5E03735838-AD 7
Siemens Industry Online Support You can find current information on the following topics quickly and easily here:
● Product support
All the information and extensive know-how on your product, technical specifications, FAQs, certificates, downloads, and manuals.
● Application examples
Tools and examples to solve your automation tasks – as well as function blocks, performance information and videos.
● Services
Information about Industry Services, Field Services, Technical Support, spare parts and training offers.
● Forums
For answers and solutions concerning automation technology.
● mySupport
Your personal working area in Industry Online Support for messages, support queries, and configurable documents.
This information is provided by the Siemens Industry Online Support in the Internet (http://www.siemens.com/automation/service&support).
Industry Mall The Industry Mall is the catalog and order system of Siemens AG for automation and drive solutions on the basis of Totally Integrated Automation (TIA) and Totally Integrated Power (TIP).
Catalogs for all the products in automation and drives are available on the Internet (https://mall.industry.siemens.com).

Diagnostics 8 Function Manual, 09/2016, A5E03735838-AD
Table of contents
Preface ................................................................................................................................................... 4
1 Documentation guide ............................................................................................................................ 10
2 Overview of system diagnostics ............................................................................................................ 14
2.1 Properties of system diagnostics ........................................................................................... 14
2.2 Benefits of innovative system diagnostics ............................................................................. 16
3 Quick start ............................................................................................................................................ 17
3.1 Using the display of the CPU ................................................................................................. 17
3.2 Using STEP 7 ......................................................................................................................... 19
4 Setting and determining system diagnostics .......................................................................................... 24
4.1 Configuring alarms for system diagnostics ............................................................................ 24
4.2 Options for displaying system diagnostics ............................................................................. 26 4.2.1 Diagnostics information at the devices .................................................................................. 27 4.2.1.1 LEDs ...................................................................................................................................... 27 4.2.1.2 Display of the CPU ................................................................................................................. 28 4.2.2 Diagnostics information in STEP 7 ........................................................................................ 30 4.2.2.1 Explanation of diagnostics symbols ....................................................................................... 30 4.2.2.2 Accessible devices (without project) ...................................................................................... 32 4.2.2.3 Devices & networks ............................................................................................................... 34 4.2.2.4 Online & diagnostics .............................................................................................................. 37 4.2.2.5 "Diagnostics" tab in the Inspector window ............................................................................. 40 4.2.2.6 CPU diagnostics buffer .......................................................................................................... 43 4.2.2.7 "Online tools" task card .......................................................................................................... 46 4.2.2.8 Configuring the settings for I/O modules in STEP 7 .............................................................. 48 4.2.3 Diagnostics information using the web server ....................................................................... 49 4.2.4 Diagnostics information using the HMI diagnostics view ....................................................... 59 4.2.4.1 Configuring system diagnostics ............................................................................................. 59 4.2.4.2 Different views of the HMI diagnostics view .......................................................................... 62 4.2.4.3 Inserting system diagnostics indicator ................................................................................... 65 4.2.4.4 Configuring button as system diagnostics indicator............................................................... 67
5 System diagnostics by means of the user program ................................................................................ 70
5.1 Options of system diagnostics in the user program ............................................................... 70
5.2 System diagnostics using process image inputs ................................................................... 72
6 Alarms .................................................................................................................................................. 75
6.1 Creating alarms with the "Program_Alarm" instruction .......................................................... 76
6.2 Editing alarms in the alarm editor .......................................................................................... 78
6.3 Display of program alarms ..................................................................................................... 81
6.4 Output of the alarm state with the "Get_AlarmState" instruction ........................................... 82

Table of contents
Diagnostics Function Manual, 09/2016, A5E03735838-AD 9
6.5 Example program for program alarms .................................................................................... 83 6.5.1 Task ........................................................................................................................................ 83 6.5.2 Example 1: Program alarm without associated values ........................................................... 83 6.5.3 Example 2: Program alarm with associated value .................................................................. 88 6.5.4 Displaying the alarm ............................................................................................................... 95
Glossary ............................................................................................................................................... 96
Index..................................................................................................................................................... 99

Diagnostics 10 Function Manual, 09/2016, A5E03735838-AD
Documentation guide 1
The documentation for the SIMATIC S7-1500 automation system, for CPU 1516pro-2 PN based on SIMATIC S7-1500, and for the distributed I/O systems SIMATIC ET 200MP, ET 200SP and ET 200AL is divided into three areas. This division allows you easier access to the specific information you require.
Basic information
System manuals and Getting Started manuals describe in detail the configuration, installation, wiring and commissioning of the SIMATIC S7-1500, ET 200MP, ET 200SP and ET 200AL systems; use the corresponding operating instructions for CPU 1516pro-2 PN. The STEP 7 online help supports you in configuration and programming.
Device information
Product manuals contain a compact description of the module-specific information, such as properties, terminal diagrams, characteristics and technical specifications.

Documentation guide
Diagnostics Function Manual, 09/2016, A5E03735838-AD 11
General information
The function manuals contain detailed descriptions on general topics such as diagnostics, communication, Motion Control, Web server, OPC UA.
You can download the documentation free of charge from the Internet (http://w3.siemens.com/mcms/industrial-automation-systems-simatic/en/manual-overview/Pages/Default.aspx).
Changes and additions to the manuals are documented in product information sheets.
You will find the product information on the Internet:
● S7-1500/ET 200MP (https://support.industry.siemens.com/cs/us/en/view/68052815)
● ET 200SP (https://support.industry.siemens.com/cs/us/en/view/73021864)
● ET 200AL (https://support.industry.siemens.com/cs/us/en/view/99494757)
Manual Collections The Manual Collections contain the complete documentation of the systems put together in one file.
You will find the Manual Collections on the Internet:
● S7-1500/ET 200MP (https://support.industry.siemens.com/cs/ww/en/view/86140384)
● ET 200SP (https://support.industry.siemens.com/cs/ww/en/view/84133942)
● ET 200AL (https://support.industry.siemens.com/cs/ww/en/view/95242965)
"mySupport" With "mySupport", your personal workspace, you make the best out of your Industry Online Support.
In "mySupport", you can save filters, favorites and tags, request CAx data and compile your personal library in the Documentation area. In addition, your data is already filled out in support requests and you can get an overview of your current requests at any time.
You must register once to use the full functionality of "mySupport".
You can find "mySupport" on the Internet (https://support.industry.siemens.com/My/ww/en).
"mySupport" - Documentation In the Documentation area in "mySupport" you can combine entire manuals or only parts of these to your own manual. You can export the manual as PDF file or in a format that can be edited later.
You can find "mySupport" - Documentation on the Internet (http://support.industry.siemens.com/My/ww/en/documentation).

Documentation guide
Diagnostics 12 Function Manual, 09/2016, A5E03735838-AD
"mySupport" - CAx data In the CAx data area in "mySupport", you can access the current product data for your CAx or CAe system.
You configure your own download package with a few clicks.
In doing so you can select:
● Product images, 2D dimension drawings, 3D models, internal circuit diagrams, EPLAN macro files
● Manuals, characteristics, operating manuals, certificates
● Product master data
You can find "mySupport" - CAx data on the Internet (http://support.industry.siemens.com/my/ww/en/CAxOnline).
Application examples The application examples support you with various tools and examples for solving your automation tasks. Solutions are shown in interplay with multiple components in the system - separated from the focus on individual products.
You will find the application examples on the Internet (https://support.industry.siemens.com/sc/ww/en/sc/2054).
TIA Selection Tool With the TIA Selection Tool, you can select, configure and order devices for Totally Integrated Automation (TIA). This tool is the successor of the SIMATIC Selection Tool and combines the known configurators for automation technology into one tool. With the TIA Selection Tool, you can generate a complete order list from your product selection or product configuration.
You can find the TIA Selection Tool on the Internet (http://w3.siemens.com/mcms/topics/en/simatic/tia-selection-tool).

Documentation guide
Diagnostics Function Manual, 09/2016, A5E03735838-AD 13
SIMATIC Automation Tool You can use the SIMATIC Automation Tool to run commissioning and maintenance activities simultaneously on different SIMATIC S7 stations as a bulk operation, independently of the TIA Portal.
The SIMATIC automation tool provides a variety of functions:
● Scanning of a PROFINET/Ethernet plant network and identification of all connected CPUs
● Address assignment (IP, subnet, gateway) and station name (PROFINET device) to a CPU
● Transfer of the date and programming device/PC time converted to UTC time to the module
● Program download to CPU
● Operating mode switchover RUN/STOP
● CPU localization by means of LED flashing
● Reading out CPU error information
● Reading of CPU diagnostic buffer
● Reset to factory settings
● Updating the firmware of the CPU and connected modules
You can find the SIMATIC Automation Tool on the Internet (https://support.industry.siemens.com/cs/ww/en/view/98161300).
PRONETA With SIEMENS PRONETA (PROFINET network analysis), you analyze the plant network during commissioning. PRONETA features two core functions:
● The topology overview independently scans PROFINET and all connected components.
● The IO check is a fast test of the wiring and the module configuration of a plant.
You can find SIEMENS PRONETA on the Internet (https://support.industry.siemens.com/cs/ww/en/view/67460624).

Diagnostics 14 Function Manual, 09/2016, A5E03735838-AD
Overview of system diagnostics 2 2.1 Properties of system diagnostics
Introduction In the SIMATIC environment, the term "system diagnostics" refers to diagnostics of devices and modules.
All SIMATIC products have integrated diagnostic functions that you can use to detect and remedy faults. The components automatically flag a potential fault in the operation and provide detailed information. You can minimize unscheduled standstill times with plant-wide diagnostics.
The SIMATIC automation system monitors the following states in the running plant:
● Device failure/recovery
● Insert/remove event
● Module fault
● I/O access error
● Channel fault
● Parameter assignment error
● Failure of the external auxiliary voltage
Properties ofSIMATIC system diagnostics ● Integrated as standard in the hardware
● System-wide across bus limits
● Automatic localization of the error source
● Automatic output of the cause of the error in plain text
● Plant-wide diagnostics of all components
● Archiving and logging of alarms
● Configurability of alarms

Overview of system diagnostics 2.1 Properties of system diagnostics
Diagnostics Function Manual, 09/2016, A5E03735838-AD 15
Consistent diagnostics from the field level all the way to the management level The various diagnostics media give you a uniform view of maintenance-related information of every automation component in the plant: System status (module and network status, alarms for system errors) are available plant-wide in a uniform display.
Figure 2-1 Overview of system diagnostics in a plant

Overview of system diagnostics 2.2 Benefits of innovative system diagnostics
Diagnostics 16 Function Manual, 09/2016, A5E03735838-AD
2.2 Benefits of innovative system diagnostics
System diagnostics is also possible in STOP The system diagnostics is integrated in the firmware of the CPU and works independently of the cyclic user program. This means it is also available in the STOP CPU operating mode. Faults are detected immediately and signaled to the higher-level HMI devices, the Web server and the display of the SIMATIC S7-1500 CPU, even in STOP mode. This makes system diagnostics consistent with the actual plant state at all times.
Uniform display concept All clients of a system are provided with diagnostics information by a uniform mechanism. The same system diagnostics information is used regardless of the display medium.
Step Description ① The device detects an error and sends diagnostics data to the assigned CPU. ② The CPU informs the connected display media. The display of the system diagnostics is
updated.
Figure 2-2 Sequence of the system diagnostics
Diagnostics Function Manual, 09/2016, A5E03735838-AD 17
Quick start 3
Introduction The following chapters of this documentation describe the different options for establishing system diagnostics. All described options can be used independently of one another.
This chapter gives you an overview of the basic procedure to get initial diagnostics information fast.
Note
System diagnostics is generally available for the devices of the SIMATIC series.
3.1 Using the display of the CPU The display of the SIMATIC S7-1500 CPU offers a fast and direct option to get diagnostics information. You can call up status information in different menus on the display.
Requirements ● A project has been created.
● The project has been downloaded to the CPU.
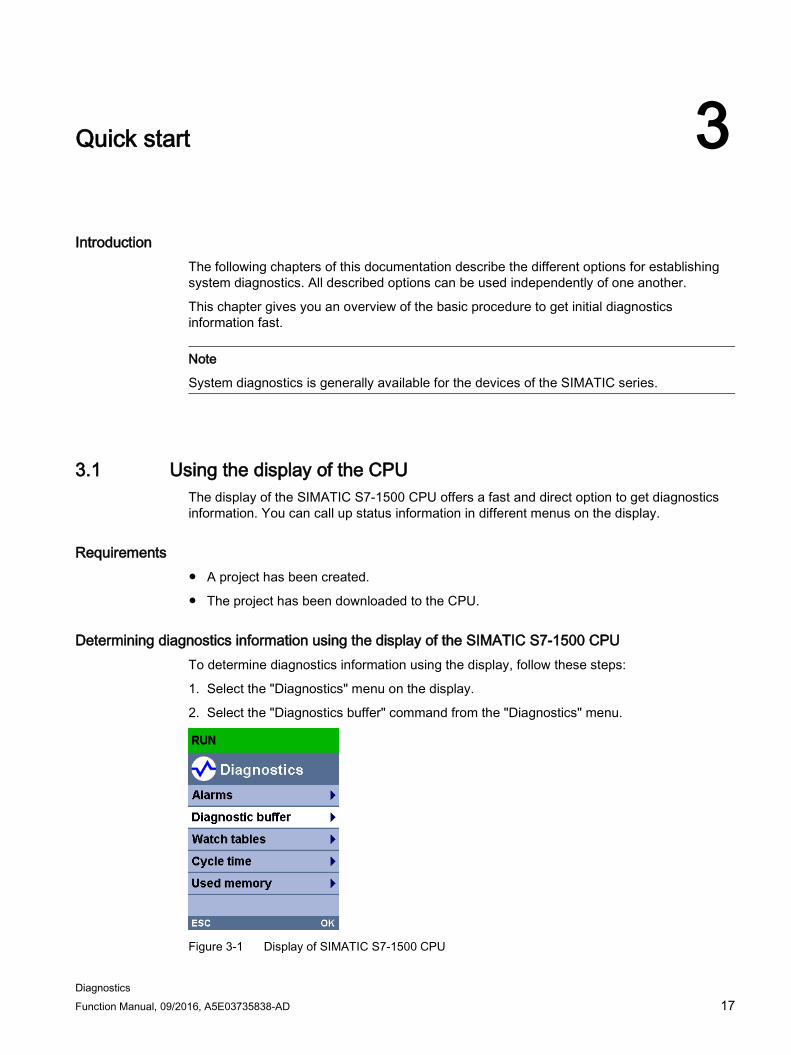
Determining diagnostics information using the display of the SIMATIC S7-1500 CPU To determine diagnostics information using the display, follow these steps:
1. Select the "Diagnostics" menu on the display.
2. Select the "Diagnostics buffer" command from the "Diagnostics" menu.
Figure 3-1 Display of SIMATIC S7-1500 CPU

Quick start 3.1 Using the display of the CPU
Diagnostics 18 Function Manual, 09/2016, A5E03735838-AD
Result The diagnostics events are displayed in the diagnostics buffer in the sequence in which they occur.
Figure 3-2 Display of the diagnostics buffer in the display of the SIMATIC S7-1500 CPU
Note Automatic updating of diagnostics information
You set automatic updating of the diagnostics information under: "Display" > "DiagnosticRefresh".
Additional information You can find information about the configuration of alarms in the section Configuring alarms for system diagnostics (Page 24).

Quick start 3.2 Using STEP 7
Diagnostics Function Manual, 09/2016, A5E03735838-AD 19
3.2 Using STEP 7 Getting started with STEP 7 gives you fast access to detailed diagnostics information.
Requirements ● A project has been created.
● The project has been downloaded to the CPU.
● An error has occurred.
● The programming device must be able to establish a connection to the CPU via an interface.
Determining diagnostics information using STEP 7 To determine diagnostics information using STEP 7, follow these steps:
1. Open the respective project in STEP 7.
2. Open the portal view of STEP 7.
3. Select the "Online & Diagnostics" portal.
4. Select the "Online status" action.
The "Select device" dialog opens. The dialog is an image of the configured devices in the project.
Figure 3-3 Device selection for online connection in the portal view
5. Activate the "Go online" option button for the device that you want to use to establish an online connection.
6. Click on the "Go online" button.

Quick start 3.2 Using STEP 7
Diagnostics 20 Function Manual, 09/2016, A5E03735838-AD
7. The "Go online" dialog opens.
Figure 3-4 Establishing an online connection
8. Make the settings for the interface.

Quick start 3.2 Using STEP 7
Diagnostics Function Manual, 09/2016, A5E03735838-AD 21
9. Click on the "Go online" button.
The project view of STEP 7 opens. The network view is opened in the work area.
The symbols in the project tree provide initial information about the faulty modules.
Figure 3-5 Display of the fault in the network view

Quick start 3.2 Using STEP 7
Diagnostics 22 Function Manual, 09/2016, A5E03735838-AD
10.Double-click the device which displays an alarm message to access the faulty module directly. This is the CPU in the example.
The device view of the CPU is opened in the work area. In this view you can see directly in which module the error has occurred.
Figure 3-6 Display of the faulty module in the device view
11.Open the "Diagnostics" tab and the subordinate "Device information" tab in the Inspector window for a more detailed error description.

Quick start 3.2 Using STEP 7
Diagnostics Function Manual, 09/2016, A5E03735838-AD 23
Result The link in the "Details" table column takes you to the online and diagnostics view of the device and to the diagnostics buffer there, for example. This includes more information on all diagnostics events in the order in which they occurred.
Figure 3-7 Diagnostics buffer with detailed error description
Note Symbols and their meaning
You can find a legend with the meaning of each symbol in Explanation of diagnostics symbols (Page 30) and in the online help for STEP 7.

Diagnostics 24 Function Manual, 09/2016, A5E03735838-AD
Setting and determining system diagnostics 4
Introduction System diagnostics is generally available for the devices of the SIMATIC series.
In the properties of each individual CPU, you can specify if you want to receive alarms for system diagnostics on your display device. Alarms are provided on the display of the SIMATIC S7-1500 CPU, the CPU Web server and the HMI device. Alarms are enabled by default. If you do not want to receive alarms for system diagnostics on your display devices, you can disable the sending of alarms.
4.1 Configuring alarms for system diagnostics Predefined alarm texts are available for establishing the system diagnostics.
Requirements ● STEP 7 is open.
● A project is open.

Setting and determining system diagnostics 4.1 Configuring alarms for system diagnostics
Diagnostics Function Manual, 09/2016, A5E03735838-AD 25
Procedure To make alarm settings for system diagnostics of the project in STEP 7, follow these steps:
1. Open the "Common data" folder in the project tree.
2. Double-click the "System diagnostics settings" entry.
You now have access to the alarm settings. System diagnostics is enabled by default. System diagnostics cannot be disabled for the use of a CPU from the SIMATIC S7-1500 product series.
Figure 4-1 Properties of system diagnostics and alarm settings
3. In the settings, specify the alarm category that is to be displayed and if it needs to be acknowledged.
The check boxes in the "Activation" column are enabled by default. When you disable all check boxes, the status of the HMI system diagnostics view is still updated with the "Info Report" functionality.
Result You have configured the alarms for system diagnostics of the project in STEP 7.
The settings are saved with the project and become effective after the compiling and downloading of the hardware configuration to the involved components.
Maintenance events (maintenance demanded, maintenance required) are entered in the alarm buffer of the CPU just like any other event.

Setting and determining system diagnostics 4.2 Options for displaying system diagnostics
Diagnostics 26 Function Manual, 09/2016, A5E03735838-AD
4.2 Options for displaying system diagnostics
Example This section includes a diagnostics example to show how system diagnostics is established with the help of different display options. The example includes a CPU from the SIMATIC S7-1500 product series that is connected to an ET 200S distributed I/O system and an HMI Comfort Panel via PROFINET.
Figure 4-2 System diagnostics display options
The following sections include figures that illustrate how diagnostics information is displayed with the help of different display options.
● Using the LEDs on the hardware (Page 27)
● Local error analysis via the display of the CPU (Page 28)
● Using STEP 7 as of V12 (Page 30)
● Remote diagnostics using the Web server (Page 49)
● Stationary system diagnostics using the HMI diagnostics view (Page 59)

Setting and determining system diagnostics 4.2 Options for displaying system diagnostics
Diagnostics Function Manual, 09/2016, A5E03735838-AD 27
4.2.1 Diagnostics information at the devices
4.2.1.1 LEDs
Overview All hardware components, such as CPUs, interface modules and modules, provide information about their operating mode as well as internal and external errors through their LEDs. Diagnostics by means of LEDs is an initial tool for error localization.
The graphics below include examples for the arrangement of LEDs on some modules.
Table 4- 1 LED displays on the modules
CPU 1516-3 PN/DP IM 155-5 PN ST DI 32x24VDC HF PS 25W 24VDC
① RUN/STOP LED (two-colored LED: green/yellow)
RUN LED (two-colored LED: green/yellow)
RUN LED (single-colored LED: green)
RUN LED (single-colored LED: green)
② ERROR LED (single-colored LED: red)
ERROR LED (single-colored LED: red)
ERROR LED (single-colored LED: red)
ERROR LED (single-colored LED: red)
③ MAINT LED (single-colored LED: yellow)
MAINT LED (single-colored LED: yellow)
without function MAINT LED (single-colored LED: yellow)
④ X1 P1 (two-colored LED: green/yellow)
X1 P1 (single-colored LED: green)
LED CHx (two-colored LED: green/red)
⑤ X1 P2 (two-colored LED: green/yellow)
X1 P2 (single-colored LED: green)
⑥ X2 P1 (two-colored LED: green/yellow)

Setting and determining system diagnostics 4.2 Options for displaying system diagnostics
Diagnostics 28 Function Manual, 09/2016, A5E03735838-AD
Additional information The meaning of the individual LED displays, their different combinations and the remedial measures resulting from them in case of errors are device-specific. The explanation can be found in the manuals of the modules.
4.2.1.2 Display of the CPU
Introduction Each CPU in the S7-1500 automation system has a front cover with a display and operating keys. You can display status information in various menus on the display of the CPU. You use the operating keys to navigate through the menus.
Figure 4-3 Display - diagnostics screen

Setting and determining system diagnostics 4.2 Options for displaying system diagnostics
Diagnostics Function Manual, 09/2016, A5E03735838-AD 29
Display options The display of the SIMATIC S7-1500 CPU shows the following diagnostics information:
● CPU operating mode
"Diagnostics" menu
● Active diagnostic alarms
● Information entered in the diagnostics buffer
● Error and alarm texts (system diagnostics alarms)
● Watch tables
● Information on the cycle times of the user program
● Utilization of the CPU memory
"Modules" menu
● Information on modules and the network
● Detailed device view with diagnostics symbols
● Order number, CPU version and central I/O modules
● Module status for central and distributed modules
● Information about the currently installed firmware
Additional information For additional information on the topic "Functions and operation of the display of the SIMATIC S7-1500 CPU", see the documentation for the S7-1500 automation system (http://support.automation.siemens.com/WW/view/en/59191792).
You can find detailed information on the individual options, a training course and a simulation of the available menu commands of the display for the CPU in the SIMATIC S7-1500 Display Simulator (http://www.automation.siemens.com/salesmaterial-as/interactive-manuals/getting-started_simatic-s7-1500/disp_tool/start_en.html).

Setting and determining system diagnostics 4.2 Options for displaying system diagnostics
Diagnostics 30 Function Manual, 09/2016, A5E03735838-AD
4.2.2 Diagnostics information in STEP 7
4.2.2.1 Explanation of diagnostics symbols
Diagnostics symbols for modules and devices When the online connection to a device is established in STEP 7, the diagnostics status of the device and its lower-level components and, if applicable, the device operating mode are also determined. The following table shows the possible symbols and their meaning.
Table 4- 2 Diagnostics symbols for modules and devices
Symbol Meaning
The connection with a CPU is being established.
The CPU is not reachable at the set address.
The configured CPU and the CPU actually present are of incompatible types. Example: An existing CPU 315-2 DP is incompatible with a configured CPU 1516-3 PN/DP.
On establishment of the online connection to a protected CPU, the password dialog was terminated without specification of the correct password.
No fault
Maintenance required
Maintenance demanded
Error
The module or device is deactivated.
The module or the device cannot be reached from the CPU (valid for modules and de-vices below a CPU).
Diagnostics data is not available because the current online configuration data differ from the offline configuration data.
The configured module or device and the module or device actually present are incom-patible (valid for modules or devices under a CPU).
The configured module does not support display of the diagnostics status (valid for mod-ules under a CPU).
The connection is established, but the module status has not yet been determined or is unknown.
Hardware error in lower-level component: A hardware fault has occurred in at least one lower-level hardware component (occurs as a separate symbol only in the project tree).

Setting and determining system diagnostics 4.2 Options for displaying system diagnostics
Diagnostics Function Manual, 09/2016, A5E03735838-AD 31
Symbols for the comparison status The diagnostics symbols can be combined at the bottom right with additional smaller symbols that indicate the result of the online/offline comparison. The following table shows the possible comparison symbols and their meaning.
Table 4- 3 Symbols for the comparison status
Symbol Meaning
Hardware error in lower-level component: The online and offline versions differ (only in the project tree) in at least one lower-level hardware component.
Software error in lower-level component: The online and offline versions differ (only in the project tree) in at least one lower-level software component.
Online and offline versions of the object are different
Object only exists online
Object only exists offline
Online and offline versions of the object are the same
Operating mode symbols for CPUs and CPs The following table shows the possible symbols and their respective operating states.
Table 4- 4 Operating mode symbols for CPUs and CPs
Symbol Operating mode
RUN
STOP
STARTUP
DEFECTIVE
Unknown operating mode
The configured module does not support display of the operating mode.

Setting and determining system diagnostics 4.2 Options for displaying system diagnostics
Diagnostics 32 Function Manual, 09/2016, A5E03735838-AD
Event table The following information is displayed in the table for each diagnostics event:
● Sequential number of the entry
The first entry contains the latest event.
● Date and time of the diagnostics event
If no date and time are shown, the module has no integrated clock.
● Short designation of the event and, if applicable, the reaction of the CPU
● Symbol for information on incoming/outgoing status
The following table shows the possible symbols and their meaning.
Table 4- 5 Symbols in the event table
Symbol Meaning
Incoming event
Outgoing event
Incoming event for which there is no independent outgoing event
User-defined diagnostics event
Additional information For additional information on the individual symbols, please refer to the online help for STEP 7.
4.2.2.2 Accessible devices (without project)
Accessible devices Accessible devices are all devices that are connected to a PG/PC either directly by an interface or by means of a subnet and that are switched on. These devices can display diagnostic information even without an offline project.
Requirements ● STEP 7 is open.
● The portal view or project view is open.

Setting and determining system diagnostics 4.2 Options for displaying system diagnostics
Diagnostics Function Manual, 09/2016, A5E03735838-AD 33
Procedure To display diagnostic information for specific devices even without an offline project, follow these steps:
1. Establish a connection to the respective CPU.
2. Select the command "Accessible devices" from the "Online" menu.
The "Accessible devices" dialog opens.
Figure 4-4 "Accessible devices" dialog
3. Make the settings for the interface.
4. Select the respective device under "Accessible nodes of the selected interface".
5. Confirm the dialog with the "Display" button.

Setting and determining system diagnostics 4.2 Options for displaying system diagnostics
Diagnostics 34 Function Manual, 09/2016, A5E03735838-AD
Result The device is displayed in the project tree. You open the diagnostic information in the work area with a double-click on "Online & Diagnostics".
Information is available on the diagnostic status, cycle times, memory usage and the diagnostics buffer.
Figure 4-5 Device in the project tree
4.2.2.3 Devices & networks
Devices & networks - Go online You can get an overview of the current state of your automation system in the device view or network view.
You implement the following tasks in the device view:
● Device configuration and parameter assignment
● Module configuration and parameter assignment
You implement the following tasks in the network view:
● Device configuration and parameter assignment
● Networking devices
Requirements ● STEP 7 is open.
● A project is open.
● The project view is open.

Setting and determining system diagnostics 4.2 Options for displaying system diagnostics
Diagnostics Function Manual, 09/2016, A5E03735838-AD 35
Procedure To get an overview of the current state of your automation system, follow these steps:
1. Open the "Network view" in the working area.
2. Select the CPU.
3. Click the "Go online" button in the toolbar.
The "Go online" dialog opens.
Figure 4-6 Go online
4. Make the settings for the interface.
5. Select the respective device under "Compatible devices in the target subnet".
6. Confirm the dialog with the "Connect" button.
The online mode is started.

Setting and determining system diagnostics 4.2 Options for displaying system diagnostics
Diagnostics 36 Function Manual, 09/2016, A5E03735838-AD
Result The connected devices are now displayed with diagnostic information in the network view in the working area. Here you get an overview of the current state of your automation device.
Figure 4-7 CPU with diagnostic information
You get to the "Device view" with a double-click on the device. The diagnostic information for the individual modules is displayed in this view.
Note Symbols and their meaning
You will find a legend with the meaning of each symbol in Explanation of diagnostics symbols (Page 30) and in the online help for STEP 7.

Setting and determining system diagnostics 4.2 Options for displaying system diagnostics
Diagnostics Function Manual, 09/2016, A5E03735838-AD 37
4.2.2.4 Online & diagnostics
Online mode In online mode there is an online connection between your PG/PC and one or several devices. Depending on the properties of a device, you are offered specific diagnostics options and certain functions in online mode.
● Diagnostics
– General module information
– Diagnostics status
– Cycle time
– Memory
– Diagnostics buffer
– Display
– Interface information (e.g. IP parameter, port information)
● Functions
– Assign IP address
– Set time and date of the CPU
– Firmware update (e.g. for PLC, display)
– Assign device name
– Reset to factory settings
– Format memory card
– Save service data

Setting and determining system diagnostics 4.2 Options for displaying system diagnostics
Diagnostics 38 Function Manual, 09/2016, A5E03735838-AD
To establish an online connection at least one PG/PC interface must be installed that is physically connected with a device, for example, with an Ethernet cable. The current online status of a device is indicated by a symbol to the right of the device in the project tree.
Figure 4-8 Partial view of network view
Requirements ● STEP 7 is open.
● A project is open.
● The project view is open.

Setting and determining system diagnostics 4.2 Options for displaying system diagnostics
Diagnostics Function Manual, 09/2016, A5E03735838-AD 39
Procedure To display an overview of the faulty devices, follow these steps:
1. Select the affected device folder in the project tree.
2. Select the shortcut menu command "Online & Diagnostics".
The online and diagnostics view of the module to be diagnosed is started.
Figure 4-9 Setting online access
3. Make the settings for the interface.
Here you can change an interface access that has already been set for an online connection that was successfully established previously.
4. Click on the "Go online" button.
The online connection is established.
Result You can find detailed diagnostics information on each device in the Inspector window, in the "Diagnostics" section of the area navigation on the "Properties" tab.

Setting and determining system diagnostics 4.2 Options for displaying system diagnostics
Diagnostics 40 Function Manual, 09/2016, A5E03735838-AD
4.2.2.5 "Diagnostics" tab in the Inspector window
"Diagnostics" tab in the Inspector window The "Diagnostics" tab of the Inspector window includes information on diagnostics events and configured alarm events.
Figure 4-10 Diagnostics in the Inspector window, "Device information" tab
Note Symbols and their meaning
You can find a legend with the meaning of each symbol in Explanation of diagnostics symbols (Page 30) and in the online help for STEP 7.
Subordinate "Device information" tab This tab gives you an overview of faulty devices to which an online connection exists or has existed. The table provides the following diagnostics information on the faulty devices:
● Online status: Includes the online status as diagnostics symbol and in words
● Operating mode: Includes the operating mode as symbol and in words
● Device/module: Name of the affected device or the affected module
● Connection established via ...: Specifies the path used to establish the connection to the failed device.
● Alarm: This explains the entry in the previous columns and displays an alarm, if necessary
● Details: The link opens the online and diagnostics view associated with the device or puts it in the foreground. If the device cannot be reached, the link opens the "Go online" dialog.
● Help: The link provides additional information on the fault.
Note
Communication and access errors
Errors that occur in the user program (e.g., communication errors, access errors) are not reported in the "Diagnostics" tab of the device information. You must read out the diagnostics buffer of the CPU in the online and diagnostics view to get this information. The link in the "Details" column opens the diagnostics buffer.

Setting and determining system diagnostics 4.2 Options for displaying system diagnostics
Diagnostics Function Manual, 09/2016, A5E03735838-AD 41
Subordinate "Connection information" tab The "Connection information" tab displays detailed diagnostics information for connections.
There will only be information on the "Connection information" tab if there is an active online connection to at least one end point of the relevant connection.
If a connection has been selected (connection table), the tab contains the following groups:
● Connection details
● Address details of the connection
Figure 4-11 "Connection information" tab and open connection overview
If a module has been selected (network view), the tab contains the following group:
● Connection resources

Setting and determining system diagnostics 4.2 Options for displaying system diagnostics
Diagnostics 42 Function Manual, 09/2016, A5E03735838-AD
Subordinate "Alarm display" tab System diagnostics alarms are output in the "Alarm display" tab.
Figure 4-12 "Alarm display" tab
To receive alarms in STEP 7, follow these steps:
1. Open the project view.
2. Select the required CPU in the project tree.
3. To connect online with the respective CPU, select the shortcut menu command "Go online".
4. Select the required CPU once again in the project tree and select the shortcut menu command "Receive alarms".
Figure 4-13 Receive alarms
5. Alarms are now displayed in the alarm display. "Archive view" is enabled by default.
6. To display the latest alarms, click the "Active alarms" icon .

Setting and determining system diagnostics 4.2 Options for displaying system diagnostics
Diagnostics Function Manual, 09/2016, A5E03735838-AD 43
4.2.2.6 CPU diagnostics buffer
Definition Each CPU and some other modules have their own diagnostics buffer, in which detailed information on all diagnostic events is entered in the order in which they occurred.
The CPU diagnostics buffer can be displayed on all display media (STEP 7, SIMATIC HMI devices, SIMATIC S7-1500 Web server and display of the CPU).
Diagnostic events The entries available in the diagnostics buffer include:
● Internal and external errors on a module
● System errors in the CPU
● Operating mode transitions (e.g., from RUN to STOP)
● Errors in the user program
● Removal/insertion of modules
● Security events
The contents of the diagnostics buffer are stored in the retentive memory in case of a memory reset of the CPU. Errors or events can be evaluated even after a longer period of time thanks to the diagnostics buffer to determine the cause of a STOP or to trace the occurrence of a single diagnostic event and to be able to assign it.

Setting and determining system diagnostics 4.2 Options for displaying system diagnostics
Diagnostics 44 Function Manual, 09/2016, A5E03735838-AD
Procedure To display the diagnostics buffer of a CPU in STEP 7, follow these steps:
1. Select the respective CPU.
2. Select the shortcut menu command "Online & Diagnostics".
The "Online access" view is opened in the work area.
Figure 4-14 Setting up online access
3. Set the interface.

Setting and determining system diagnostics 4.2 Options for displaying system diagnostics
Diagnostics Function Manual, 09/2016, A5E03735838-AD 45
4. Click .
5. Select the area "Diagnostics buffer".
Figure 4-15 Diagnostics buffer in STEP 7
Note
Filtering events
You can filter the entries in the diagnostics buffer in the settings of the "Diagnostics buffer" area to only display specific types of events. This means that specific events, such as "CPU and configuration-internal events" or "Connection diagnostics events", can be displayed separately.
Security events The following security events (event types) result in an entry in the diagnostics buffer.
● Going online with the correct or incorrect password
● Manipulated communications data detected
● Manipulated data detected on memory card
● Manipulated firmware update file detected
● Changed protection level (access protection) downloaded to the CPU
● Password legitimization restricted or enabled (by instruction or CPU display)
● Online access denied due to the possible number of simultaneous access attempts being exceeded
● Timeout when an existing online connection is inactive
● Logging on to the Web server with the correct or incorrect password
● Creating a backup of the CPU
● Restoring the CPU configuration (Restore)

Setting and determining system diagnostics 4.2 Options for displaying system diagnostics
Diagnostics 46 Function Manual, 09/2016, A5E03735838-AD
To prevent the diagnostics buffer being "swamped" by large numbers of identical security events, you can set parameters so that these events are entered in the diagnostics buffer as a group alarm. For every interval (monitoring time), the CPU then only generates one group alarm per event type.
Configuring a group alarm for security events
To configure group alarms for security events, follow these steps:
1. Click on the CPU icon in the network view.
The properties of the CPU are displayed in the Inspector window.
2. Navigate to the "Protection" > "Security event" area.
3. Click "Security event".
4. Select the option "Summarize security events in case of high message volume" to enable group alarms for security events.
5. Set the duration of an interval (monitoring period); the default is 20 seconds.
4.2.2.7 "Online tools" task card
Online view in the "Online tools" task card The following requirements must be met to display the online view of the "Online tools" task card in STEP 7:
● An online connection to the CPU is available.
● You have selected the CPU in the topology view, network view or device view.

Setting and determining system diagnostics 4.2 Options for displaying system diagnostics
Diagnostics Function Manual, 09/2016, A5E03735838-AD 47
The "Online tools" task card provides an overview of the CPU state, the cycle time and the memory usage. ● The "CPU operator panel" pane displays the current state of some LEDs and the mode
selector of a CPU. ● The "Cycle time" pane displays the cycle time diagram and below it the measured cycle
times as absolute values. ● The "Memory" pane contains the current memory usage of the associated CPU. The free
memory is shown both as a bar graph and as a numerical value (percentage). The display for "Load memory" contains, in addition to the online project data (program code, data blocks, hardware configuration etc.), all other data that may be on the SIMATIC memory card, such as recipes, data logs, HMI backups or non-SIMATIC files that have been copied to the memory card via the Web server of the CPU or offline in Explorer (for example, PDF files).
Figure 4-16 "Online tools" task card

Setting and determining system diagnostics 4.2 Options for displaying system diagnostics
Diagnostics 48 Function Manual, 09/2016, A5E03735838-AD
4.2.2.8 Configuring the settings for I/O modules in STEP 7 You can also make settings for system diagnostics in STEP 7 for I/O modules. The parameters you have to configure depend on the I/O module.
The settings are optional.
Requirements ● STEP 7 is open.
● A project is open.
● The project view is open.
● A design with I/O modules has been configured.
Procedure To make settings for system diagnostics of I/O modules in STEP 7, follow these steps:
1. Select the respective I/O module in the device view.
2. Open the "Properties" tab in the Inspector window.
3. Select the area "Inputs", for example.
You have access to the settings for system diagnostics of the I/O module. If you select "Wire break", for example, a possible wire break for the channel is signaled during operation.
Figure 4-17 I/O setting with a digital input module
4. Save the hardware configuration.
5. Download the new hardware configuration to the CPU.

Setting and determining system diagnostics 4.2 Options for displaying system diagnostics
Diagnostics Function Manual, 09/2016, A5E03735838-AD 49
Additional information The documentation for the respective module includes additional information on parameter assignment of I/O modules.
4.2.3 Diagnostics information using the web server
System diagnostics using the CPU Web server The CPUs of the SIMATIC series have an integrated Web server and let you display the system diagnostics information by means of PROFINET. Any terminal devices, such as PCs or smartphones, can thus access module data, user program data and diagnostics data of a CPU by using an Internet browser. This means access to CPUs is possible without installed STEP 7.
In addition to normal websites, the Web server provides so-called basic websites with reduced content that are adapted to the requirements of small screens with low resolution.
Using CPU 1516-3 PN/DP as an example, the following figure shows the start page of the Web server:
Figure 4-18 Web server, Start page

Setting and determining system diagnostics 4.2 Options for displaying system diagnostics
Diagnostics 50 Function Manual, 09/2016, A5E03735838-AD
The following diagnostics options are available with the integrated Web server:
● Start page with general CPU information
● Information on diagnostics
● Contents of the diagnostics buffer
● Module information
● Alarms
● Information about communication
● PROFINET topology
● Motion Control diagnostics
● Trace
Configuring the Web server in STEP 7 Proceed as follows to activate the Web server:
Requirements
● You have opened STEP 7.
● You have added a CPU to the project.
● You have opened the project view.
Procedure
1. Open the network view.
2. Select the CPU.
3. Open the "Properties" tab in the Inspector window.
4. Select the entry "Web server" in the "General" area navigation.
Figure 4-19 Activate the Web server

Setting and determining system diagnostics 4.2 Options for displaying system diagnostics
Diagnostics Function Manual, 09/2016, A5E03735838-AD 51
5. Select the "Activate web server on this module" check box.
6. If possible, always enable the option "Permit access only with HTTPS". Note the following: The activation of the Web server using the secure transmission protocol "HTTPS" requires a valid Web server certificate in the CPU.
NOTICE
Utilizing the full functionality of the Web server
A valid CA-signed Web server certificate in the CPU is a requirement for: • User management with password-protected users • The use of safety-related functions (online backup and restore of the CPU
configuration, saving and downloading diagnostic information in csv files)
To use the full functionality of the Web server, we recommend that you create a CA-signed server certificate and assign it to the CPU.
To create a CA-signed Web server certificate, you must enable the Certificate Manager in the global security settings of STEP 7 and assign a CA-signed server certificate to the Web server in the properties of the CPU.
You can find additional information on handling Web server certificates in the "Configuring the Web server" section of the Web server function manual (http://support.automation.siemens.com/WW/view/en/59193560).
Detailed information on Certification Authority (CA) certificates, device certificates (End Entity certificate), "Public Key Infrastructure" (PKI) and certificate management can be found in the Communication function manual (https://support.industry.siemens.com/cs/ww/en/view/59192925) and in the online help for STEP 7, keyword "Secure communication".
7. Automatic updating is activated in the default setting of a configured CPU.
8. Activate the Web server also for each interface via which you want to access the Web server. To do this, open the "Properties" tab in the Inspector window and select the "Web server" entry in the "General" area navigation. In the "Overview of interfaces" area, select the "Enabled web server access" check box for the corresponding interface.
9. Compile and load the configuration into the CPU.

Setting and determining system diagnostics 4.2 Options for displaying system diagnostics
Diagnostics 52 Function Manual, 09/2016, A5E03735838-AD
Accessing the Web server To access the Web server, proceed as follows:
1. Connect the display device (PG/PC, HMI, mobile terminal device) with the CPU or a communication module using a PROFINET interface. If you are working with WLAN, activate the WLAN on the display device and establish a connection to the access point (e.g. SCALANCE W788-1RR or SCALANCE W784-1), which is in turn connected to the CPU.
2. Open the web browser on the display device.
3. Enter the IP address of the interface of the CPU which is connected to the client in the "Address" field of the web browser in the following format: http://a.b.c.d or https://a.b.c.d (example input: http://192.168.3.141). The intro page of the CPU opens.
4. You need to perform the installation of the CA certificate again for each display device you want to use. A valid CA certificate is available for download from the "Intro" web page under "Download certificate". You can find instructions for installing the certificate in the help system of your Web browser and in the FAQ with the entry ID 103528224 at the Service&Support (https://support.industry.siemens.com/cs/ww/en/view/103528224) website.
5. Click the NEXT link to go to the Web server pages.
Note
Managing access rights
In STEP 7, you can create users, define access rights and assign passwords under "Web server > User management". Users only have access to the options that are permanently linked to the access rights.
You can find additional information on managing access rights in the "Configuring the Web server" section of the Web server function manual (http://support.automation.siemens.com/WW/view/en/59193560).

Setting and determining system diagnostics 4.2 Options for displaying system diagnostics
Diagnostics Function Manual, 09/2016, A5E03735838-AD 53
"Diagnostics" option The "Diagnostics" web page provides more information about the tabs:
● Identification
This tab contains the characteristics of the CPU (serial number, article number, hardware and firmware version, etc.).
● Program protection
This tab provides information on whether the PLC program contains know-how protection or copy protection.
● Memory
This tab contains current values on the memory currently in use.
● Runtime information
Current information on program/communication load and cycle time can be found in this tab.
● F-runtime groups (only with an F CPU)
The safety program of an F-CPU consists of one or two F-runtime groups. You can find their cycle time (F-monitoring time) and runtime in this tab.
Figure 4-20 Web server, "Diagnostics" Web page

Setting and determining system diagnostics 4.2 Options for displaying system diagnostics
Diagnostics 54 Function Manual, 09/2016, A5E03735838-AD
Diagnostics option "Diagnostics buffer" The browser displays the content of the diagnostics buffer on the "Diagnostics buffer" Web page.
Figure 4-21 Web server, "Diagnostics buffer" Web page

Setting and determining system diagnostics 4.2 Options for displaying system diagnostics
Diagnostics Function Manual, 09/2016, A5E03735838-AD 55
Diagnostics option "Module information" The status of a device is indicated by the Web browser with symbols and comments on the "Module information" Web page.
Modules are displayed on the "Module information" Web page in the "Name" column with a link. You can thus get to the faulty module in hierarchical order.
Figure 4-22 Web server, "Module information" Web page
Diagnostics option "Messages" The Web browser displays the content of the message buffer on the "Messages" Web page. The messages can be acknowledged via the Web server if you have the appropriate user rights.
Figure 4-23 Web server, "Messages" Web page

Setting and determining system diagnostics 4.2 Options for displaying system diagnostics
Diagnostics 56 Function Manual, 09/2016, A5E03735838-AD
"Topology" diagnostics option The "Topology" Web page provides information on the topological configuration and status of the PROFINET devices in your PROFINET IO system.
Figure 4-24 Web server, "Topology" Web page

Setting and determining system diagnostics 4.2 Options for displaying system diagnostics
Diagnostics Function Manual, 09/2016, A5E03735838-AD 57
"Motion Control Diagnostics" diagnostic option The Web server displays statuses, errors, technology alarms and the current values of the configured technology objects (TOs).
The "Motion Control Diagnostics" web page provides detailed information on the configured technology objects in the following views:
● Diagnostics
This view provides an overview list of configured technology objects, the status and error messages of a selected technology object, as well as values and limits of the movement status for a selected axis.
● Service overview
This view contains diagnostic information for multiple technology objects and a filter option for selecting the displayed technology objects.
Figure 4-25 Web server, "Motion Control diagnostics" webpage

Setting and determining system diagnostics 4.2 Options for displaying system diagnostics
Diagnostics 58 Function Manual, 09/2016, A5E03735838-AD
"Trace" diagnostic options You can read, view and save the trace recordings via the Web server and thus obtain plant and project information for diagnostics and maintenance.
The web page of the trace and logic analyzer function consists of several areas. The example in the figure below shows how the Web server user interface is divided when the "Trace" web page is first called.
Figure 4-26 Web server, "Trace" home page (without measurement)
Additional information Additional information on the topic is available in the Web server function manual (http://support.automation.siemens.com/WW/view/en/59193560).
You can find additional information on the trace function in the Using the trace and logic analyzer function (https://support.industry.siemens.com/cs/ww/en/view/64897128) function manual.

Setting and determining system diagnostics 4.2 Options for displaying system diagnostics
Diagnostics Function Manual, 09/2016, A5E03735838-AD 59
4.2.4 Diagnostics information using the HMI diagnostics view
Objects for system diagnostics The full functionality of the HIM diagnostics view is only available with Comfort Panels and WinCC RT Advanced . Basic Panels do not support the complete range of system diagnostics functions.
Two objects are available for system diagnostics on an HMI device.
System diagnostics view The system diagnostics view reflects the current status of all accessible devices in your plant. You navigate directly to the cause of the error and the associated device. You have access to all diagnostics-capable devices that you have configured in the STEP 7 hardware and network editor.
System diagnostics window The system diagnostics window is an operating element and display object.
The functions of the system diagnostics window are the same as for the system diagnostics view. Because the system diagnostics window is configured in the "Global screen", you can also specify, for example, if the object can be closed in WinCC Runtime.
Note Compatibility with Basic Panels
Only the "System diagnostics view" object is available with Basic Panels.
Basic Panels do not support the "System diagnostics window" object or the graphic symbol "System diagnostics indicator".
4.2.4.1 Configuring system diagnostics
Introduction You add a system diagnostics view or a system diagnostics window to your project to get an overview of all devices available in your plant.
The system diagnostics window behaves like the system diagnostics view but is only available in the global screen.
Requirements ● At least one CPU has been set up in the project.
● An HMI device (e.g., Comfort Panel) has been set up in the project.
● CPU and the HMI device are connected with each other by an HMI connection.
● You have created a screen (for the system diagnostics view).
● The global screen is open (for the system diagnostics window).
● The Inspector window is open.

Setting and determining system diagnostics 4.2 Options for displaying system diagnostics
Diagnostics 60 Function Manual, 09/2016, A5E03735838-AD
Procedure Proceed as follows to configure the system diagnostics:
1. Double-click the "System diagnostics view" object in the "Tools" task card. The object is added to the screen.
Figure 4-27 Adding a system diagnostics view
2. Select the "Properties" tab in the Inspector window.
3. Select the area "Columns".
4. Enable the columns that you require in the device view for WinCC Runtime, for example:
– Status
– Name
– Operating mode
– Slot
– Address
5. Enable the columns that you require in the detail view for WinCC Runtime, for example:
– Status
– Name
– Operating mode
– Plant designation
– Address
6. You can change the column headers in the "Columns" area, if necessary.
7. Select the "Display" area.
8. Enable "Column settings > Columns moveable" to move the columns in WinCC Runtime.
9. To close the system diagnostics window in WinCC Runtime, select "Properties > Window > Closable" in the "Properties" tab of the Inspector window.

Setting and determining system diagnostics 4.2 Options for displaying system diagnostics
Diagnostics Function Manual, 09/2016, A5E03735838-AD 61
Result The system diagnostics view has been added to the screen. The diagnostics status of the entire plant is displayed in the system diagnostics view in WinCC Runtime.
Figure 4-28 System diagnostics view in the screen
The system diagnostics window has been added to the global screen. If there is an error message in the plant, the system diagnostics window responds and displays the affected device.

Setting and determining system diagnostics 4.2 Options for displaying system diagnostics
Diagnostics 62 Function Manual, 09/2016, A5E03735838-AD
4.2.4.2 Different views of the HMI diagnostics view
Introduction There are three different views available in the system diagnostics view and the system diagnostics window.
● Device view
● Details view
● Matrix view (for master/IO systems only, PROFIBUS, PROFINET)
Device view The device view shows all the available devices of a layer in a table. Double-clicking on a device opens either the lower-level devices or the detail view. Symbols in the first column provide information about the current state of the device.
Figure 4-29 Device view

Setting and determining system diagnostics 4.2 Options for displaying system diagnostics
Diagnostics Function Manual, 09/2016, A5E03735838-AD 63
Details view The detail view gives detailed information about the selected device and any pending errors. Check whether the data is correct in the detail view.
Figure 4-30 Details view

Setting and determining system diagnostics 4.2 Options for displaying system diagnostics
Diagnostics 64 Function Manual, 09/2016, A5E03735838-AD
Matrix view The matrix view is only available for distributed I/O systems. The matrix view shows the status of the devices of the PROFIBUS/PROFINET subnet.
● In PROFIBUS, the numbers assigned by PROFIBUS are used for identification (DP station number).
● In PROFINET, the IO devices are numbered consecutively from 1.
Figure 4-31 Matrix view
Navigation buttons Button Function
Opens the lower-level devices or the detail view if there are no lower-level devices.
Opens the higher-level device or the device view if there is no higher-level device.
Opens the device view.
Setting and determining system diagnostics 4.2 Options for displaying system diagnostics
Diagnostics Function Manual, 09/2016, A5E03735838-AD 65
4.2.4.3 Inserting system diagnostics indicator
Introduction The system diagnostics indicator is a predefined graphic symbol of the library which alerts you to errors in your plant.
The library object shows two different states:
● No error
● Error
Requirements ● An HMI device (e.g., Comfort Panel) has been set up in the project.
● The "Libraries" task card is opened.
● The global library "Buttons and Switches > DiagnosticsButtons" is open.
● A screen is open.
● The system diagnostics window has been set up in the global screen.

Setting and determining system diagnostics 4.2 Options for displaying system diagnostics
Diagnostics 66 Function Manual, 09/2016, A5E03735838-AD
Procedure 1. Select the "DiagnosticsIndicator" object in the library.
2. Drag-and-drop the library object to the position in the work area where you want to insert the object.
The library object is added.
Figure 4-32 Inserting library object in the work area

Setting and determining system diagnostics 4.2 Options for displaying system diagnostics
Diagnostics Function Manual, 09/2016, A5E03735838-AD 67
3. Select the library object.
4. Open the "Events" tab in the Inspector window.
The "ShowSystemDiagnosticsWindow" is preset for the event "Click".
Result The system diagnostics indicator has been added to the project and connected with the system diagnostics window.
The system diagnostics indicator changes its appearance if an error message is output in WinCC Runtime. The system diagnostics window opens when you click on the system diagnostics indicator. The system diagnostics window shows the detail view of the affected device.
Configuring access protection for the system diagnostics window Configure access protection for the system diagnostics indicator to prevent unauthorized access to the system diagnostics windows.
1. Select the "DiagnosticsIndicator" object in the screen.
2. Open the "Properties" tab in the Inspector window.
3. Select an authorization in the "Security in Runtime" area.
A logon dialog opens when you click on the system diagnostics indicator in WinCC Runtime. The system diagnostics window does not open unless you have the required authorization.
4.2.4.4 Configuring button as system diagnostics indicator
Introduction Instead of using the object "DiagnosticsIndicator" from the library, you can, for example, configure a button in "Graphic" mode to indicate errors in your plant.
Requirements ● At least one CPU has been created.
● An HMI device (e.g., Comfort Panel) has been set up in the project.
● The "Tools" task card is open.
● A bit graphics list has been created with two different graphics for the states.
● A screen is open.
● You have created a system diagnostics view.

Setting and determining system diagnostics 4.2 Options for displaying system diagnostics
Diagnostics 68 Function Manual, 09/2016, A5E03735838-AD
Procedure Follow these steps to configure a button as system diagnostics indicator:
1. Double-click the "Button" object in the "Tools" task card. A button is added to the screen.
2. Enable the "Properties" tab in the Inspector window and the "Graphic" mode in the "General" area.
3. Select the bit graphics list as graphics list.
4. Select the "Properties" tab in the Inspector window and select the tag @DiagnosticsIndicatorTag under "Tag" in the "General" area.
5. To assign a function to the button, select the "Events" tab in the Inspector window.
6. Select the "Click" event.
7. Click on "Add function" in the table.
8. Select "EnableSystemDiagnosticsView".
9. Select the system diagnostics view.

Setting and determining system diagnostics 4.2 Options for displaying system diagnostics
Diagnostics Function Manual, 09/2016, A5E03735838-AD 69
Result You have configured an interface that reacts to error events from the CPU. The button changes when an error event occurs in Runtime.
Figure 4-33 Configured button
The button has two states.
● Error
The system diagnostics view opens when you click on the button. The system diagnostics view shows the detail view of the affected device.
● No error
The system diagnostics view opens when you click on the button. The system diagnostics view shows the device view.

Diagnostics 70 Function Manual, 09/2016, A5E03735838-AD
System diagnostics by means of the user program 5 5.1 Options of system diagnostics in the user program
Introduction You can configure responses to diagnostics alarms in the user program. You can, for example, specify that your plant is stopped in case of specific diagnostics alarms.
Instructions A vendor-independent structure of data records with diagnostics information applies. The following instructions are available for determining the system diagnostics of a device:
Table 5- 1 Instructions for determining the system diagnostics
Instruction Description RDREC • Reads data records of a component (module or submodule) of a DP slave/IO device that may
contain error information • Works asynchronously, which means processing takes place across several calls
RALRM • Reads the start information of the OB when calling the diagnostics interrupt OB (OB 82) • Provides information on cause and location of error
DPNRM_DG • Reads the current diagnostics data of a DP slave (DP standard diagnostics)
GEN_DIAG • Generates diagnostics information • To generate diagnostics information, the module or submodule is identified with its logical address
Gen_UsrMsg • Generates an alarm that is entered in the diagnostics buffer
GET_DIAG • Provides diagnostics information • To provide diagnostics information, the module or submodule is selected
GET_NAME • Reads the name of an IO device
T_DIAG • Provides diagnostics and status information on a connection • Works asynchronously, which means processing takes place across several calls
RD_SINFO • Reads the start information of the OB called last that has not been processed completely and the startup OB started last
• Provides general error information
LED • Reads the status of the module LED
Get_IM_Data • Reads the Information&Maintenance data of the CPU • Works asynchronously, which means processing takes place across several calls
Transfer_IM_Data • Transmits the Information&Maintenance data of the CPU
DeviceStates • Outputs the state of all devices of an IO system
ModuleStates • Outputs the state of all modules of a device

System diagnostics by means of the user program 5.2 System diagnostics using process image inputs
Diagnostics Function Manual, 09/2016, A5E03735838-AD 71
Additional information
Online help
In the online help for STEP 7, you can find:
● Additional information on instructions for system diagnostics
● Information about further options for evaluating diagnostic information in the user program (e.g. with the "RDREC", "RALRM", "GET_DIAG" instructions)
● Information on SIMATIC ProDiag. This functionality enables targeted and fast machine and plant diagnostics for SIMATIC S7-1500 and SIMATIC HMI:
– Standardized diagnostics concept for different SIMATIC components
– No additional configuration work for diagnostics functionality
– Reduces the load on PLC memory and program run time
You can find details in the online help under "Supervising machinery and plants with ProDiag".
Manuals
You can find additional information about evaluating diagnostic information in the user program in the following manuals:
● PROFINET with STEP 7 V14 (http://support.automation.siemens.com/WW/view/en/49948856) function manual
● From PROFIBUS DP to PROFINET IO (https://support.industry.siemens.com/cs/ww/en/view/19289930) programming manual
● Manual for the respective module
Application examples
You can find detailed application examples with further documentation and example projects on the Service&Support Website:
● Diagnostics in the user program with S7-1500 (https://support.industry.siemens.com/cs/ww/en/view/98210758)
● System diagnostics with S7-1500 and TIA Portal (https://support.industry.siemens.com/cs/ww/en/view/68011497)
FAQ
For more information about how to realize channel diagnostics in the user program of the SIMATIC S7-1500, refer to the FAQ with entry ID 109480387 on the Service&Support Website (https://support.industry.siemens.com/cs/ww/en/view/109480387).
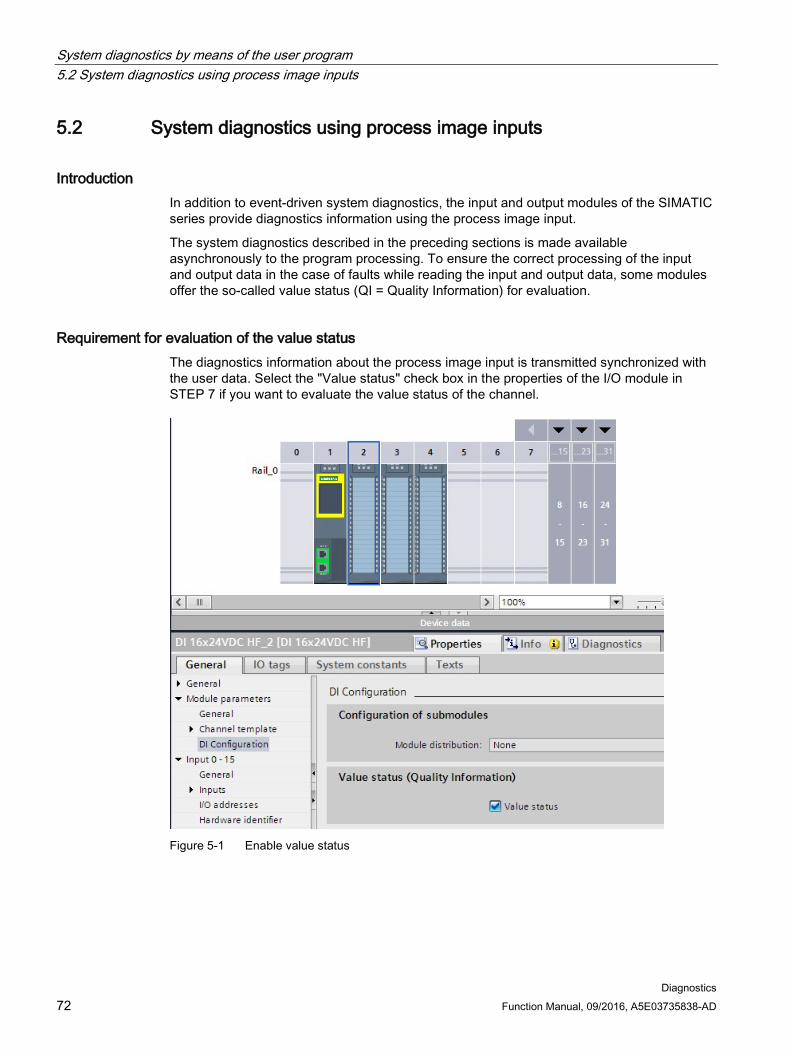
System diagnostics by means of the user program 5.2 System diagnostics using process image inputs
Diagnostics 72 Function Manual, 09/2016, A5E03735838-AD
5.2 System diagnostics using process image inputs
Introduction In addition to event-driven system diagnostics, the input and output modules of the SIMATIC series provide diagnostics information using the process image input.
The system diagnostics described in the preceding sections is made available asynchronously to the program processing. To ensure the correct processing of the input and output data in the case of faults while reading the input and output data, some modules offer the so-called value status (QI = Quality Information) for evaluation.
Requirement for evaluation of the value status The diagnostics information about the process image input is transmitted synchronized with the user data. Select the "Value status" check box in the properties of the I/O module in STEP 7 if you want to evaluate the value status of the channel.
Figure 5-1 Enable value status

System diagnostics by means of the user program 5.2 System diagnostics using process image inputs
Diagnostics Function Manual, 09/2016, A5E03735838-AD 73
Evaluation of the value status If you have enabled the value status for an I/O module, this module provides additional information on the value status in addition to the user data. This information is directly available in the process image input and can be called with simple binary operations.
Each channel is uniquely assigned one bit in the value status. The bit in the value status indicates the validity of the read-in value in the user data.
Table 5- 2 Example for evaluation of the user datum in case of a wire break for a digital input module
Bit in user datum Bit in value status Value in user datum Faulty channel Logical 0 0 Invalid Fault-free channel Logical 0 (actual value) 1 Valid
Influence of the value status The value status of an active channel is "Invalid" when any one of the following factors is given:
● Channel diagnostics pending (regardless of whether diagnostics, for example wire break, is configured for this channel)
● For output channels: "Reaction to CPU STOP" feature is active (due to CPU STOP, interrupted connection)
● For output channels of the digital on-board I/O of compact CPUs: If a channel is used for technology functions, it returns the value status 0 ("Invalid"). It does not matter in this context whether the output value is incorrect or not.
● PROFIenergy is active, i.e. hibernation is enabled (except in "Continue working mode")
When working with non-fail-safe modules, note that an invalid active channel also sets the value status of all other active channels to "Invalid". We therefore recommend that you disable all unconnected or unused channels.
Example - Evaluation of the value status for the input channel of an analog input module The example below shows the basic evaluation of the value status for the input channel of an analog input module in the user program. The diameter of a cylinder is measured by means of a channel and its circumference is calculated.
● If the value status indicates the channel is error-free, the circumference is to be calculated.
● If the value status indicates the channel is defective, the value "0" is to be output as substitute value for the circumference.

System diagnostics by means of the user program 5.2 System diagnostics using process image inputs
Diagnostics 74 Function Manual, 09/2016, A5E03735838-AD
The figure below shows the evaluation of the value status in the user program.
Figure 5-2 Example - Evaluation of the value status in the user program
Additional information Depending on the I/O module, the value status reserves different addresses in the process image input. The manual for the module used includes specific information on the assignment and arrangement.

Diagnostics Function Manual, 09/2016, A5E03735838-AD 75
Alarms 6
Introduction Alarms allow you to display events from processing in the automation system and to quickly detect errors, to precisely localize them and to remove them. Downtimes are significantly reduced in a plant.
Before alarms can be output, they need to be configured.
You can create, edit and compile event-dependent alarms along with their alarm texts and alarm attributes and display them on display devices.
In STEP 7, you create program alarms in the user program with the "Program_Alarm" instruction. You edit the attributes and alarm texts in the alarm editor in STEP 7.
You can output the alarm status with the "Get_AlarmState" instruction.
Advantages of program alarms Compared to other alarm methods, such as HMI discrete alarms, program alarms offer the following advantages:
● Central engineering in STEP 7: You only configure a program alarm once for the CPU. The program alarm is automatically transferred from the CPU to all registered HMI devices.
● System-supported acknowledgment: The acknowledgment of a program alarm on an HMI device is automatically updated on other HMI devices by the CPU.
● Time stamping close to the event in the CPU
● Identical time stamps of the alarms on multiple HMI devices without time synchronization

Alarms 6.1 Creating alarms with the "Program_Alarm" instruction
Diagnostics 76 Function Manual, 09/2016, A5E03735838-AD
6.1 Creating alarms with the "Program_Alarm" instruction
"Program_Alarm" instruction You create a program alarm in STEP 7 with the "Program_Alarm" instruction.
The figure below shows the "Program_Alarm" instruction with the most important input tags.
① The "Program_Alarm" instruction monitors the signal at the SIG block input and generates a
program alarm in case of a signal change at the SIG parameter. The instruction generates an incoming alarm when the signal changes from 0 to 1 and an outgoing program alarm if the signal changes from 1 to 0. The program alarm is triggered synchronously to program execu-tion.
② The time stamp is automatically created when the alarm event occurs in the automation system and is passed along with the alarm.
③ You can append up to ten associated values to the program alarm at the parameters SD_i (1 ≤ i ≤10). The associated values are acquired at the time of the signal change at the SIG parameter and assigned to the program alarm. Associated values are used to display dynamic contents in alarms. Example: The temperature in the tank <associated value 1> is <associated value 2> °C. You can find more information on associated values in the STEP 7 online help.
Figure 6-1 "Program_Alarm" instruction

Alarms 6.1 Creating alarms with the "Program_Alarm" instruction
Diagnostics Function Manual, 09/2016, A5E03735838-AD 77
Note
The "Program_Alarm" instruction can only be called in a function block.
A program alarm can be up to 256 bytes long in total (with associated values and texts from the text list).
The associated values can be a maximum of 512 bytes in length. Text lists are not affected by this.
The CPUs of the SIMATIC S7-1500 product series have the following memory for text lists: • CPU 1510-x to CPU 1513-x: 2.25 MB • CPU 1515-x to CPU 1516-x: 4.5 MB • CPU 1517-x to CPU 1518-x: 6.75 MB
The number of configurable program alarms depends on the CPU used. With a CPU 1515-2 PN, for example, a maximum of 10,000 program alarms are possible. You can find this information in the device manual for the respective CPU under "Number of configurable alarms".
The number of simultaneously active "Program_Alarms" depends on the CPU used. With a 1515-2 PN CPU, for example, a maximum of 600 program alarms are possible. You can find this information in the device manual for the respective CPU under "Number of reserved user interrupts".
Sometimes, it is not possible for all program alarms that are active at the same time to be output within one cycle. Query the status of each "Program_Alarm" and activate the instruction again, if necessary. The cycle time is increased for a short time by simultaneously activating/sending multiple "Program_Alarms".
A maximum of 40,000 program alarms should be configured in a STEP 7 project on a 64-bit operating system.
Additional information You can find more information on creating program alarms in the STEP 7 online help under "Creating and editing alarms".

Alarms 6.2 Editing alarms in the alarm editor
Diagnostics 78 Function Manual, 09/2016, A5E03735838-AD
6.2 Editing alarms in the alarm editor
Introduction You can edit the created alarms in STEP 7 either in the program editor or in the alarm editor.
You can find additional information on editing alarms in the program editor in the STEP 7 online help under "Creating and editing alarms".
Editing alarms in the alarm editor You can edit alarm texts in the alarm editor and specify attributes such as alarm class or priority for the alarms.
1. Double-click "PLC supervisions & alarms" in the project tree. Select the "Alarms" tab. The alarm editor opens.
2. Enter the required texts and attributes in the appropriate columns.

Alarms 6.2 Editing alarms in the alarm editor
Diagnostics Function Manual, 09/2016, A5E03735838-AD 79
The figure below shows the layout of the alarm editor.
① "Program alarms" tab: You can edit program alarms here. ② "System alarms" tab: System alarms can only be viewed but not edited. To edit these alarms, you must navigate to
the device view ("Go to device" menu command), where you can modify the system diagnostics alarms in the In-spector window.
③ "Type alarms" area: This is where the type alarms created in a function block with the "Program_Alarm" instruction are displayed. Type alarms serves as templates for instance alarms (④). All the inputs you make for the type alarm are automatically included in the instance alarms derived from it. You can find more information on type alarms in the STEP 7 online help under "Alarm types and alarms".
④ "Instance alarms" area: When you assign an instance DB to the message block (for example, call in an OB, FB, FC), instance alarms are automatically generated based on the template of the type alarm and alarm numbers are assigned. You can modify the instance alarms for specific instances. You can find more information on instance alarms in the STEP 7 online help under "Alarm types and alarms".
⑤ Properties of the selected type and instance alarm in the Inspector window
Figure 6-2 Layout of the alarm editor
You can enter or modify the necessary parameters, texts and attributes in the table or in the Inspector window.

Alarms 6.2 Editing alarms in the alarm editor
Diagnostics 80 Function Manual, 09/2016, A5E03735838-AD
Multilingual alarms You can have program alarms displayed in multiple languages by assigning different project languages to the interface languages of the display devices.
Note
The project languages you want to assign must be activated and the corresponding texts (translations) must be available in the project. The project language selection can be found in the project tree under "Languages & Resources".
To create the texts of the program alarm as multilingual, follow these steps:
1. In the Inspector window of the alarm editor, open the "Properties" tab and the lower-level "Texts" tab.
2. Enter the text in the desired project language.
3. Open the "Properties" tab in the Inspector window of the CPU and select the "Display" command in the "General" area navigation. Under "Multilingual", assign one of the activated project languages to each interface language of the display devices. Overall, you can assign up to three different project languages to the user interface languages. All assigned project languages are loaded into the CPU.
Additional information You can find additional information on texts and attributes in the STEP 7 online help under "Texts and attributes".
You can find more information on text lists in the STEP 7 online help under "Text lists for alarms".

Alarms 6.3 Display of program alarms
Diagnostics Function Manual, 09/2016, A5E03735838-AD 81
6.3 Display of program alarms Program alarms you create with the "Program_Alarm" instruction are automatically made available to the display devices.
You have the following options to display the alarms:
● STEP 7
● HMI
● Web server of the CPU
● Display of the CPU
Figure 6-3 Display of program alarms
Multilingual alarms
You can have program alarms displayed in multiple languages by assigning different project languages to the interface languages. See section Editing alarms in the alarm editor (Page 78).

Alarms 6.4 Output of the alarm state with the "Get_AlarmState" instruction
Diagnostics 82 Function Manual, 09/2016, A5E03735838-AD
6.4 Output of the alarm state with the "Get_AlarmState" instruction
"Get_AlarmState" instruction The "Get_AlarmState" instruction outputs the alarm state of a program alarm. The output of the alarm state always refers to a program alarm that was created using the "Program_Alarm" instruction.
The program alarm is selected with the "Alarm" input parameter. Specify the instance DB of the "Program_Alarm" instruction at the "Alarm" parameter.
Figure 6-4 Call - Get_AlarmState
Additional information You can find additional information on evaluation of the "Get_AlarmState" instruction in the STEP 7 online help.

Alarms 6.5 Example program for program alarms
Diagnostics Function Manual, 09/2016, A5E03735838-AD 83
6.5 Example program for program alarms
6.5.1 Task
Introduction This section describes the basic configuration of program alarms with the "Program_Alarm" instruction based on two examples. The two examples solve the same problem but use a different approach. Example 1 does not use associated values. In example 2, an associated value is assigned to the program alarm to reference a text list.
Example - Minimum/maximum fill level of a tank A tank is filled with a liquid. The fill level is monitored by two sensors.
If the liquid in the tank drops below a minimum fill level, an alarm is output for low fill level.
If the liquid in the tank exceeds a maximum fill level, an alarm is output for high fill level.
Figure 6-5 Example for fill level alarms
6.5.2 Example 1: Program alarm without associated values
Introduction In this example, you create a program alarm for the maximum and the minimum fill level.
How the example works When the maximum fill level is exceeded in the tank, a program alarm with the alarm text for the excessive fill level is output.
When the minimum fill level is undershot in the tank, a program alarm with the alarm text indicating that the fill level is too low is output.

Alarms 6.5 Example program for program alarms
Diagnostics 84 Function Manual, 09/2016, A5E03735838-AD
Steps The following steps are necessary for this example:
1. Define tags for signal acquisition
2. Create function block
3. Create program alarms
4. Call function block
5. Edit alarm text
Define tags for signal acquisition The following table shows the tags that are used in this example. Define these tags in the standard tag table. The standard tag table is available in the project tree under "PLC tags".
Table 6- 1 Tags for fill level alarms
Name Data type Description max BOOL Tag for maximum fill level
If "max" = 1, the maximum fill level is exceeded. min BOOL Tag for minimum fill level
If "min" = 1, the minimum fill level is undershot.
The figure below shows the standard tag table with the defined tags "max" and "min".
Figure 6-6 Define tags

Alarms 6.5 Example program for program alarms
Diagnostics Function Manual, 09/2016, A5E03735838-AD 85
Create function block To create a function block, follow these steps:
1. Open the "Program blocks" folder in the project tree.
2. Double-click "Add new block". The "Add new block" dialog opens.
3. Select the button "Function block".
Figure 6-7 Create FB
4. Enter a name for the new block.
5. Select the language SCL.
6. Click on "OK" to confirm your input.
Result: You have created a function block.

Alarms 6.5 Example program for program alarms
Diagnostics 86 Function Manual, 09/2016, A5E03735838-AD
Create program alarms To create the program alarm for the example program, follow these steps:
1. Select the created function block (FB) in the "Program blocks" folder in the project tree and double-click the function block to open it.
2. Insert the call of the "Program_Alarm" instruction in the instruction part of the function block. The "Program_Alarm" instruction is available in the "Instructions" task card under "Extended instructions" > "Alarms".
The "Call options" window opens.
Figure 6-8 Call Program_Alarm
3. Enter "level_max" as the name and confirm the call options by clicking "OK".
Result: The input tags of the "Program_Alarm" instruction are displayed in the instruction part.
4. Supply the SIG input tag of the "Program_Alarm" instruction with the tags for the maximum fill level. #level_max(SIG:="max");
SIG: If a signal change occurs at the SIG input tag, the "Program_Alarm" instruction generates a program alarm.
5. Insert another call of the "Program_Alarm" instruction. The "Call options" window opens.
6. Enter "level_min" as the name and confirm the call options by clicking "OK".
Result: The input tags of the "Program_Alarm" instruction are displayed in the instruction part.
7. Supply the SIG input tag of the "Program_Alarm" instruction with the tags for the minimum fill level. #level_min(SIG:="min");
Result: You have created two type alarms.

Alarms 6.5 Example program for program alarms
Diagnostics Function Manual, 09/2016, A5E03735838-AD 87
Call function block To call the function block in the user program, follow these steps:
1. In the "Program blocks" folder, select the cycle OB (e.g., OB1) in which you want to call the function block and open the cycle OB with a double-click.
2. Select the function block you want to call in the "Program blocks" folder.
3. Drag the function block into the instruction part of the cycle OB. The "Call options" window opens.
Figure 6-9 Call function block
4. Confirm the call options by clicking "OK".
Result: You have called the alarm block in the user program and created an instance alarm.

Alarms 6.5 Example program for program alarms
Diagnostics 88 Function Manual, 09/2016, A5E03735838-AD
Edit alarm text To edit the alarm text, follow these steps: 1. Double-click "PLC supervisions & alarms" in the project tree. Select the "Alarms" tab. The
alarm editor opens.
2. Select the type alarm for the maximum fill level.
3. Enter the alarm text for the maximum fill level in the "Alarm text" column.
4. Select the type alarm for the minimum fill level.
5. Enter the alarm text for the minimum fill level in the "Alarm text" column.
Figure 6-10 Edit alarm text
Result: You have created the alarm texts for both type alarms.
Additional information You can learn how to create multilingual texts under "Multilingual alarms" in the section Editing alarms in the alarm editor (Page 78).
6.5.3 Example 2: Program alarm with associated value
Introduction In this example, you create a shared program alarm for the maximum and the minimum fill level. The program alarm is given an associated value. The program alarm uses the associated value to access a text list entry and outputs a separate alarm text for the minimum and the maximum fill level.
How the example works The program alarm is output if either the minimum fill level is undershot or the maximum fill level is exceeded.
The associated value 1 of the "Program_Alarm" instruction is assigned the tag for the maximum fill level. The associated value references a text list with the entries "0" and "1". The following scenarios are possible for output of the alarm text: ● Associated value is "0": The entry "0" of the text list with the alarm text for the undershot
fill level is output. ● Associated value is "1": The entry "1" of the text list with the alarm text for the excessive
fill level is output.

Alarms 6.5 Example program for program alarms
Diagnostics Function Manual, 09/2016, A5E03735838-AD 89
Steps The following steps are necessary for this example:
1. Define tags for signal acquisition
2. Create function block
3. Create program alarm
4. Call function block
5. Create a text list
6. Edit alarm text
Define tags for signal acquisition The following table shows the tags that are used in this example. Define these tags in the standard tag table. The standard tag table is available in the project tree under "PLC tags".
Table 6- 2 Tags for fill level alarms
Name Data type Description max BOOL Tag for maximum fill level
If "max" = 1, the maximum fill level is exceeded. min BOOL Tag for minimum fill level
If "min" = 1, the minimum fill level is undershot.
The figure below shows the standard tag table with the defined tags "max" and "min".
Figure 6-11 Define tags
Create function block To create a function block, follow these steps:
1. Open the "Program blocks" folder in the project tree.
2. Double-click "Add new block". The "Add new block" dialog opens.

Alarms 6.5 Example program for program alarms
Diagnostics 90 Function Manual, 09/2016, A5E03735838-AD
3. Select the button "Function block".
Figure 6-12 Create FB
4. Enter a name for the new block.
5. Select the language SCL.
6. Click on "OK" to confirm your input.
Result: You have created a function block.

Alarms 6.5 Example program for program alarms
Diagnostics Function Manual, 09/2016, A5E03735838-AD 91
Create program alarm To create the program alarm for the example program, follow these steps:
1. Select the created function block (FB) in the "Program blocks" folder in the project tree.
2. Insert the call of the "Program_Alarm" instruction in the instruction part of the function block. The "Program_Alarm" instruction is available in the "Instructions" task card under "Extended instructions" > "Alarms". The "Call options" window opens.
Figure 6-13 Call Program_Alarm
3. Enter "level_alarm" as the name and confirm the call options by clicking "OK".
Result: The input tags of the "Program_Alarm" instruction are displayed in the instruction part.
4. Supply the SIG input tag of the "Program_Alarm" instruction with the XOR logic operation of the tags for minimum and maximum fill level and the input tag SD_1 with the tag for the maximum fill level. #level_alarm(SIG:="min"XOR"max",SD_1:="max");
SIG: If a signal change occurs at the SIG input tag, the "Program_Alarm" instruction generates a program alarm. SD_1: The associated value is acquired at the time of the signal change at the input tag and assigned to the program alarm.
Result: You have created a type alarm.

Alarms 6.5 Example program for program alarms
Diagnostics 92 Function Manual, 09/2016, A5E03735838-AD
Call function block To call the function block in the user program, follow these steps:
1. In the "Program blocks" folder, select the cycle OB (e.g., OB1) in which you want to call the function block and open the cycle OB with a double-click.
2. Select the function block you want to call in the "Program blocks" folder.
3. Drag the function block into the instruction part of the cycle OB. The "Call options" window opens.
Figure 6-14 Call function block
4. Confirm the call options by clicking "OK".
Result: You have called the alarm block in the user program and created an instance alarm.
Creating a text list To create the text list for the example program, follow these steps:
1. Double-click on the "Text lists" command in the program tree. The text list editor opens.
2. Double-click "<Add>" in the Text lists area. A new text list is added.
3. Name the text list "level_textlist".
4. Double-click "<Add>" in the Text list entries area of level_textlist. A new text list entry is added in the level_textlist text list.
5. Enter the alarm text for the maximum fill level in the "Entry" column.

Alarms 6.5 Example program for program alarms
Diagnostics Function Manual, 09/2016, A5E03735838-AD 93
6. Add another entry in the text list.
7. Enter the alarm text for the minimum fill level in the "Entry" column.
Figure 6-15 Creating a text list
Result: You have created the text list for the alarm text.
Edit alarm text To edit the alarm text for the example program, follow these steps:
1. Double-click "PLC supervisions & alarms" in the project tree. Select the "Alarms" tab. The alarm editor opens.
2. Select the type alarm created for the example.
3. Click in the "Alarm text" column.
4. Open the shortcut menu and select the command "Insert a dynamic parameter (text list)".
Figure 6-16 Edit alarm text

Alarms 6.5 Example program for program alarms
Diagnostics 94 Function Manual, 09/2016, A5E03735838-AD
The window below opens.
Figure 6-17 Insert a dynamic parameter (text list)
5. Select the text list "level_textlist" and the tag "max". Confirm your selection by clicking "OK".
Result: You have created the alarm text for the type alarms. If the tag "max" (associated value 1) is 0, the alarm text "level too low" is output. If the tag "max" (associated value 1) is 1, the alarm text "level too high" is output.
Additional information You can learn how to create multilingual texts under "Multilingual alarms" in the section Editing alarms in the alarm editor (Page 78).

Alarms 6.5 Example program for program alarms
Diagnostics Function Manual, 09/2016, A5E03735838-AD 95
6.5.4 Displaying the alarm
Displaying the alarm in the Web server The figure below shows the display of the alarm in the Web server for both examples.
Figure 6-18 Displaying the alarm in the Web server
Displaying the alarm in STEP 7
Note Displaying alarms in STEP 7
To display alarms in STEP 7, enable the option "Receive alarms" in the shortcut menu of the CPU.
The figure below shows the display of the alarm in STEP 7 for both examples.
Figure 6-19 Display in STEP 7

Diagnostics 96 Function Manual, 09/2016, A5E03735838-AD
Glossary
Alarm An message sent to the operator due to events or states of the system.
Button (WinCC) Object in WinCC that points out faults in the plant
Channel fault Channel-related error of an individual channel - an I/O with inputs, for example, wire break or short circuit
Device Modules with a network connection are referred to as device. Devices are installed on racks where they can be interconnected with other modules.
Diagnostics buffer A buffered memory area in the CPU; it stores diagnostics events in the order of their occurrence
Firmware of the CPU In SIMATIC, a distinction is made between the firmware of the CPU and user programs.
The firmware is a software embedded in electronic devices, which means it is permanently connected with the hardware functionally. It is usually saved in a flash memory, such as EPROM, EEPROM or ROM, and cannot be replaced by the user or only with special means or functions.
User program: see glossary entry "User program"
Global screen (WinCC) A screen that is opened in the system diagnostics window is a global screen.
HMI device Human Machine Interface, device for visualization and control of automation processes.

Glossary
Diagnostics Function Manual, 09/2016, A5E03735838-AD 97
HMI diagnostics view (WinCC) The HMI diagnostics view is an object in WinCC. The HMI diagnostics view can only be used with Comfort Panels and WinCC Advanced RT.
I/O module Device of the distributed I/O that is used as interface between the controller and the process.
Industrial Ethernet Guideline for setting up Ethernet in an industrial environment. The main difference to the standard Ethernet is the mechanical current carrying capacity and interference immunity of the individual components.
Memory reset Procedure to set the memories of the CPU to a defined initial state.
PLC Programmable Logic Controller: Component of the CNC by which the machine manufacturer coordinates the interaction between the NC requirements (part program), the inputs of the machine operator and the current machine state.
PROFIBUS Standard for fieldbus communication in automation technology.
PROFINET Open component-based industrial communication system based on Ethernet for distributed automation systems. Communication technology promoted by the PROFIBUS Users Organization.
Subnet Part of a network whose parameters must be synchronized with the devices (e.g., with PROFINET). It includes the bus components and all connected stations. Subnets can be linked by means of gateways, for example, to form a network.
System diagnostics In the SIMATIC environment, the term "system diagnostics" refers to diagnostics of devices and modules. System diagnostics is used, for example, to monitor the states of the following components in the system: Power supply, device, I/O.

Glossary
Diagnostics 98 Function Manual, 09/2016, A5E03735838-AD
System diagnostics indicator (WinCC) The system diagnostics indicator is a predefined graphic symbol of the library which alerts you to errors in your plant and displays two states: No error, error
Topology Structure of a network. Common structures include:
● Linear bus topology
● Ring topology
● Star topology
● Tree topology
User program In SIMATIC, a distinction is made between user programs and the firmware of the CPU.
The user program contains all instructions, declarations and data by which a plant or process can be controlled. It is assigned to a programmable module (for example, CPU, FM) and can be structured in smaller units.
Firmware: see glossary entry "Firmware of the CPU"
Value status The value status describes a specific signal state. The value status is constantly updated and cyclically transmitted by the field device as quality statement together with the measured value.
Web server Software/ communication service for data exchange using Ethernet. The web server provides the documents by means of standardized transmission protocols (HTTP, HTTPS) to a web browser. Documents can be static or dynamic upon request by the web browser composed from different sources by the web server.
WinCC Windows Control Center: a PC-based process visualization system
WinCC Runtime Component of the basic software WinCC

Diagnostics Function Manual, 09/2016, A5E03735838-AD 99
Index
" "Diagnostics" tab
Alarm display, 40 Connection information, 40 Device information, 40 Inspector window, 40
A Accessible devices
Diagnostics status, 32 Offline project, 32
Alarm display Active alarms, 42 Archive view, 42
Alarms Editing in the alarm editor, 78 Multilingual, 80
Application examples Diagnostics in the user program with S7-1500, 71 System diagnostics with S7-1500 and TIA Portal, 71
D Device information
Online status, 40 Operating mode, 40
Devices & networks Current state, 34 Go online, 34
Diagnostics buffer Diagnostic events, 43 Retentive memory, 43
Display of the CPU Display options, 28 Input options, 28 Status information, 28
dynamize Object appearance, 67
F FAQs
Download certificate, 52 Implementing channel diagnostics in the user program, 71
H HMI
System diagnostics view, 59 System diagnostics window, 59
HMI diagnostics view Comfort Panels, 59 Details view, 62 Device view, 62 Matrix view, 62 Views, 62 WinCC Advanced RT, 59
I I/O module
Inputs, 48 Settings, 48
L LED arrangement, 27 Library
System diagnostics indicator, 65
O Online & diagnostics
Activities, 37 Information, 37 Online access, 37 Online mode, 37
Online tools CPU operator panel, 46 Cycle time, 46 Memory, 46 Memory usage, 46

Index
Diagnostics 100 Function Manual, 09/2016, A5E03735838-AD
Online view, 46 Task card, 46
P Process image inputs, 72
Quality Information, 72 User datum, 72 Value status, 72
Q Quick start, 17
Using display, 17 Using STEP 7, 19
S Security events, 45 Setting options, 24 Symbol
For comparison, 31 For hardware diagnostics, 30 For operating mode, 31 For software diagnostics, 31
System diagnostics Advantages, 16 Alarm settings, 25 Button, 67 Display concept, 16 Properties, 14
System diagnostics indicator Button as system diagnostics indicator, 67 Inserting, 65 System diagnostics window, 65
System diagnostics view, 59 Configuring, 59 System diagnostics indicator, 65
System diagnostics window, 59 Configuring, 59 Global screen, 59
U User program
Instructions, 70 Response to diagnostics alarms, 70
W Web server
Access to, 52 Activating, 50 Alarms, 55 Browser, 49 Certificate, 50 Configuring, 50 Diagnostics, 53 Diagnostics buffer, 54 HTTPS, 50 Integrated Web server, 49 Module information, 55 Motion Control diagnostics, 57 Topology, 56 Trace, 58 Web pages, 49