Diagnosing performance changes by comparing request flows
46
Diagnosing performance changes by comparing request flows Raja Sambasivan Alice Zheng ★ , Michael De Rosa ✚ , Elie Krevat, Spencer Whitman, Michael Stroucken, William Wang, Lianghong Xu, Greg Ganger Carnegie Mellon Microsoft Research ★ Google ✚
Transcript of Diagnosing performance changes by comparing request flows
Diagnosing performance changes by comparing request flows!
Raja Sambasivan!Alice Zheng★, Michael De Rosa✚, Elie Krevat,
Spencer Whitman, Michael Stroucken, William Wang, Lianghong Xu, Greg Ganger!
!
Carnegie Mellon! Microsoft Research★! Google✚ !
Perf. diagnosis in distributed systems!• Very difficult and time consuming!
• Root cause could be in any component!!
• Request-flow comparison!• Helps localize performance changes!• Key insight: Changes manifest as
mutations in request timing/structure!!
Raja Sambasivan © March 11!http://www.pdl.cmu.edu/ 2
Raja Sambasivan © March 11!http://www.pdl.cmu.edu/ 3
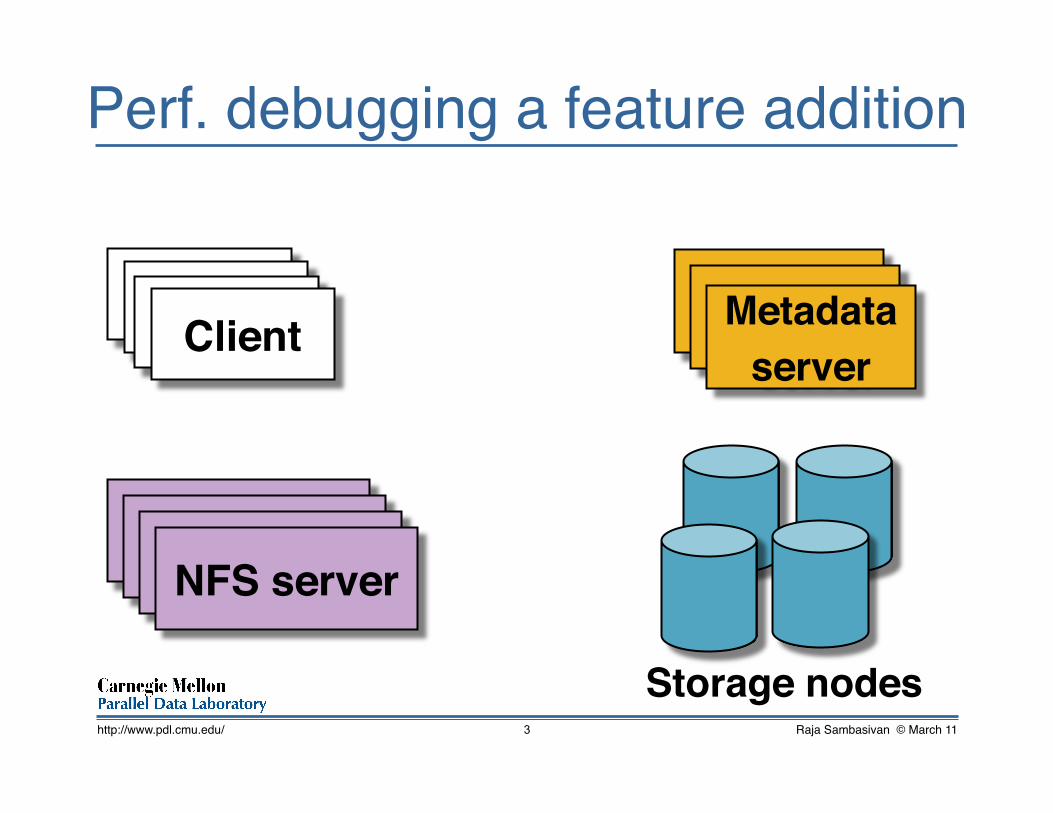
Perf. debugging a feature addition!
Client Clients Client Client!
Servers
Storage nodes!
NFS server!
Servers Metadata!
server!
Raja Sambasivan © March 11!http://www.pdl.cmu.edu/ 4
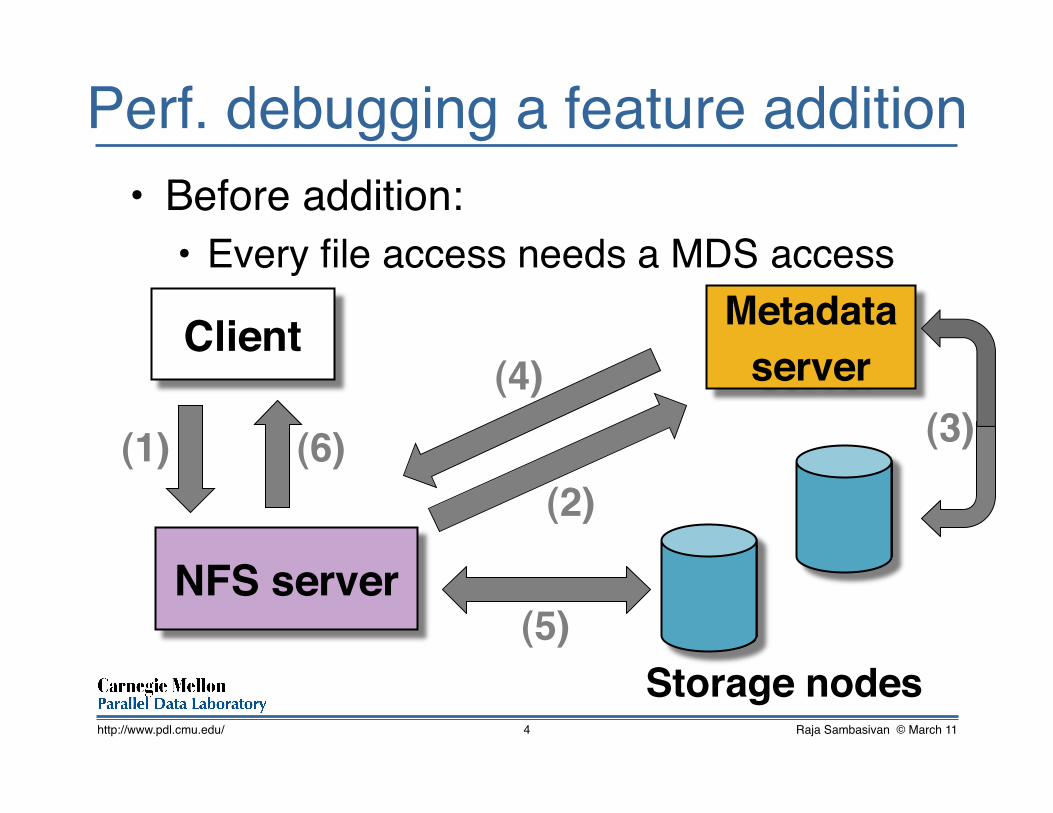
Perf. debugging a feature addition!• Before addition:!
• Every file access needs a MDS access!
Client!
Storage nodes!
NFS server!
Metadata!server!
(1)!(2)!
(3)!(4)!
(5)!
(6)!

Raja Sambasivan © March 11!http://www.pdl.cmu.edu/ 5
Perf. debugging a feature addition!• After: Metadata prefetched to clients !
• Most requests donʼt need MDS access!
Client!
Storage nodes!
NFS server!
Metadata!server!
(1)!
(2)
(3)!

Perf. debugging a feature addition!• Adding metadata prefetching reduced
performance instead of improving it (!)!
• How to efficiently diagnose this?!
Raja Sambasivan © March 11!http://www.pdl.cmu.edu/ 6
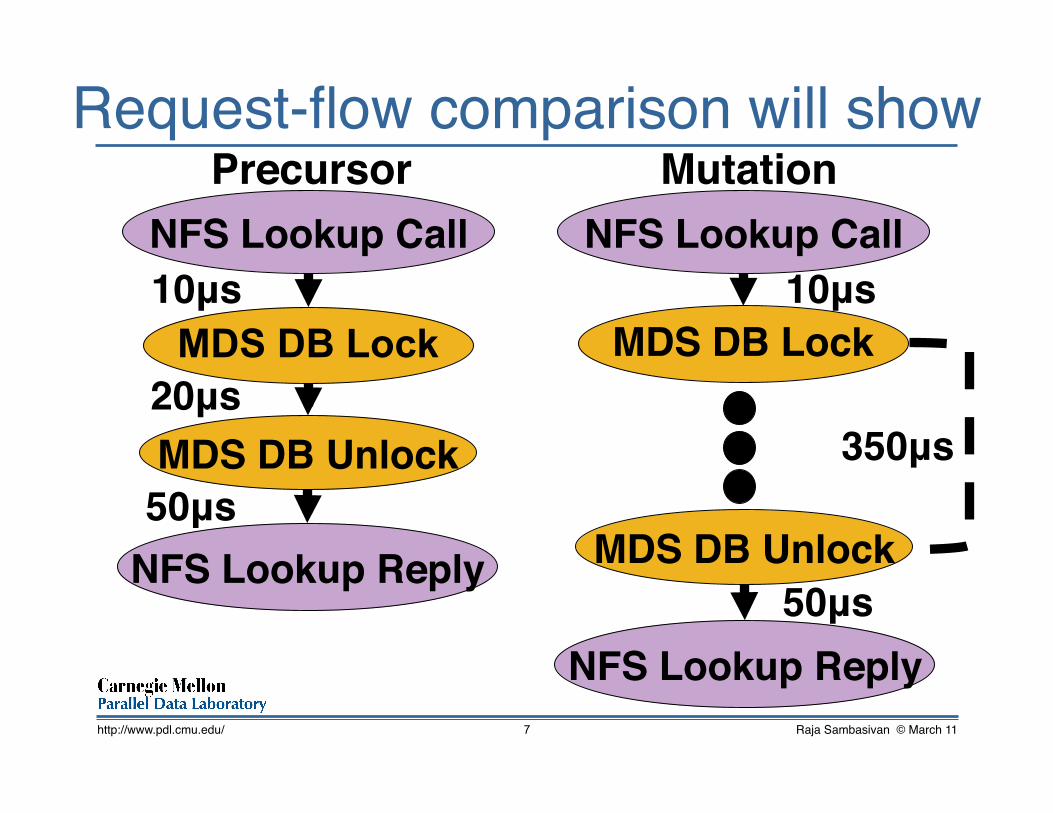
Request-flow comparison will show!
Raja Sambasivan © March 11!http://www.pdl.cmu.edu/ 7
Precursor!
10μs!!20μs!!50μs!!
NFS Lookup Call!
MDS DB Lock
MDS DB Unlock!
NFS Lookup Reply!
10μs!!
50μs!!
Mutation!NFS Lookup Call!
MDS DB Lock!
MDS DB Unlock!
NFS Lookup Reply!
350μs!

Request-flow comparison will show!
Raja Sambasivan © March 11!http://www.pdl.cmu.edu/ 8
Precursor!
10μs!!20μs!!50μs!!
NFS Lookup Call!
MDS DB Lock
MDS DB Unlock!
NFS Lookup Reply!
10μs!!
50μs!!
Mutation!NFS Lookup Call!
MDS DB Lock!
MDS DB Unlock!
NFS Lookup Reply!
350μs!
Root cause localized by showing how mutation and precursor differ!
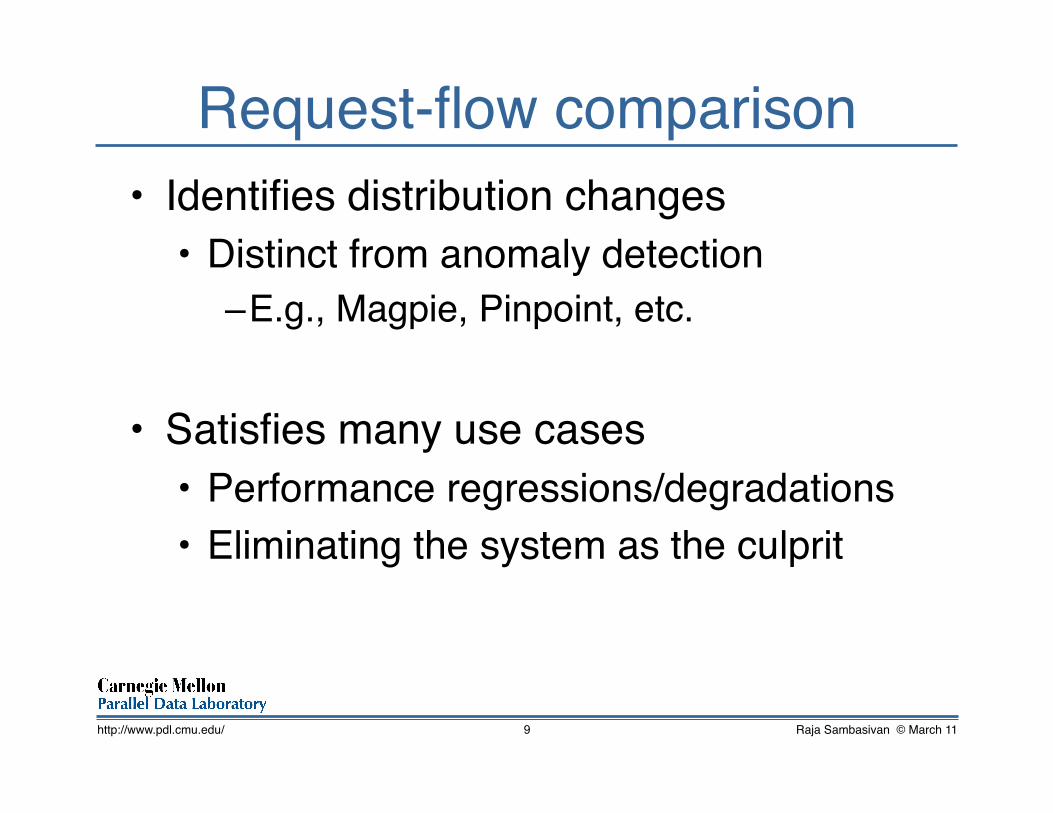
Request-flow comparison!• Identifies distribution changes!
• Distinct from anomaly detection!– E.g., Magpie, Pinpoint, etc.!
• Satisfies many use cases!• Performance regressions/degradations!• Eliminating the system as the culprit!
Raja Sambasivan © March 11!http://www.pdl.cmu.edu/ 9

Contributions!• Heuristics for identifying mutations,
precursors, and for ranking them!• Implementation in Spectroscope!
• Use of Spectroscope to diagnose!• Unsolved problems in Ursa Minor!• Problems in Google services !
Raja Sambasivan © March 11!http://www.pdl.cmu.edu/ 10
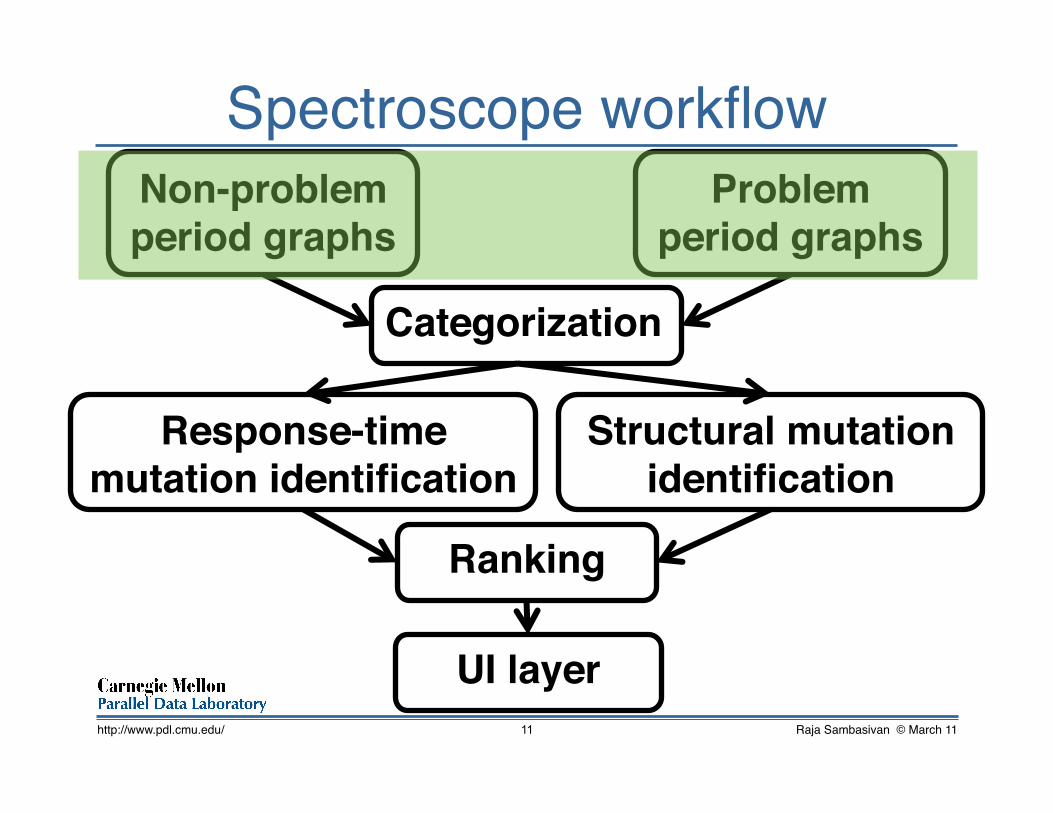
Spectroscope workflow!
Raja Sambasivan © March 11!http://www.pdl.cmu.edu/ 11
Non-problem period graphs!
Problem period graphs!
Categorization!
Response-time mutation identification!
Structural mutation identification!
UI layer!
Ranking!

Graphs via end-to-end tracing!• Used in research & production systems!
• E.g., Magpie, X-Trace, Googleʼs Dapper!
• Works as follows:!• Tracks trace points touched by requests!• Request-flow graphs obtained by
stitching together trace points accessed!
• Yields < 1% overhead w/req. sampling !Raja Sambasivan © March 11!http://www.pdl.cmu.edu/ 12
SN1 Reply!
1,500μs!SN2
Reply!
1,500μs!
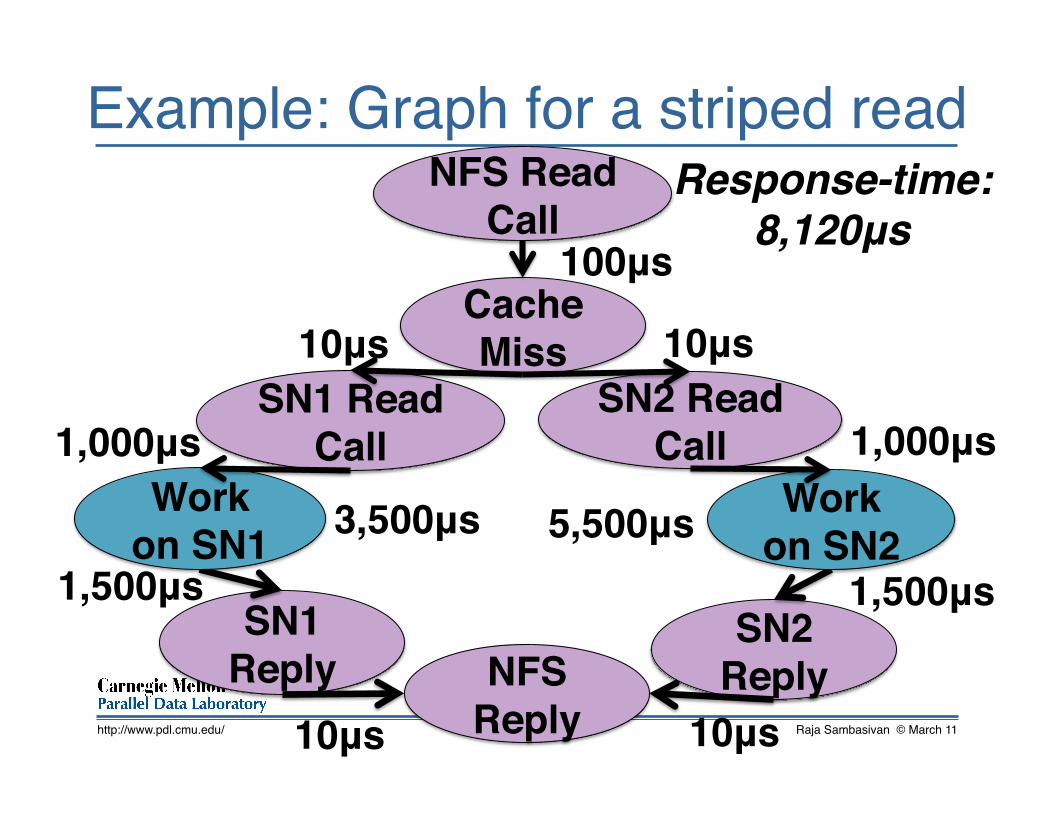
Example: Graph for a striped read!
Raja Sambasivan © March 11!http://www.pdl.cmu.edu/ 13
NFS Read Call!
Cache Miss!
100μs!
SN1 Read Call!
SN2 Read Call!
10μs! 10μs!
NFS Reply!10μs! 10μs!
Response-time:!8,120μs!
Work on SN1!
Work on SN2!
1,000μs! 1,000μs!
3,500μs! 5,500μs!
SN1 Reply!
1,500μs!SN2
Reply!
1,500μs!
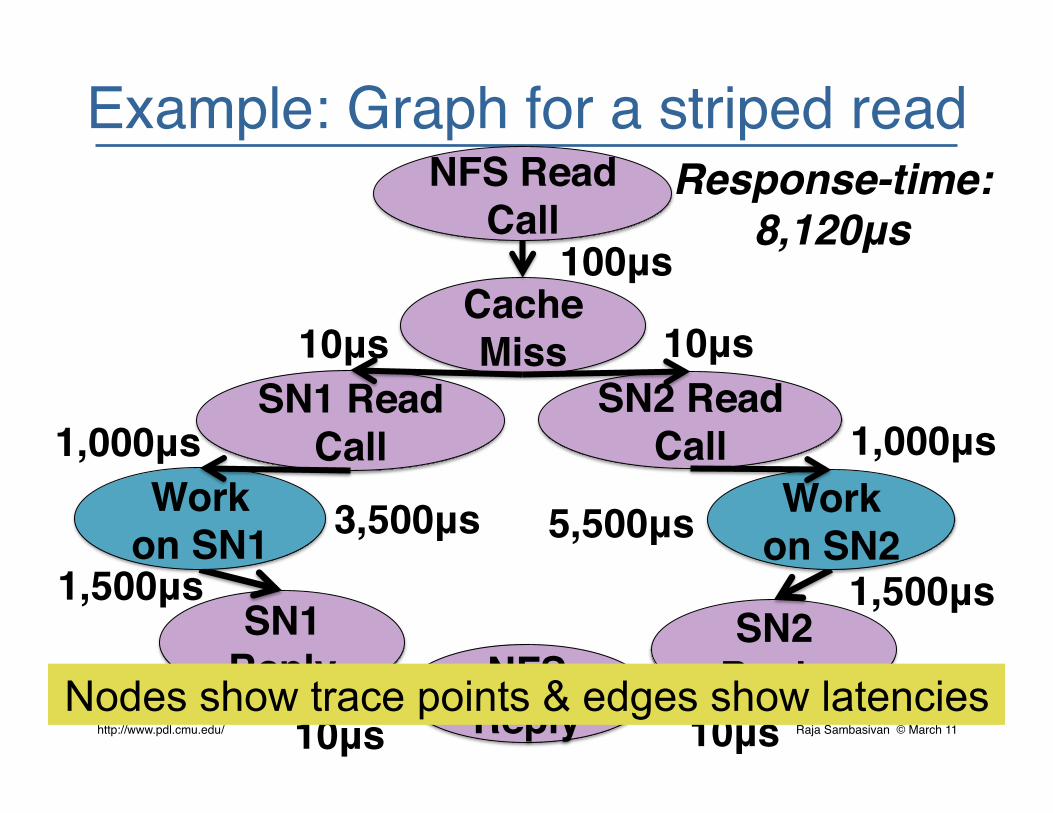
Example: Graph for a striped read!
Raja Sambasivan © March 11!http://www.pdl.cmu.edu/ 14
NFS Read Call!
Cache Miss!
100μs!
SN1 Read Call!
SN2 Read Call!
10μs! 10μs!
NFS Reply!10μs! 10μs!
Response-time:!8,120μs!
Work on SN1!
Work on SN2!
1,000μs! 1,000μs!
3,500μs! 5,500μs!
Nodes show trace points & edges show latencies
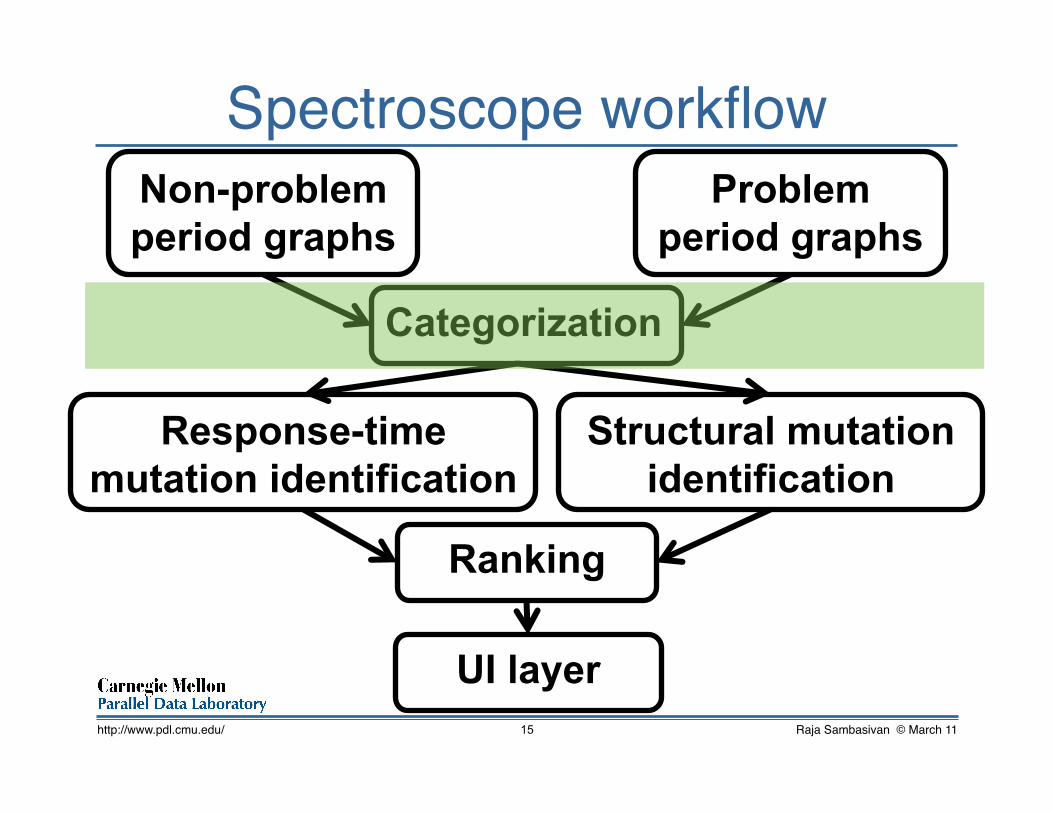
Spectroscope workflow!
Raja Sambasivan © March 11!http://www.pdl.cmu.edu/ 15
Non-problem period graphs
Problem period graphs
Categorization
Response-time mutation identification
Structural mutation identification
Ranking
UI layer

Categorization step!• Necessary since it is meaningless to
compare individual requests flows!
• Groups together similar request flows!• Categories: basic unit for comparisons!• Allows for mutation identification by
comparing per-category distributions !
Raja Sambasivan © March 11!http://www.pdl.cmu.edu/ 16
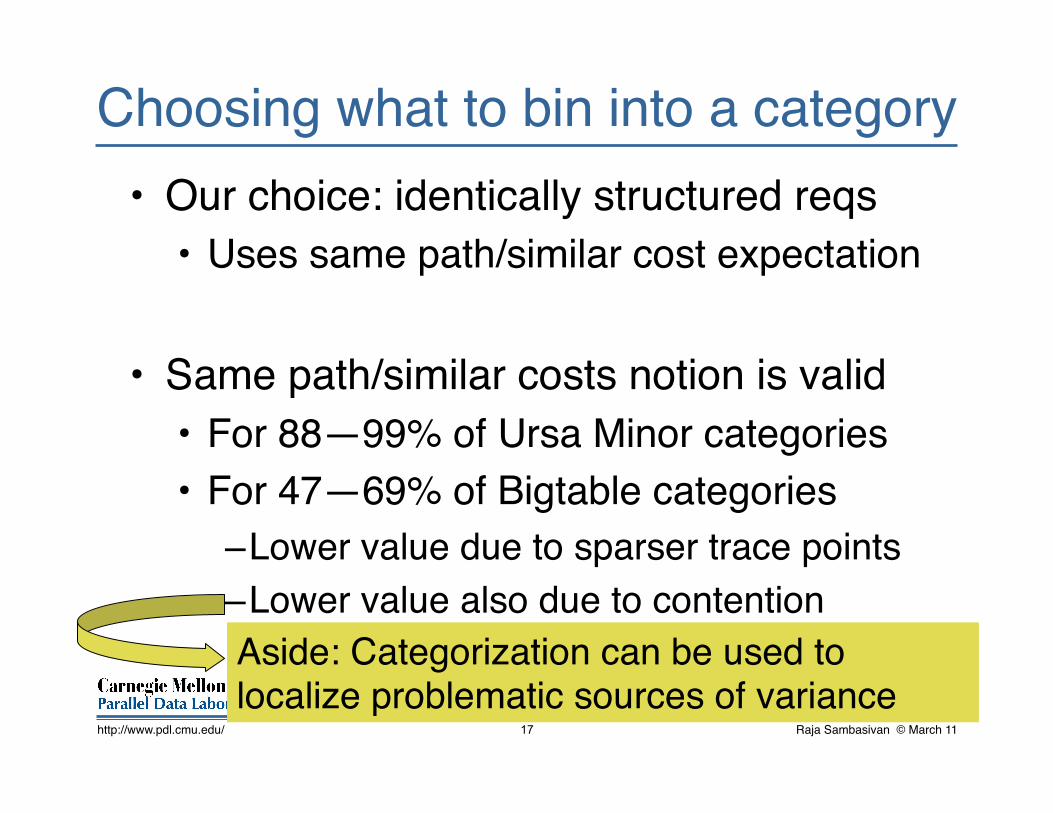
Choosing what to bin into a category!• Our choice: identically structured reqs!
• Uses same path/similar cost expectation!
• Same path/similar costs notion is valid!• For 88—99% of Ursa Minor categories!• For 47—69% of Bigtable categories!
– Lower value due to sparser trace points!– Lower value also due to contention !
Raja Sambasivan © March 11!http://www.pdl.cmu.edu/ 17
Aside: Categorization can be used to localize problematic sources of variance!

Spectroscope workflow!
Raja Sambasivan © March 11!http://www.pdl.cmu.edu/ 18
Non-problem period graphs!
Problem period graphs!
Categorization!
Response-time mutation identification!
Structural mutation identification!
Ranking!
UI layer!

Type 1: Response-time mutations!• Requests that:!
• are structurally identical in both periods!• have larger problem period latencies!
• Root cause localized by… !• identifying interactions responsible !
Raja Sambasivan © March 11!http://www.pdl.cmu.edu/ 19

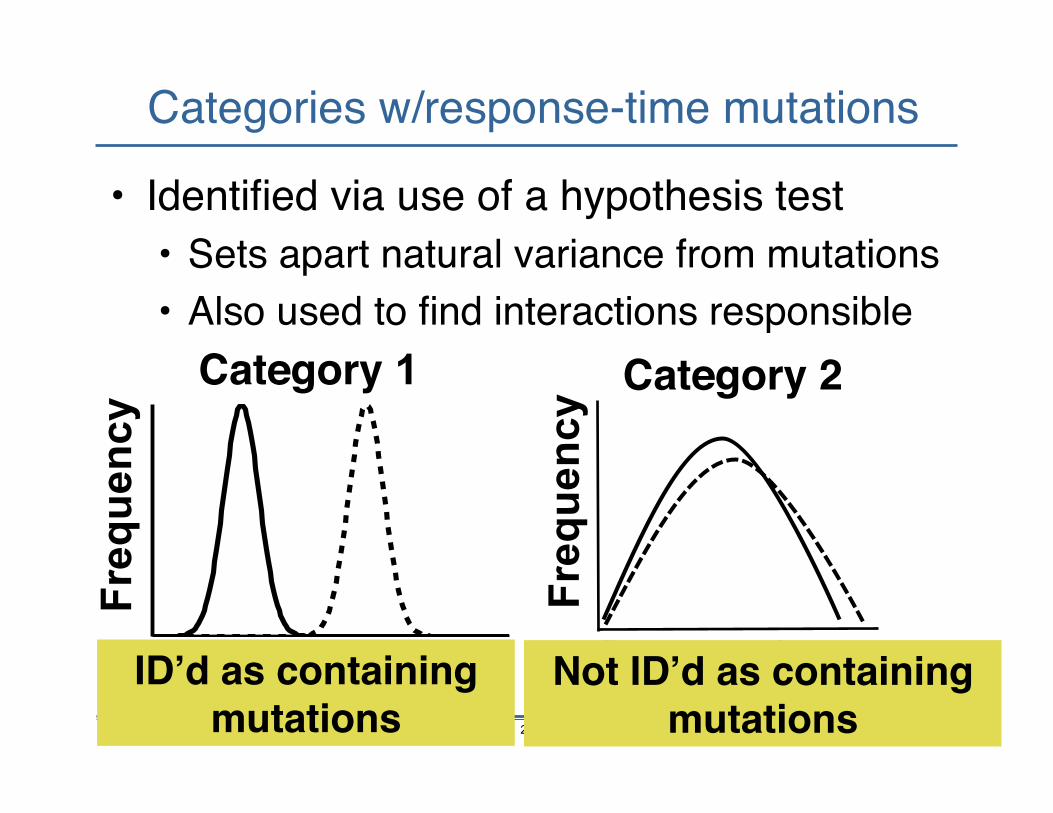
Categories w/response-time mutations!
• Identified via use of a hypothesis test!• Sets apart natural variance from mutations!• Also used to find interactions responsible!
!
Raja Sambasivan © March 11!http://www.pdl.cmu.edu/ 20
Category 1
Response-time
Freq
uenc
y
Category 2!
Freq
uenc
y
Response-time
Categories w/response-time mutations!
• Identified via use of a hypothesis test!• Sets apart natural variance from mutations!• Also used to find interactions responsible!
!
Raja Sambasivan © March 11!http://www.pdl.cmu.edu/ 21
Category 1
Response-time
Freq
uenc
y
Category 2!
Freq
uenc
y
Response-time IDʼd as containing mutations!
Not IDʼd as containing mutations!

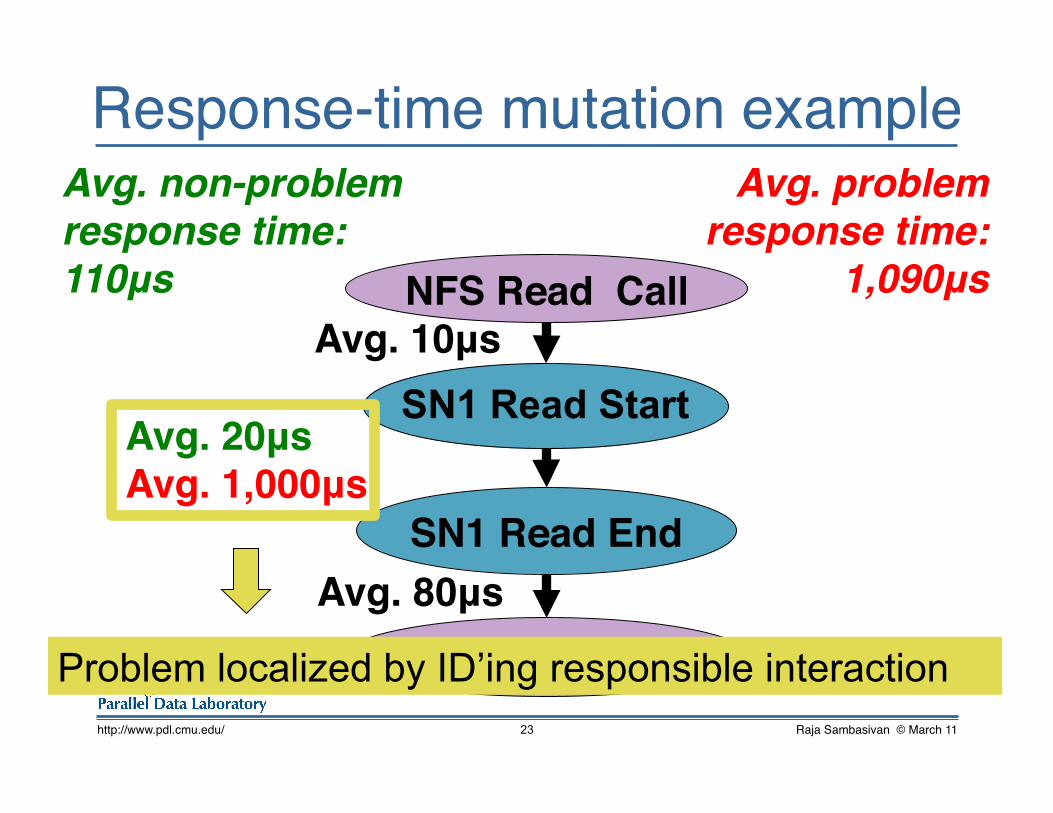
Response-time mutation example!
Raja Sambasivan © March 11!http://www.pdl.cmu.edu/ 22
Avg. problem response time:!
1,090μs!
Avg. non-problem response time:!110μs!
Avg. 10μs!!
Avg. 20μs!Avg. 1,000μs !!
Avg. 80μs!!
NFS Read Call!
SN1 Read Start
SN1 Read End!
NFS Read Reply!
Response-time mutation example!
Raja Sambasivan © March 11!http://www.pdl.cmu.edu/ 23
Avg. problem response time:!
1,090μs!
Avg. non-problem response time:!110μs!
Avg. 10μs!!
Avg. 20μs!Avg. 1,000μs !!
Avg. 80μs!!
NFS Read Call!
SN1 Read Start
SN1 Read End!
NFS Read Reply!Problem localized by ID’ing responsible interaction

Type 2: Structural mutations!• Requests that:!
• take different paths in the problem period!
• Root caused localized by…!• identifying their precursors!
– Likely path during the non-problem period!• idʼing how mutation & precursor differ!
Raja Sambasivan © March 11!http://www.pdl.cmu.edu/ 24
IDʼing categories w/structural mutations!• Assume similar workloads executed!
• Categories with more problem period requests contain mutations!
• Reverse true for precursor categories!
• Threshold used to differentiate natural variance from categories w/mutations!
Raja Sambasivan © March 11!http://www.pdl.cmu.edu/ 25
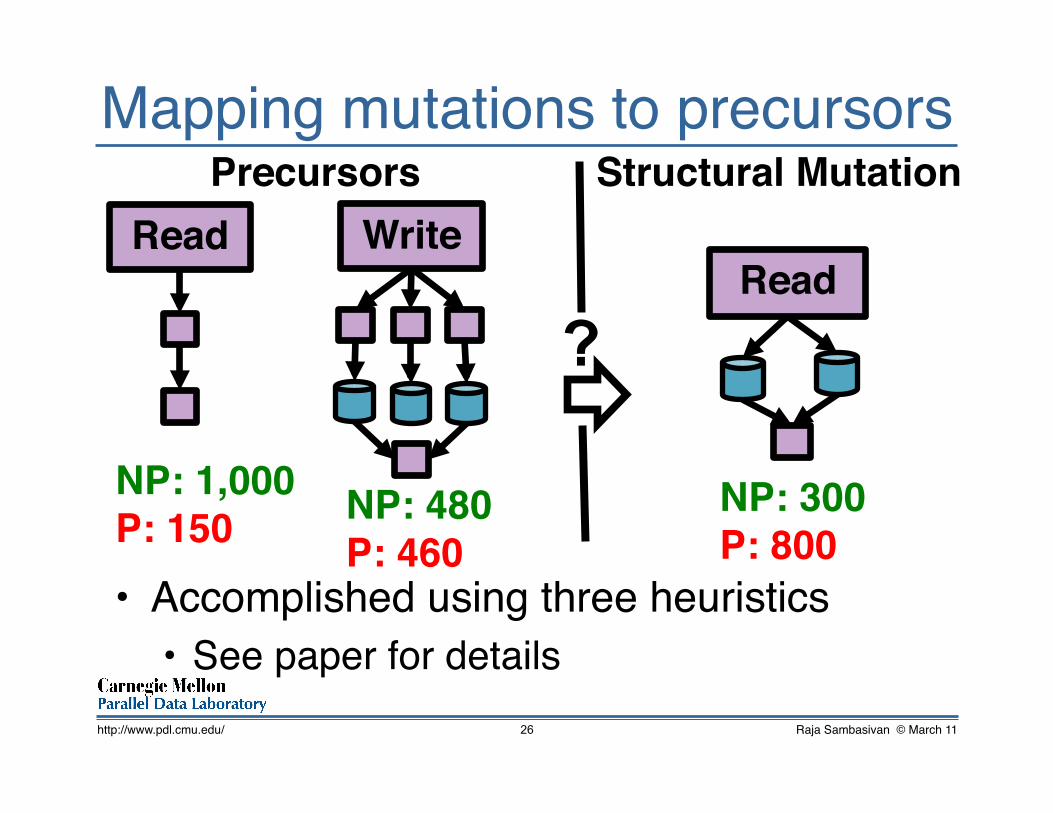
Mapping mutations to precursors!
• Accomplished using three heuristics!• See paper for details!!!
Raja Sambasivan © March 11!http://www.pdl.cmu.edu/ 26
NP: 300!P: 800!
Structural Mutation!
Read!
?
Precursors!Read!
NP: 1,000!P: 150! NP: 480!
P: 460!
Write!
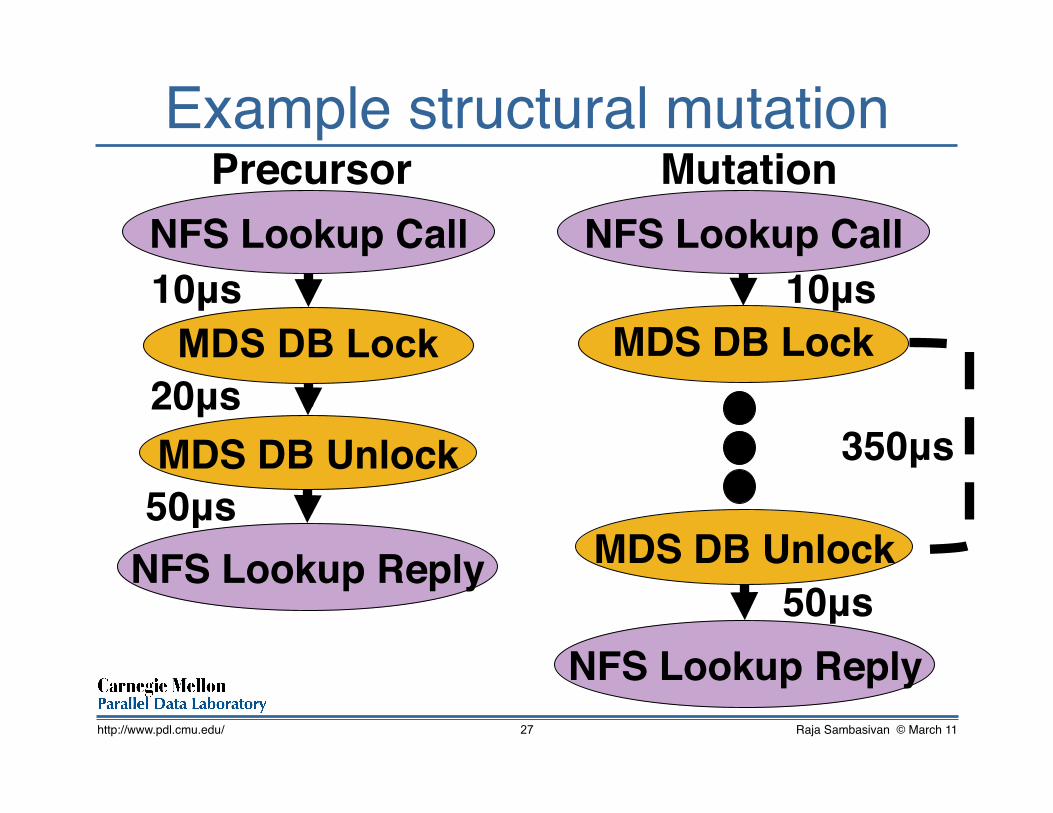
Example structural mutation!
Raja Sambasivan © March 11!http://www.pdl.cmu.edu/ 27
Precursor!
10μs!!20μs!!50μs!!
NFS Lookup Call!
MDS DB Lock
MDS DB Unlock!
NFS Lookup Reply!
10μs!!
50μs!!
Mutation!NFS Lookup Call!
MDS DB Lock!
MDS DB Unlock!
NFS Lookup Reply!
350μs!
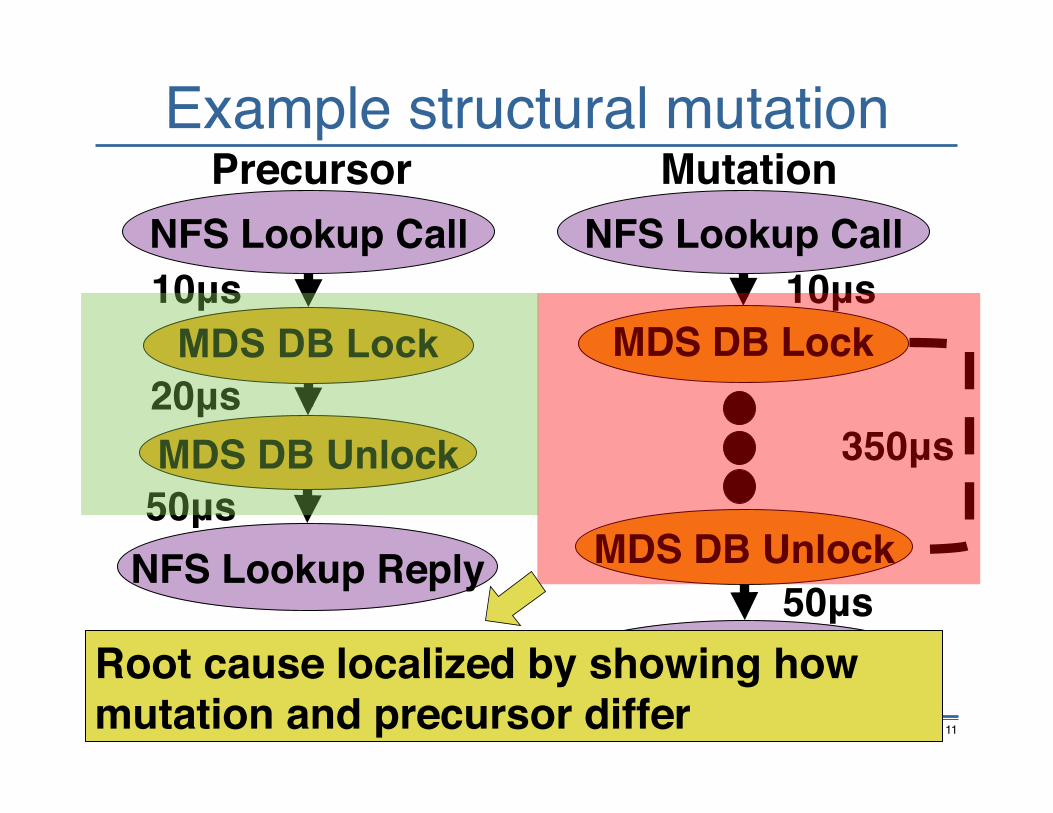
Example structural mutation!
Raja Sambasivan © March 11!http://www.pdl.cmu.edu/ 28
Precursor!
10μs!!20μs!!50μs!!
NFS Lookup Call!
MDS DB Lock
MDS DB Unlock!
NFS Lookup Reply!
10μs!!
50μs!!
Mutation!NFS Lookup Call!
MDS DB Lock!
MDS DB Unlock!
NFS Lookup Reply!
350μs!
Root cause localized by showing how mutation and precursor differ!

Ranking of categories w/mutations!• Necessary for two reasons!
• There may be more than one problem!• One problem may yield many mutations!
• Rank based on:!• # of reqs affected * Δ in response time!
!
Raja Sambasivan © March 11!http://www.pdl.cmu.edu/ 29
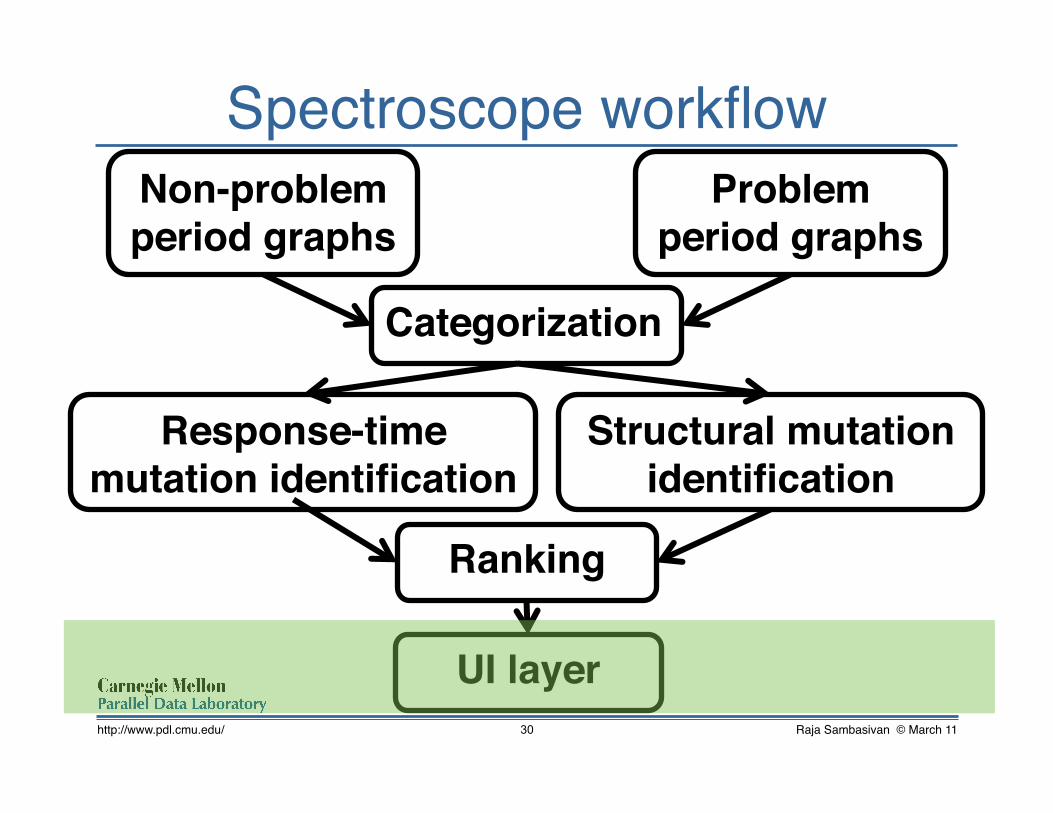
Spectroscope workflow!
Raja Sambasivan © March 11!http://www.pdl.cmu.edu/ 30
Non-problem period graphs!
Problem period graphs!
Categorization!
Response-time mutation identification!
Structural mutation identification!
Ranking!
UI layer!
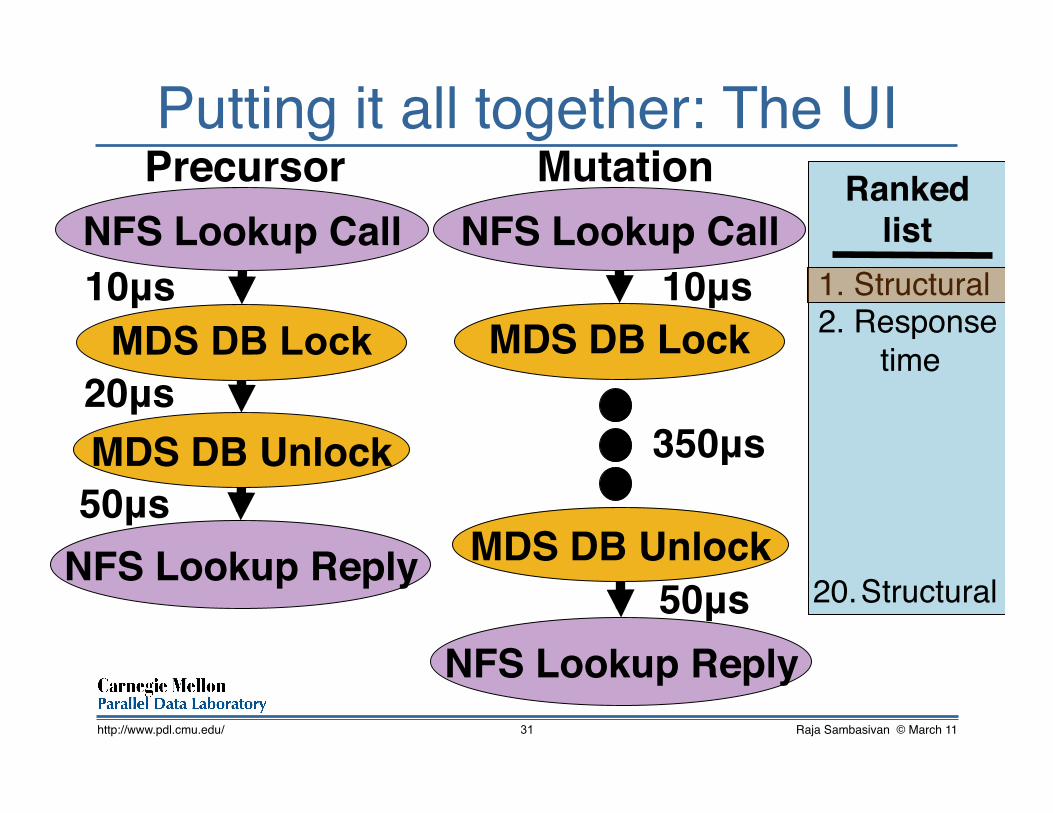
Putting it all together: The UI!
Raja Sambasivan © March 11!http://www.pdl.cmu.edu/ 31
Ranked list !
!1. Structural!2. Response ! time!
20. Structural!
Precursor!
10μs!!20μs!!50μs!!
NFS Lookup Call!
MDS DB Lock
MDS DB Unlock!
NFS Lookup Reply!
10μs!!
50μs!!
Mutation!NFS Lookup Call!
MDS DB Lock!
MDS DB Unlock!
NFS Lookup Reply!
350μs!
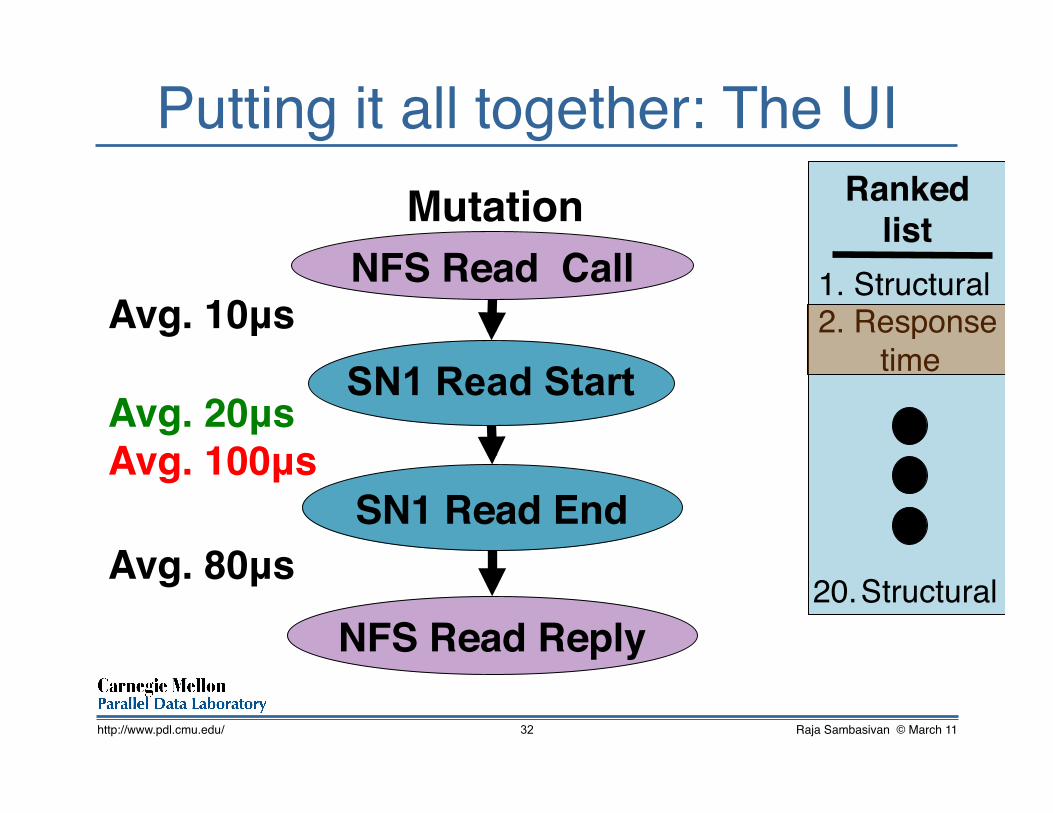
Putting it all together: The UI!
Raja Sambasivan © March 11!http://www.pdl.cmu.edu/ 32
Ranked list !
!1. Structural!2. Response ! time!
20. Structural!
Mutation!
Avg. 10μs!!Avg. 20μs!Avg. 100μs !!Avg. 80μs!!
NFS Read Call!
SN1 Read Start
SN1 Read End!
NFS Read Reply!

Outline!• Introduction!• End-to-end tracing & Spectroscope!• Ursa Minor & Google case studies!• Summary!
Raja Sambasivan © March 11!http://www.pdl.cmu.edu/ 33
Ursa Minor case studies!• Used Spectroscope to diagnose real
performance problems in Ursa Minor!• Four were previously unsolved!
• Evaluated ranked list by measuring!• % of top 10 results that were relevant!• % of total results that were relevant!
Raja Sambasivan © March 11!http://www.pdl.cmu.edu/ 34
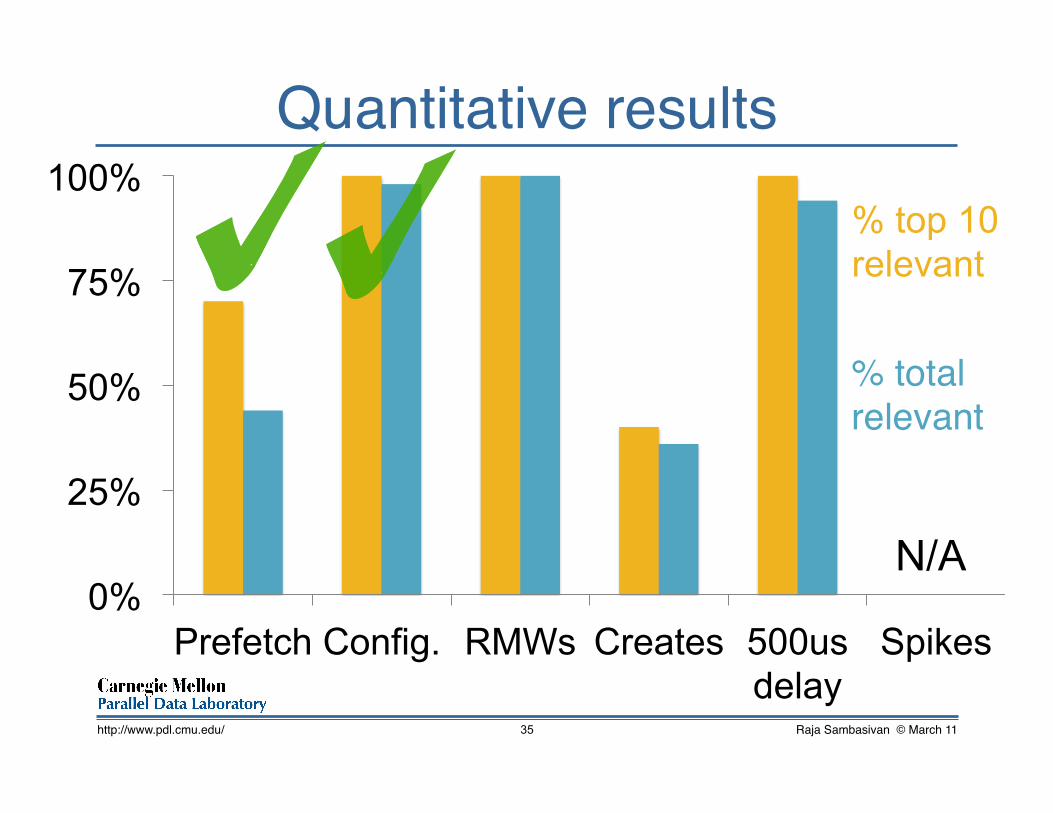
0%
25%
50%
75%
100%
Prefetch Config. RMWs Creates 500us delay
Spikes
% total !relevant!
Quantitative results!
Raja Sambasivan © March 11!http://www.pdl.cmu.edu/ 35
N/A
% top 10 relevant
Raja Sambasivan © March 11!http://www.pdl.cmu.edu/ 36
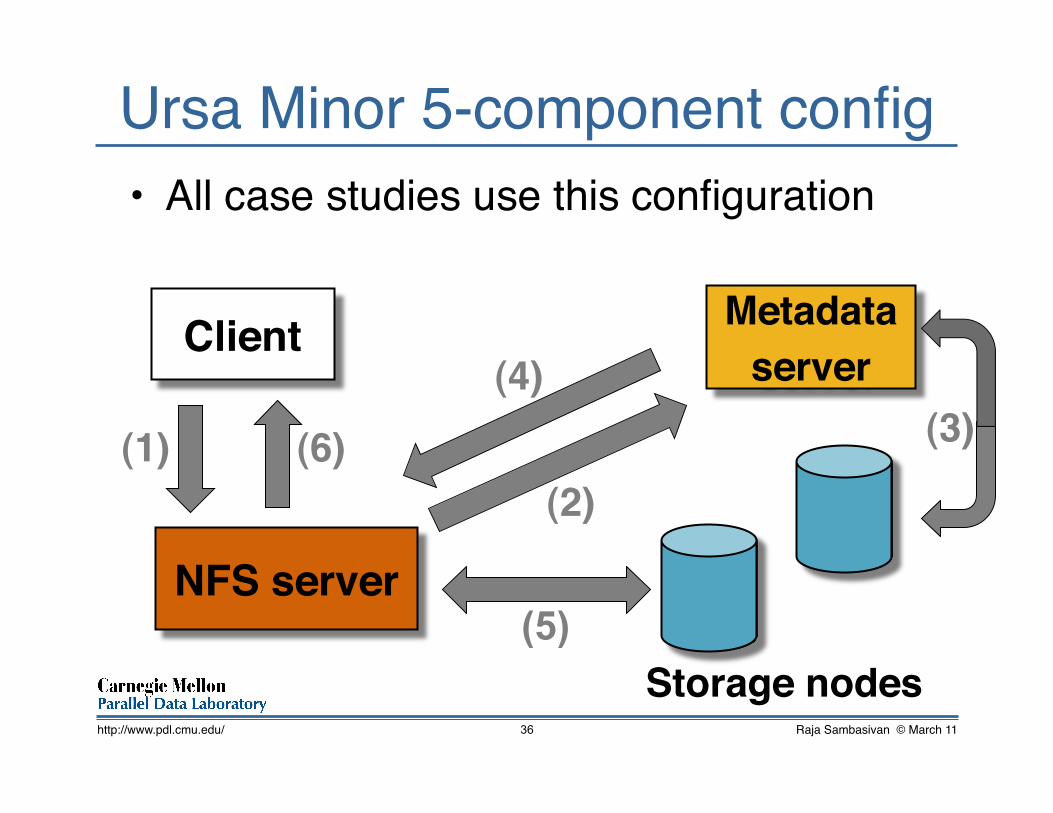
Ursa Minor 5-component config!
Client!
Storage nodes!
NFS server!
Metadata!server!
(1)!(2)!
(3)!(4)!
(5)
(6)!
• All case studies use this configuration!
Case 1: MDS configuration problem!• Problem: Slowdown in key benchmarks
seen after large code merge!
Raja Sambasivan © March 11!http://www.pdl.cmu.edu/ 37
Comparing request flows!• Identified 128 mutation categories:!
• Most contained structural mutations!• Mutations and precursors differed only
in the storage node accessed!
• Localized bug to unexpected interaction between MDS & the data storage node!• But, unclear why this was happening!
!
Raja Sambasivan © March 11!http://www.pdl.cmu.edu/ 38
Further localization!• Thought mutations may be caused by
changes in low-level parameters!• E.g., function call parameters, etc.!
• Identified parameters that separated 1st-ranked mutation from its precursors!• Showed changes in encoding params!• Localized root cause to two config files !
Raja Sambasivan © March 11!http://www.pdl.cmu.edu/ 39
Root cause: Change to an obscure config file

Inter-cluster perf. at Google !• Load tests run on same software in two
datacenters yielded very different perf.!• Developers said perf. should be similar!
Raja Sambasivan © March 11!http://www.pdl.cmu.edu/ 40

Comparing request flows!• Revealed many mutations!
• High-ranked ones were response-time!
• Responsible interactions found both within the service and in dependencies!• Led us to suspect root cause was issue
with the slower load testʼs datacenter !
Raja Sambasivan © March 11!http://www.pdl.cmu.edu/ 41
Root cause: Shared Bigtable in slower load test’s datacenter was not working properly
Summary!• Introduced request-flow comparison as
a new way to diagnose perf. changes!
• Presented algorithms for localizing problems by identifying mutations!
• Showed utility of our approach by using it to diagnose real, unsolved problems!
Raja Sambasivan © March 11!http://www.pdl.cmu.edu/ 42
Related work (I)![Abd-El-Malek05b]: Ursa Minor: versatile cluster-based storage.
Michael Abd-El-Malek, William V. Courtright II, Chuck Cranor, Gregory R. Ganger, James Hendricks, Andrew J. Klosterman, Michael Mesnier, Manish Prasad, Brandon Salmon, Raja R. Sambasivan, Shafeeq Sinnamohideen, John D. Strunk, Eno Thereska, Matthew Wachs, Jay J. Wylie. FAST, 2005.!
![Barham04]: Using Magpie for request extraction and workload
modelling. Paul Barham, Austin Donnelly, Rebecca Isaacs, Richard Mortier. OSDI, 2004.!
![Chen04]: Path-based failure and evolution management. Mike
Y. Chen, Anthony Accardi, Emre Kiciman, Jim Lloyd, Dave Patterson, Armando Fox, Eric Brewer. NSDI, 2004.!
!!!!
Raja Sambasivan © March 11!http://www.pdl.cmu.edu/ 43
Related work (II)![Cohen05]: Capturing, indexing, and retrieving system history.
Ira Cohen, Steve Zhang, Moises Goldszmidt, Terrence Kelly, Armando Fox. SOSP, 2005.!
![Fonseca07]: X-Trace: A Pervasive Network Tracing
Framework. Rodrigo Fonseca, George Porter, Randy H. Katz, Scott Shenker, Ion Stoica. NSDI, 2007.!
![Hendricks06]: Improving small file performance in object-
based storage. James Hendricks, Raja R. Sambasivan, Shafeeq Sinnamohideen, Gregory R. Ganger. Technical Report CMU-PDL-06-104, 2006.!
!!!!!
Raja Sambasivan © March 11!http://www.pdl.cmu.edu/ 44

Related work (III)![Reynolds06]: Detecting the unexpected in distributed systems.
Patrick Reynolds, Charles Killian, Janet L. Wiener, Jeffrey C. Mogul, Mehul A. Shah, Amin Vahdat. NSDI, 2006.!
![Sambasivan07]: Categorizing and differencing system
behaviours. Raja R. Sambasivan, Alice X. Zheng, Eno Thereska. HotAC II, 2007.!
![Sambasivan10]: Diagnosing performance problems by
visualizing and comparing system behaviours. Raja R. Sambasivan, Alice X. Zheng, Elie Krevat, Spencer Whitman, Michael Stroucken, William Wang, Lianghong Xu, Gregory R. Ganger. CMU-PDL-10-103. !
Raja Sambasivan © March 11!http://www.pdl.cmu.edu/ 45

Raja Sambasivan © March 11!http://www.pdl.cmu.edu/ 46
Related work (IV)![Sambasivan11]: Automation without predictability is a recipe
for failure. Raja R. Sambasivan and Gregory R. Ganger. Technical Report CMU-PDL-11-101, 2011.!
![Sigelman10]: Dapper, a large-scale distributed tracing
infrastructure. Benjamin H. Sigelman, Luiz Andre ́ Barroso, Mike Burrows, Pat Stephenson, Manoj Plakal, Donald Beaver, Saul Jaspan, Chandan Shanbhag. Technical report 2010-1, 2008.!
![Thereska06b]: Stardust: tracking activity in a distributed
storage system. Eno Thereska, Brandon Salmon, John Strunk, Matthew Wachs, Michael Abd-El-Malek, Julio Lopez, Gregory R. Ganger. SIGMETRICS, 2006.!
!!