Toward More Sustainable Infrastructure Part II Comparing ... · PDF filecan convert any...
46
Toward More Sustainable Infrastructure Part II Comparing Economic and Financial Impacts Over the Life of Proposed Projects Engineering Economics and Project Evaluation
Transcript of Toward More Sustainable Infrastructure Part II Comparing ... · PDF filecan convert any...
Toward More Sustainable Infrastructure
Part II
Comparing Economic and Financial Impacts Over the Life of Proposed Projects
Engineering Economics and Project Evaluation
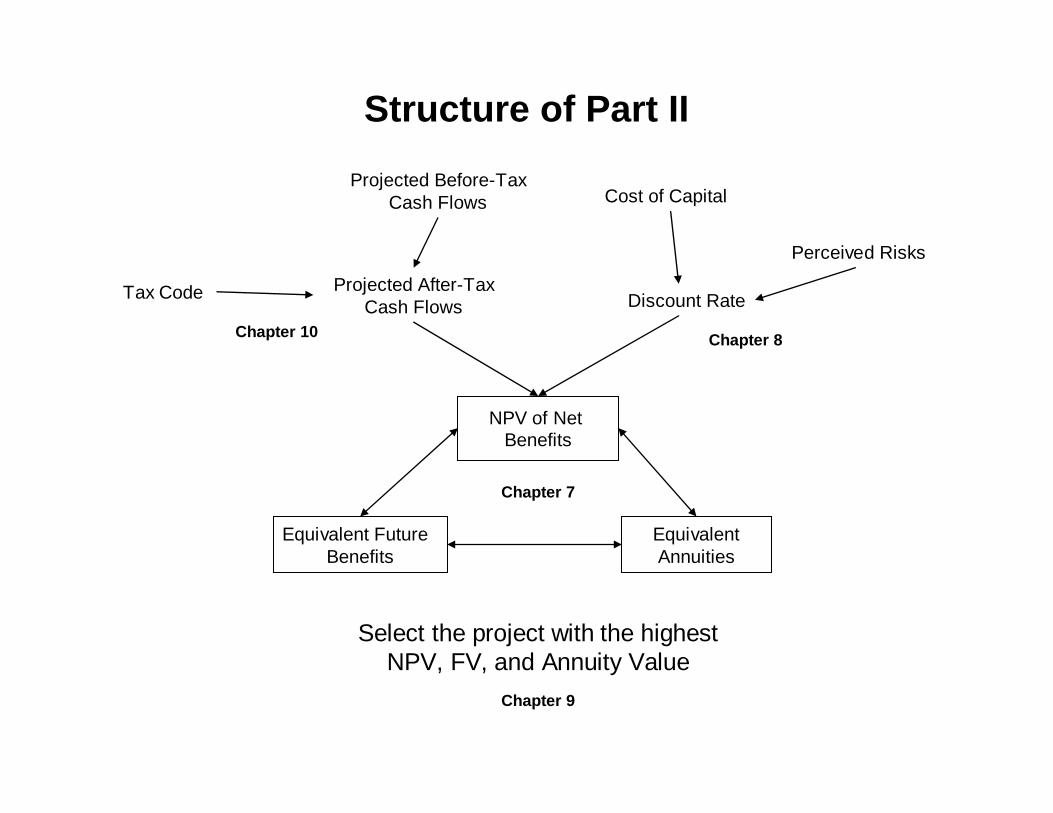
Structure of Part II
Projected Before-Tax Cash Flows Cost of Capital
Perceived Risks
Projected After-Tax Tax Code Cash Flows Discount Rate
Chapter 10 Chapter 8
NPV of Net Benefits
Equivalent Future Benefits
Equivalent Annuities
Chapter 7
Select the project with the highestNPV, FV, and Annuity Value
Chapter 9
Toward More Sustainable Infrastructure: Chapter 7
Equivalence of Cash Flows
• Time Value of Money • Equivalence of Cash Flows • Equivalence Relationships • Equivalence & Financing • Equivalence & Costing

The Concept of Equivalence
“Economic equivalence is established, in general, when we are indifferent between a future payment, or a series
of future payments, and a present sum of money”.
W.G. Sullivan, E.M. Wicks, and J.T. Luxhoj, Engineering Economy, 12th ed., Prentice Hall, 2003 p. 76
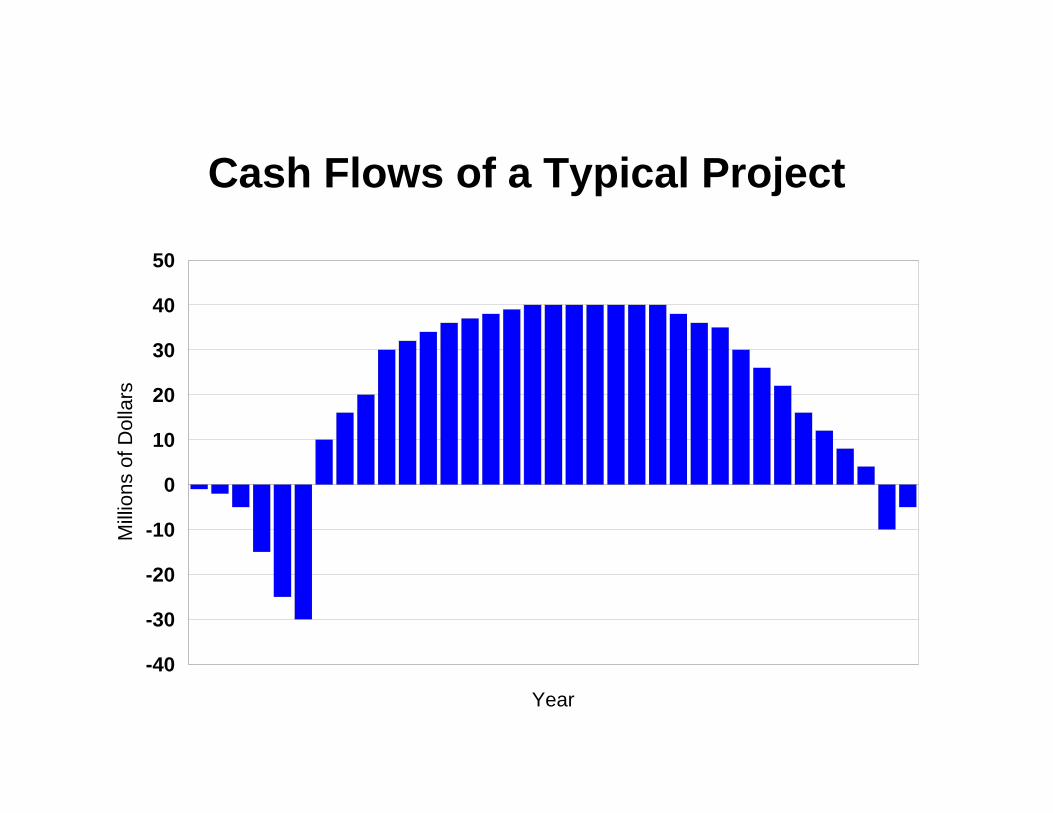
Cash Flows of a Typical Project
-40
-30
-20
-10
0
10
20
30
40
50
Mill
ions
of D
olla
rs
Year
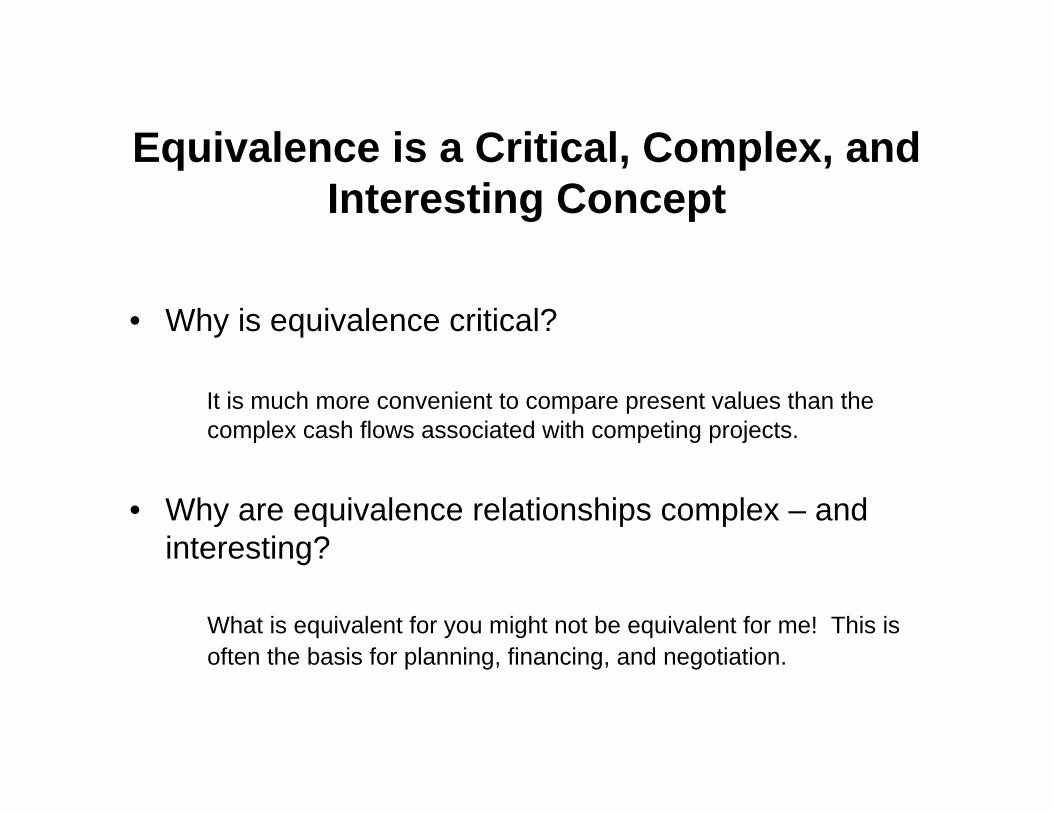
Equivalence is a Critical, Complex, and Interesting Concept
• Why is equivalence critical?
It is much more convenient to compare present values than the complex cash flows associated with competing projects.
• Why are equivalence relationships complex – and interesting?
What is equivalent for you might not be equivalent for me! This is often the basis for planning, financing, and negotiation.
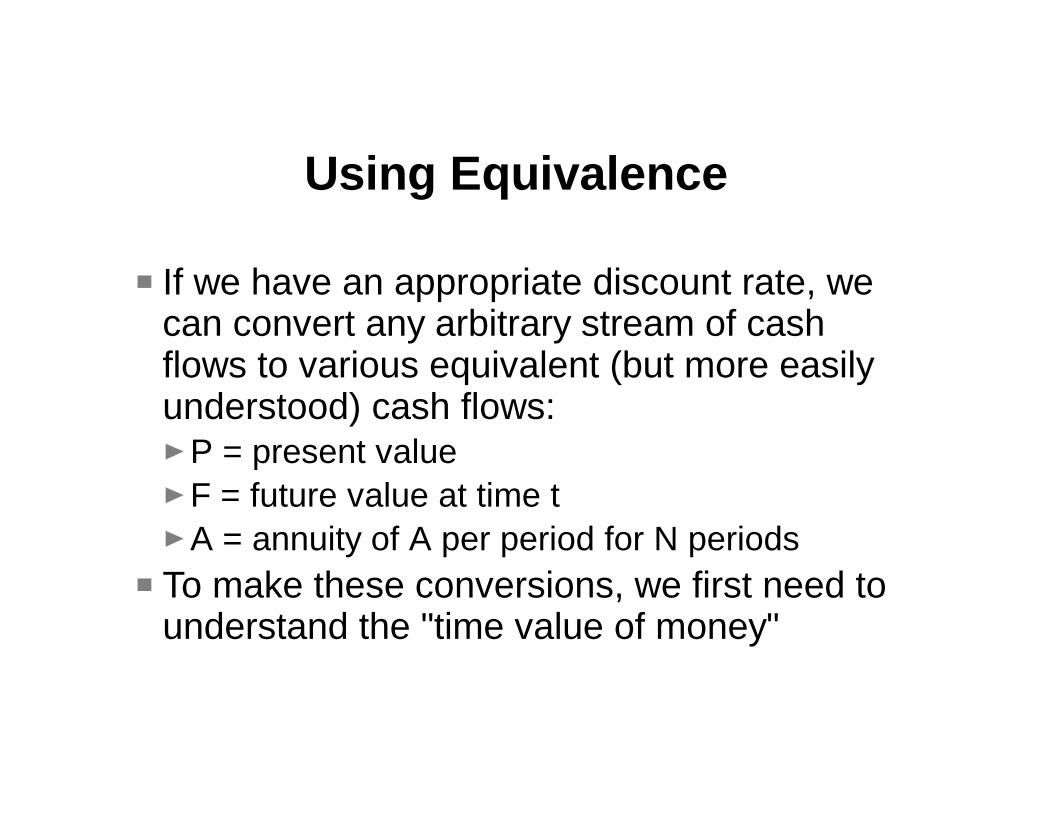
Using Equivalence
If we have an appropriate discount rate, we can convert any arbitrary stream of cash flows to various equivalent (but more easily understood) cash flows:
P = present value F = future value at time t A = annuity of A per period for N periods
To make these conversions, we first need to understand the "time value of money"
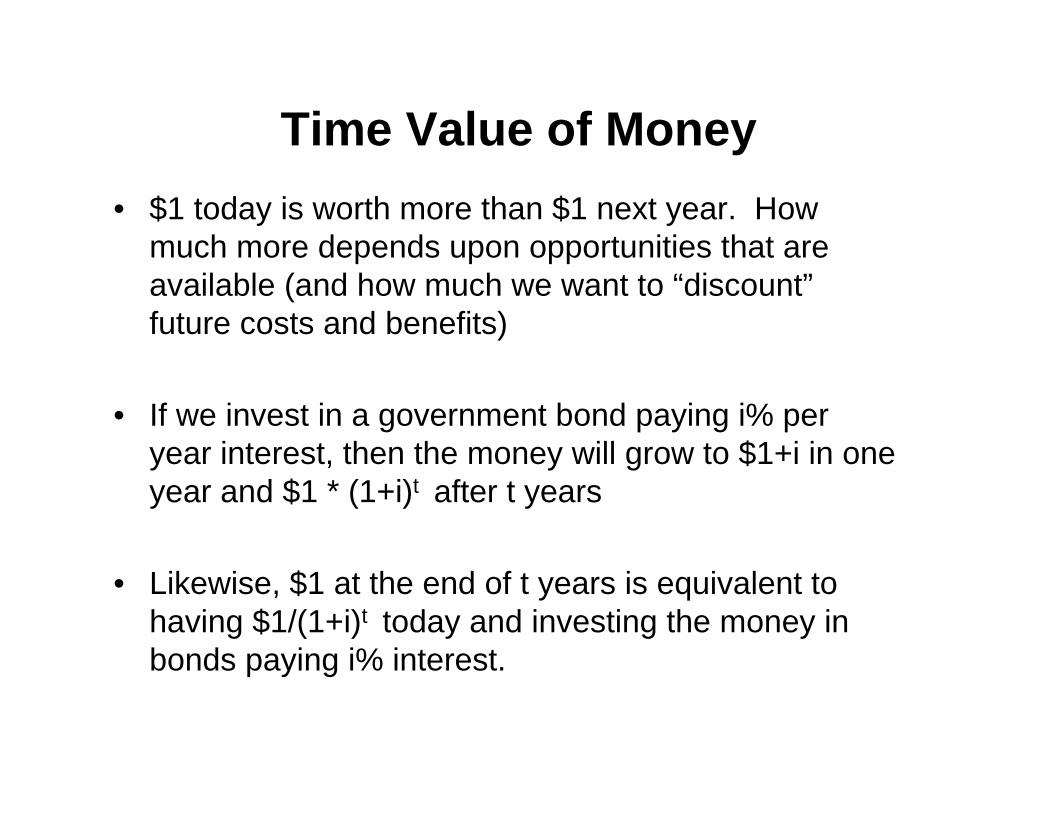
Time Value of Money • $1 today is worth more than $1 next year. How
much more depends upon opportunities that are available (and how much we want to “discount” future costs and benefits)
• If we invest in a government bond paying i% per year interest, then the money will grow to $1+i in one year and $1 * (1+i)t after t years
• Likewise, $1 at the end of t years is equivalent to having $1/(1+i)t today and investing the money in bonds paying i% interest.

Net Present Value (NPV) The NPV (or “present worth”) is an estimate of the
present value of future costs and benefits:
Given: C(t) = Costs during period t B(t) = Benefits during period t Net benefits during period t = B(t) – C(t) Discount Rate = i
Then NPV(t) = (B(t) – C(t))/(1 + i)t after t years
NPV(project) = Σ((B(t) – C(t))/(1 + i)t)
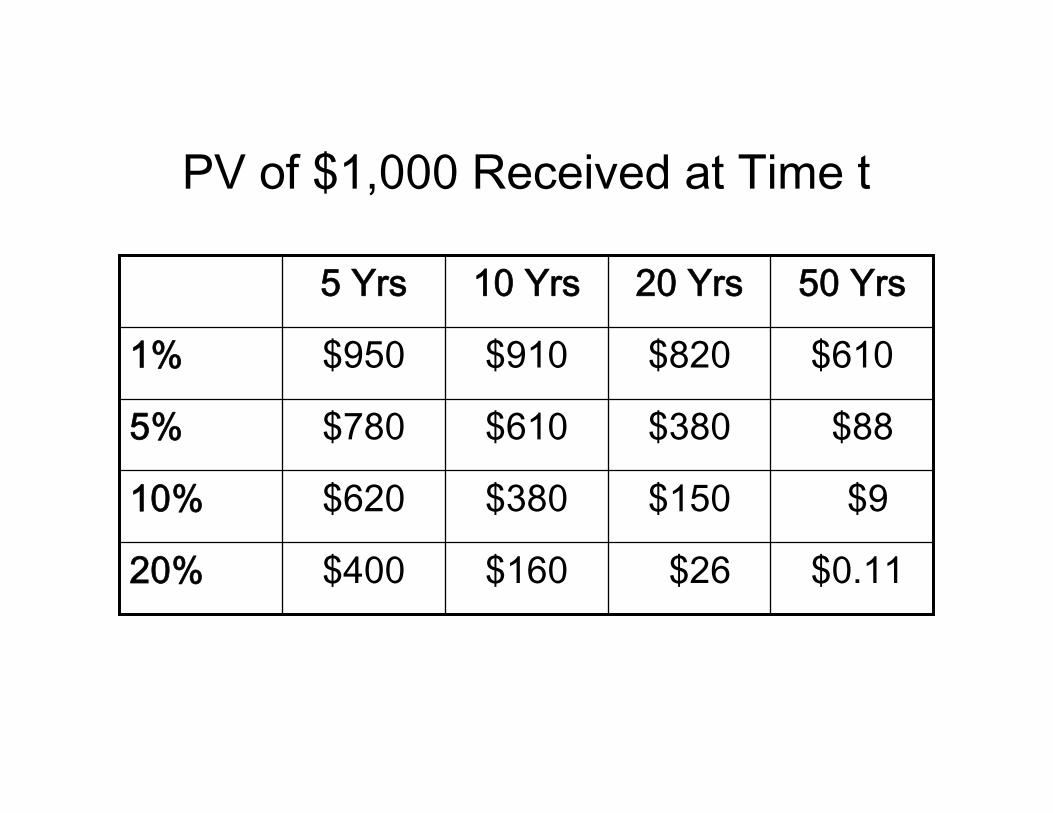
PV of $1,000 Received at Time t
5 Yrs 10 Yrs 20 Yrs 50 Yrs
1% $950 $910 $820 $610
5% $780 $610 $380 $88
10% $620 $380 $150 $9
20% $400 $160 $26 $0.11

Equivalence of Cash Flows
Typical Cash Flows for a CEE Project Equivalent Present Value 20 50 10 40 0 30
-10 20-20 10 -30 0
Time Time
Equivalent Annuity Equivalent Future Value 5
3004 3 200$
$
100
$ $/
Yea
r
0 Time Time
0 1 2
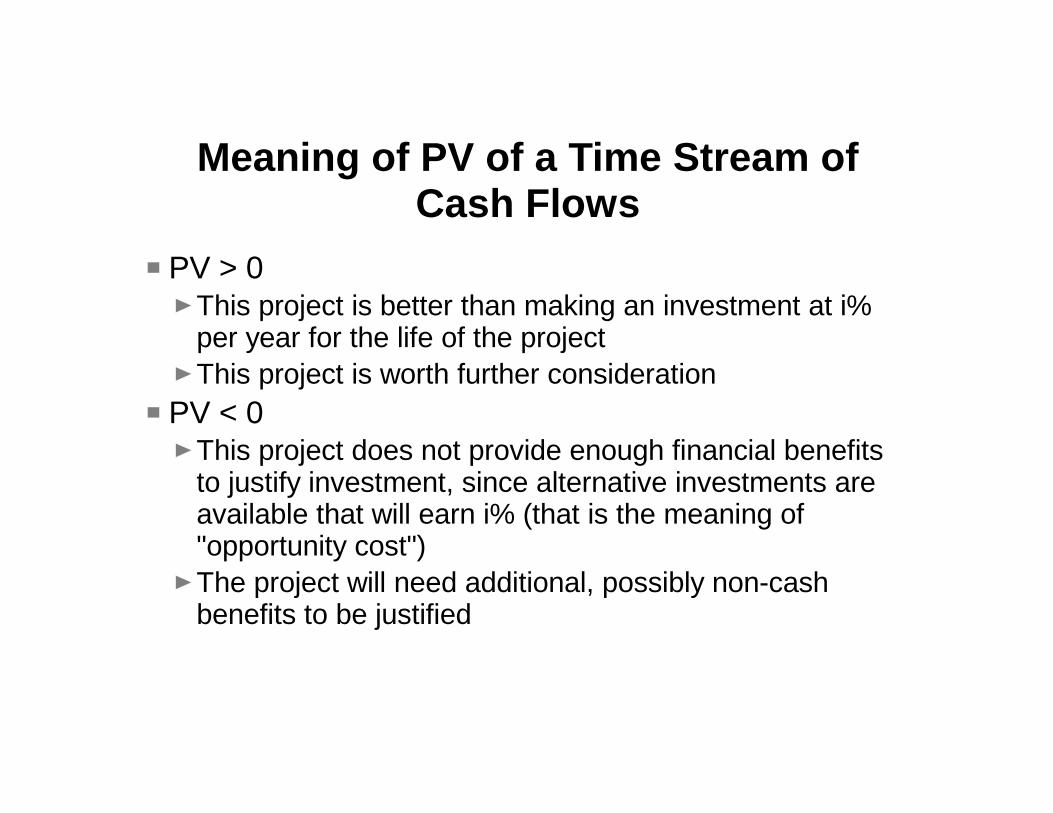
Meaning of PV of a Time Stream of Cash Flows
PV > 0 This project is better than making an investment at i% per year for the life of the project This project is worth further consideration
PV < 0 This project does not provide enough financial benefits to justify investment, since alternative investments are available that will earn i% (that is the meaning of "opportunity cost") The project will need additional, possibly non-cash benefits to be justified
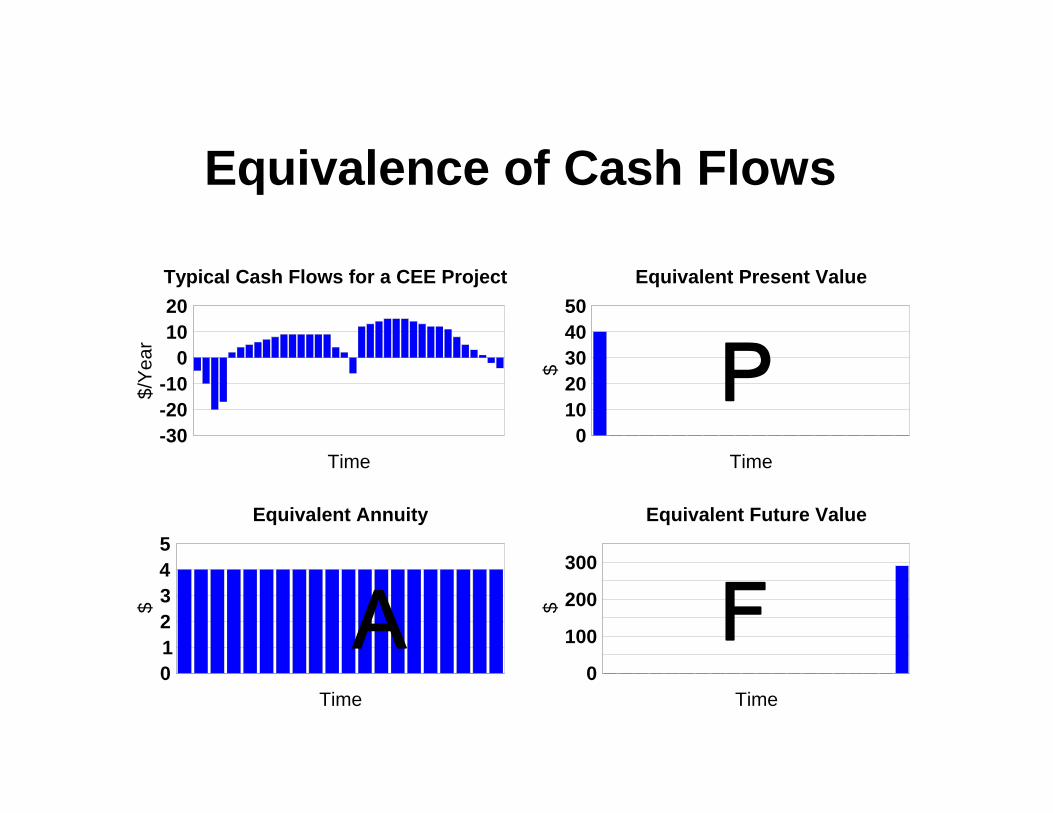
Equivalence of Cash Flows
Typical Cash Flows for a CEE Project Equivalent Present Value
-30 -20 -10
0 10 20
$/Y
ear
0 10 20 30 40 50
$ P Time Time
Equivalent Annuity Equivalent Future Value
0
100
200
300 $
0 1 2 3 4 5
$ FA Time Time
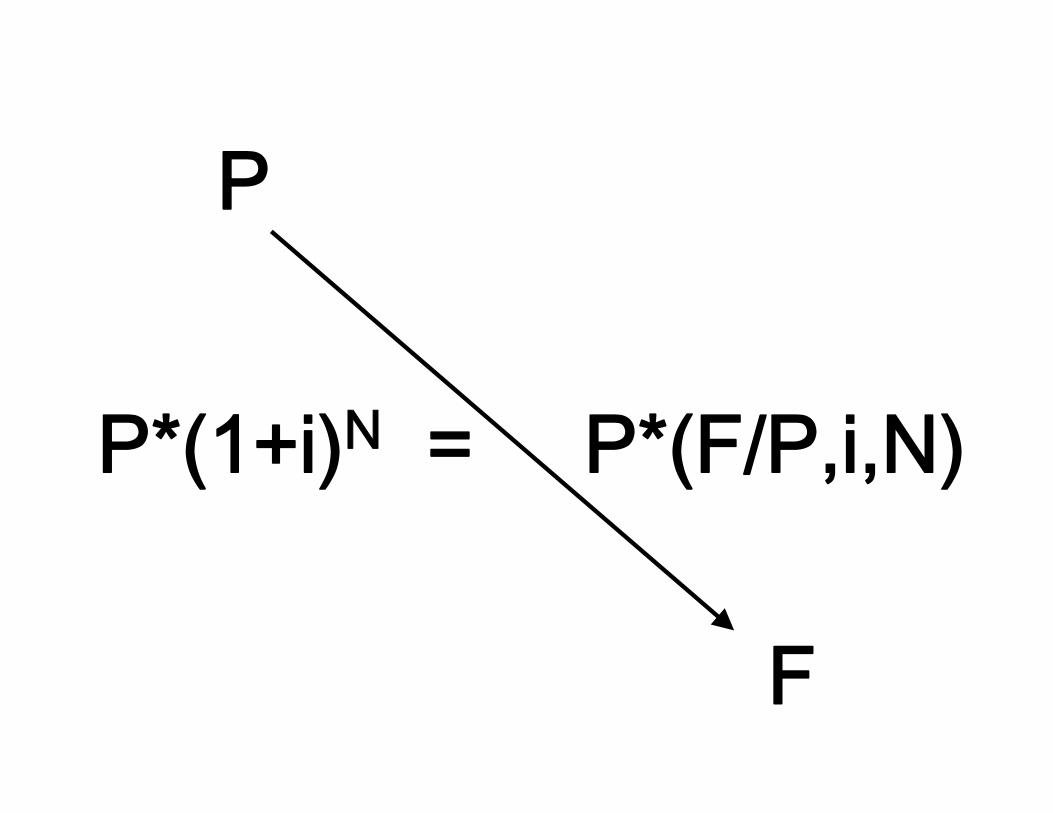
P
P*(1+i) P*(F/P,i,N)N =
F
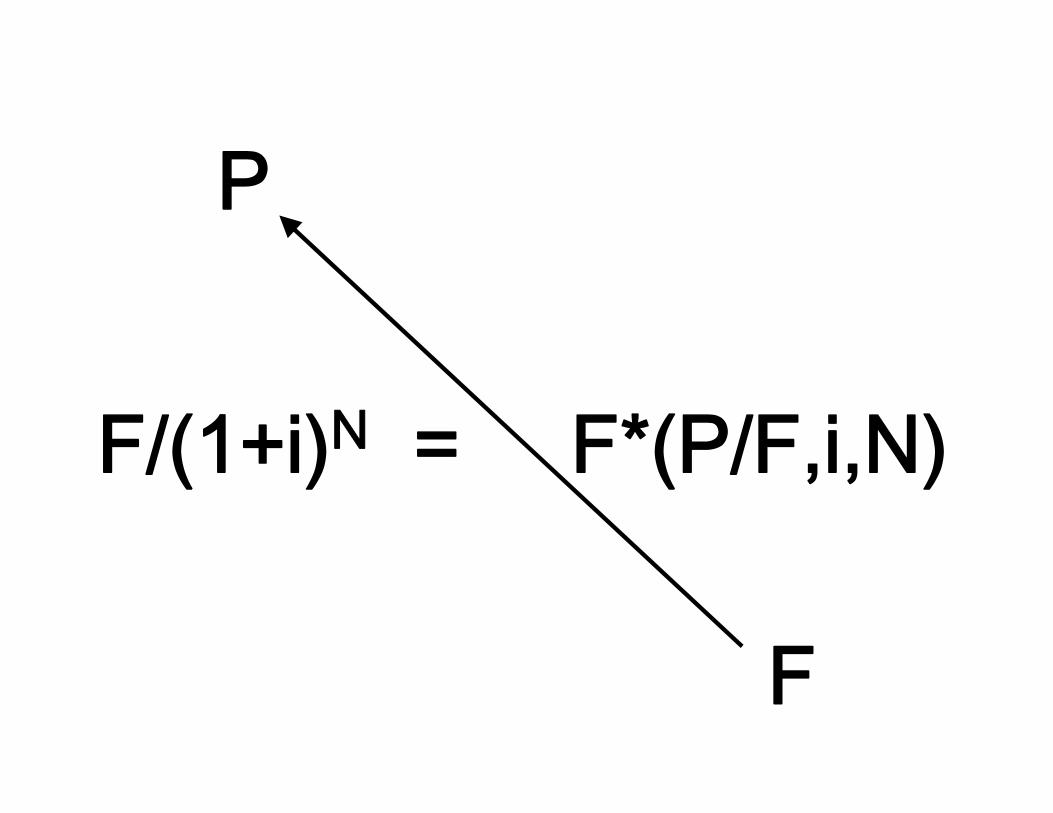
P
F/(1+i) F*(P/F,i,N)N =
F

Equivalence of Cash Flows
Typical Cash Flows for a CEE Project Equivalent Present Value
-30 -20 -10
0 10 20
$/Ye
ar
0 10 20 30 40 50
$
(F/A,i,N)Time Time
Equivalent Annuity Equivalent Future Value
The future value of an
Time 0
100
200
300 $
Time 0 1 2 3 4 5
$
F(A(t)) = A(t) * (1+i)N-t
annuity will be the sum of the future value of the individual payments
F(N) = A[(1+i)N-t + … + (1+i)N-t + …+ (1+i)0 ]
……
(F/A,i,N) = [(1+i)N-1)]/i This results in a geometric sequence with a simple sum.
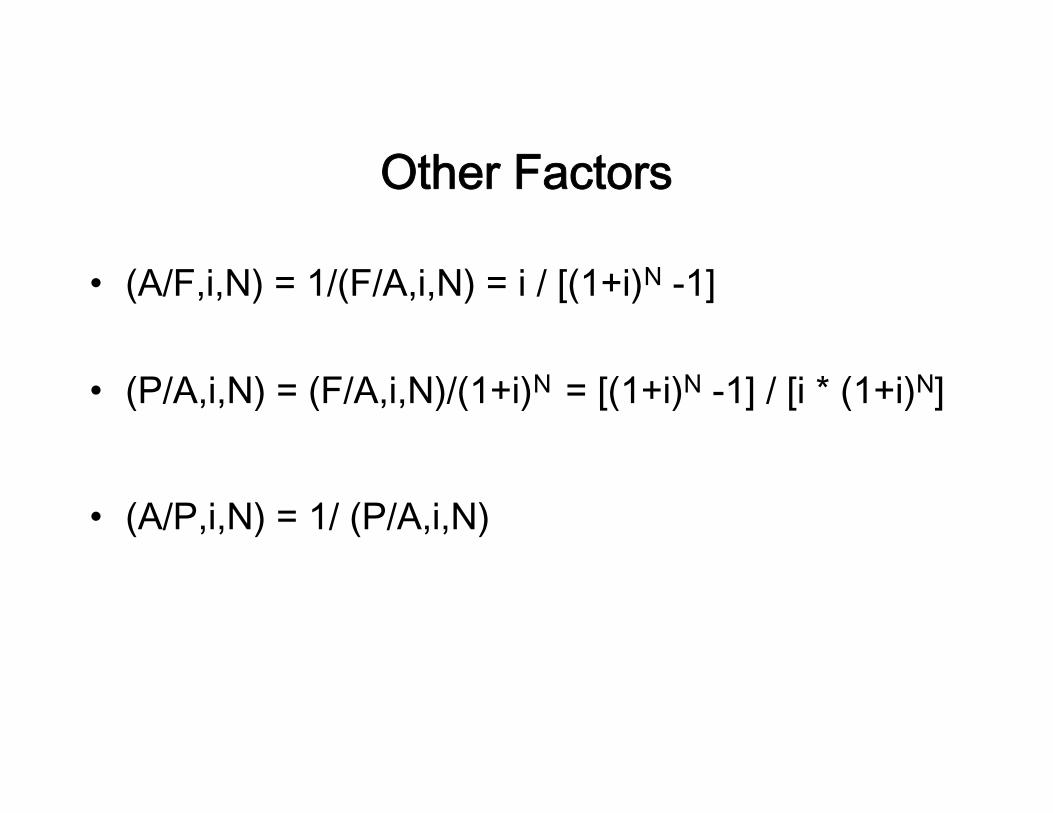
Other Factors
• (A/F,i,N) = 1/(F/A,i,N) = i / [(1+i)N -1]
• (P/A,i,N) = (F/A,i,N)/(1+i)N = [(1+i)N -1] / [i * (1+i)N]
• (A/P,i,N) = 1/ (P/A,i,N)
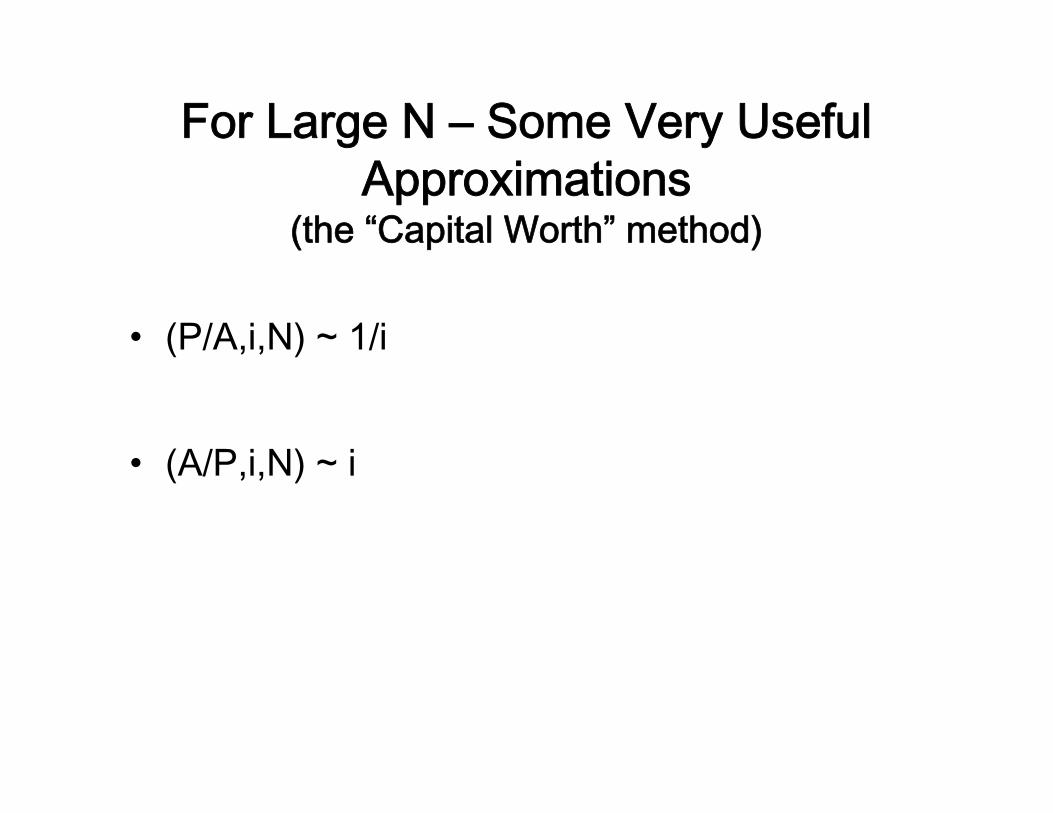
For Large N – Some Very Useful Approximations
(the “Capital Worth” method)
• (P/A,i,N) ~ 1/i
• (A/P,i,N) ~ i
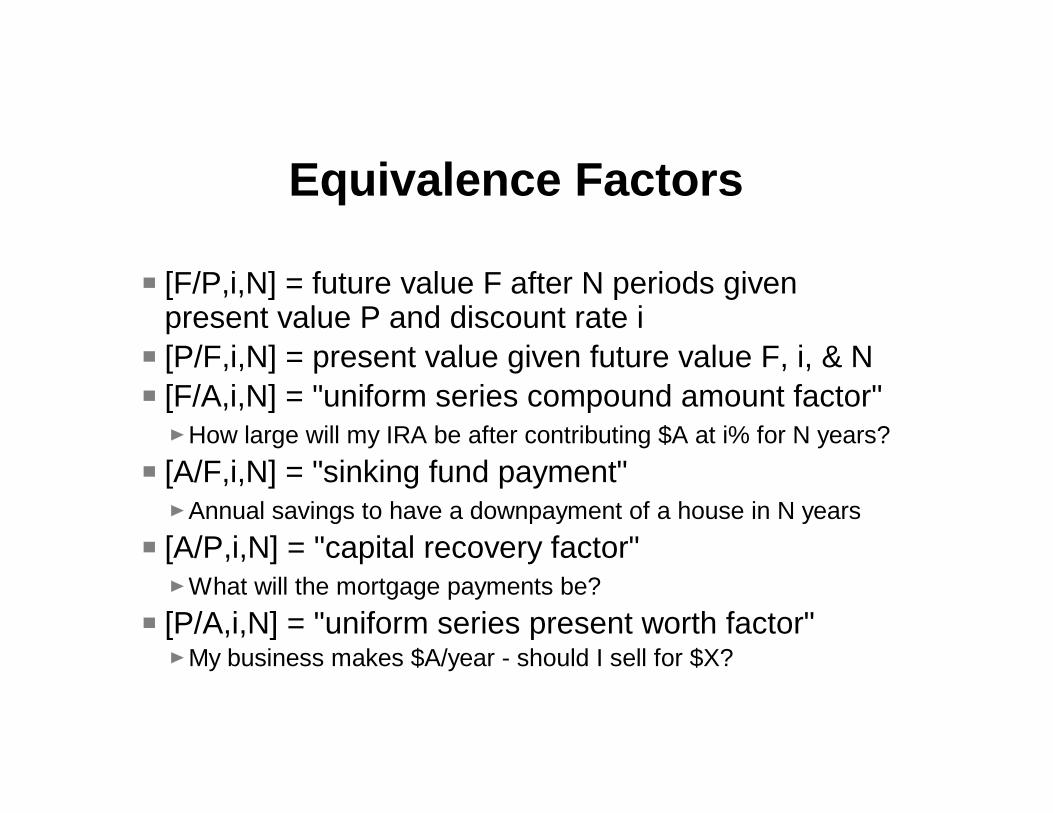
Equivalence Factors
[F/P,i,N] = future value F after N periods given present value P and discount rate i [P/F,i,N] = present value given future value F, i, & N [F/A,i,N] = "uniform series compound amount factor"
How large will my IRA be after contributing $A at i% for N years? [A/F,i,N] = "sinking fund payment"
Annual savings to have a downpayment of a house in N years [A/P,i,N] = "capital recovery factor"
What will the mortgage payments be? [P/A,i,N] = "uniform series present worth factor"
My business makes $A/year - should I sell for $X?
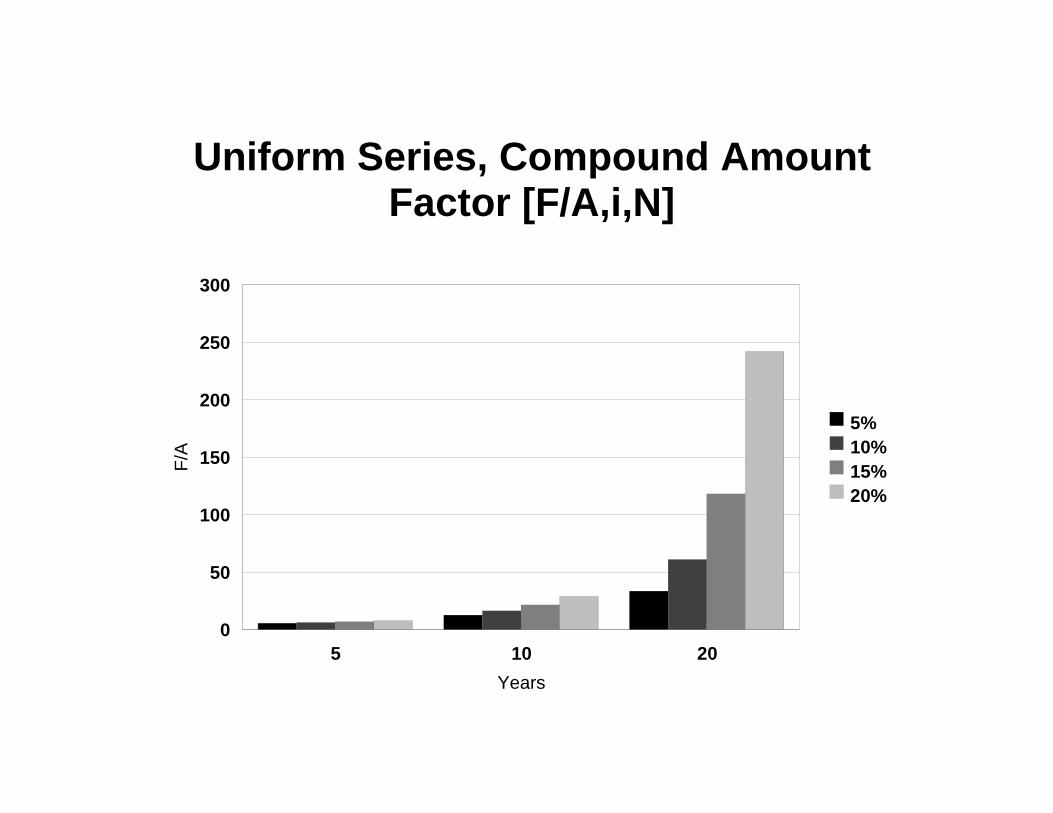
Uniform Series, Compound Amount Factor [F/A,i,N]
5 10 20
Years
0
50
100
150
200
250
300
F/A
5% 10% 15% 20%
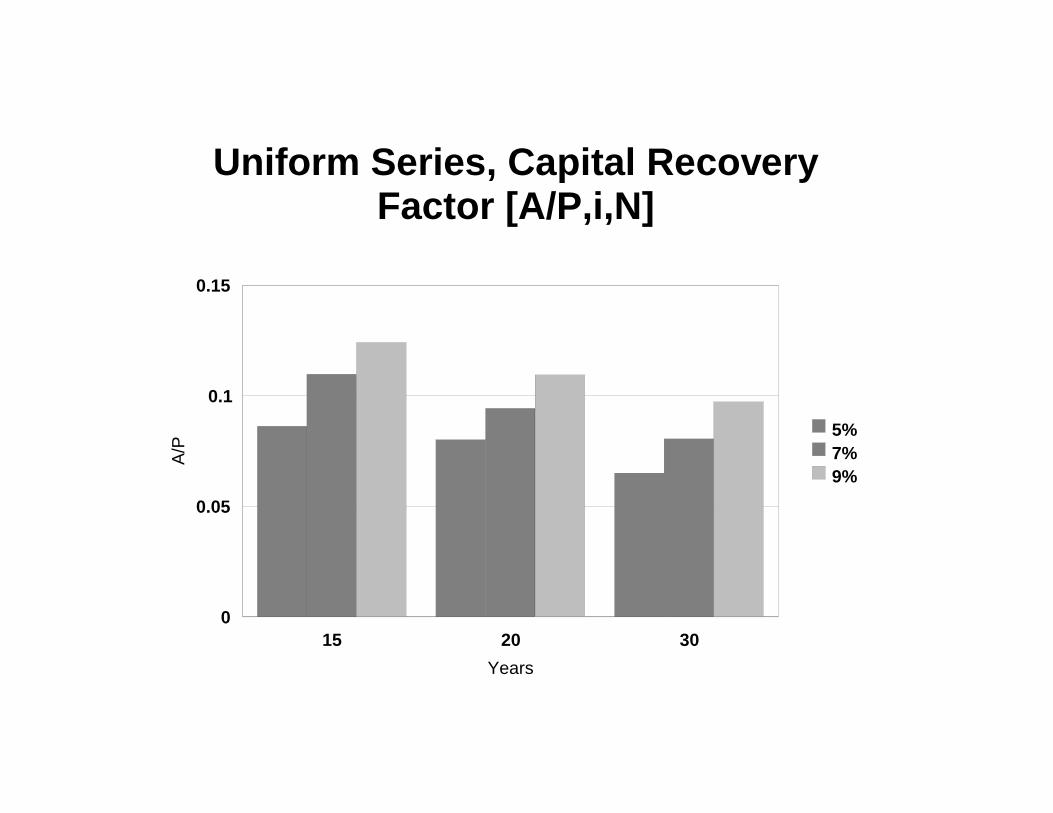
Uniform Series, Capital RecoveryFactor [A/P,i,N]
0
0.05
0.1
0.15
A/P
5% 7% 9%
15 20 30
Years

Capital Recovery Factor [A/P,i%,N] for selected interest rates i% and years N
Years 3% 4% 5% 6% 7% 8% 9% 10%
5 0.2184 0.2246 0.2310 0.2374 0.2439 0.2505 0.2571 0.2638
10 0.1172 0.1233 0.1295 0.1359 0.1424 0.1490 0.1558 0.1627
15 0.0838 0.0899 0.0963 0.1030 0.1098 0.1168 0.1241 0.1315
20 0.0672 0.0736 0.0802 0.0872 0.0944 0.1019 0.1095 0.1175
25 0.0574 0.0640 0.0710 0.0782 0.0858 0.0937 0.1018 0.1102
30 0.0510 0.0578 0.0651 0.0726 0.0806 0.0888 0.0973 0.1061
TMSI, Table 7.6

What Will My Mortgage Payment Be?
Mortgage Amount: $1,000,000 at 8% for 30 years
Payment is an annuity A that is worth $1,000,000 to the bank
Payment = $1,000,000 * [A/P,i%,N]
= $1,000,000 *(0.088827) = $88,827 per year
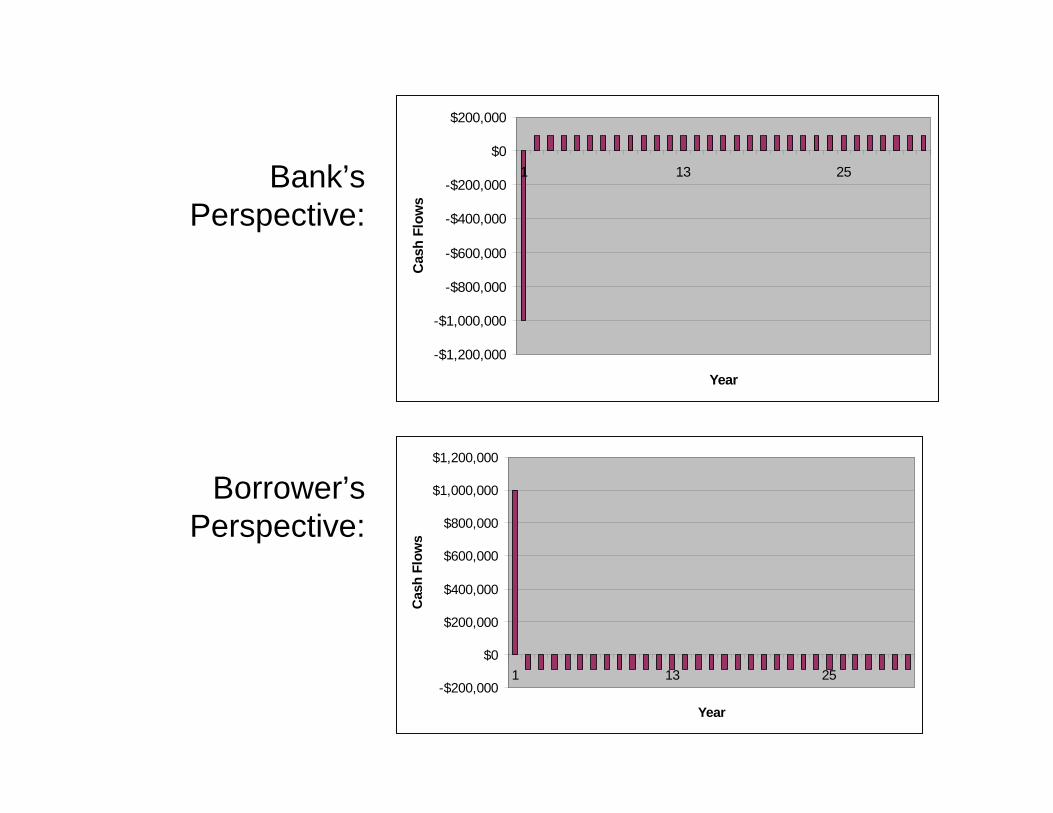
Bank’s Perspective:
Borrower’s Perspective:
-$1,200,000
-$1,000,000
-$800,000
-$600,000
-$400,000
-$200,000
$0
$200,000
1 13 25
Year
Cas
h Fl
ows
-$200,000
$0
$200,000
$400,000
$600,000
$800,000
$1,000,000
$1,200,000
1 13 25
Year
Cas
h Fl
ows
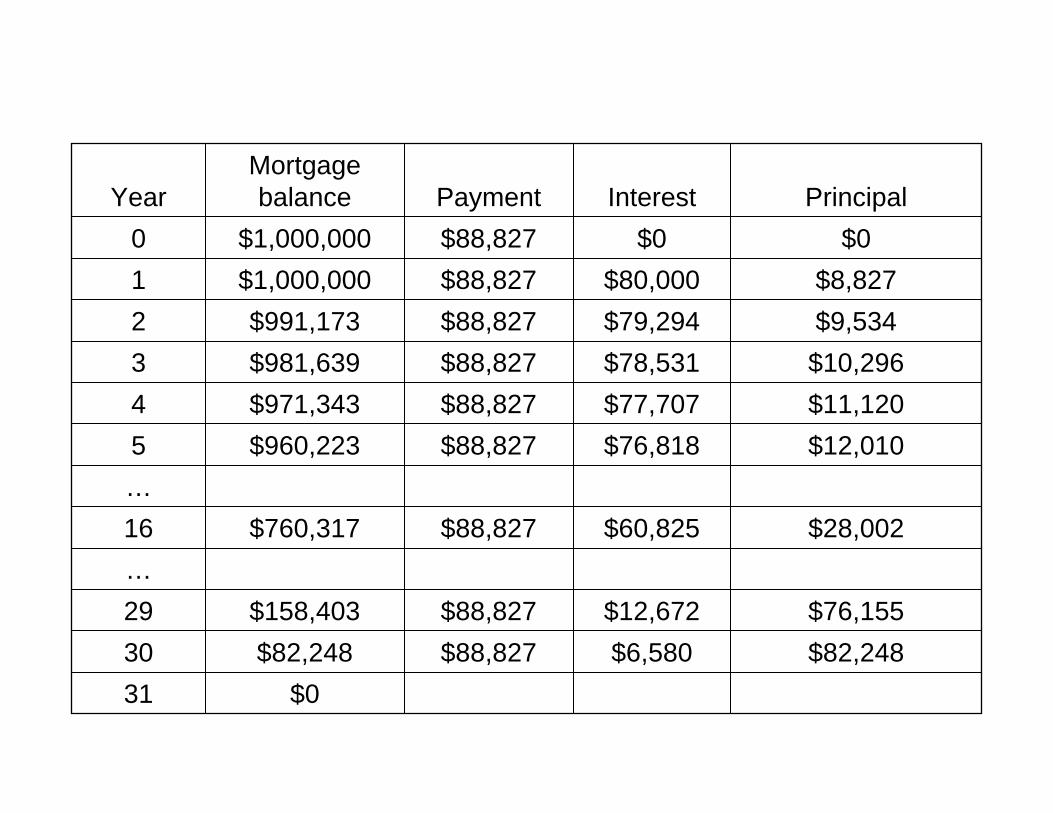
Year Mortgage balance Payment Interest Principal
0 $1,000,000 $88,827 $0 $0 1 $1,000,000 $88,827 $80,000 $8,827 2 $991,173 $88,827 $79,294 $9,534 3 $981,639 $88,827 $78,531 $10,296 4 $971,343 $88,827 $77,707 $11,120 5 $960,223 $88,827 $76,818 $12,010 … 16 $760,317 $88,827 $60,825 $28,002 … 29 $158,403 $88,827 $12,672 $76,155 30 $82,248 $88,827 $6,580 $82,248 31 $0

Refinancing a Mortgage
• What will the payment be if the mortgage is refinanced after 15 years at 6% for 20 years?
• Step 1: what is the remaining balance?
• Step 2: what would the new mortgage payment be on that balance?
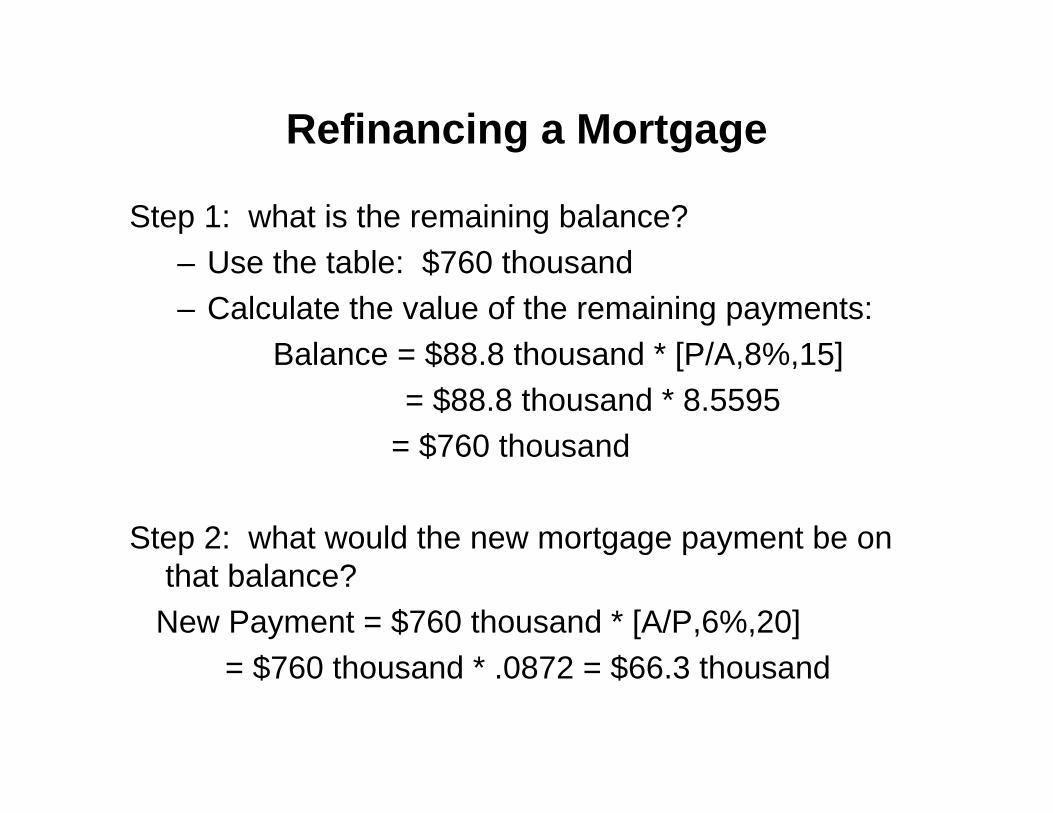
Refinancing a Mortgage
Step 1: what is the remaining balance? – Use the table: $760 thousand – Calculate the value of the remaining payments:
Balance = $88.8 thousand * [P/A,8%,15] = $88.8 thousand * 8.5595
= $760 thousand
Step 2: what would the new mortgage payment be on that balance?
New Payment = $760 thousand * [A/P,6%,20] = $760 thousand * .0872 = $66.3 thousand
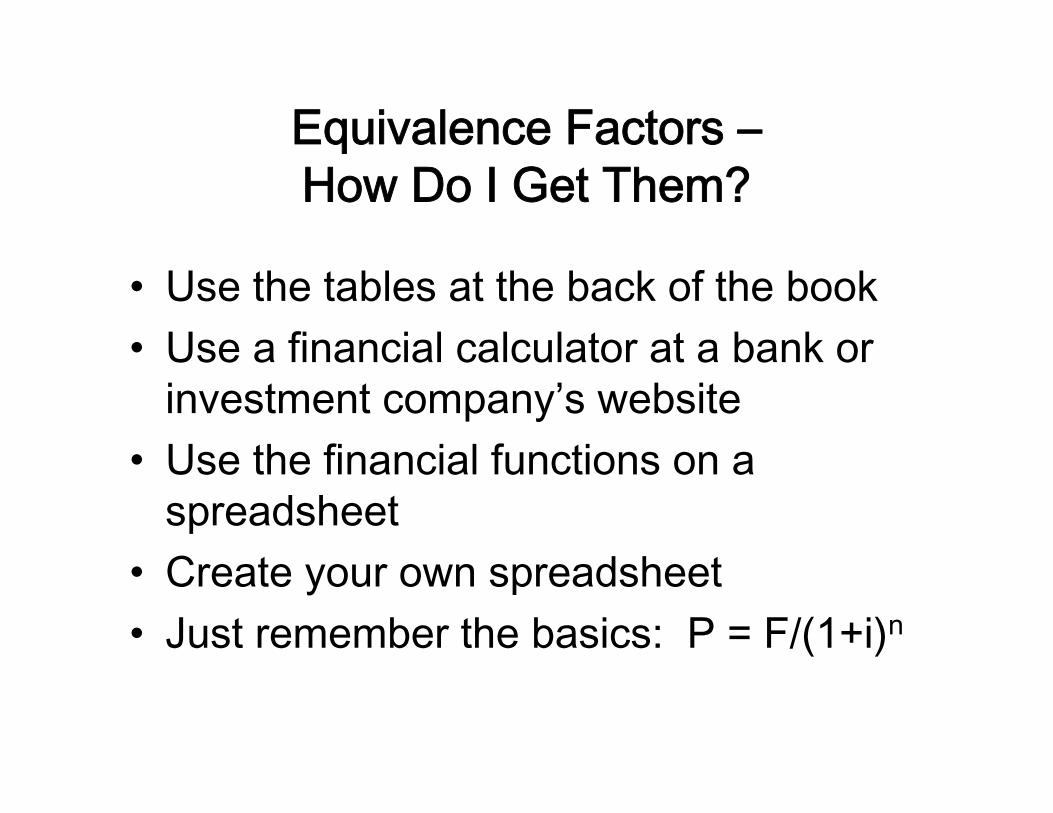
Equivalence Factors –How Do I Get Them?
• Use the tables at the back of the book • Use a financial calculator at a bank or
investment company’s website • Use the financial functions on a
spreadsheet • Create your own spreadsheet • Just remember the basics: P = F/(1+i)n
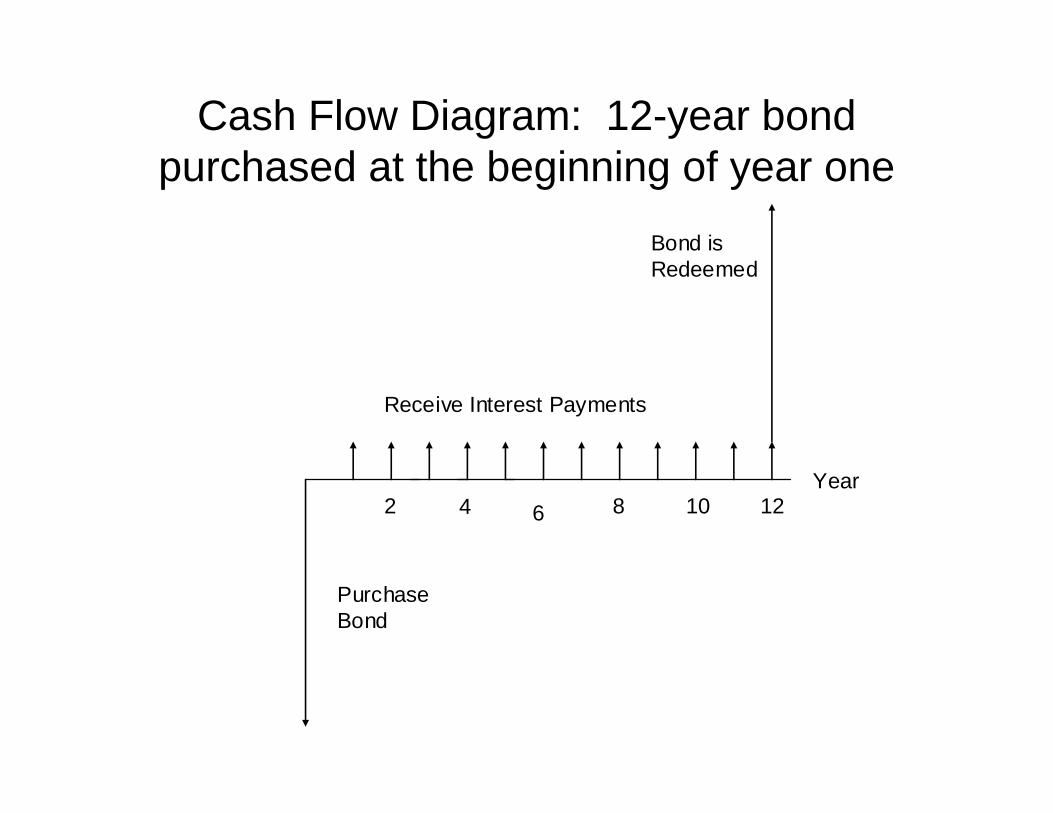
Cash Flow Diagram: 12-year bond purchased at the beginning of year one
Bond is Redeemed
Receive Interest Payments
Year 2 4 6 8 10 12
PurchaseBond
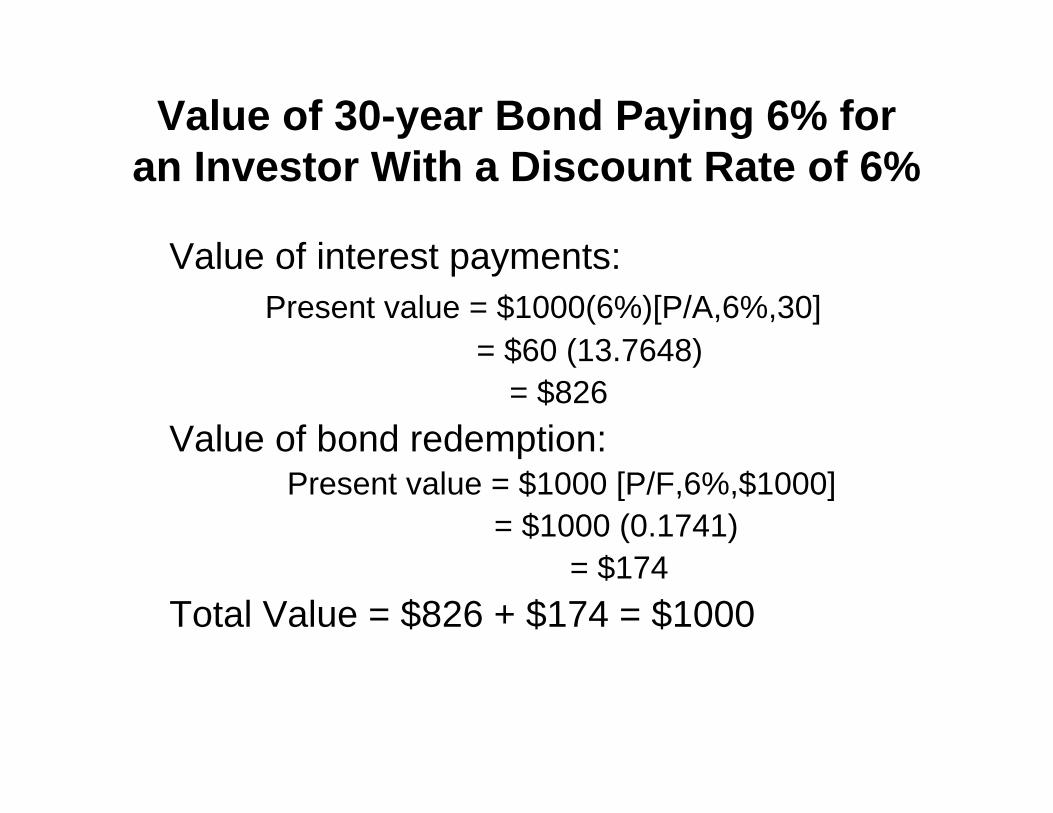
Value of 30-year Bond Paying 6% for an Investor With a Discount Rate of 6%
Value of interest payments:Present value = $1000(6%)[P/A,6%,30]
= $60 (13.7648)= $826
Value of bond redemption:Present value = $1000 [P/F,6%,$1000]
= $1000 (0.1741)= $174
Total Value = $826 + $174 = $1000

Value of 30-year Bond Paying 6% for an Investor With a Discount Rate of 5%
Value of interest payments:Present value = $1000(6%)[P/A,5%,30]
= $60 (15.3725)= $922
Value of bond redemption:Present value = $1000 [P/F,5%,30]
= $1000 (0.2314)= $231
Total Value = $922 + $231 = $1153
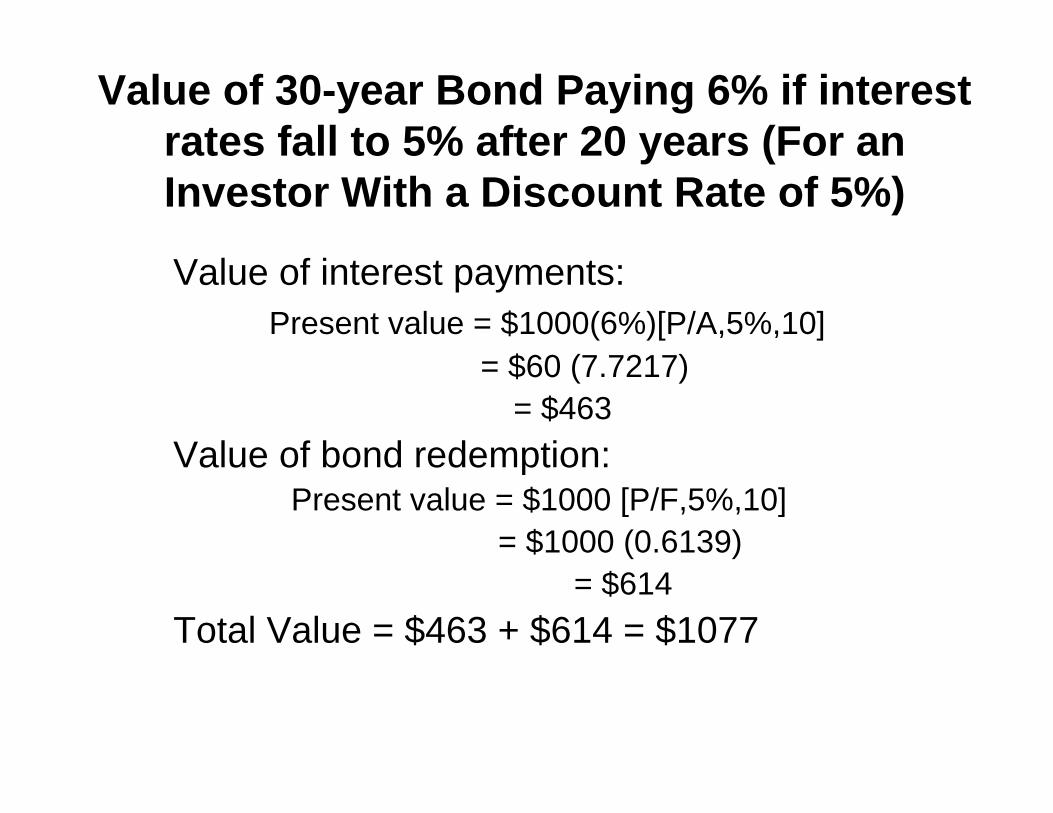
Value of 30-year Bond Paying 6% if interest rates fall to 5% after 20 years (For an Investor With a Discount Rate of 5%)
Value of interest payments: Present value = $1000(6%)[P/A,5%,10]
= $60 (7.7217) = $463
Value of bond redemption: Present value = $1000 [P/F,5%,10]
= $1000 (0.6139) = $614
Total Value = $463 + $614 = $1077
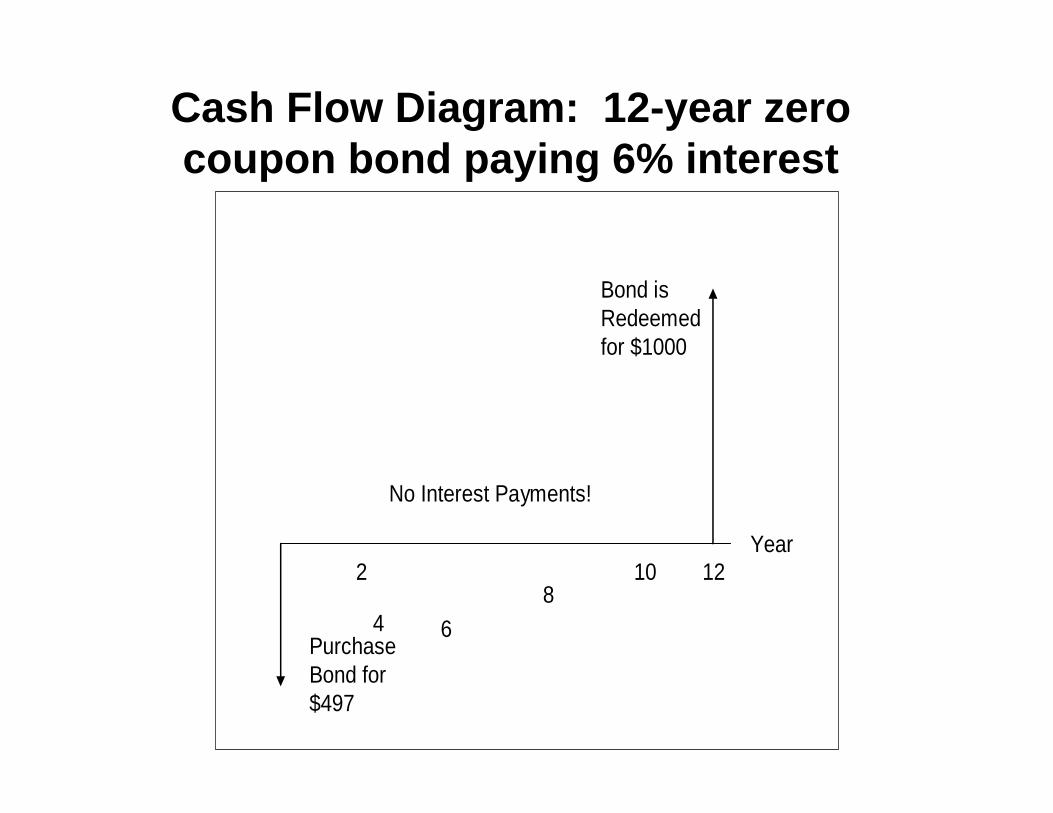
Cash Flow Diagram: 12-year zero coupon bond paying 6% interest
Bond is Redeemed for $1000
No Interest Payments!
Year 2
4 6 8
10 12
Purchase Bond for $497
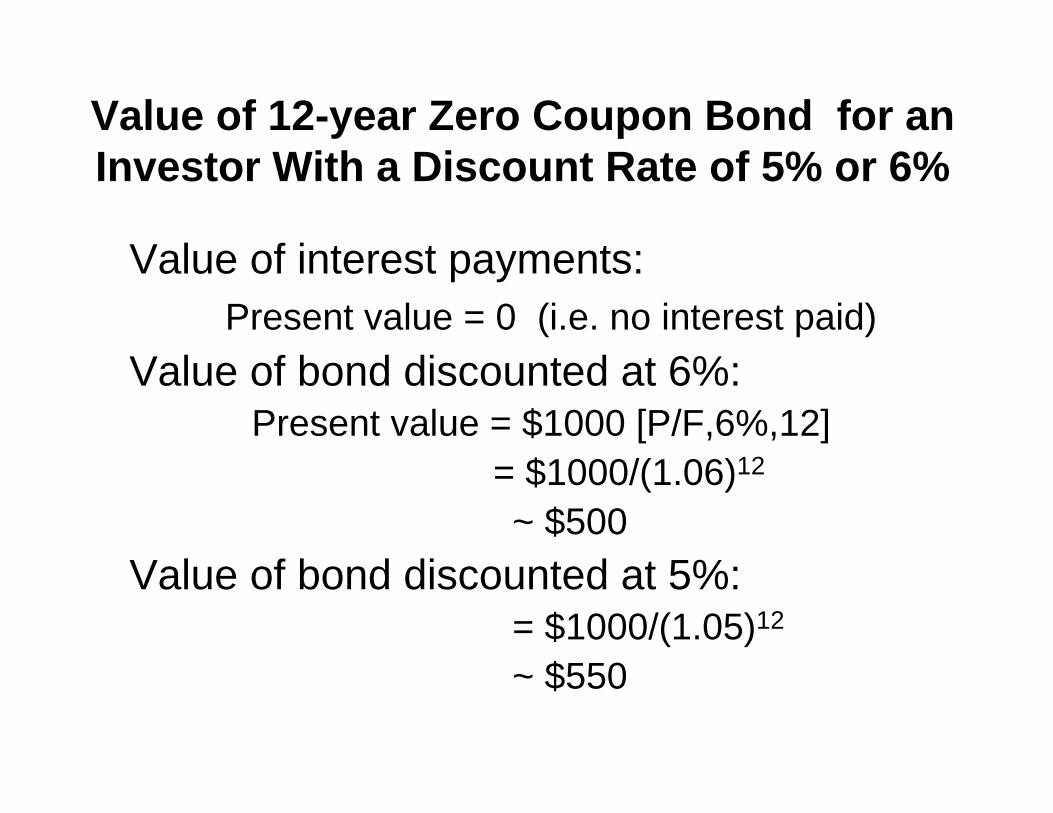
Value of 12-year Zero Coupon Bond for an Investor With a Discount Rate of 5% or 6%
Value of interest payments:Present value = 0 (i.e. no interest paid)
Value of bond discounted at 6%:Present value = $1000 [P/F,6%,12]
= $1000/(1.06)12
~ $500
Value of bond discounted at 5%: = $1000/(1.05)12
~ $550
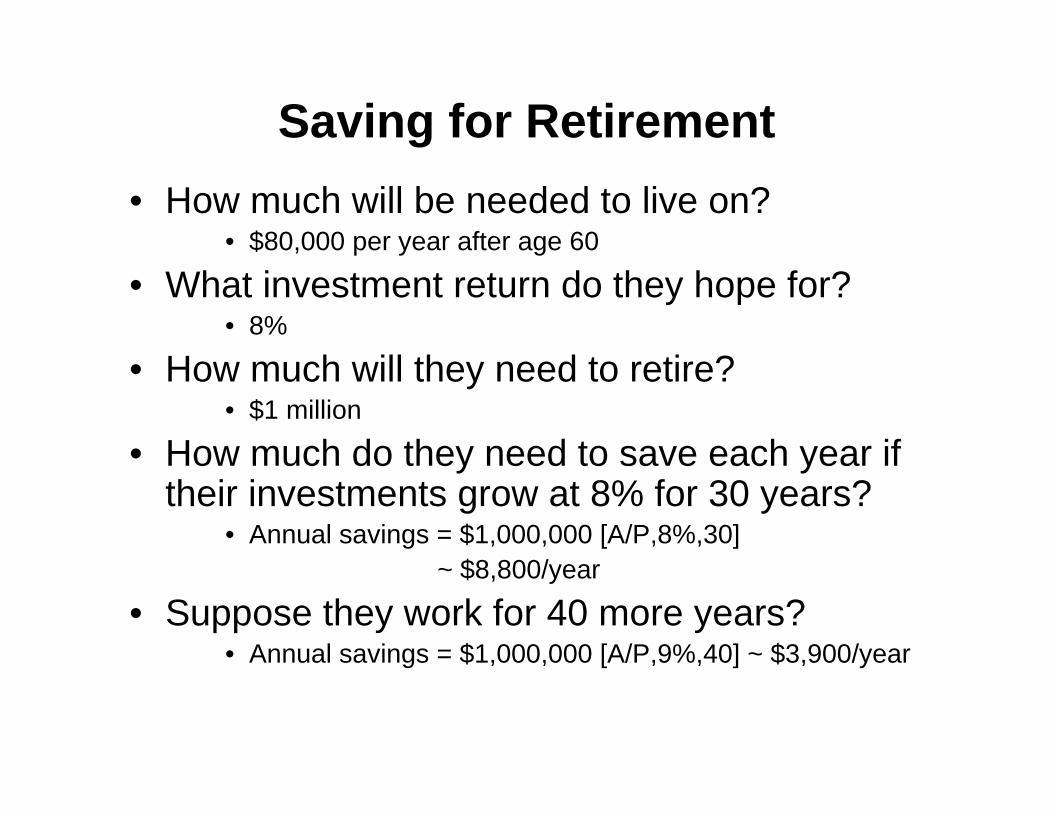
Saving for Retirement• How much will be needed to live on?
• $80,000 per year after age 60
• What investment return do they hope for? • 8%
• How much will they need to retire? • $1 million
• How much do they need to save each year if their investments grow at 8% for 30 years?
• Annual savings = $1,000,000 [A/P,8%,30] ~ $8,800/year
• Suppose they work for 40 more years? • Annual savings = $1,000,000 [A/P,9%,40] ~ $3,900/year
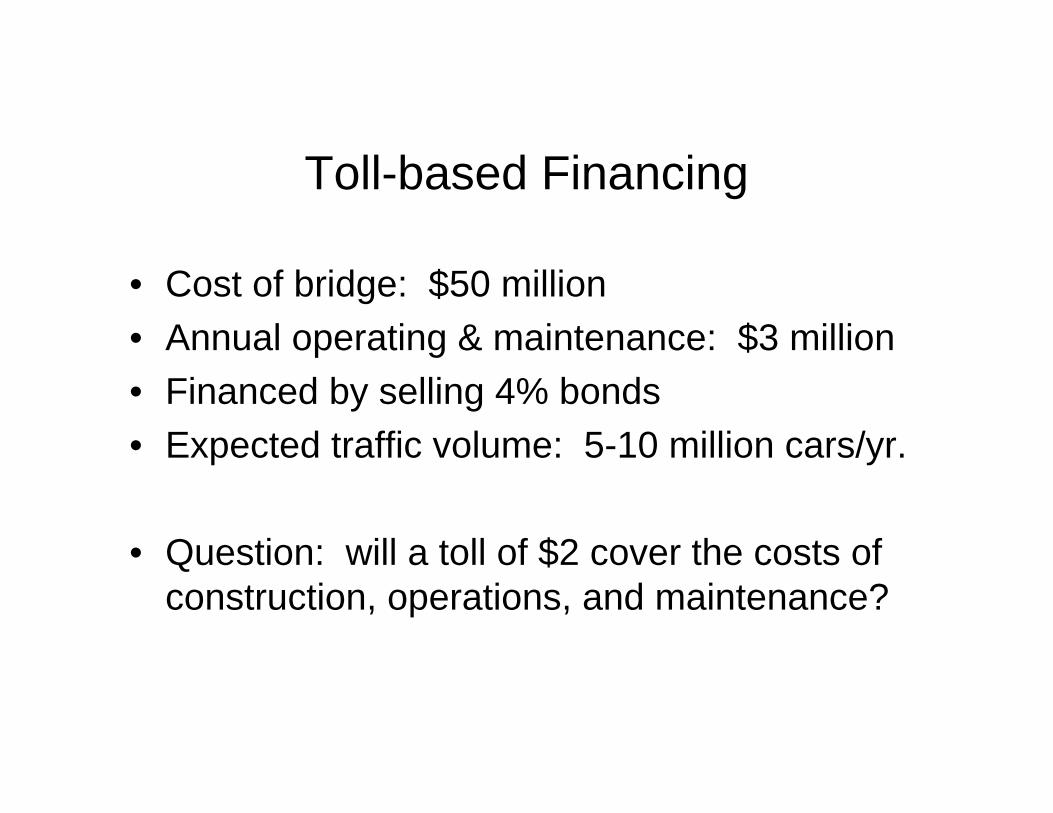
Toll-based Financing
• Cost of bridge: $50 million • Annual operating & maintenance: $3 million
• Financed by selling 4% bonds • Expected traffic volume: 5-10 million cars/yr.
• Question: will a toll of $2 cover the costs of construction, operations, and maintenance?

Toll-based Financing
• Annual revenue: $10 - $20 million • Net revenue after operating and maintenance
costs: $7 to $17 million • Annual carrying cost on bonds: 4% ($50
million) = $2 million • Conclusion: a $2 toll will be sufficient • A sinking fund could be established to pay off
the bonds in 30 years: $50 million/[F/A,4%,30] = $50 million/56.08
< $1 million extra per year
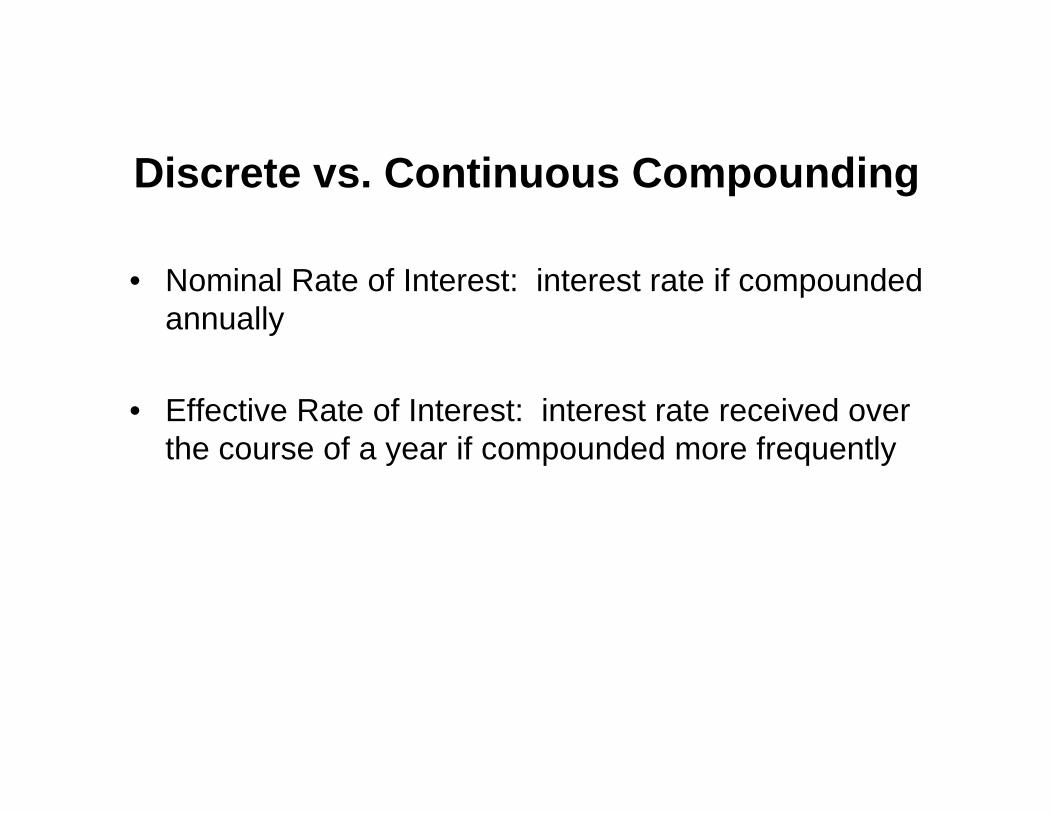
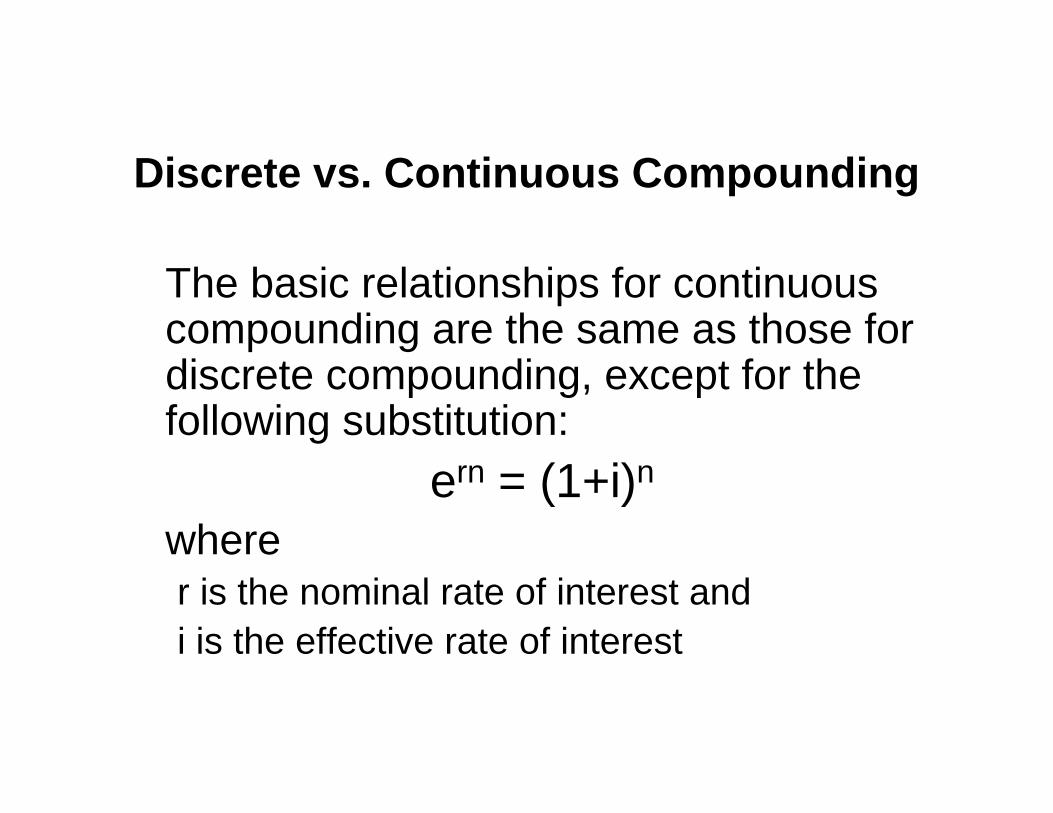
Discrete vs. Continuous Compounding
• Nominal Rate of Interest: interest rate if compounded annually
• Effective Rate of Interest: interest rate received over the course of a year if compounded more frequently
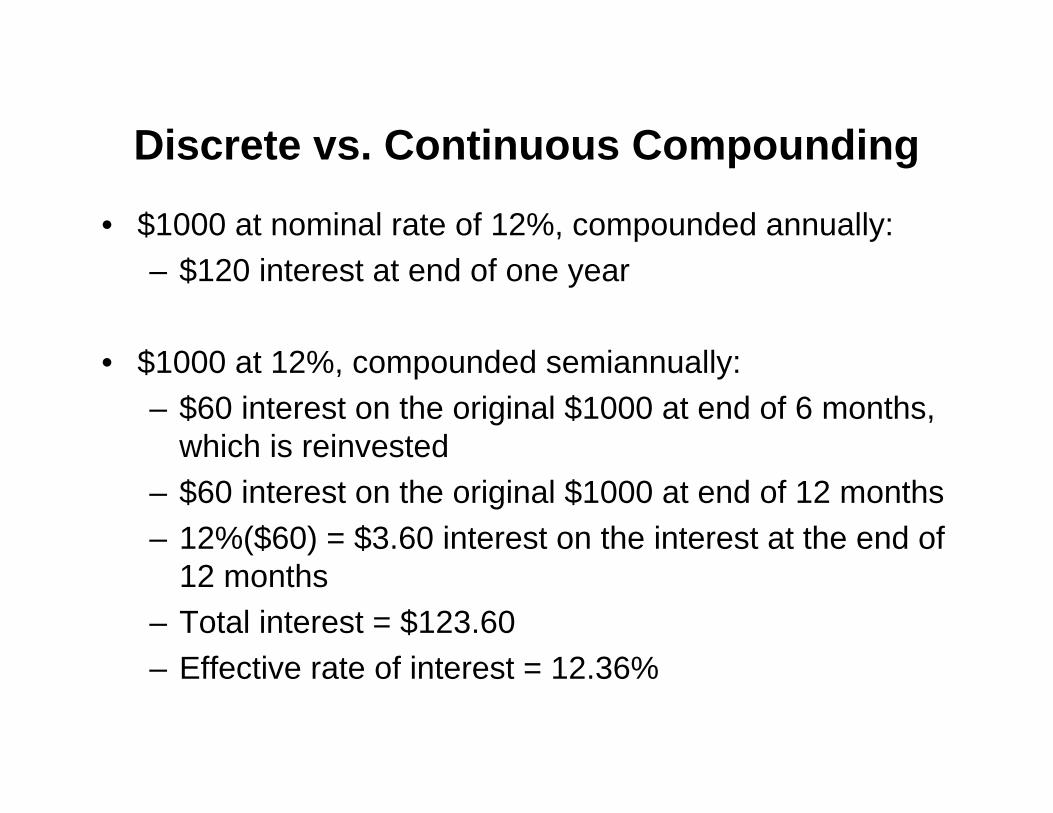
Discrete vs. Continuous Compounding
• $1000 at nominal rate of 12%, compounded annually: – $120 interest at end of one year
• $1000 at 12%, compounded semiannually: – $60 interest on the original $1000 at end of 6 months,
which is reinvested – $60 interest on the original $1000 at end of 12 months – 12%($60) = $3.60 interest on the interest at the end of
12 months – Total interest = $123.60 – Effective rate of interest = 12.36%
Discrete vs. Continuous Compounding
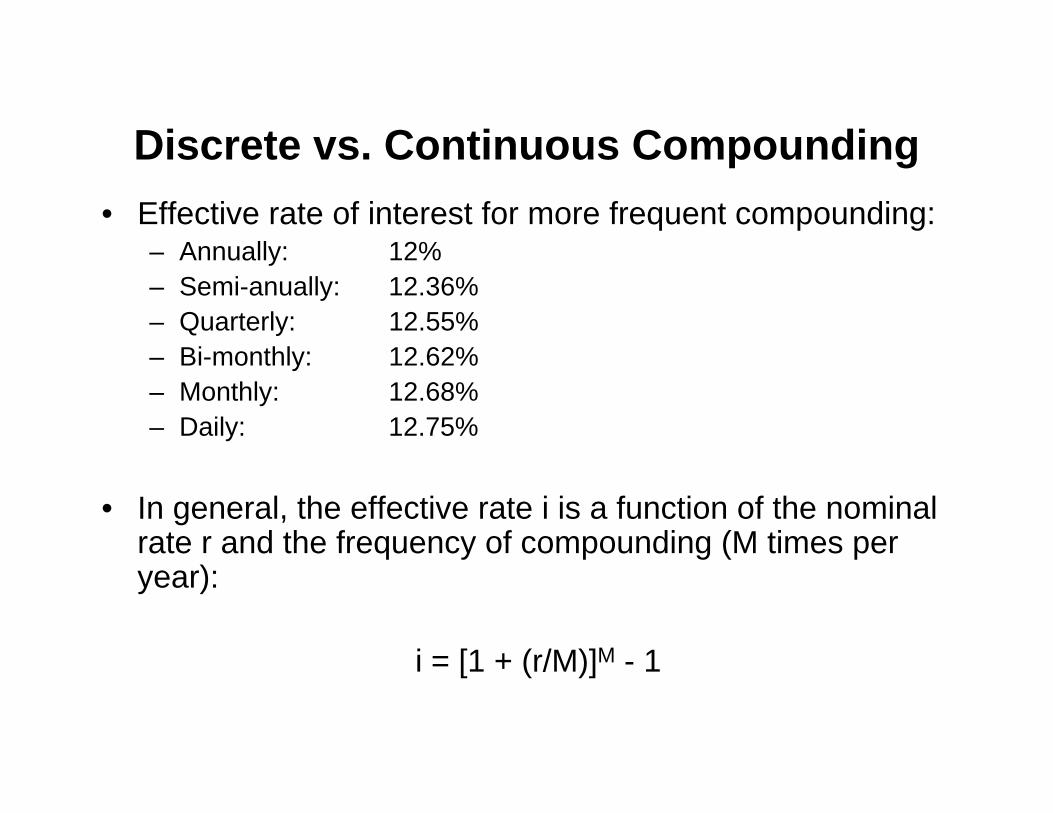
• Effective rate of interest for more frequent compounding:– Annually: 12% – Semi-anually: 12.36% – Quarterly: 12.55% – Bi-monthly: 12.62% – Monthly: 12.68% – Daily: 12.75%
• In general, the effective rate i is a function of the nominal rate r and the frequency of compounding (M times peryear):
i = [1 + (r/M)]M - 1
Discrete vs. Continuous Compounding
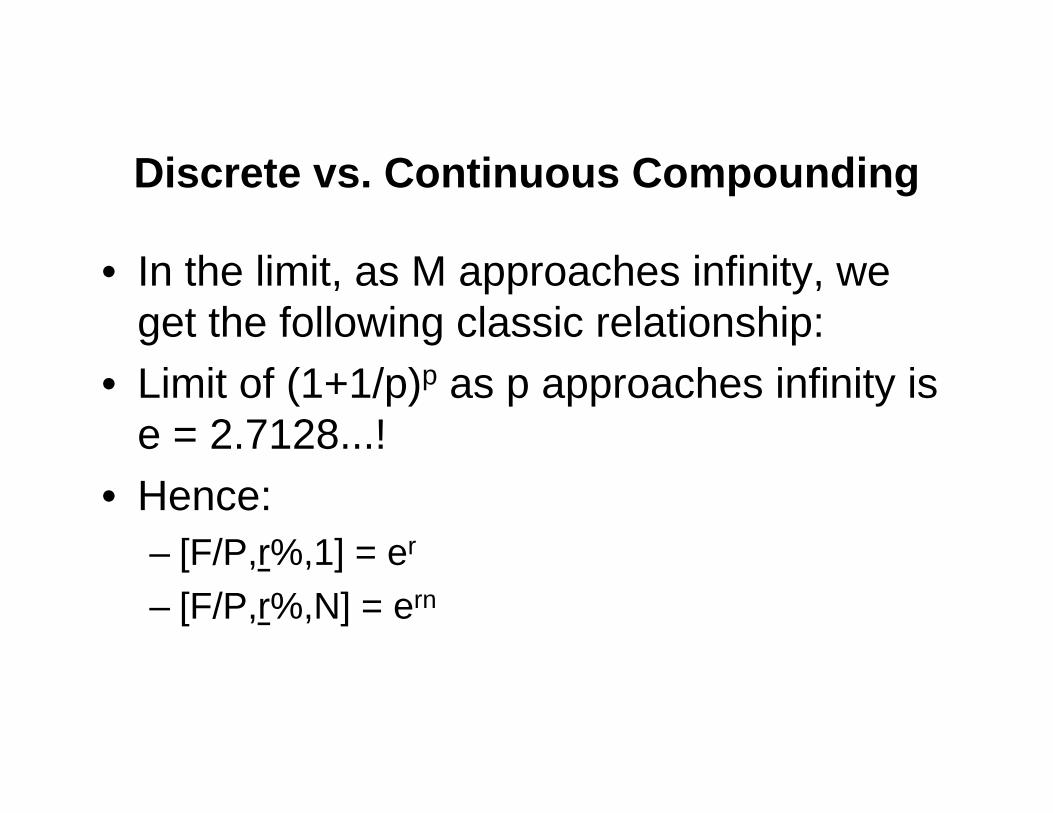
• In the limit, as M approaches infinity, we get the following classic relationship:
• Limit of (1+1/p)p as p approaches infinity is e = 2.7128...!
• Hence: – [F/P,r%,1] = er
– [F/P,r%,N] = ern
Discrete vs. Continuous Compounding
The basic relationships for continuouscompounding are the same as those fordiscrete compounding, except for thefollowing substitution:
ern = (1+i)n
wherer is the nominal rate of interest and i is the effective rate of interest

Discrete vs. Continuous Compounding
• Useful approximations: – If rn = 1, then ern = 2.718 – If rn = 0.7, then ern = 2.013 ~ 2 – If rn = 1.1, the ern = 3.004 ~ 3
– If rn = 1.4, then ern = 4.055 ~ 4

Which is Worth More?
• $1000 invested at 10% for 7 years or $1000 invested at 6% for 10 years?
• $1000 invested at 5% for 14 years and reinvested at 7% for 10 years or $1000 invested at 6% for 24 years?
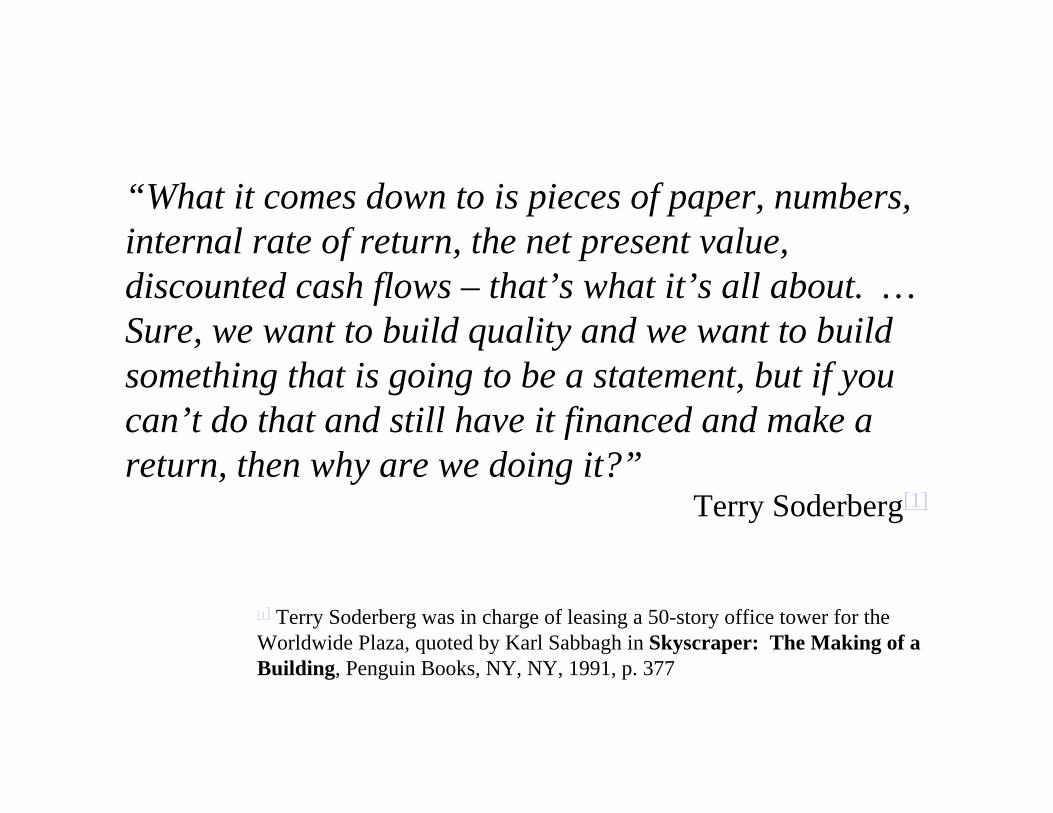
“What it comes down to is pieces of paper, numbers, internal rate of return, the net present value, discounted cash flows – that’s what it’s all about. … Sure, we want to build quality and we want to build something that is going to be a statement, but if you can’t do that and still have it financed and make a return, then why are we doing it?”
Terry Soderberg[1]
[1] Terry Soderberg was in charge of leasing a 50-story office tower for the Worldwide Plaza, quoted by Karl Sabbagh in Skyscraper: The Making of a Building, Penguin Books, NY, NY, 1991, p. 377
MIT OpenCourseWarehttp://ocw.mit.edu
1.011 Project Evaluation Spring 2011
For information about citing these materials or our Terms of Use, visit: http://ocw.mit.edu/terms.