DFW Multifamily Report 1Q 2018 - Texas A&M …...DELIVERIES AND DEMAND ECONOMIC TRENDS BERKADIA...
25
a Berkshire Hathaway and Jefferies Financial Group company SECOND QUARTER 2018 MARKET AT A GLANCE OCCUPANCY AND RENT TRENDS DALLAS-FORT WORTH MULTIFAMILY REPORT HEALTHY JOB GROWTH, APARTMENT DEMAND, DRIVE 3.4% RENT INCREASE Apartment fundamentals in the Dallas-Fort Worth metro area remained favorable amid sustained employment expansion, brisk household growth, healthy population migration, and sturdy apartment demand. Renters newly occupied 12,895 apartments in the first half of this year, accelerating from 5,413 units absorbed in the last half of 2017. The recent upturn in leasing activity resulted in 92.0% metrowide occupancy in June of this year, the same rate as one year ago. Absorption in the neighboring West Plano/Frisco/East Lewisville, East Plano/Richardson, and Allen/McKinney submarkets accounted for more than half of the absorption in the metro area. The leasing activity was driven by the feverish pace of hiring at several major companies in Legacy West, Austin Ranch, and the North Platinum Corridor. Developers delivered 5,047 apartments in the three submarkets since mid-2017. Occupancy in these areas increased because of the exceptional apartment demand, while annual effective rent appreciation ranged from 1.0% in the West Plano/Frisco/East Lewisville submarket to 2.3% in the Allen/McKinney submarket. Metrowide, effective rent grew 3.4% year over year to $1,105 per month in June. $600 $750 $900 $1,050 $1,200 90% 91% 92% 93% 94% 3Q13 1Q14 3Q14 1Q15 3Q15 1Q16 3Q16 1Q17 3Q17 1Q18 OCCUPANCY AND RENT TRENDS Occupancy Rate Effective Rent OCCUPANCY RATE EFFECTIVE RENT TOTAL INVENTORY 92.0% $ 1,105 703,476 Unchanged since 2Q17 Up 3.4% since 2Q17
Transcript of DFW Multifamily Report 1Q 2018 - Texas A&M …...DELIVERIES AND DEMAND ECONOMIC TRENDS BERKADIA...

a Berkshire Hathaway and Jefferies Financial Group company
SECOND QUARTER 2018
MARKET AT A GLANCE
OCCUPANCY AND RENT TRENDS
DALLAS-FORT WORTHMULTIFAMILY REPORT
HEALTHY JOB GROWTH, APARTMENT DEMAND, DRIVE 3.4% RENT INCREASE
Apartment fundamentals in the Dallas-Fort Worth metro area remained favorable amid sustained employment expansion, brisk household growth, healthy population migration, and sturdy apartment demand. Renters newly occupied 12,895 apartments in the first half of this year, accelerating from 5,413 units absorbed in the last half of 2017. The recent upturn in leasing activity resulted in 92.0% metrowide occupancy in June of this year, the same rate as one year ago. Absorption in the neighboring West Plano/Frisco/East Lewisville, East Plano/Richardson, and Allen/McKinney submarkets accounted for more than half of the absorption in the metro area. The leasing activity was driven by the feverish pace of hiring at several major companies in Legacy West, Austin Ranch, and the North Platinum Corridor. Developers delivered 5,047 apartments in the three submarkets since mid-2017. Occupancy in these areas increased because of the exceptional apartment demand, while annual effective rent appreciation ranged from 1.0% in the West Plano/Frisco/East Lewisville submarket to 2.3% in the Allen/McKinney submarket. Metrowide, effective rent grew 3.4% year over year to $1,105 per month in June.
$600
$750
$900
$1,050
$1,200
90%
91%
92%
93%
94%
3Q13 1Q14 3Q14 1Q15 3Q15 1Q16 3Q16 1Q17 3Q17 1Q18
OCCUPANCY AND RENT TRENDS
Occupancy Rate Effective Rent
OCCUPANCYRATE
EFFECTIVERENT
TOTAL INVENTORY
92.0%
$1,105
703,476
Unchanged since 2Q17
Up 3.4% since 2Q17

BERKADIASECOND QUARTER 2018
DELIVERIES AND DEMAND
ECONOMIC TRENDS
DALLAS-FORT WORTHMULTIFAMILY REPORT
DELIVERIES
NETABSORPTION
8,029
12,895
Units YTD
Units YTD 0
5,000
10,000
15,000
20,000
25,000
2013 2014 2015 2016 2017 2018*
DELIVERIES AND DEMAND
Deliveries Demand*Year to date
UNEMPLOYMENT*2017 2018
EMPLOYMENT**2017 2018
EXISTING SFH SALES**2017 2018
MEDIAN SFH PRICE**2017 2018
10-YEAR TREASURY**2017 2018
3.8%
3.58m
123.7k
$244.5k
2.19%
3.6%
3.70m
145.3k
$262.0k
2.91%
Job growth and attractive amenities in the Metroplex continued to draw people from outside the area. During the last year, net migration of 85,700 persons was recorded, helping fuel a 2.0% annual increase in households. The additional residents allowed businesses to tap into a larger labor pool. A net 119,400 jobs were created in the 12 months ending in May 2018, a 3.3% annual increase. Growth in the white-collar sectors was a major factor in overall expansion. Employers in the professional and business services segment created 25,100 jobs, a 4.3% gain. Approximately 6,000 workers were hired among the financial activities and information sectors. Continued development and corporate expansion along the Dallas North Tollway are expected to support the white-collar sectors for at least the next few quarters. In the trade, transportation, and utilities segment, the largest employment sector, companies added 22,100 jobs, equating to 2.9% expansion. The highest rate of growth, 4.5%, was in the leisure and hospitality industry, where 16,800 positions were filled.
-20 BPSCHANGE
3.3%CHANGE
17.5%CHANGE
7.2%CHANGE
70 BPSCHANGE
U.S. SHARE OF WALLETMETRO SHARE OF WALLET
U.S.ANNUAL RENT
26.5%share of wallet
METROANNUAL RENT
19.4%share of wallet
*May; **June

BERKADIA SECOND QUARTER 2018
© 2018 Berkadia Real Estate Advisors LLCBerkadia® is a registered trademark of Berkadia Proprietary Holding LLCDocument sources: Axiometrics; Berkadia Research; Federal Reserve Bank of St. Louis; Moody’s
SUBMARKET BREAKDOWN
DALLAS-FORT WORTHMULTIFAMILY REPORT
SUBMARKET NAME# OF
COMMUNITIES # OF UNITS SIZE (SF)PRICE
($ / MO.)RENTAL RATE($ / SF / MO.) OCCUPANCY
Downtown Dallas/West End/Deep Ellum 56 11,932 947 $1,469 $1.55 87.5%
Uptown/Oaklawn/Highland Park 157 35,039 927 $1,699 $1.83 88.2%
East Central Dallas/Lower Greenville Ave 53 6,257 865 $1,314 $1.52 93.6%
White Rock Lake/Tenison Park 69 14,995 803 $858 $1.07 94.0%
North Central Dallas/Upper Greenville Ave 114 30,055 822 $1,164 $1.42 86.9%
Skillman St/I-635 96 26,433 790 $918 $1.16 91.2%
Far East Dallas 22 3,794 936 $1,061 $1.13 96.2%
Garland 98 18,153 866 $1,005 $1.16 88.6%
North Dallas/Addison 114 31,383 888 $1,137 $1.28 93.8%
Far North Dallas/Collin County 78 24,522 795 $1,015 $1.28 94.3%
East Plano/Richardson 94 25,707 933 $1,235 $1.32 91.1%
West Plano/Frisco/East Lewisville 177 56,828 932 $1,264 $1.36 89.7%
Allen/McKinney 81 21,069 918 $1,170 $1.28 88.3%
East Irving 59 7,853 807 $845 $1.05 94.8%
West Irving 81 18,299 810 $959 $1.18 94.0%
Las Colinas/Valley Ranch/Coppell 81 29,306 909 $1,289 $1.42 93.0%
Northwest Dallas/Bachman Lake 57 10,775 791 $865 $1.09 95.2%
Carrollton/Farmers Branch 115 28,150 900 $1,153 $1.28 94.3%
West Lewisville/Flower Mound 77 22,498 885 $1,151 $1.30 91.9%
Denton 63 13,027 872 $1,099 $1.26 92.9%
Southeast Dallas/Mesquite 105 22,553 847 $867 $1.02 94.0%
Oak Cliff South 65 13,462 899 $845 $0.94 93.5%
Duncanville/DeSoto/Cedar Hill/Lancaster 92 20,052 860 $927 $1.08 95.5%
Far South Dallas/Waxahachie 32 3,539 903 $1,006 $1.11 93.4%
Trinity Groves/Oak Cliff North 42 7,778 849 $1,137 $1.34 89.5%
Grand Prairie 54 12,531 853 $1,013 $1.19 93.7%
Downtown Ft Worth/TCU 63 12,390 883 $1,325 $1.50 86.0%
East Ft Worth/Woodhaven/I-30E 68 12,433 827 $823 $1.00 92.5%
North Arlington 96 21,630 813 $974 $1.20 92.9%
South Arlington 138 28,476 852 $985 $1.16 94.3%
Haltom City/Richland Hills/Fossil Creek 70 17,115 905 $1,030 $1.14 94.3%
Hurst/Euless/Bedford 131 30,289 847 $1,025 $1.21 94.4%
Grapevine/Roanoke/Keller 68 17,927 945 $1,270 $1.34 91.2%
Northwest Ft Worth/Saginaw/Eagle Mtn 32 5,462 938 $942 $1.00 89.8%
South Ft Worth 67 11,926 885 $882 $1.00 93.0%
Southwest Ft Worth/Benbrook 46 12,889 847 $988 $1.17 95.0%
Far Southwest Ft Worth 25 3,127 868 $889 $1.02 91.6%
Western Hills/Ridgmar/Ridglea 79 13,822 859 $844 $0.98 91.3%
TOTALS 3,016 703,476 873 $1,105 $1.27 92.0%

CORPORATE HEADQUARTERS521 Fifth Avenue
20th FloorNew York, NY 10175
(646) 600-7800 | Fax: (646) 600-7838www.Berkadia.com
© 2018 Berkadia Proprietary Holding LLC Berkadia® is a trademark of Berkadia Proprietary Holding LLC.Axiometrics® is a trademark of Axiometrics Inc.Commercial mortgage loan origination and servicing businesses are conducted exclusively by Berkadia Commercial Mortgage LLC and Berkadia Commercial Mortgage Inc. This website is not intended to solicit commercial mortgage loan brokerage business in Nevada. Investment sales and real estate brokerage businesses are conducted exclusively by Berkadia Real Estate Advisors LLC and Berkadia Real Estate Advisors Inc. For state licensing details for the above entities, visit: www.berkadia.com/legal/licensing.aspx
a Berkshire Hathaway and Jefferies Financial Group company

MARKET AT A GLANCE
OCCUPANCY AND RENT TRENDS
a Berkshire Hathaway and Leucadia National company
DALLAS-FORT WORTHMULTIFAMILY REPORT FIRST QUARTER 2018
APARTMENT COMPLETIONS SURGE WITH SUSTAINED JOB GROWTH
Apartment absorption and construction continued at a frenzied pace in the Dallas-Fort Worth metro area. Dovetailing with robust job growth in the northern part of the metro, new inventory in the neighboring West Plano/Frisco/East Lewisville, East Plano/Richardson, and Allen/McKinney submarkets comprised one quarter of the deliveries in the metro area since March 2017. In migration to these submarkets spurred absorption that outpaced deliveries by 26%, resulting in increased occupancy in all three areas. The metro area as a whole did not follow this pattern, however. While absorption was healthy in the last four quarters, it trailed the 24,005 completions by 32%. Consequently, metrowide occupancy decreased 80 basis points year over year to 91.2% in March 2018. Meanwhile, effective rent appreciated 3.3% annually. By March of this year, average effective rent was $1,079 per month, with most of the growth occurring in the second and third quarters of 2017. Annual rent growth was robust in a majority of the lowest-rent submarkets. At the opposite end, Class A effective rent reached a metrowide average of $1,418 per month, a 1.4% annual gain, notably slower than the overall rate of growth.
$700
$800
$900
$1,000
$1,100
$1,200
89%
90%
91%
92%
93%
94%
2Q13 4Q13 2Q14 4Q14 2Q15 4Q15 2Q16 4Q16 2Q17 4Q17
OCCUPANCY AND RENT TRENDS
Occupancy Rate Effective rent
OCCUPANCYRATE
EFFECTIVERENT
TOTAL INVENTORY
91.2%
$1,079
700,497
Down 80 bps since 1Q17
Up 3.3% since 1Q17

DELIVERIES AND DEMAND
ECONOMIC TRENDS
BERKADIA
DALLAS FORT-WORTHMULTIFAMILY REPORT
DELIVERIES
NETABSORPTION
4,278
4,340
Units YTD
Units YTD 0
6,000
12,000
18,000
24,000
30,000
2013 2014 2015 2016 2017 2018*
DELIVERIES AND DEMAND
Deliveries Demand*Year to date
UNEMPLOYMENT*2017 2018
EMPLOYMENT**2017 2018
EXISTING SFH SALES***2017 2018
MEDIAN SFH PRICE***2017 2018
10-YEAR TREASURY***2017 2018
3.9%
3.56m
131.5k
$245.0k
2.40%
3.4%
3.66m
133.6k
$255.0k
2.74%
A proliferation of new hires among Toyota Motor North America Inc., FedEx Corporation, The Boeing Company, Liberty Mutual Group, and JPMorgan Chase & Co. at Legacy West in Plano fueled metrowide annual job growth of 2.6% through February of this year. Across the Metroplex, businesses and institutions added 93,500 workers to payrolls in the last 12 months. The 2.6% growth was a reduction from 2.7% expansion in the prior 12 months—not entirely unexpected since the January 2018 unemployment rate of 3.4% implied full employment. The largest contributor to overall expansion was the leisure and hospitality industry, where 19,200 workers were hired, a 5.2% annual increase. In the professional and business services sector, 13,300 jobs were created, a 2.3% gain. During the same period, manufacturing sector employment rose 3.2% as 8,500 jobs were filled, boosted by ramped-up production of the F-35 Lightning II fighter jet at the Lockheed Martin Aerospace facility in Fort Worth.
-50 BPSCHANGE
2.6%CHANGE
1.6%CHANGE
4.1%CHANGE
30 BPSCHANGE
U.S. SHARE OF WALLET METRO SHARE OF WALLET
U.S.ANNUAL RENT
26.3%share of wallet
METROANNUAL RENT
19.1%share of wallet
FIRST QUARTER 2018
*January; **February; ***March

SUBMARKET BREAKDOWN
BERKADIA
DALLAS FORT-WORTHMULTIFAMILY REPORT
FIRST QUARTER 2018
© 2018 Berkadia Real Estate Advisors LLCBerkadia® is a registered trademark of Berkadia Proprietary Holding LLCDocument sources: Axiometrics; Berkadia Research; Federal Reserve Bank of St. Louis; Moody’s
SUBMARKET NAME# OF
COMMUNITIES # OF UNITS SIZE (SF)PRICE
($ / MO.)RENTAL RATE($ / SF / MO.) OCCUPANCY
Downtown Dallas/ West End/ Deep Ellum 56 11,932 947 1,456 1.54 85.3%
Uptown/ Oaklawn/ Highland Park 156 34,656 927 1,653 1.78 87.0%
East Central Dallas/ Lower Greenville Ave 53 6,257 865 1,302 1.51 91.2%
White Rock Lake/ Tenison Park 69 14,995 803 846 1.05 94.2%
North Central Dallas/ Upper Greenville Ave 112 29,676 818 1,126 1.38 86.3%
Skillman St/ I-635 97 26,423 790 905 1.15 91.3%
Far East Dallas 22 3,794 936 1,037 1.11 94.0%
Garland 98 18,193 866 997 1.15 86.7%
North Dallas/ Addison 114 31,383 888 1,124 1.27 92.9%
Far North Dallas/ Collin County 78 24,522 795 1001 1.26 94.3%
East Plano/ Richardson 94 25,707 933 1,215 1.30 88.2%
West Plano/ Frisco/ East Lewisville 175 56,129 932 1,248 1.34 89.0%
Allen/ McKinney 79 20,472 922 1,154 1.25 89.2%
East Irving 59 7,853 807 829 1.03 94.9%
West Irving 81 18,299 810 937 1.16 93.7%
Las Colinas/ Valley Ranch/ Coppell 80 29,062 909 1,245 1.37 92.3%
Northwest Dallas/ Bachman Lake 58 10,996 790 842 1.07 95.3%
Carrollton/ Farmers Branch 115 28,150 900 1,126 1.25 93.5%
West Lewisville/ Flower Mound 76 22,250 884 1,117 1.26 91.3%
Denton 64 13,027 872 1,076 1.23 91.4%
Southeast Dallas/ Mesquite 105 22,553 847 852 1.01 93.9%
Oak Cliff South 65 13,462 899 816 0.91 92.9%
Duncanville/ DeSoto/ Cedar Hill/ Lancaster 92 20,052 860 901 1.05 93.8%
Far South Dallas/ Waxahachie 25 3,127 917 983 1.07 96.5%
Trinity Groves/ Oak Cliff North 42 7,778 849 1,129 1.33 86.8%
Grand Prairie 54 12,531 853 988 1.16 92.1%
Downtown Ft Worth/ TCU 63 12,039 881 1,266 1.44 84.8%
East Ft Worth/ Woodhaven/ I-30E 69 12,616 831 797 0.96 91.8%
North Arlington 96 21,630 813 955 1.18 91.8%
South Arlington 140 28,661 851 956 1.12 93.8%
Haltom City/ Richland Hills/ Fossil Creek 70 17,115 904 1014 1.12 94.0%
Hurst/ Euless/ Bedford 130 30,273 845 984 1.16 94.8%
Grapevine/ Roanoke/ Keller 68 17,927 945 1,230 1.30 89.2%
Northwest Ft Worth/ Saginaw/ Eagle Mtn 32 5,462 938 912 0.97 87.1%
South Ft Worth 67 11,926 885 862 0.97 90.7%
Southwest Ft Worth/ Benbrook 46 12,889 847 970 1.15 94.4%
Far Southwest Ft Worth 25 3,127 868 864 1.00 91.4%
Western Hills/ Ridgmar/ Ridglea 79 13,553 860 826 0.96 91.8%
TOTALS 3,004 700,497 872 1,079 1.24 91.2%

CORPORATE HEADQUARTERS521 Fifth Avenue
20th FloorNew York, NY 10175
(646) 600-7800 | Fax: (646) 600-7838www.Berkadia.com
ALBUQUERQUE, NM
AMBLER, PA
ATLANTA, GA
AUSTIN, TX
BATON ROUGE, LA
BIRMINGHAM, AL
BOCA RATON, FL
BOSTON, MA
CAMAS, WA
CHARLESTON, SC
CHATTANOOGA, TN
CHICAGO, IL
CLEVELAND, OH
COLORADO SPRINGS, CO
DALLAS, TX
DC METRO
DENVER, CO
DETROIT, MI
EL SEGUNDO, CA
FRESNO, CA
HOUSTON, TX
IRVINE, CA
JACKSONVILLE, FL
KANSAS CITY, MO
LAS VEGAS, NV
LEXINGTON, KY
LOS ANGELES, CA
MARBLEHEAD, MA
MEMPHIS, TN
MIAMI, FL
MIDVALE, UT
MURRIETA, CA
NASHVILLE, TN
NEW YORK, NY
NEWPORT NEWS, VA
ORLANDO, FL
PASADENA, CA
PHILADELPHIA, PA
PHOENIX, AZ
PORTLAND, OR
RALEIGH, NC
RICHMOND, VA
SALT LAKE CITY, UT
SAN ANTONIO, TX
SAN DIEGO, CA
SAN FRANCISCO, CA
SEATTLE, WA
SHREWSBURY, NJ
ST. LOUIS, MO
TAMPA, FL
TEMPE, AZ
TUCSON, AZ
WOODLAND HILLS, CA
HYDERABAD - INDIA*
*Back Office Support
© 2018 Berkadia Proprietary Holding LLC Berkadia® is a trademark of Berkadia Proprietary Holding LLC.Axiometrics® is a trademark of Axiometrics Inc.Commercial mortgage loan origination and servicing businesses are conducted exclusively by Berkadia Commercial Mortgage LLC and Berkadia Commercial Mortgage Inc. This website is not intended to solicit commercial mortgage loan brokerage business in Nevada. Investment sales and real estate brokerage businesses are conducted exclusively by Berkadia Real Estate Advisors LLC and Berkadia Real Estate Advisors Inc. For state licensing details for the above entities, visit: www.berkadia.com/legal/licensing.aspx
a Berkshire Hathaway and Leucadia National company

MARKET AT A GLANCE
OCCUPANCY AND RENT TRENDS
a Berkshire Hathaway and Leucadia National company
DALLAS-FORT WORTHMULTIFAMILY REPORT THIRD QUARTER 2017
EFFECTIVE RENT RISES 4.7% YEAR TO DATE AMID HEIGHTENED DELIVERIES
Major corporate relocations and expansions in Plano drove apartment demand in the West Plano/Frisco submarket, which accounted for more than a quarter of year-to-date absorption in the Dallas-Fort Worth metro area. Heightened leasing activity was also present in the Uptown/Oaklawn/Highland Park and Allen/McKinney submarkets. Across the Metroplex, renters occupied 13,120 additional apartments since the beginning of 2017, down only 2% from the corresponding period in 2016. As of September of this year, 29,102 apartment units were under construction among 104 apartment communities. The highest-rent submarket in the metro area, Uptown/Oaklawn/Highland Park, had the second-highest number of units under construction at the time. Year to date, builders completed 16,319 apartments metrowide, a 42% increase from the first nine months of 2016. The supply imbalance spurred a 20-basis-point decrease in occupancy to 92.1% in September of this year. Operators kept upward pressure on rents, despite the dip in occupancy. By the end of the third quarter, effective rent reached an average of $1,077 per month, a 4.7% increase since the beginning of this year.
$700
$800
$900
$1,000
$1,100
90%
91%
92%
93%
94%
4Q12 2Q13 4Q13 2Q14 4Q14 2Q15 4Q15 2Q16 4Q16 2Q17
OCCUPANCY AND RENT TRENDS
Occupancy Rate Effective Rent
OCCUPANCYRATE
EFFECTIVERENT
92.1%
$1,077
Down 90 bps since 3Q16
Up 4.1% since 3Q16

DELIVERIES AND DEMAND
ECONOMIC TRENDS
BERKADIA
DALLAS-FORT WORTHMULTIFAMILY REPORT
DELIVERIES
NETABSORPTION
16,319
13,120
Units YTD
Units YTD 0
4,000
8,000
12,000
16,000
20,000
24,000
2012 2013 2014 2015 2016 2017*
DELIVERIES AND DEMAND
Deliveries Demand*Year to date
UNEMPLOYMENT*2016 2017
EMPLOYMENT*2016 2017
EXISTING SFH SALES**2016 2017
MEDIAN SFH PRICE**2016 2017
10-YEAR TREASURY**2016 2017
3.9%
3.52m
117.0k
$228.2k
1.63%
3.6%
3.62m
138.2k
$246.4k
2.20%
The annual rate of employment growth in the Dallas-Fort Worth metro area continued to top most metro areas in the country. Employers added a net 101,400 workers to local payrolls through August of this year, a 2.9% annual expansion. Companies in the professional and business services sector created 25,500 jobs to lead all other sectors, a 4.4% year-over-year gain. Leisure and hospitality sector employment advanced 5.1% with 18,700 new hires. The sector was underpinned by a vibrant tourism industry and a 3.8% year-over-year increase in median household income coinciding with 2.1% annual household growth. Expansion of 2.1% was recorded in the trade, transportation, and utilities segment, where 15,500 workers were recruited. In the financial activities industry, 9,800 positions were filled, a 3.5% increase. The industry was boosted by hundreds of new jobs at Liberty Mutual Group and Charles Schwab Corporation. Manufacturing sector employment expanded 2.7% as 7,200 workers were hired, supported by more than 300 new jobs at Kubota Tractor Corporation in Grapevine.
-30 BPSCHANGE
2.9%CHANGE
18.1%CHANGE
8.0%CHANGE
60 BPSCHANGE
U.S. SHARE OF WALLET METRO SHARE OF WALLET
U.S.ANNUAL RENT
28.2%share of wallet
METROANNUAL RENT
20.1%share of wallet
THIRD QUARTER 2017
*August; **September

SUBMARKET BREAKDOWN
DALLAS-FORT WORTHMULTIFAMILY REPORT
THIRD QUARTER 2017
SUBMARKET NAME# OF
COMMUNITIES # OF UNITS SIZE (SF)PRICE
($ / MO.)RENTAL RATE($ / SF / MO.) OCCUPANCY
Downtown Dallas/West End/Deep Ellum 51 10,769 950 1,463 1.54 90.7%
Uptown/Oaklawn/Highland Park 152 33,616 925 1,642 1.78 87.7%
East Central Dallas/Lower Greenville Ave 52 6,215 865 1,311 1.52 88.8%
White Rock Lake/Tenison Park 69 14,994 803 849 1.06 93.5%
North Central Dallas/Upper Greenville Ave 107 28,442 807 1,125 1.39 88.5%
Skillman St/I-635 97 26,423 790 883 1.12 92.1%
Far East Dallas 21 3,619 934 1,054 1.13 93.2%
Garland 95 16,807 862 959 1.11 91.4%
North Dallas/Addison 114 31,246 893 1,128 1.26 93.6%
Far North Dallas/Collin County 78 24,522 795 1025 1.29 95.2%
East Plano/Richardson 93 25,453 933 1,238 1.33 86.4%
West Plano/Frisco 172 55,322 932 1,270 1.36 88.2%
Allen/McKinney 74 19,361 927 1,150 1.24 90.9%
East Irving 58 7,593 804 819 1.02 95.0%
West Irving 81 18,299 810 930 1.15 94.5%
Las Colinas/Valley Ranch/Coppell 80 29,061 909 1,275 1.40 91.7%
Northwest Dallas/Bachman Lake 59 11,273 792 837 1.06 95.8%
Carrollton/Farmers Branch 114 27,907 900 1,135 1.26 94.1%
West Lewisville/Flower Mound 73 21,427 881 1,102 1.25 93.8%
Denton 62 12,274 869 1,072 1.23 95.1%
Southeast Dallas/Mesquite 103 22,200 845 835 0.99 93.5%
Oak Cliff South 65 13,450 900 798 0.89 90.9%
Duncanville/DeSoto/Cedar Hill/Lancaster 91 19,902 859 884 1.03 93.3%
Far South Dallas/Waxahachie 25 3,127 917 995 1.09 96.4%
Trinity Groves/Oak Cliff North 41 7,481 845 1,129 1.34 86.2%
Grand Prairie 54 12,419 852 992 1.16 91.3%
Downtown Ft Worth/TCU 61 11,674 882 1,311 1.49 85.0%
East Ft Worth/Woodhaven/I-30E 69 12,616 831 793 0.95 91.8%
North Arlington 95 21,279 813 934 1.15 93.5%
South Arlington 137 27,852 848 929 1.10 94.9%
Haltom City/Richland Hills/Fossil Creek 70 16,960 903 1008 1.12 94.7%
Hurst/Euless/Bedford 130 30,273 845 983 1.16 94.6%
Grapevine/Roanoke/Keller 64 16,594 939 1,236 1.32 95.6%
Northwest Ft Worth/Saginaw/Eagle Mtn 29 4,922 939 889 0.95 95.1%
South Ft Worth 64 11,300 878 847 0.97 94.3%
Southwest Ft Worth/Benbrook 45 12,751 846 962 1.14 94.4%
Far Southwest Ft Worth 25 3,127 869 869 1.00 93.9%
Western Hills/Ridgmar/Ridglea 77 13,154 858 809 0.94 93.0%
TOTALS 2,947 685,704 871 1,077 1.24 92.1%
BERKADIA

CORPORATE HEADQUARTERS521 Fifth Avenue
20th FloorNew York, NY 10175
(646) 600-7800 | Fax: (646) 600-7838www.Berkadia.com
ALBUQUERQUE, NM
AMBLER, PA
ATLANTA, GA
AUSTIN, TX
BAKERSFIELD, CA
BATON ROUGE, LA
BETHESDA, MD
BIRMINGHAM, AL
BOCA RATON, FL
BOSTON, MA
CAMAS, WA
CHARLESTON, SC
CHATTANOOGA, TN
CHICAGO, IL
CLEARWATER, FL
CLEVELAND, OH
COLORADO SPRINGS, CO
DALLAS, TX
DENVER, CO
DETROIT, MI
EL SEGUNDO, CA
FRESNO, CA
HOUSTON, TX
IRVINE, CA
JACKSONVILLE, FL
KANSAS CITY, MO
LAS VEGAS, NV
LENOX, MA
LOS ANGELES, CA
MARBLEHEAD, MA
MIAMI, FL
MIDVALE, UT
MURRIETA, CA
NASHVILLE, TN
NEW YORK, NY
NEWPORT NEWS, VA
ORLANDO, FL
PASADENA, CA
PHILADELPHIA, PA
PHOENIX, AZ
PORTLAND, OR
RALEIGH, NC
RICHMOND, VA
SACRAMENTO, CA
SALT LAKE CITY, UT
SAN ANTONIO, TX
SAN DIEGO, CA
SAN FRANCISCO, CA
SCOTTSDALE, AZ
SEATTLE, WA
SHREWSBURY, NJ
ST. LOUIS, MO
TACOMA, WA
TAMPA, FL
TEMECULA, CA
TEMPE, AZ
TUCSON, AZ
WOODLAND HILLS, CA
HYDERABAD - INDIA*
*Back Office Support
© 2017 Berkadia Proprietary Holding LLC Berkadia® is a trademark of Berkadia Proprietary Holding LLC.Axiometrics® is a trademark of Axiometrics Inc.Commercial mortgage loan origination and servicing businesses are conducted exclusively by Berkadia Commercial Mortgage LLC and Berkadia Commercial Mortgage Inc. This website is not intended to solicit commercial mortgage loan brokerage business in Nevada. Investment sales and real estate brokerage businesses are conducted exclusively by Berkadia Real Estate Advisors LLC and Berkadia Real Estate Advisors Inc. For state licensing details for the above entities, visit: www.berkadia.com/legal/licensing.aspx
a Berkshire Hathaway and Leucadia National company

MARKET AT A GLANCE
OCCUPANCY AND RENT TRENDS
a Berkshire Hathaway and Leucadia National company
DALLAS-FORT WORTHMULTIFAMILY REPORT SECOND QUARTER 2017
EMPLOYMENT EXPANDS 3.2% ANNUALLY AMID 2.1% HOUSEHOLD GROWTH
The addition of more than 55,600 households in the Dallas-Fort Worth metro area in the last four quarters drove a 28.5% increase in single-family home sales and spurred multifamily developers to continue building apartments. Since mid-2016, builders delivered 21,498 apartment units, 47.9% of which came online in the first half of this year. New inventory was most prevalent in the neighboring West Plano/Frisco and East Plano/Richardson submarkets, which together accounted for nearly one-third of new product over the last four quarters. Multifamily deliveries were also numerous in the close-in submarkets of Downtown Dallas/West End/Deep Ellum and Uptown/Oaklawn/Highland, which made up 15% of metrowide completions. Household growth fueled apartment demand, resulting in the absorption of 13,808 units since June of last year. The healthy leasing activity trailed the 21,498 units that were delivered during the same period. Consequently, metrowide occupancy was 92.3% in June of this year, 90 basis points lower than one year prior. Operators kept upward pressure on rents, despite the decrease in occupancy. By mid-year, average effective rent was $1,066 per month, 4.4% higher than the same period in 2016.
$700
$800
$900
$1,000
$1,100
90%
91%
92%
93%
94%
3Q12 1Q13 3Q13 1Q14 3Q14 1Q15 3Q15 1Q16 3Q16 1Q17
OCCUPANCY AND RENT TRENDS
Occupancy Rate Effective Rent
OCCUPANCYRATE
EFFECTIVERENT
92.3%
$1,066
Down 90 bps since 2Q16
Up 4.4% since 2Q16

DELIVERIES AND DEMAND
ECONOMIC TRENDS
BERKADIA
DALLAS-FORT WORTHMULTIFAMILY REPORT
DELIVERIES
NETABSORPTION
10,307
9,083
Units YTD
Units YTD 0
6,000
12,000
18,000
24,000
2012 2013 2014 2015 2016 2017*
DELIVERIES AND DEMAND
Deliveries Demand*Year to date
UNEMPLOYMENT*2016 2017
EMPLOYMENT*2016 2017
EXISTING SFH SALES**2016 2017
MEDIAN SFH PRICE**2016 2017
10-YEAR TREASURY**2016 2017
3.9%
3.49m
110.7k
$223.0k
1.64%
4.2%
3.60m
142.2k
$250.9k
2.19%
The Dallas-Fort Worth metro area was one of a minority of metro areas in the U.S. with accelerating job growth. Local employers hired 110,800 workers since May of 2016, a 3.2% yearly increase, compared to 3.1% annual job growth in the prior year. Employment surged 5.3% in the professional and business services segment as companies recruited 30,800 workers since May of 2016. The trade, transportation, and utilities sector grew 3.1% with 22,800 new hires. The sector was underpinned by hundreds of new logistics jobs created among Amazon.com Inc., United Parcel Service, and S&S Activewear LLC. In the leisure and hospitality industry, 17,500 jobs were created, a 4.8% year-over-year increase. The initial hiring of hundreds of new workers at McKesson Corporation in Irving lifted the education and health services segment, which expanded 3.1% with 13,400 new jobs. Rounding out the high-growth employment sectors was the financial activities industry, which grew 3.4% annually, boosted by aggressive hiring at General Motors Financial Company Inc. and Liberty Mutual Group.
30 BPSCHANGE
3.2%CHANGE
28.5%CHANGE
12.5%CHANGE
60 BPSCHANGE
U.S. SHARE OF WALLET METRO SHARE OF WALLET
U.S.ANNUAL RENT
27.3%share of wallet
METROANNUAL RENT
20.3%share of wallet
SECOND QUARTER 2017
*May; **June

© 2017 Berkadia Real Estate Advisors LLCBerkadia® is a registered trademark of Berkadia Proprietary Holding LLCDocument sources: Axiometrics; Moody’s; Berkadia Research; Apartment Data Services
SUBMARKET BREAKDOWN
BERKADIA
DALLAS-FORT WORTHMULTIFAMILY REPORT
SECOND QUARTER 2017
SUBMARKET NAME# OF
COMMUNITIES # OF UNITS SIZE (SF)PRICE
($ / MO.)RENTAL RATE($ / SF / MO.) OCCUPANCY
Downtown Dallas/West End/Deep Ellum 51 10,769 950 1,484 1.56 90.2%
Uptown/Oaklawn/Highland Park 149 32,873 926 1,647 1.78 87.8%
East Central Dallas/Lower Greenville Ave 52 6,215 865 1,296 1.50 86.6%
White Rock Lake/Tenison Park 69 14,994 803 845 1.05 93.8%
North Central Dallas/Upper Greenville Ave 107 28,259 805 1,130 1.40 88.3%
Skillman St/I-635 96 26,325 790 873 1.11 92.4%
Far East Dallas 21 3,619 934 1,059 1.13 90.8%
Garland 94 16,698 862 947 1.10 91.1%
North Dallas/Addison 114 31,246 893 1,123 1.26 93.3%
Far North Dallas/Collin County 78 24,522 795 1008 1.27 94.6%
East Plano/Richardson 90 24,501 936 1,220 1.30 88.0%
West Plano/Frisco 167 53,842 932 1,251 1.34 87.1%
Allen/ McKinney 72 18,756 926 1,144 1.24 89.1%
East Irving 57 7,539 802 796 0.99 95.9%
West Irving 81 18,299 810 924 1.14 95.5%
Las Colinas/Valley Ranch/Coppell 78 28,327 909 1,261 1.39 93.4%
Northwest Dallas/Bachman Lake 60 11,374 790 827 1.05 96.3%
Carrollton/Farmers Branch 114 27,907 900 1,118 1.24 94.6%
Lewisville/Flower Mound 72 21,229 881 1,093 1.24 94.2%
Denton 62 12,274 869 1,064 1.22 94.8%
Southeast Dallas/Mesquite 103 22,200 845 822 0.97 94.1%
Oak Cliff South 65 13,450 900 794 0.88 93.1%
Duncanville/DeSoto/Cedar Hill/Lancaster 91 19,902 859 872 1.02 95.1%
Far South Dallas/Waxahachie 25 3,127 917 974 1.06 96.3%
Trinity Groves/Oak Cliff North 40 7,175 847 1,109 1.31 86.5%
Grand Prairie 53 12,067 850 973 1.15 93.6%
Downtown Ft Worth/TCU 59 11,075 881 1,291 1.47 86.2%
East Ft Worth/Woodhaven/I-30E 69 12,616 831 785 0.95 92.0%
North Arlington 95 21,279 813 924 1.14 93.9%
South Arlington 137 27,852 849 921 1.09 95.3%
Haltom City/ Richland Hills/Fossil Creek 70 16,960 903 1004 1.11 95.4%
Hurst/Euless/Bedford 130 30,273 845 980 1.16 94.7%
Grapevine/Roanoke/Keller 64 16,594 939 1,225 1.31 95.2%
Northwest Ft Worth/Saginaw/Eagle Mtn 29 4,922 939 890 0.95 95.9%
South Ft Worth 64 11,300 878 831 0.95 93.4%
Southwest Ft Worth/Benbrook 45 12,751 846 944 1.12 93.6%
Far Southwest Ft Worth 23 2,726 881 846 0.96 96.3%
Western Hills/Ridgmar/Ridglea 77 13,154 860 799 0.93 93.5%
TOTALS 2,923 678,991 871 1,066 1.22 92.3%

CORPORATE HEADQUARTERS 521 Fifth Avenue
20th Floor New York, NY 10175
(646) 600-7800 | Fax : (646) 600-7838www.Berkadia.com
a Berkshire Hathaway and Leucadia National company
ALBUQUERQUE, NM
AMBLER, PA
ATLANTA, GA
AUSTIN, TX
BAKERSFIELD, CA
BATON ROUGE, LA
BIRMINGHAM, AL
BOCA RATON, FL
BOSTON, MA
CAMAS, WA
CAPISTRANO BEACH, CA
CHARLESTON, SC
CHATTANOOGA, TN
CHICAGO, IL
CLEARWATER, FL
COLORADO SPRINGS, CO
DALLAS, TX
DC METRO
DENVER, CO
DETROIT, MI
EL SEGUNDO, CA
FRESNO, CA
HOUSTON, TX
IRVINE, CA
JACKSONVILLE, FL
KANSAS CITY, MO
LAS VEGAS, NV
LEAWOOD, KS
LOS ANGELES, CA
MANCHESTER, MA
MARBLEHEAD, MA
MEMPHIS, TN
MIAMI, FL
MIDVALE, UT
NASHVILLE, TN
NEW YORK, NY
NEWPORT BEACH, CA
NEWPORT NEWS, VA
OKLAHOMA CITY, OK
ONTARIO, CA
ORLANDO, FL
PASADENA, CA
PHILADELPHIA, PA
PHOENIX, AZ
PORTLAND, OR
RALEIGH, NC
RICHMOND, VA
SACRAMENTO, CA
SALT LAKE CITY, UT
SAN ANTONIO, TX
SAN DIEGO, CA
SAN FRANCISCO, CA
SCOTTSDALE, AZ
SEATTLE, WA
SHREWSBURY, NJ
ST. LOUIS, MO
TACOMA, WA
TAMPA, FL
TEMECULA, CA
TEMPE, AZ
THE PLAINS, CA
TROY, MI
TUCSON, AZ
TULSA, OK
WAUKESHA, WA
WOODLAND HILLS, CA
HYDERABAD - INDIA*
*Back Office Support

MARKET AT A GLANCE
OCCUPANCY AND RENT TRENDS
a Berkshire Hathaway and Leucadia National company
DALLAS-FORT WORTHMULTIFAMILY REPORT FIRST QUARTER 2017
OCCUPANCYRATE
EFFECTIVERENT
92.4%
$1,043
EFFECTIVE RENT RISES 5.0% ANNUALLY AMID 3.9% JOB GROWTH
From March of 2015 to March of last year, effective rent increased 7.9% in the Dallas-Fort Worth metro area. In the most recent 12 months, rent appreciation decelerated, though remained healthy. Operators, responding to sustained job growth, increased effective rent 5.0% since March of 2016 to $1,043 per month in March of this year. The majority of rent growth occurred in the first six months of the 12-month period. In the most recent six months, effective rent increased in 27 of the 38 submarkets in the Metroplex. During that time, effective rent advanced at a 5.2% rate in the Trinity Groves/Oak Cliff North submarket west of downtown Dallas and in the North Central Dallas/Upper Greenville Avenue submarket, the two areas with the greatest rate of appreciation. Builders completed 19,600 multifamily units in 2016 and 3,908 units in the first quarter of this year. Meanwhile, absorption totaled 14,704 apartments in 2016 and 2,944 apartments so far in 2017. The supply imbalance fueled a 60-basis-point, year-over-year reduction in occupancy to 92.4% by the end of the first quarter of this year.
$950
$975
$1,000
$1,025
$1,050
$1,075
90%
91%
92%
93%
94%
95%
Aug. 15 Oct. 15 Dec. 15 Feb. 16 Apr. 16 Jun. 16 Aug. 16 Oct. 16 Dec. 16 Feb. 17
OCCUPANCY AND RENT TRENDS
Occupancy Rate Effective Rent
Down 60 bps since 1Q16
Up 5.0% since 1Q16

DELIVERIES AND DEMAND
ECONOMIC TRENDS
BERKADIA
DALLAS-FORT WORTHMULTIFAMILY REPORT
DELIVERIES
NETABSORPTION
Units YTD
Units YTD
UNEMPLOYMENT*2016 2017
EMPLOYMENT*2016 2017
EXISTING SFH SALES**2016 2017
MEDIAN SFH PRICE**2016 2017
10-YEAR TREASURY**2016 2017
FIRST QUARTER 2017
*January; **March
3,908
2,9440
5,000
10,000
15,000
20,000
2012 2013 2014 2015 2016 2017*
DELIVERIES AND DEMAND
Deliveries Demand*Year to date
3.9% -10 BPSCHANGE
3.8%
3.46m 3.9%CHANGE
3.60m
123.0k 5.2%CHANGE
129.4k
$219.7k 7.7%CHANGE
$236.7k
1.89% 60 BPSCHANGE
2.48%
The Dallas-Fort Worth area remained one of the prime metro areas for job growth in the country. In the 12-month period ending in January of 2017, employers added 135,500 workers to payrolls, a 3.9% year-over-year increase. Companies in the trade, transportation, and utilities sector created 31,400 jobs, a 4.3% annual gain. A 6.5% yearly increase occurred in the leisure and hospitality industry, where 23,300 jobs were added. Over the next few years, the leisure and hospitality industry is expected to expand further following the opening of a $330 million waterpark resort in Grapevine that will support 1,000 jobs. Additionally, the first of 1,025 jobs will be filled in 2018 at the $250 million first phase of the Texas Live! entertainment district in Arlington. An influx of high-paying, white-collar jobs is anticipated this year as Toyota Motor Company hires 1,000 workers at its North American Headquarters in addition to 3,000 transplanted associates from other states. Meanwhile, Liberty Mutual will fill the first of 2,400 positions this year at its new insurance operations center in Plano.
U.S. SHARE OF WALLET
U.S.ANNUAL RENT
27.0%share of wallet
METRO SHARE OF WALLET
METROANNUAL RENT
20.1%share of wallet

© 2017 Berkadia Real Estate Advisors LLCBerkadia® is a registered trademark of Berkadia Proprietary Holding LLCDocument sources: Axiometrics; Moody’s; Berkadia Research
SUBMARKET BREAKDOWN
BERKADIA
DALLAS-FORT WORTHMULTIFAMILY REPORT
FIRST QUARTER 2017
SUBMARKET NAME# OF
COMMUNITIES # OF UNITS SIZE (SF)PRICE
($ / MO.)RENTAL RATE($ / SF / MO.) OCCUPANCY
Downtown Dallas/ West End/ Deep Ellum 49 10,336 955 1,437 150.50 90.9%
Uptown/ Oaklawn/ Highland Park 147 31,979 923 1,607 174.10 88.0%
East Central Dallas/ Lower Greenville Ave 51 5,896 865 1,302 150.50 88.7%
White Rock Lake/ Tenison Park 69 14,994 803 826 102.90 93.9%
North Central Dallas/ Upper Greenville Ave 106 27,987 806 1,100 136.50 88.5%
Skillman St/ I-635 96 26,325 790 866 109.60 92.5%
Far East Dallas 20 3,500 939 1,035 110.20 87.9%
Garland 92 16,253 863 918 106.40 93.1%
North Dallas/ Addison 113 30,925 894 1,111 124.30 93.8%
Far North Dallas/ Collin County 78 24,522 795 987 124.20 95.2%
East Plano/ Richardson 88 23,925 936 1,199 128.10 87.9%
West Plano/ Frisco 162 51,806 932 1,228 131.80 88.0%
Allen/ McKinney 70 18,152 929 1,119 120.50 88.6%
East Irving 57 7,539 802 790 98.50 95.7%
West Irving 81 18,299 810 916 113.10 95.5%
Las Colinas/ Valley Ranch/ Coppell 77 27,958 910 1,226 134.70 93.2%
Northwest Dallas/ Bachman Lake 60 11,374 790 812 102.80 96.0%
Carrollton/ Farmers Branch 114 27,724 899 1,101 122.50 94.3%
Lewisville/ Flower Mound 72 21,229 881 1,071 121.60 93.7%
Denton 62 12,274 869 1,041 119.80 94.2%
Southeast Dallas/ Mesquite 103 22,200 845 819 96.90 94.5%
Oak Cliff South 65 13,450 899 770 85.70 92.4%
Duncanville/ DeSoto/ Cedar Hill/ Lancaster 90 19,870 859 855 99.50 95.0%
Far South Dallas/ Waxahachie 24 3,007 919 957 104.10 97.3%
Trinity Groves/ Oak Cliff North 40 7,175 847 1,090 128.70 84.5%
Grand Prairie 52 11,820 849 940 110.70 95.3%
Downtown Ft Worth/ TCU 58 10,817 883 1,264 143.10 85.4%
East Ft Worth/ Woodhaven/ I-30E 69 12,616 831 755 90.90 92.1%
North Arlington 95 21,279 813 911 112.10 94.2%
South Arlington 137 27,852 849 902 106.20 95.3%
Haltom City/ Richland Hills/ Fossil Creek 70 16,960 903 981 108.60 95.8%
Hurst/ Euless/ Bedford 129 29,956 845 958 113.40 95.3%
Grapevine/ Roanoke/ Keller 64 16,594 939 1,198 127.60 93.9%
Northwest Ft Worth/ Saginaw/ Eagle Mtn 29 4,922 939 864 92.00 93.8%
South Ft Worth 63 11,215 878 821 93.50 92.4%
Southwest Ft Worth/ Benbrook 45 12,751 846 932 110.20 92.0%
Far Southwest Ft Worth 23 2,764 882 842 95.50 95.5%
Western Hills/ Ridgmar/ Ridglea 77 13,154 860 786 91.40 92.5%
TOTALS 2,897 671,399 870 1,043 119.90 92.4%

CORPORATE HEADQUARTERS 521 Fifth Avenue
20th Floor New York, NY 10175
(646) 600-7800 | Fax : (646) 600-7838www.Berkadia.com
a Berkshire Hathaway and Leucadia National company
ALBUQUERQUE, NM
AMBLER, PA
ATLANTA, GA
AUSTIN, TX
BAKERSFIELD, CA
BATON ROUGE, LA
BIRMINGHAM, AL
BOCA RATON, FL
BOSTON, MA
CAMAS, WA
CHARLESTON, SC
CHATTANOOGA, TN
CHEVY CHASE, MD
CHICAGO, IL
CLEARWATER, FL
CLEVELAND, OH
COLORADO SPRINGS, CO
DALLAS, TX
DENVER, CO
DETROIT, MI
EL SEGUNDO, CA
FRESNO, CA
HOUSTON, TX
IRVINE, CA
JACKSONVILLE, FL
KANSAS CITY, MO
LAS VEGAS, NV
LENOX, MA
LOS ANGELES, CA
MARBLEHEAD, MA
MIAMI, FL
MIDVALE, UT
MURRIETA, CA
NASHVILLE, TN
NEW YORK, NY
NEWPORT NEWS, VA
ORLANDO, FL
PASADENA, CA
PHILADELPHIA, PA
PHOENIX, AZ
PORTLAND, OR
RALEIGH, NC
RICHMOND, VA
SACRAMENTO, CA
SALT LAKE CITY, UT
SAN ANTONIO, TX
SAN DIEGO, CA
SAN FRANCISCO, CA
SCOTTSDALE, AZ
SEATTLE, WA
SHREWSBURY, NJ
ST. LOUIS, MO
TACOMA, WA
TAMPA, FL
TEMECULA, CA
TEMPE, AZ
TUCSON, AZ
WOODLAND HILLS, CA
HYDERABAD - INDIA*
*Back Office Support

MARKET AT A GLANCE
OCCUPANCY AND RENT TRENDS
a Berkshire Hathaway and Leucadia National company
DALLAS-FORT WORTHMULTIFAMILY REPORT THIRD QUARTER 2016
EFFECTIVE RENT APPRECIATES 6.7% ANNUALLY AS JOB GROWTH CONTINUES
Vibrant job growth kept apartment demand elevated in the Dallas-Fort Worth metro area in the first three quarters of 2016. Renters occupied 13,409 additional apartments, on pace to absorb a total of approximately 17,880 apartments by year-end. In 2015, 19,783 apartments were absorbed. More than 20% of year-to-date leasing activity occurred in Plano, Richardson, and Frisco. Significant apartment demand was also present in the Uptown/Oaklawn/Highland Park area. Multifamily builders were also active since the beginning of this year, completing 11,488 apartment units metrowide. Lease up of apartments at approximately 80 apartment communities under construction is expected through the end of the third quarter of 2017. When these apartment communities are completed, more than 22,800 units will be added to local multifamily inventory. Operators recorded 93.4% occupancy at the end of the third quarter of this year, the same as one year prior. During the same period, effective rent appreciated 6.7% to 1,031 per month.
$900
$950
$1,000
$1,050
$1,100
90%
91%
92%
93%
94%
Feb. 15 Apr. 15 Jun. 15 Aug. 15 Oct. 15 Dec. 15 Feb. 16 Apr. 16 Jun. 16 Aug. 16
OCCUPANCY AND RENT TRENDS
Occupancy Rate Effective Rent
OCCUPANCYRATE
EFFECTIVERENT
93.4%
$1,031
Unchanged since 3Q15
Up 6.7% since 3Q15

DELIVERIES AND DEMAND
ECONOMIC TRENDS
BERKADIA
DALLAS-FORT WORTHMULTIFAMILY REPORT
DELIVERIES
NETABSORPTION
11,488
13,409
Units YTD
Units YTD 0
5,000
10,000
15,000
20,000
25,000
2011 2012 2013 2014 2015 2016*
DELIVERIES AND DEMAND
Deliveries Demand*Year to date
UNEMPLOYMENT*2015 2016
EMPLOYMENT*2015 2016
EXISTING SFH SALES**2015 2016
MEDIAN SFH PRICE**2015 2016
10-YEAR TREASURY**2015 2016
4.0%
3.41m
116.8k
$205.9k
2.17%
3.8%
3.54m
130.5k
$224.3k
1.63%
Employment in the Dallas-Fort Worth area expanded at a 3.5% annual rate since August of 2015. Companies in the Metroplex added 120,800 workers to payrolls during that time. In the trade, transportation, and utilities sector, businesses hired 32,500 workers, a 4.5% annual gain. Distribution-center employment surged with 2,000 newly created jobs among Amazon’s fulfillment centers in Dallas, Haslet, and Coppell and the first of 500 jobs filled at the new Ulta Beauty logistics center in Dallas. In the financial activities industry, 17,800 workers were recruited, a 6.4% increase. The industry was supported by the hiring of 1,000 workers at State Farm and 250 newly created jobs at Thomson Reuters in Carrollton. Sustained expansion in the financial activities industry is expected as Liberty Mutual hires the first of 2,400 new recruits in 2017. Also in 2017, Toyota Motor Corporation’s North American headquarters in Plano is expected to be completed, with approximately 3,000 employees transferring from other states and another 1,000 workers hired locally.
-20 BPSCHANGE
3.5%CHANGE
11.7%CHANGE
8.9%CHANGE
-50 BPSCHANGE
U.S.ANNUAL RENT
28.0%share of wallet
METROANNUAL RENT
20.2%share of wallet
THIRD QUARTER 2016
*August; **September

© 2016 Berkadia Real Estate Advisors LLCBerkadia® is a registered trademark of Berkadia Proprietary Holding LLCDocument sources: Axiometrics; Moody’s; Berkadia Research
SUBMARKET BREAKDOWN
BERKADIA
DALLAS-FORT WORTHMULTIFAMILY REPORT
THIRD QUARTER 2016
SUBMARKET NAME# OF
COMMUNITIES # OF UNITS SIZE (SF)PRICE
($ / MO.)RENTAL RATE($ / SF / MO.) OCCUPANCY
Downtown Dallas / West End / Deep Ellum 49 10,336 957 1,445 1.51 89.2%
Uptown / Oaklawn / Highland Park 140 29,999 930 1,630 1.75 90.7%
East Central Dallas / Lower Greenville Ave 50 5,532 859 1,254 1.46 95.3%
White Rock Lake / Tenison Park 69 14,994 802 807 1.01 94.0%
North Central Dallas / Upper Greenville Ave 99 26,702 795 1,046 1.32 90.8%
Skillman St / I-635 95 26,068 789 826 1.05 92.4%
Far East Dallas 19 3,280 932 1,034 1.11 96.6%
Garland 92 15,672 858 897 1.05 95.8%
North Dallas / Addison 112 30,671 894 1,103 1.23 94.7%
Far North Dallas / Collin County 78 24,522 794 999 1.26 95.7%
East Plano / Richardson 84 22,742 937 1,213 1.30 92.9%
West Plano / Frisco 157 49,782 931 1,245 1.34 90.2%
Allen / McKinney 68 17,253 931 1,159 1.25 91.0%
East Irving 57 7,539 802 765 0.95 96.3%
West Irving 81 18,299 810 885 1.09 95.1%
Las Colinas / Valley Ranch / Coppell 76 27,653 909 1,225 1.35 93.8%
Northwest Dallas / Bachman Lake 61 11,451 788 805 1.02 95.7%
Carrollton / Farmers Branch 114 27,724 899 1,093 1.22 93.7%
Lewisville / Flower Mound 72 21,229 881 1,089 1.24 93.5%
Denton 62 12,274 869 1,053 1.21 95.9%
Southeast Dallas / Mesquite 102 22,047 845 812 0.96 94.3%
Oak Cliff South 63 13,085 897 752 0.84 92.5%
Duncanville / DeSoto / Cedar Hill / Lancaster 90 19,870 859 831 0.97 94.2%
Far South Dallas / Waxahachie 24 3,007 919 971 1.06 96.8%
Trinity Groves / Oak Cliff North 38 6,472 849 1,036 1.22 90.7%
Grand Prairie 52 11,820 849 921 1.09 92.8%
Downtown Ft Worth / TCU 55 10,056 879 1,255 1.43 91.4%
East Ft Worth / Woodhaven / I-30E 68 12,536 831 737 0.89 91.0%
North Arlington 95 21,278 813 885 1.09 93.8%
South Arlington 137 27,803 847 882 1.04 94.7%
Haltom City / Richland Hills / Fossil Creek 70 16,959 903 957 1.06 95.9%
Hurst / Euless / Bedford 129 29,956 845 947 1.12 95.5%
Grapevine / Roanoke / Keller 62 15,879 938 1,206 1.29 95.6%
Northwest Ft Worth / Saginaw / Eagle Mtn 28 4,728 941 842 0.90 95.2%
South Ft Worth 62 11,034 876 796 0.91 93.4%
Southwest Ft Worth / Benbrook 45 12,376 843 909 1.08 95.0%
Far Southwest Ft Worth 23 2,764 882 847 0.96 92.4%
Western Hills / Ridgmar / Ridglea 76 13,054 855 754 0.88 93.2%
TOTALS 2,854 658,446 869 1,031 1.19 93.4%

DALLAS | FT. WORTHSECOND QUARTER 2016
VACANCY & RENT PERMITS & DELIVERIES EMPLOYMENT GROWTH
VACANCY & RENT COMPARISON
For a full list of Dallas | Ft. Worth submarkets, visit apartmentupdate.com/report/2228
The Dallas-Fort Worth-Arlington metro area held its position as one of the brightest economic centers in the country in the first half of2016. Companies in the Metroplex hired 120,800 workers, a 3.6% year-over-year increase. The trade, transportation and utilities sectorwas the leader in job growth, with 36,800 newly created jobs, a 5.1% increase. The addition of 2,000 workers at Amazon's SouthDallas, Haslet and Coppell distribution centers underpinned the sector. Leisure and hospitality industry job growth ramped up 5.7% as19,700 workers were recruited. Early this year, the initial hiring of 1,000 associates at State Farm's campus in Richardson supported the5.5% overall rise in employment in the financial activities sector, where 15,100 workers were added to local payrolls.
The median single-family home price was $222,600 at the end of the second quarter of this year. Home values were 7.6% greater thanone year ago. During the same period, single-family sales velocity rose 2.5% as annualized transactions totaled 123,200 homes.
Leasing activity this year totaled 6,600 apartments. Of the 38 submarkets in the Metroplex, more than 10% of year-to-date apartmentdemand was in the Central Dallas submarket.
Approximately 5,750 apartments were added to inventory so far this year. Over the remainder of 2016, more than 16,300 apartmentsare expected to be completed, one-quarter of which are slated for the neighboring submarkets of Richardson andPlano/Allen/McKinney. Completions in the Richardson submarket will be timely in accommodating new hires at the State Farm Campus.
Multifamily developers demonstrated confidence in sustained apartment demand, requesting 24,990 annualized permits. This heightedplanning activity was 81% greater than annualized issuance one year ago.
The average mortgage exceeded the average apartment rent by $211 per month in the metro area, making apartment living anattractive option for many households. This demand was a factor in the 30-basis-point reduction in vacancy in the last 12 months as thevacancy rate descended to 4.3%.
Operators capitalized on sustained apartment demand, increasing asking rent 5.8% in the last four quarters to $1,087 per month. Rentgrowth accelerated from the 4.9% rise during the previous year. Meanwhile, effective rent advanced 6.1% in the last four quarters to$1,083 per month.
Berkadia.com | ApartmentUpdate.com
DALLAS OFFICE | 972.458.7300 ©2016 Berkadia Real Estate Advisors LLC
a Berkshire Hathaway and Leucadia National company For sources & disclaimer: apartmentupdate.com/sources
DALLAS | FT. WORTHFIRST QUARTER 2015
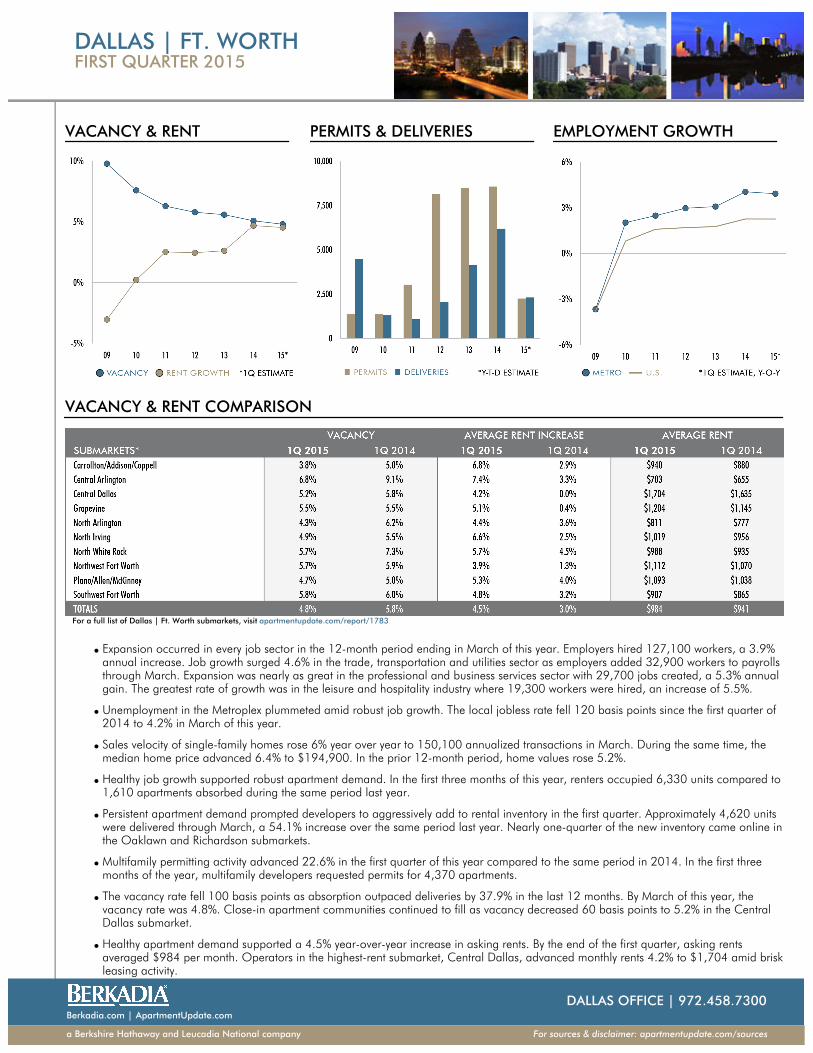
VACANCY & RENT PERMITS & DELIVERIES EMPLOYMENT GROWTH
VACANCY & RENT COMPARISON
For a full list of Dallas | Ft. Worth submarkets, visit apartmentupdate.com/report/1783
Expansion occurred in every job sector in the 12-month period ending in March of this year. Employers hired 127,100 workers, a 3.9%annual increase. Job growth surged 4.6% in the trade, transportation and utilities sector as employers added 32,900 workers to payrollsthrough March. Expansion was nearly as great in the professional and business services sector with 29,700 jobs created, a 5.3% annualgain. The greatest rate of growth was in the leisure and hospitality industry where 19,300 workers were hired, an increase of 5.5%.
Unemployment in the Metroplex plummeted amid robust job growth. The local jobless rate fell 120 basis points since the first quarter of2014 to 4.2% in March of this year.
Sales velocity of single-family homes rose 6% year over year to 150,100 annualized transactions in March. During the same time, themedian home price advanced 6.4% to $194,900. In the prior 12-month period, home values rose 5.2%.
Healthy job growth supported robust apartment demand. In the first three months of this year, renters occupied 6,330 units compared to1,610 apartments absorbed during the same period last year.
Persistent apartment demand prompted developers to aggressively add to rental inventory in the first quarter. Approximately 4,620 unitswere delivered through March, a 54.1% increase over the same period last year. Nearly one-quarter of the new inventory came online inthe Oaklawn and Richardson submarkets.
Multifamily permitting activity advanced 22.6% in the first quarter of this year compared to the same period in 2014. In the first threemonths of the year, multifamily developers requested permits for 4,370 apartments.
The vacancy rate fell 100 basis points as absorption outpaced deliveries by 37.9% in the last 12 months. By March of this year, thevacancy rate was 4.8%. Close-in apartment communities continued to fill as vacancy decreased 60 basis points to 5.2% in the CentralDallas submarket.
Healthy apartment demand supported a 4.5% year-over-year increase in asking rents. By the end of the first quarter, asking rentsaveraged $984 per month. Operators in the highest-rent submarket, Central Dallas, advanced monthly rents 4.2% to $1,704 amid briskleasing activity.
Berkadia.com | ApartmentUpdate.com
DALLAS OFFICE | 972.458.7300
a Berkshire Hathaway and Leucadia National company For sources & disclaimer: apartmentupdate.com/sources