
Device Health Estimation by Combining Contextual Control ... · Information with Sensor Data and...
11
Device Health Estimation by Combining Contextual Control Information with Sensor Data and Device Health Prognostics Utilizing Restricted Boltzmann Machine Linxia Liao 1 , Tomonori Honda 2 , and Radu Pavel 3 1,2 Palo Alto Research Center, 3333 Coyote Hill Road, Palo Alto, CA, 94304, USA [email protected] [email protected] 3 TechSolve, Inc., 6705 Steger Dr, Cincinnati, OH, 45237, USA [email protected] ABSTRACT The goal of this work is to bridge the gap between business decision-making and real-time factory data. Beyond real- time data collection, we aim to provide analysis capability to obtain insights from the data and converting the learnings into actionable recommendations. For device health estimation, we focus on analyzing device health conditions and propose a data fusion method that com- bines sensor data with limited diagnostic signals with the de- vice’s operating context. We propose a segmentation algo- rithm that provides a temporal representation of the device’s operation context, which is combined with sensor data to fa- cilitate device health estimation. Sensor data is decomposed into features by time-domain and frequency-domain analy- sis. Principal component analysis is used to project the high- dimensional feature space into a low-dimensional space fol- lowed by a linear discriminant analysis to search the optimal separation among different device health conditions. Our in- dustrial experimental results show that by combining device operating context with sensor data, our proposed segmenta- tion and linear transformation approach can accurately iden- tify various device imbalance conditions even for limited sen- sor data which could not be used to diagnose imbalance on its own. For device health prediction, we propose a restricted Boltz- mann machine based method to automatically generate fea- tures that can be used for remaining useful life prediction, which is performed by a random forest regression algorithm. The proposed method was validated through run-to-failure dataset of a machine tool spindle test-bed. Linxia Liao et al. This is an open-access article distributed under the terms of the Creative Commons Attribution 3.0 United States License, which permits unrestricted use, distribution, and reproduction in any medium, provided the original author and source are credited. 1. I NTRODUCTION The growing Internet of Things is predicted to connect 30 bil- lion devices by 2020 (MacGillivray, Turner, & Lund, 2013). This will bring in tremendous amounts of data and drive the innovations needed to realize the vision of Industry 4.0— Cyber-Physical systems monitoring physical processes, and communicating and cooperating with each other and with hu- mans in real time. One of the key challenges to be addressed is how to analyze large amounts of data to provide useful and actionable information for businesses intelligence and deci- sion making. In particular, to prevent unexpected downtime and its significant impact on overall equipment effectiveness (OEE) and total cost of ownership (TCO) in many industries. Continuous monitoring of equipment, early detection of in- cipient faults, and prediction of failure before it happens can support optimal maintenance strategies, prevent downtime, increase productivity, and reduce costs. A significant number of anomaly detection and diagnosis methods have been proposed for device fault detection and health condition estimation. Chandola et al. (Chandola, Banerjee, & Kumar, 2009) discusses various categories of anomaly detection technologies and their assumptions as well as their computational complexity. Several approaches such as statistical methods (Markou & Singh, 2003), neural net- work methods (Markos & Singh, 2003) and reliability meth- ods (Guo, Watson, Tavner, & Xiang, 2009), have been ap- plied to detect anomalies for various types of equipment. The philosophies and techniques of monitoring and predict- ing machine health with the goal of improving reliability and reducing unscheduled downtime of rotary machines are pre- sented by Lee et al. (Lee et al., 2014). Many of these methods focus on analyzing, combining, and modeling sensor data (e.g. vibration, current, acoustics sig- 1
Transcript of Device Health Estimation by Combining Contextual Control ... · Information with Sensor Data and...

Device Health Estimation by Combining Contextual ControlInformation with Sensor Data and Device Health Prognostics
Utilizing Restricted Boltzmann MachineLinxia Liao1, Tomonori Honda2, and Radu Pavel3
1,2 Palo Alto Research Center, 3333 Coyote Hill Road, Palo Alto, CA, 94304, [email protected]
3 TechSolve, Inc., 6705 Steger Dr, Cincinnati, OH, 45237, [email protected]
ABSTRACT
The goal of this work is to bridge the gap between businessdecision-making and real-time factory data. Beyond real-time data collection, we aim to provide analysis capabilityto obtain insights from the data and converting the learningsinto actionable recommendations.
For device health estimation, we focus on analyzing devicehealth conditions and propose a data fusion method that com-bines sensor data with limited diagnostic signals with the de-vice’s operating context. We propose a segmentation algo-rithm that provides a temporal representation of the device’soperation context, which is combined with sensor data to fa-cilitate device health estimation. Sensor data is decomposedinto features by time-domain and frequency-domain analy-sis. Principal component analysis is used to project the high-dimensional feature space into a low-dimensional space fol-lowed by a linear discriminant analysis to search the optimalseparation among different device health conditions. Our in-dustrial experimental results show that by combining deviceoperating context with sensor data, our proposed segmenta-tion and linear transformation approach can accurately iden-tify various device imbalance conditions even for limited sen-sor data which could not be used to diagnose imbalance on itsown.
For device health prediction, we propose a restricted Boltz-mann machine based method to automatically generate fea-tures that can be used for remaining useful life prediction,which is performed by a random forest regression algorithm.The proposed method was validated through run-to-failuredataset of a machine tool spindle test-bed.
Linxia Liao et al. This is an open-access article distributed under the terms ofthe Creative Commons Attribution 3.0 United States License, which permitsunrestricted use, distribution, and reproduction in any medium, provided theoriginal author and source are credited.
1. INTRODUCTION
The growing Internet of Things is predicted to connect 30 bil-lion devices by 2020 (MacGillivray, Turner, & Lund, 2013).This will bring in tremendous amounts of data and drive theinnovations needed to realize the vision of Industry 4.0—Cyber-Physical systems monitoring physical processes, andcommunicating and cooperating with each other and with hu-mans in real time. One of the key challenges to be addressedis how to analyze large amounts of data to provide useful andactionable information for businesses intelligence and deci-sion making. In particular, to prevent unexpected downtimeand its significant impact on overall equipment effectiveness(OEE) and total cost of ownership (TCO) in many industries.Continuous monitoring of equipment, early detection of in-cipient faults, and prediction of failure before it happens cansupport optimal maintenance strategies, prevent downtime,increase productivity, and reduce costs.
A significant number of anomaly detection and diagnosismethods have been proposed for device fault detection andhealth condition estimation. Chandola et al. (Chandola,Banerjee, & Kumar, 2009) discusses various categories ofanomaly detection technologies and their assumptions as wellas their computational complexity. Several approaches suchas statistical methods (Markou & Singh, 2003), neural net-work methods (Markos & Singh, 2003) and reliability meth-ods (Guo, Watson, Tavner, & Xiang, 2009), have been ap-plied to detect anomalies for various types of equipment.The philosophies and techniques of monitoring and predict-ing machine health with the goal of improving reliability andreducing unscheduled downtime of rotary machines are pre-sented by Lee et al. (Lee et al., 2014).
Many of these methods focus on analyzing, combining, andmodeling sensor data (e.g. vibration, current, acoustics sig-
1
ANNUAL CONFERENCE OF THE PROGNOSTICS AND HEALTH MANAGEMENT SOCIETY 2015
nal) to detect machine faults. One issue that remains mostlyunaddressed in these methods is that they rarely consider thevarying operating context of the machine. In many cases,false alarms are generated due to a change in machine op-eration (e.g. rotational speed) rather than a change in ma-chine condition. A major challenge in addressing this is-sue is that most machine controllers are built with propri-etary communication protocols, which leads to a barrier inobtaining control parameters to understand the context underwhich the machine is operating. Recently, the MTConnectopen protocol (Standard, 2009) was developed to connect var-ious legacy machines independent of the controller providers.MTConnect provides an unprecedented opportunity to moni-tor machine operating context in real-time. In this paper, weleverage MTConnect to diagnose machine health conditionby combining sensor data with operating context information.Additionally, we investigate whether it is possible to diagnosemachine health condition using less sensor data when it iscombined with context information.
Many methods have been proposed in the literature for de-vice remaining useful life (RUL) prediction. These methodscan be generally classified as data-driven method, physics-based method, and hybrid method (Liao & Kottig, 2014).Since detailed information of the assembled components isnot available in our case, physics-based modeling is unfea-sible. Hence, data-driven method becomes the primary ap-proach in our work for prediction. To enable an accurateprediction using data-driven method, feature extraction is acritical step. If an extracted feature is well correlated with thefault propagation process (e.g. vibration root mean square in-creases as the machine degrades), a good prediction can beexpected by extrapolating the historically observations to thefuture. Related work can be seen in (Coble & Hines, 2009),which used genetic algorithm to find the optimal feature sub-set, and in (Liao, 2014), which used genetic programming todiscover novel features for prediction. In most of the cases,engineering expertise is need to a certain extent to guide thefeature extraction, which might not be directly available forcomplex systems. We would like to explore automatic featuregeneration method for remaining useful life prediction whenengineering expertise is unavailable. Deep learning has re-cently gained popularity in machine learning based on learn-ing layers of network structure based on restricted Boltzmannmachines (RBM). RBM has been widely used as a gener-ative model in many applications such as image classifica-tion, speech recognition, and word representation. It has re-cently been applied in prognostics health management areafor health state classification (Tamilselvan & Wang, 2013).Instead of using RBM in a classification scenario, we exploreRBM as a feature extraction tool in a RUL prediction sce-nario.
Prior work (Pavel, Snyder, Frankle, Key, & Miller, 2010) hasdemonstrated that vibration data could be used for diagnos-
ing machine imbalance fault conditions. Our study focuseson extending prior work by exploring various types of sensorand control data for diagnosing the imbalance of the machinetools. Prior work (Pavel & Iverson, 2012) proposed self orga-nizing maps and polynomial curve fitting for RUL predictionbased on domain specific features such bearing signature fre-quencies. Our study focuses on automatic feature generationassuming domain specific expertise is unavailable.
Our contribution includes the following:
• Combining control and sensor signals for machine healthcondition estimation, while utilizing a different set ofsensor data such as temperature, power, flow, and lubri-cant/coolant pH instead of vibration.
• A novel method of using Restricted Boltzmann Machineas a feature generation model and coupling with a ran-dom forest algorithm in remaining useful life predictionapplications.
Our hypothesis is that these advancements to prior work willaid in improving the diagnosis and prognostics capability, aswell as reducing the cost of machine diagnostics by utiliz-ing cheaper sensors and saving engineering effort in featureengineering for predictive maintenance tasks.
2. TECHNICAL APPROACH
This section contains two subsections to describe the techni-cal approaches for: (1) device health estimation by combin-ing contextual control information with sensor data; and (2)remaining useful life prediction using Restricted BoltzmannMachine and random forest.
2.1. Device Health Estimation
For each extension to prior work listed in Section 1, we per-formed two main steps for diagnostics:
• Feature Extraction & Synthesis
• Model Selection
2.1.1. Feature Extraction & Synthesis
There are various approaches for condensing time series in-formation into data mining features. Prior work has utilizedtransfer functions to map control signals to vibration sensordata (Pavel et al., 2010). The diagnosis step is then reducedto comparing the features of transfer function-predicted vi-bration data and the sensor-derived vibration data. This ap-proach makes sense when the control signal directly impactsthe output variables of the machine. For motion control ofmachine tools, the estimated transfer function should be sim-ilar to the transfer function of the implemented control (likePI or PID). Typical vibration data features would include av-erage, standard deviation, and maximum FFT values (Deng,Runger, Tuv, & Vladimir, 2013).
2

ANNUAL CONFERENCE OF THE PROGNOSTICS AND HEALTH MANAGEMENT SOCIETY 2015
However, we would like to diagnose the state of machine us-ing not only accelerometers, but also other sensors, such astemperature sensors. Since temperatures at various locationsare not part of active control loops, there may not exist welldefined transfer functions that can map control signals to tem-perature sensor data very accurately. In such cases where con-ventional features extracted from temperature signals are notcorrelated with the fault (imbalance) to a sufficient degree.Additionally, if the associated sensors are too expensive toinstall, then data fusion may be applied.
There are three data fusion approaches typically used in ma-chinery diagnostics (Liu & Wang, 2001; Jardine, Lin, &Banjevic, 2006)—data-level fusion, feature-level fusion, anddecision-level fusion. Data-level fusion involves combiningsensor data before feature extraction, such that features con-tain information gathered from multiple sensors. Feature-level fusion involves generating features from each sensorseparately, then fusing this set of features generated from allof the sensors coherently for diagnostics. Finally, decision-level fusion creates diagnostics from each sensor separately,then aggregates these diagnostics into a single diagnostic out-put.
The choice of the three types of data fusion methods is of-ten application specific. In our application, we found thattemperature sensor data cannot resolve imbalance conditionsby itself and control signal data is too coarse-grained to aidin classifying imbalance conditions using the standard data-fusion techniques. Note that we did not focus on spindle ac-celeration data, which could diagnose imbalance on its own(see Subsection 3.1.1) since that would require retrofitting ex-isting machine tools with new expensive sensors and data ac-quisition hardware. Ideally we would like to use the readilyaccessible control signals and data from inexpensive temper-ature sensors to diagnose imbalance. To achieve this goal, weproposed a different type of data fusion approach. We usedthe control signal to provide the contextual information fortemperature sensor data. The control signal is used for thesegmentation of sensor data, but does not directly map intofeature vectors (see Subsection 3.1.2).
2.1.2. Model Selection
Since the data sets are statistically small and dimensionalityof the data is increased by feature synthesis, the models tobe used for imbalance classification need to be carefully cho-sen to avoid over-fitting. The high-dimensional data needsto be projected to a much smaller sub-space to prevent over-fitting1 To accomplish this, the main techniques used in thisstudy are Principal Component Analysis (PCA) (Wold, Es-bensen, & Geladi, 1987) and Linear Discriminant Analysis
1Note that complexity of model is positively correlated with likelihood ofover-fitting. Thus, creating a classifier that takes high-dimensional inputwill have higher degree of fredoom (i.e. higher complexity) compare tolow-dimensional inputs, which results in higher likelihood of over-fitting.
(LDA) (Koehler & Erenguc, 1990). These techniques arebased on linear coordinate transformation, which makes themmore likely to under-fit and less likely to over-fit (Yang, Chen,& Wu, 2011).
2.2. Device Remaining Useful Life Prediction
The remaining useful life (RUL) prediction algorithm can besummarized in Figure 1. The pre-processed data is input tothe Restricted Boltzmann Machine to automatically generatefeatures. The preprocessed data can actually be the raw sig-nals, e.g. vibration signals, or time/frequency domain fea-tures of vibration, or features extracted by signal processingtechniques e.g. discrete wavelet transform. The generatedfeatures are then input to a predictor, which is random forestin this case, to predict RUL.
Figure 1. RUL prediction method.
2.2.1. Feature Generation
Restricted Boltzmann Machine (RBM) can be considered asa two-layer network which consists a visible layer and a hid-den layer. The visible layer corresponds to the observed in-put units (v), and the hidden layer corresponds to the fea-ture detectors which are hidden units (h). Since we considerGaussian input for both the input and hidden units, the en-ergy function of the RBM is more complex than the commonbinary case. We defined the energy function as:
E(v, h) =∑i∈vis
(vi − ai)2
2δ2i+
∑j∈hid
(hj − bj)2
2δ2j−∑i,j
viδi
hjδjωij ,
(1)where vi, hj are the states of the visible unit i and hidden unitj, ai, bj are their levels, δi, δj are the standard deviations,and ωij is the weight between them. The probability that theRBM network assigns to a visible vector is given by summingover all hidden vectors:
P (v) =1
Z
∑h
exp(−E(v, h)), (2)
3
ANNUAL CONFERENCE OF THE PROGNOSTICS AND HEALTH MANAGEMENT SOCIETY 2015
where Z =∑
v,h exp(−E(v, h)). Now we can define:
P (v, h) =exp(−E(v, h))
Z(3)
P (h|v) = exp(−E(v, h))∑h exp(−E(v, h))
(4)
Then we can use the negative log likelihood gradient to up-date the parameters (ai, bj , δi, δj , ωij ∈ θ) using:
d
dθ(−logP (v)) = d
dθ(−log
∑h
P (v, h))
=d
dθ(−log
∑h
exp(−E(v, h))
Z)
= − Z∑h exp(−E(v, h))
(∑h
1
Z
d exp(−E(v, h))
dθ
−∑h
exp(−E(v, h))
Z2
dZ
dθ)
=∑h
(exp(−E(v, h))∑
h(−E(v, h)
dE(v, h)
dθ) +
1
Z
dZ
dθ
=∑h
P (h|v)dE(v, h)
dθ− 1
Z
∑v,h
exp(−E(v, h))dE(v, h)
dθ
=∑h
P (h|v)dE(v, h)
dθ−∑v,h
P (v, h)dE(v, h)
dθ
(5)
The positive part in the last line of Eq. 5 is the so calledpositive phase contribution and the negative part is the socalled negative phase contribution. The algorithm updates theparameters through iterations coupling with a learning rateand/or a momentum parameter until a stop criterion is met.The hidden unit states are used as the extracted features forRUL prediction.
2.2.2. RUL prediction
We treat the RUL prediction as a regression problem, inwhich we will train a supervised learner to match the ex-tracted features and the expected RUL. In our case, wepicked random forest algorithm as our prediction algorithmto demonstrate how to make predictions based on the fea-tures extracted from RBM. Random forest (Breiman, 2001)is an ensemble algorithm for classification or regression byaggregating the decision result from multiple decision trees.A simple pseudo algorithm of random forest training is de-scribed in Algorithm 1. After training, the algorithm outputsa RUL given a feature vector extracted from the RBM modeldescribed in Section 2.2.1.
Algorithm 1 Random forest training algorithm• Draw N bootstrap data samples from original dataset D;• For each of the bootstrap data samples, build a decision
tree. For each node of the decision tree, randomly sam-ple M of the predictors (observations in our case), andchoose the best split among the selected predictors;
• Make a prediction by aggregating the predictions of theN trees (e.g. majority votes);
• At each bootstrap iteration, predict data not in the boot-strap sample (called out-of-bag data) using the tree builtwith the bootstap sample. Aggregating the out-of-bag er-ror rate, and repeat the process until a preset threshold ismet (i.e. error rate or maximum number of iteration)
3. RESULTS
This section contains two subsections to demonstrate: (1) de-vice health estimation using data collected from a machinetool including sensor data and MTConnect data; (2) remain-ing useful life prediction using run-to-failure dataset collectedfrom a machine tool spindel testbed.
3.1. Device imbalance condition estimation
We have explored three imbalance scenarios to investigate ourhypothesis of diagnostics using:
• Sensor based diagnostics
• Control based temporal segmentation followed by sensorbased diagnostics
3.1.1. Sensor based Diagnostics
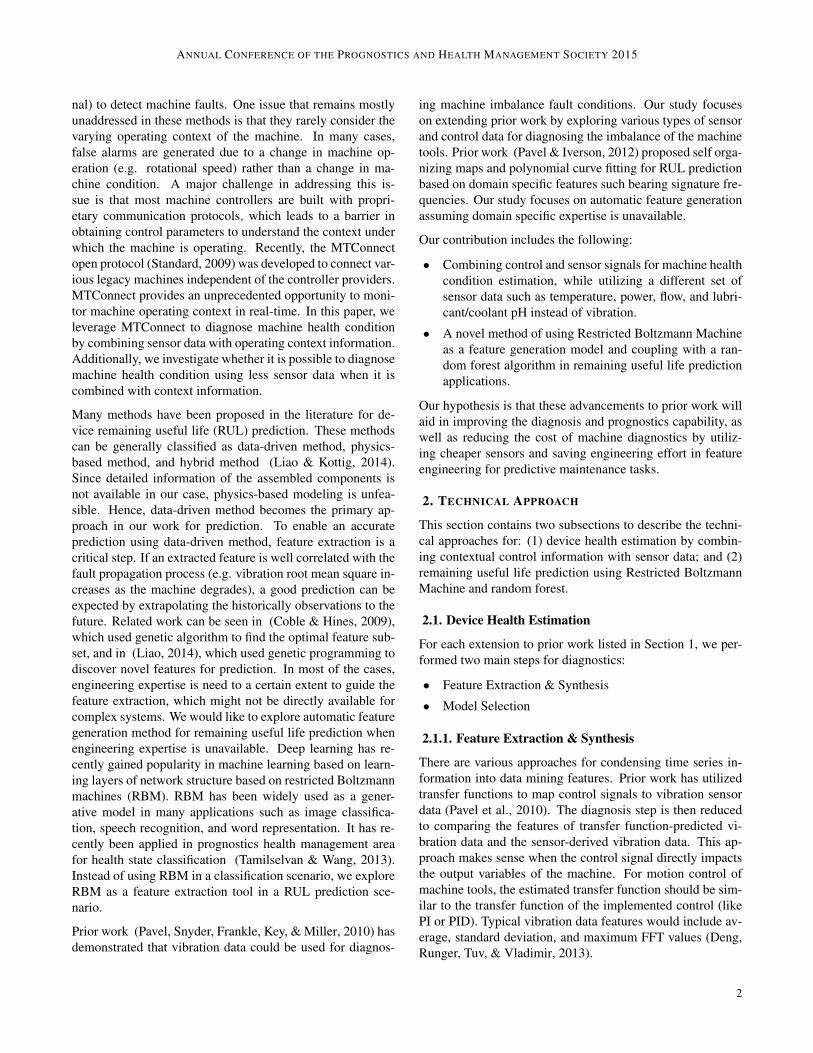
In this case, each sensor signal was analyzed separately to de-termine if any of the sensor signals contains enough diagnos-tic information to detect imbalance on its own. By plottingthe time series data we find that spindle acceleration sensors(which captures vibration) show higher oscillation amplitudes(see Figure 2) with increasing imbalance. Since imbalanceactually impacts moment of inertia of the spindle, this changein acceleration is expected.
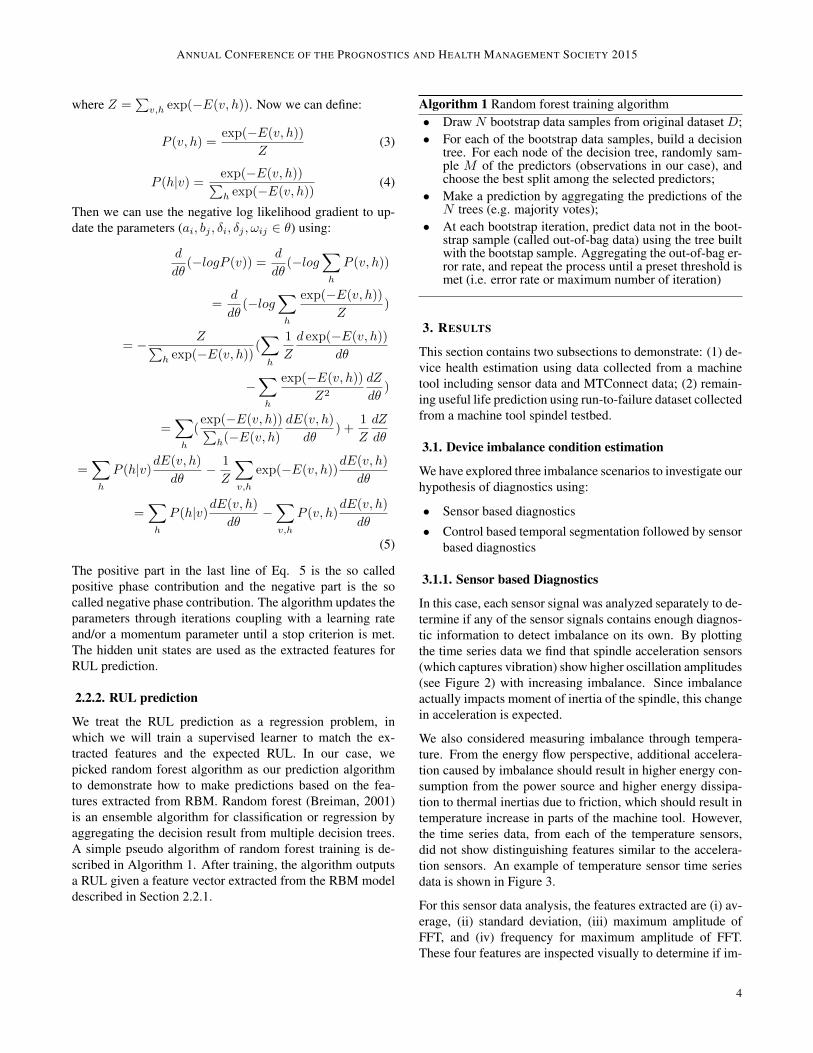
We also considered measuring imbalance through tempera-ture. From the energy flow perspective, additional accelera-tion caused by imbalance should result in higher energy con-sumption from the power source and higher energy dissipa-tion to thermal inertias due to friction, which should result intemperature increase in parts of the machine tool. However,the time series data, from each of the temperature sensors,did not show distinguishing features similar to the accelera-tion sensors. An example of temperature sensor time seriesdata is shown in Figure 3.
For this sensor data analysis, the features extracted are (i) av-erage, (ii) standard deviation, (iii) maximum amplitude ofFFT, and (iv) frequency for maximum amplitude of FFT.These four features are inspected visually to determine if im-
4
ANNUAL CONFERENCE OF THE PROGNOSTICS AND HEALTH MANAGEMENT SOCIETY 2015
(a) Spindle x-axis acceleration: 2009 data. (b) Spindle a-axis acceleration: 2010 data.
(c) Spindle z-axis acceleration: 2009 data. (d) Spindle z-axis acceleration: 2010 data.
Figure 2. Spindle acceleration data for different imbalance level.
Figure 3. Sample temperature sensor Data (fluid tempera-ture): blue and red traces indicate nominal and faulty condi-tions respectively.
balance could be classified by a simple linear classifier. Thespindle acceleration (X, Y, and Z) feature (maximum ampli-tude of FFT) showed easily visible characteristics that candistinguish between degrees of imbalance. See Figure 4 foran example of visual classification based on X-axis acceler-ation data. Other sensor signals like power, pH, flow, andtemperature did not exhibit such classification capability.
3.1.2. Control-based Segmentation followed by Sensor-based Diagnostics
The second diagnostic approach that we explored combinesboth sensor and control data in a coherent manner. The firststep in this approach is to utilize the control signal to providetemporal segmentation, i.e., assuming quasi-steady state, thegoal is to find the time intervals in which the following condi-tions are satisfied: (i) all experiments display same values forthe primary control signal (actual spindle speed) , and (ii) allthe control signals are constant over the same period. Notethat, to investigate the dynamic response, rather than quasi
5

ANNUAL CONFERENCE OF THE PROGNOSTICS AND HEALTH MANAGEMENT SOCIETY 2015
(a) Spindle a-axis acceleration for 2009 data. (b) Spindle x-axis acceleration for 2010 data.
Figure 4. Visual classification using spindle x-axis acceleration sensor.
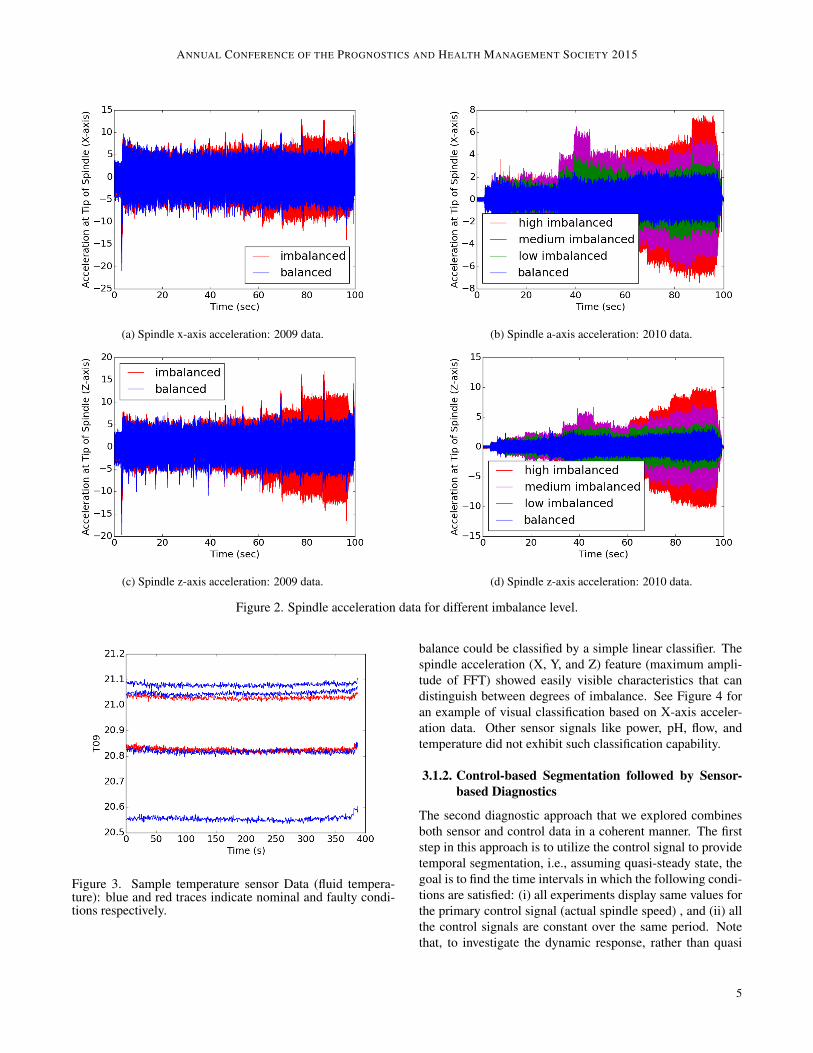
steady state response, the control signals should be consistentacross the experiments so that responses are compared underthe same set of control inputs. Figure 5 (a) shows the resultof this temporal segmentation scheme. For each of the con-trol signals, we have computed the standard deviation at theeach time step and identified the periods with standard devia-tion below a set threshold to find the consistent time intervals(shown as colored segments along the time axis in Figure 5(b)). Then we find the intersection of the sets of consistenttime intervals over all the control signals to determine the ag-gregate time intervals over which the control signals are sta-tistically consistent (shown as black segments along the timeaxis in Figure 5 (c)).
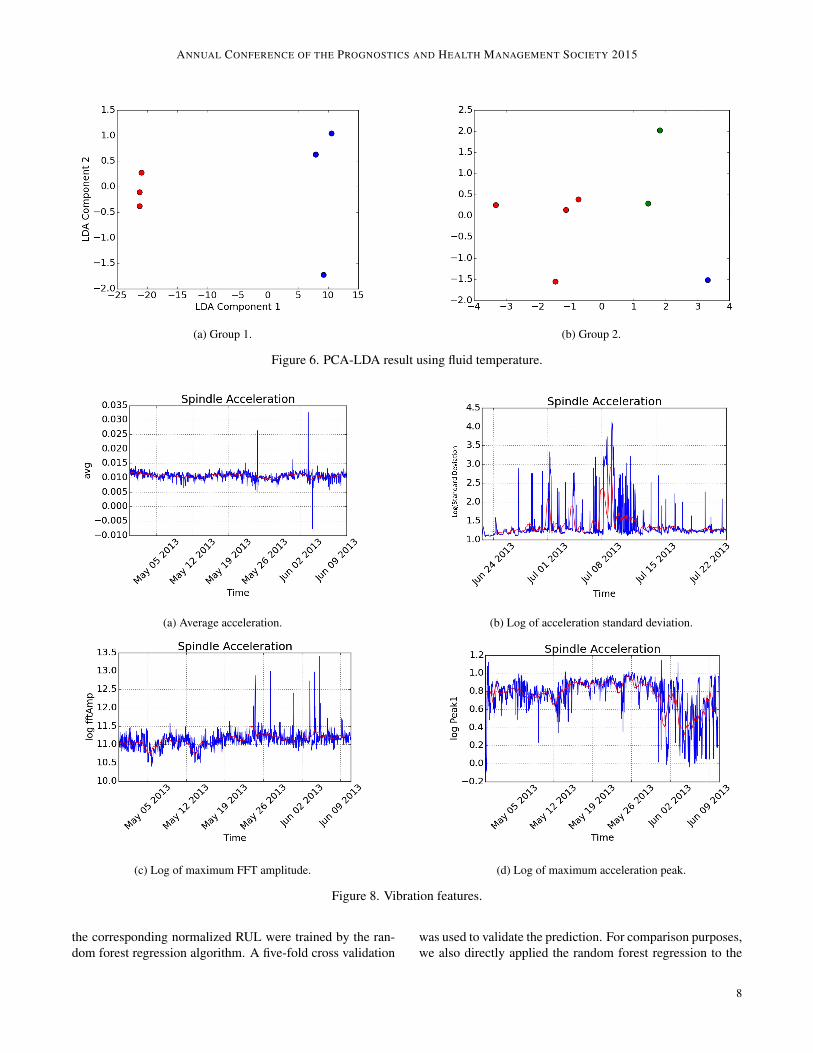
These temporal segments are then mapped to sensor data tofacilitate diagnostics. For each of 16 temporal segments, wecomputed features including (i) average, (ii) standard devia-tion, (iii) maximum FFT amplitude value, and (iv) FFT fre-quency at maximum amplitude. This step produces a 64 di-mensional feature space to diagnose machine imbalance. Asmentioned before, to avoid the overfitting we focus on lineartransformation based approaches. We implemented Princi-pal Component Analysis (PCA) to reduce the dimensionalityfrom 64 to 4 (postulating that there should be 4 unique dimen-sions given the 4 uncorrelated features that we have selected).The PCA step is followed by Linear Discriminant Analysis tofind the optimal coordinate transformation that provides max-imum separation between classes. Result of this PCA-LDAanalysis is shown in Figure 6 for Fluid Temperature sensordata. Another temperature sensor located at Spindle Motoralso exhibits similar diagnostic capability after application ofcontrol based temporal segmentation. This demonstrates thatcontrol data can be used to provide context to sensor data ina way that helps diagnose machine imbalance. Thus, temper-ature sensor which had inferior diagnostic performance with-out context data, could classify imbalance perfectly when itis combined with additional context from control signal.
3.2. Spindle Remaining Useful Life Prediction
3.2.1. Experiment Setup and Data
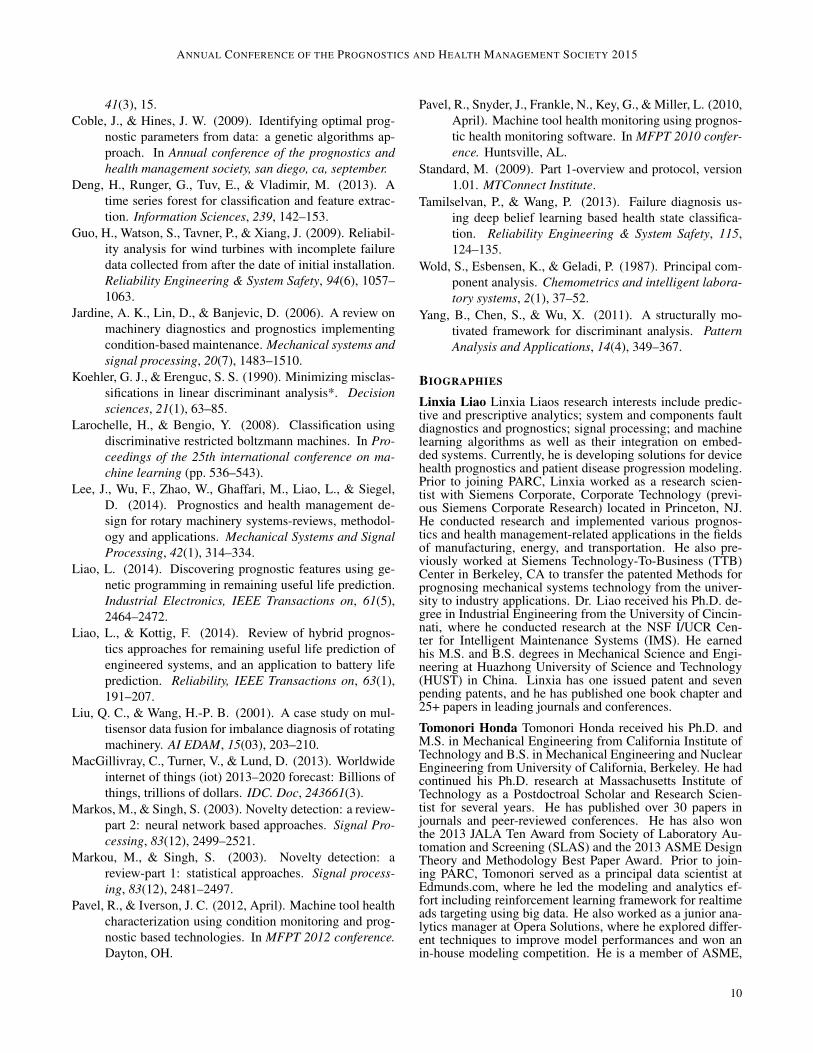
The spindle test-bed was built at TechSolve using a frequencydrive, a motor, a poly-V belt transmission, and a simplifiedspindle using two bearings identical to the ones used in thehorizontal machining center. Figure 7 presents a picture ofthe spindle test-bed showing the motor, the belt transmission,and the actual spindle. A loading mechanism pulling on thenose of the spindle was added to accelerate the degradation.The force was kept constant as 35 lbs. The spindle was ro-tating at a constant speed of 9120 resolution per minute. Thespindle motor was shut down automatically by the frequencydrive when the bearing was locked at the end of life. A cur-rent sensor was installed on one phase of the power cable inthe control box which controls the speed of the motor. Anaccelerometer was installed on the housing of the spindle tocollect vibration data. Four thermal couples were installed tocollect temperature data of the motor, spindle bearing, load-ing deck and ambient temperature, respectively. The sam-pling rate was 25600 Hz and 765440 data points were col-lected every hour.
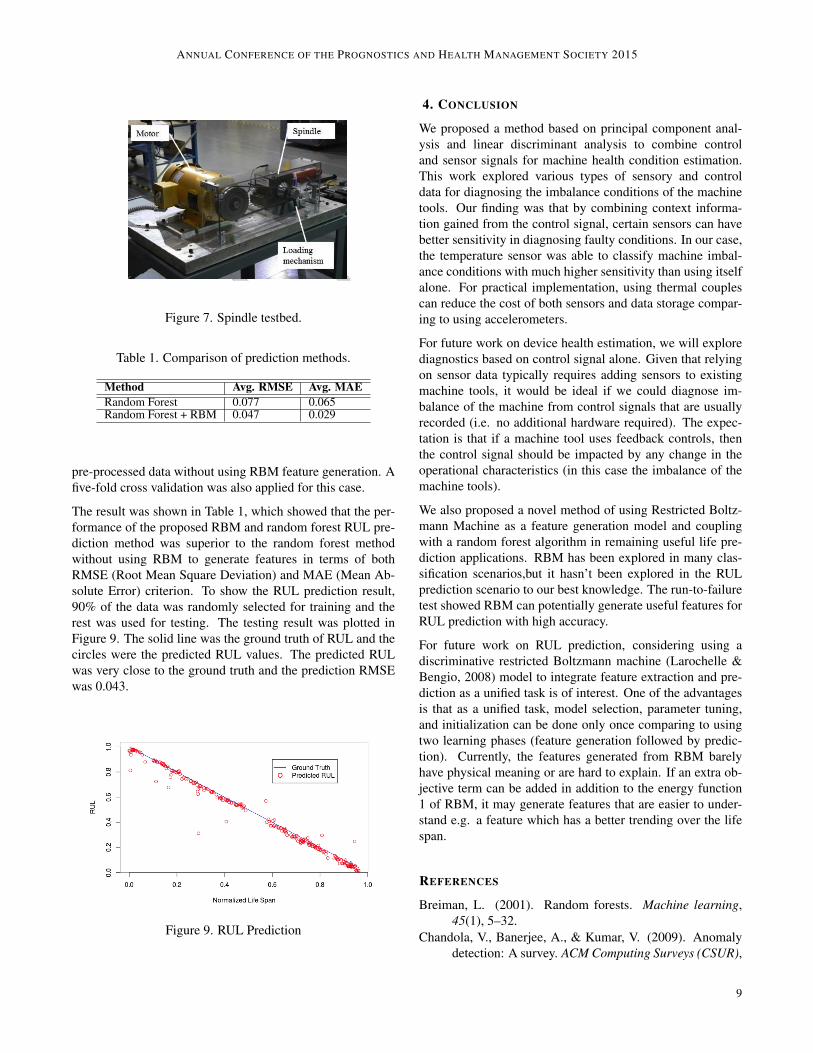
We first examined the time series statistics of the vibrationsignal and energy based on the rotational speed which was152 Hz. The purpose was trying to find the feature(s) thathas(have) trending though the life time so that the feature(s)can be used for prediction based on the historical trend. Theresult revealed that there was no obvious trending in none ofthe features at least from visual inspection. Figure 8 showedsome of the features that we examined. The solid red lineswere the smoothed features using a moving average windowof length 3.
6
ANNUAL CONFERENCE OF THE PROGNOSTICS AND HEALTH MANAGEMENT SOCIETY 2015
(a) Raw spindle speed control. (b) Spindle speed control with consistent time segment.
(c) Aggregating control signals.
Figure 5. Time series segmentation.
3.2.2. RUL Prediction Using Features Generated byRBM
Since there was no obvious trending in the features that weexamined, the RUL prediction was supposed to be not straightforward. We would like to use the proposed RBM method togenerate features automatically. In order to test the generativecapability of the RBM and assuming there is no engineeringguidance on feature extraction, we arbitrarily selected the fre-quency amplitude values ranging within 76 Hz and 532 Hz.It covered the frequency range upto 3.5 times of the rotatingfrequency. The frequency amplitude values were used as theinput to the RBM. The RBM learning parameters were cho-sen by trial and error because there was no general guidanceavailable to a practical application. The number of hidden
nodes was set to 1000. The number of maximum of epochswas set to 100. The learning rate was chosen as 0.1 and itwas fixed through the iterations.The momentum was set to be0.1. The number of iteration for Gibbs sample of ContrastiveDivergence algorithm was set to be 1.
After training, we input the training data itself to the trainedRBM, and selected the hidden units whose standard devia-tions are greater than zero. The purpose was to avoid thosehidden units that did not contain any variance information.As a result, 88 hidden nodes were selected.
The ground truth of RUL was calculated by the hours fromthe time stamp when the data was collected to the failure timestamp. All RUL hours were normalized to be in the rangebetween 0 and 1. The selected 88-dimensional features and
7
ANNUAL CONFERENCE OF THE PROGNOSTICS AND HEALTH MANAGEMENT SOCIETY 2015
(a) Group 1. (b) Group 2.
Figure 6. PCA-LDA result using fluid temperature.
(a) Average acceleration. (b) Log of acceleration standard deviation.
(c) Log of maximum FFT amplitude. (d) Log of maximum acceleration peak.
Figure 8. Vibration features.
the corresponding normalized RUL were trained by the ran-dom forest regression algorithm. A five-fold cross validation
was used to validate the prediction. For comparison purposes,we also directly applied the random forest regression to the
8
ANNUAL CONFERENCE OF THE PROGNOSTICS AND HEALTH MANAGEMENT SOCIETY 2015
Figure 7. Spindle testbed.
Table 1. Comparison of prediction methods.
Method Avg. RMSE Avg. MAERandom Forest 0.077 0.065Random Forest + RBM 0.047 0.029
pre-processed data without using RBM feature generation. Afive-fold cross validation was also applied for this case.
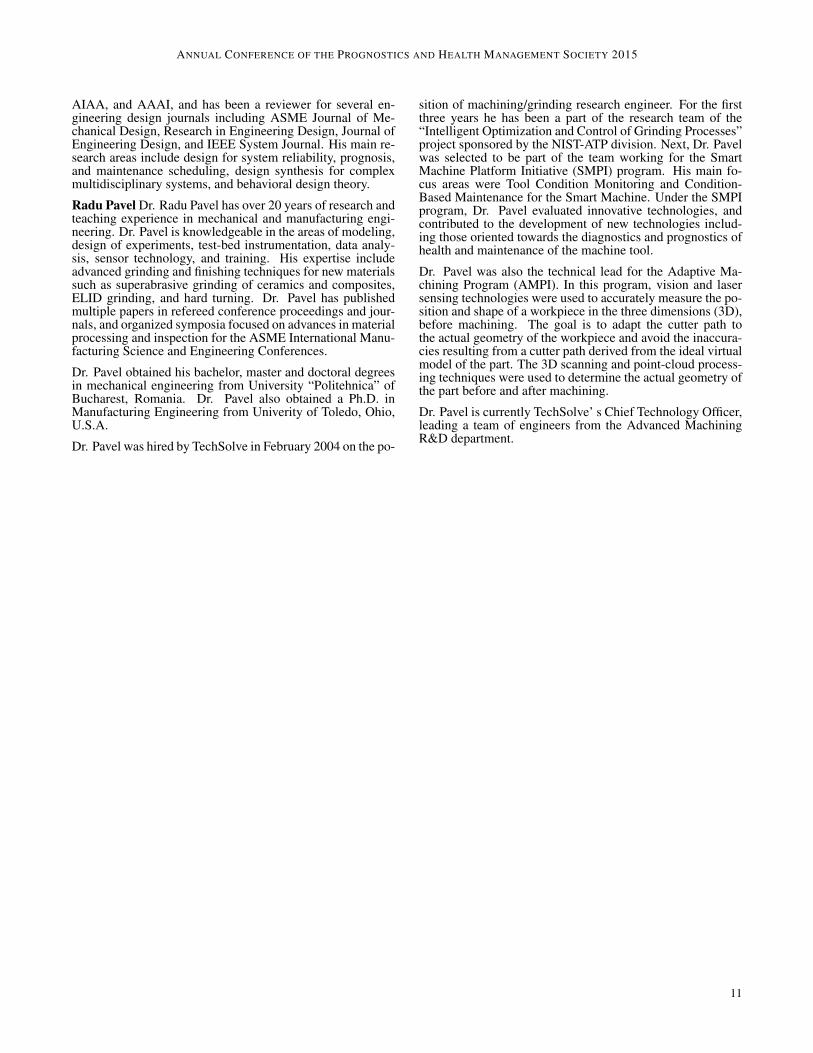
The result was shown in Table 1, which showed that the per-formance of the proposed RBM and random forest RUL pre-diction method was superior to the random forest methodwithout using RBM to generate features in terms of bothRMSE (Root Mean Square Deviation) and MAE (Mean Ab-solute Error) criterion. To show the RUL prediction result,90% of the data was randomly selected for training and therest was used for testing. The testing result was plotted inFigure 9. The solid line was the ground truth of RUL and thecircles were the predicted RUL values. The predicted RULwas very close to the ground truth and the prediction RMSEwas 0.043.
Figure 9. RUL Prediction
4. CONCLUSION
We proposed a method based on principal component anal-ysis and linear discriminant analysis to combine controland sensor signals for machine health condition estimation.This work explored various types of sensory and controldata for diagnosing the imbalance conditions of the machinetools. Our finding was that by combining context informa-tion gained from the control signal, certain sensors can havebetter sensitivity in diagnosing faulty conditions. In our case,the temperature sensor was able to classify machine imbal-ance conditions with much higher sensitivity than using itselfalone. For practical implementation, using thermal couplescan reduce the cost of both sensors and data storage compar-ing to using accelerometers.
For future work on device health estimation, we will explorediagnostics based on control signal alone. Given that relyingon sensor data typically requires adding sensors to existingmachine tools, it would be ideal if we could diagnose im-balance of the machine from control signals that are usuallyrecorded (i.e. no additional hardware required). The expec-tation is that if a machine tool uses feedback controls, thenthe control signal should be impacted by any change in theoperational characteristics (in this case the imbalance of themachine tools).
We also proposed a novel method of using Restricted Boltz-mann Machine as a feature generation model and couplingwith a random forest algorithm in remaining useful life pre-diction applications. RBM has been explored in many clas-sification scenarios,but it hasn’t been explored in the RULprediction scenario to our best knowledge. The run-to-failuretest showed RBM can potentially generate useful features forRUL prediction with high accuracy.
For future work on RUL prediction, considering using adiscriminative restricted Boltzmann machine (Larochelle &Bengio, 2008) model to integrate feature extraction and pre-diction as a unified task is of interest. One of the advantagesis that as a unified task, model selection, parameter tuning,and initialization can be done only once comparing to usingtwo learning phases (feature generation followed by predic-tion). Currently, the features generated from RBM barelyhave physical meaning or are hard to explain. If an extra ob-jective term can be added in addition to the energy function1 of RBM, it may generate features that are easier to under-stand e.g. a feature which has a better trending over the lifespan.
REFERENCES
Breiman, L. (2001). Random forests. Machine learning,45(1), 5–32.
Chandola, V., Banerjee, A., & Kumar, V. (2009). Anomalydetection: A survey. ACM Computing Surveys (CSUR),
9
ANNUAL CONFERENCE OF THE PROGNOSTICS AND HEALTH MANAGEMENT SOCIETY 2015
41(3), 15.Coble, J., & Hines, J. W. (2009). Identifying optimal prog-
nostic parameters from data: a genetic algorithms ap-proach. In Annual conference of the prognostics andhealth management society, san diego, ca, september.
Deng, H., Runger, G., Tuv, E., & Vladimir, M. (2013). Atime series forest for classification and feature extrac-tion. Information Sciences, 239, 142–153.
Guo, H., Watson, S., Tavner, P., & Xiang, J. (2009). Reliabil-ity analysis for wind turbines with incomplete failuredata collected from after the date of initial installation.Reliability Engineering & System Safety, 94(6), 1057–1063.
Jardine, A. K., Lin, D., & Banjevic, D. (2006). A review onmachinery diagnostics and prognostics implementingcondition-based maintenance. Mechanical systems andsignal processing, 20(7), 1483–1510.
Koehler, G. J., & Erenguc, S. S. (1990). Minimizing misclas-sifications in linear discriminant analysis*. Decisionsciences, 21(1), 63–85.
Larochelle, H., & Bengio, Y. (2008). Classification usingdiscriminative restricted boltzmann machines. In Pro-ceedings of the 25th international conference on ma-chine learning (pp. 536–543).
Lee, J., Wu, F., Zhao, W., Ghaffari, M., Liao, L., & Siegel,D. (2014). Prognostics and health management de-sign for rotary machinery systems-reviews, methodol-ogy and applications. Mechanical Systems and SignalProcessing, 42(1), 314–334.
Liao, L. (2014). Discovering prognostic features using ge-netic programming in remaining useful life prediction.Industrial Electronics, IEEE Transactions on, 61(5),2464–2472.
Liao, L., & Kottig, F. (2014). Review of hybrid prognos-tics approaches for remaining useful life prediction ofengineered systems, and an application to battery lifeprediction. Reliability, IEEE Transactions on, 63(1),191–207.
Liu, Q. C., & Wang, H.-P. B. (2001). A case study on mul-tisensor data fusion for imbalance diagnosis of rotatingmachinery. AI EDAM, 15(03), 203–210.
MacGillivray, C., Turner, V., & Lund, D. (2013). Worldwideinternet of things (iot) 2013–2020 forecast: Billions ofthings, trillions of dollars. IDC. Doc, 243661(3).
Markos, M., & Singh, S. (2003). Novelty detection: a review-part 2: neural network based approaches. Signal Pro-cessing, 83(12), 2499–2521.
Markou, M., & Singh, S. (2003). Novelty detection: areview-part 1: statistical approaches. Signal process-ing, 83(12), 2481–2497.
Pavel, R., & Iverson, J. C. (2012, April). Machine tool healthcharacterization using condition monitoring and prog-nostic based technologies. In MFPT 2012 conference.Dayton, OH.
Pavel, R., Snyder, J., Frankle, N., Key, G., & Miller, L. (2010,April). Machine tool health monitoring using prognos-tic health monitoring software. In MFPT 2010 confer-ence. Huntsville, AL.
Standard, M. (2009). Part 1-overview and protocol, version1.01. MTConnect Institute.
Tamilselvan, P., & Wang, P. (2013). Failure diagnosis us-ing deep belief learning based health state classifica-tion. Reliability Engineering & System Safety, 115,124–135.
Wold, S., Esbensen, K., & Geladi, P. (1987). Principal com-ponent analysis. Chemometrics and intelligent labora-tory systems, 2(1), 37–52.
Yang, B., Chen, S., & Wu, X. (2011). A structurally mo-tivated framework for discriminant analysis. PatternAnalysis and Applications, 14(4), 349–367.
BIOGRAPHIES
Linxia Liao Linxia Liaos research interests include predic-tive and prescriptive analytics; system and components faultdiagnostics and prognostics; signal processing; and machinelearning algorithms as well as their integration on embed-ded systems. Currently, he is developing solutions for devicehealth prognostics and patient disease progression modeling.Prior to joining PARC, Linxia worked as a research scien-tist with Siemens Corporate, Corporate Technology (previ-ous Siemens Corporate Research) located in Princeton, NJ.He conducted research and implemented various prognos-tics and health management-related applications in the fieldsof manufacturing, energy, and transportation. He also pre-viously worked at Siemens Technology-To-Business (TTB)Center in Berkeley, CA to transfer the patented Methods forprognosing mechanical systems technology from the univer-sity to industry applications. Dr. Liao received his Ph.D. de-gree in Industrial Engineering from the University of Cincin-nati, where he conducted research at the NSF I/UCR Cen-ter for Intelligent Maintenance Systems (IMS). He earnedhis M.S. and B.S. degrees in Mechanical Science and Engi-neering at Huazhong University of Science and Technology(HUST) in China. Linxia has one issued patent and sevenpending patents, and he has published one book chapter and25+ papers in leading journals and conferences.
Tomonori Honda Tomonori Honda received his Ph.D. andM.S. in Mechanical Engineering from California Institute ofTechnology and B.S. in Mechanical Engineering and NuclearEngineering from University of California, Berkeley. He hadcontinued his Ph.D. research at Massachusetts Institute ofTechnology as a Postdoctroal Scholar and Research Scien-tist for several years. He has published over 30 papers injournals and peer-reviewed conferences. He has also wonthe 2013 JALA Ten Award from Society of Laboratory Au-tomation and Screening (SLAS) and the 2013 ASME DesignTheory and Methodology Best Paper Award. Prior to join-ing PARC, Tomonori served as a principal data scientist atEdmunds.com, where he led the modeling and analytics ef-fort including reinforcement learning framework for realtimeads targeting using big data. He also worked as a junior ana-lytics manager at Opera Solutions, where he explored differ-ent techniques to improve model performances and won anin-house modeling competition. He is a member of ASME,
10
ANNUAL CONFERENCE OF THE PROGNOSTICS AND HEALTH MANAGEMENT SOCIETY 2015
AIAA, and AAAI, and has been a reviewer for several en-gineering design journals including ASME Journal of Me-chanical Design, Research in Engineering Design, Journal ofEngineering Design, and IEEE System Journal. His main re-search areas include design for system reliability, prognosis,and maintenance scheduling, design synthesis for complexmultidisciplinary systems, and behavioral design theory.
Radu Pavel Dr. Radu Pavel has over 20 years of research andteaching experience in mechanical and manufacturing engi-neering. Dr. Pavel is knowledgeable in the areas of modeling,design of experiments, test-bed instrumentation, data analy-sis, sensor technology, and training. His expertise includeadvanced grinding and finishing techniques for new materialssuch as superabrasive grinding of ceramics and composites,ELID grinding, and hard turning. Dr. Pavel has publishedmultiple papers in refereed conference proceedings and jour-nals, and organized symposia focused on advances in materialprocessing and inspection for the ASME International Manu-facturing Science and Engineering Conferences.
Dr. Pavel obtained his bachelor, master and doctoral degreesin mechanical engineering from University “Politehnica” ofBucharest, Romania. Dr. Pavel also obtained a Ph.D. inManufacturing Engineering from Univerity of Toledo, Ohio,U.S.A.
Dr. Pavel was hired by TechSolve in February 2004 on the po-
sition of machining/grinding research engineer. For the firstthree years he has been a part of the research team of the“Intelligent Optimization and Control of Grinding Processes”project sponsored by the NIST-ATP division. Next, Dr. Pavelwas selected to be part of the team working for the SmartMachine Platform Initiative (SMPI) program. His main fo-cus areas were Tool Condition Monitoring and Condition-Based Maintenance for the Smart Machine. Under the SMPIprogram, Dr. Pavel evaluated innovative technologies, andcontributed to the development of new technologies includ-ing those oriented towards the diagnostics and prognostics ofhealth and maintenance of the machine tool.
Dr. Pavel was also the technical lead for the Adaptive Ma-chining Program (AMPI). In this program, vision and lasersensing technologies were used to accurately measure the po-sition and shape of a workpiece in the three dimensions (3D),before machining. The goal is to adapt the cutter path tothe actual geometry of the workpiece and avoid the inaccura-cies resulting from a cutter path derived from the ideal virtualmodel of the part. The 3D scanning and point-cloud process-ing techniques were used to determine the actual geometry ofthe part before and after machining.
Dr. Pavel is currently TechSolve’ s Chief Technology Officer,leading a team of engineers from the Advanced MachiningR&D department.
11


![From Lattice Boltzmann Method to Lattice Boltzmann Flux … · From Lattice Boltzmann Method to Lattice Boltzmann Flux Solver Yan Wang 1, ... flows [8,13–15], compressible flows](https://static.fdocuments.in/doc/165x107/5cadf91b88c9938f4d8c0cd6/from-lattice-boltzmann-method-to-lattice-boltzmann-flux-from-lattice-boltzmann.jpg)