Developments in selected CESEE countries
37
FOCUS ON EUROPEAN ECONOMIC INTEGRATION Q2/21 7 Developments in selected CESEE countries Strong international momentum bolsters CESEE’s industry and prevents further decline of economic activity 1, 2, 3 1 Regional overview The spread of coronavirus across the world in spring 2020 brought economic activity in Central, Eastern and Southeastern Europe (CESEE) to a sudden halt. Output in the region shrank by 2.5% on average in 2020, with several countries reporting notably sharper setbacks (see table 1). Thus, 2020 will go down in history as a year with some of the sharpest economic downturns in the region since the transformation years of the early 1990s. And yet, the recession was less severe than in the euro area (–6.6%). A large part of the positive growth differential was due to the resilience of the CESEE region’s two largest economies – Russia and Turkey. Turkey stands out in particular, as it was one of only two countries in Europe that reported an economic expansion in 2020 (the other being Ireland). In the CESEE EU member states, the recession was also somewhat milder than in other European countries, with output declining by an average of 5%. In the first half of 2020, the more gradual spread of the pandemic eastward in spring and the quick reaction by local authorities prevented the type of public health crises that were observed in e.g. Italy or Spain and enabled CESEE to start 1 Compiled by Josef Schreiner with input from Katharina Allinger, Stephan Barisitz, Antje Hildebrandt, Melanie Koch, Mathias Lahnsteiner, Thomas Reininger, Tomáš Slac ˇ ík and Zoltan Walko. 2 Cutoff date: April 6, 2021. This report focuses primarily on data releases and developments from April 2020 up to the cutoff date and covers Slovakia, Slovenia, Bulgaria, Croatia, Czechia, Hungary, Poland, Romania, Turkey and Russia. The countries are ranked according to their level of EU integration (euro area countries, EU member states, EU candidates and potential candidates and non-EU countries). For statistical information on selected economic indicators for CESEE countries not covered in the main text (Albania, Bosnia and Herzegovina, Kosovo, Montenegro, North Macedonia, Serbia and Ukraine), see the statistical annex in this issue. 3 All growth rates in the text refer to year-on-year changes unless otherwise stated. Table 1 Real GDP growth 2018 2019 2020 Q3 19 Q4 19 Q1 20 Q2 20 Q3 20 Q4 20 Period-on-period change in % Slovakia 3.8 2.3 –5.2 0.4 0.6 –5.1 –8.3 11.6 0.2 Slovenia 4.4 3.2 –5.5 0.6 1.1 –4.8 –10.1 12.2 –1.0 Bulgaria 3.1 3.7 –4.2 0.6 0.6 0.4 –10.1 4.3 2.2 Croatia 2.8 2.9 –8.4 1.2 –0.4 –1.1 –15.4 8.2 2.7 Czechia 3.2 2.3 –5.6 0.5 0.4 –3.1 –8.7 6.9 0.6 Hungary 5.4 4.6 –5.0 0.9 0.6 –0.4 –14.5 11.0 1.4 Poland 5.4 4.5 –2.7 1.2 0.2 –0.3 –9.0 7.9 –0.7 Romania 4.5 4.1 –3.9 0.4 1.0 0.6 –11.8 5.6 4.8 Turkey 3.0 0.9 1.8 0.4 1.9 0.1 –11.0 15.9 1.7 Russia 2.8 2.0 –3.0 –1.0 –0.5 –0.6 –2.6 0.6 –0.2 CESEE average 1 3.4 2.3 –2.5 –0.1 0.4 –0.5 –7.1 6.6 0.6 Euro area 1.9 1.2 –6.6 0.3 0.1 –3.7 –11.8 12.5 –0.7 Source: Eurostat, national statistical offices. 1 Average weighted with GDP at PPP.
Transcript of Developments in selected CESEE countries

FOCUS ON EUROPEAN ECONOMIC INTEGRATION Q2/21 7
Developments in selected CESEE countriesStrong international momentum bolsters CESEE’s industry and prevents further decline of economic activity1, 2, 3
1 Regional overviewThe spread of coronavirus across the world in spring 2020 brought economic activity in Central, Eastern and Southeastern Europe (CESEE) to a sudden halt. Output in the region shrank by 2.5% on average in 2020, with several countries reporting notably sharper setbacks (see table 1). Thus, 2020 will go down in history as a year with some of the sharpest economic downturns in the region since the transformation years of the early 1990s.
And yet, the recession was less severe than in the euro area (–6.6%). A large part of the positive growth differential was due to the resilience of the CESEE region’s two largest economies – Russia and Turkey. Turkey stands out in particular, as it was one of only two countries in Europe that reported an economic expansion in 2020 (the other being Ireland). In the CESEE EU member states, the recession was also somewhat milder than in other European countries, with output declining by an average of 5%.
In the first half of 2020, the more gradual spread of the pandemic eastward in spring and the quick reaction by local authorities prevented the type of public health crises that were observed in e.g. Italy or Spain and enabled CESEE to start
1 Compiled by Josef Schreiner with input from Katharina Allinger, Stephan Barisitz, Antje Hildebrandt, Melanie Koch, Mathias Lahnsteiner, Thomas Reininger, Tomáš Slac ˇ ík and Zoltan Walko.
2 Cutoff date: April 6, 2021. This report focuses primarily on data releases and developments from April 2020 up to the cutoff date and covers Slovakia, Slovenia, Bulgaria, Croatia, Czechia, Hungary, Poland, Romania, Turkey and Russia. The countries are ranked according to their level of EU integration (euro area countries, EU member states, EU candidates and potential candidates and non-EU countries). For statistical information on selected economic indicators for CESEE countries not covered in the main text (Albania, Bosnia and Herzegovina, Kosovo, Montenegro, North Macedonia, Serbia and Ukraine), see the statistical annex in this issue.
3 All growth rates in the text refer to year-on-year changes unless otherwise stated.
Table 1
Real GDP growth
2018 2019 2020 Q3 19 Q4 19 Q1 20 Q2 20 Q3 20 Q4 20
Period-on-period change in %
Slovakia 3.8 2.3 –5.2 0.4 0.6 –5.1 –8.3 11.6 0.2Slovenia 4.4 3.2 –5.5 0.6 1.1 –4.8 –10.1 12.2 –1.0Bulgaria 3.1 3.7 –4.2 0.6 0.6 0.4 –10.1 4.3 2.2Croatia 2.8 2.9 –8.4 1.2 –0.4 –1.1 –15.4 8.2 2.7Czechia 3.2 2.3 –5.6 0.5 0.4 –3.1 –8.7 6.9 0.6Hungary 5.4 4.6 –5.0 0.9 0.6 –0.4 –14.5 11.0 1.4Poland 5.4 4.5 –2.7 1.2 0.2 –0.3 –9.0 7.9 –0.7Romania 4.5 4.1 –3.9 0.4 1.0 0.6 –11.8 5.6 4.8Turkey 3.0 0.9 1.8 0.4 1.9 0.1 –11.0 15.9 1.7Russia 2.8 2.0 –3.0 –1.0 –0.5 –0.6 –2.6 0.6 –0.2
CESEE average1 3.4 2.3 –2.5 –0.1 0.4 –0.5 –7.1 6.6 0.6
Euro area 1.9 1.2 –6.6 0.3 0.1 –3.7 –11.8 12.5 –0.7
Source: Eurostat, national statistical offices.1 Average weighted with GDP at PPP.

Developments in selected CESEE countries
8 OESTERREICHISCHE NATIONALBANK
lifting restrictions on public life and the economy at a comparatively early stage. This led to a somewhat smaller contraction of domestic demand (and especially investments) in many countries. At the same time, export volumes of certain key products started to increase already in spring thanks, in part, to the rapid recovery of the Chinese economy.
The third quarter brought about a rather strong rebound, and many CESEE countries reported quarter-on-quarter growth in the double digits after lifting most coronavirus-related restrictions. In the fourth quarter of 2020, GDP growth in CESEE declined again but remained positive and in some countries – especially Romania, but also Bulgaria and Croatia – outpaced euro area growth by a large margin.
Industry fared better than most other sectors
This comparatively strong development in late 2020 was related to a rebound of world trade that allowed industrial dynamics to break away from trends in most other sectors, especially services. Global goods trade recovered more swiftly than during the global financial crisis and its volume already surpassed its pre-pandemic level in November 2020. CESEE – as an internationally integrated and highly open economic area – benefited strongly from this development. Unlike in spring, lock-down measures mainly targeted contact-intensive sectors like services and retail trade, while industrial production remained largely unrestricted. Structural features of CESEE economies (especially a comparatively high share of industry and a com-paratively low share of services in gross value added) acted as further stabilizing factors.
GDP data clearly confirm the dichotomy between industry and services. On the production side, the industrial sector was the most important pillar of growth in half of the countries under observation in the review period. At the same time, services dampened GDP growth quite a bit in all countries but Turkey.
Strong external momentum lifts growth
On the expenditure side of GDP, industrial strength was mirrored in a clear revival of exports: Export performance improved throughout the review period and export volumes again embarked on an upward trend in the final quarter of 2020 in half of the CESEE countries. As domestic demand weakness put a brake on imports, this often translated into a positive growth contribution of net exports to GDP growth (see chart 1). It needs to be noted, however, that the external sector also reduced growth to a substantial extent in some parts of CESEE. This is particularly true for the countries that are most reliant on tourism, i.e. Bulgaria, Croatia and Turkey, where a strong reduction of tourist visits given COVID-19-induced travel restric-tions weighed on services exports.
While public consumption bolstered economic activity – in part thanks to large-scale fiscal crisis mitigation packages (see below) – the other components of domestic demand remained weak throughout CESEE. The only exception was Turkey, where a large buildup of stocks and a notable credit impulse from state-owned banks fueled domestic economic momentum.
Percentage points, GDP growth in % (year on year)
20
16
12
8
4
0
−4
−8
−12
−16
−20
−24
GDP growth and its main components
Chart 1
Source: Eurostat, national statistical offices.
Private consumption Public consumptionGDP growth
Gross fixed capital formation Stock changes Net exportsStatistical discrepancy
Q1 Q2 Q3 Q4 Q1 Q2 Q3 Q4 Q1 Q2 Q3 Q4 Q1 Q2 Q3 Q4 Q1 Q2 Q3 Q4 Q1 Q2 Q3 Q4 Q1 Q2 Q3 Q4 Q1 Q2 Q3 Q4 Q1 Q2 Q3 Q4 Q1 Q2 Q3 Q42020 2020 2020 2020 2020 2020 2020 2020 2020 2020
Slovakia Slovenia Bulgaria Croatia Czechia Hungary Poland Romania Turkey Russia

Developments in selected CESEE countries
FOCUS ON EUROPEAN ECONOMIC INTEGRATION Q2/21 9
Private consumption affected by COVID-19 containment measures
COVID-19-induced shutdowns in the services and retail sector, sour sentiment, decelerating credit momentum and weaker labor markets weighed on consumer spending. On average, private consumption reduced GDP growth by some 1.5 per-centage points in the second half of 2020, with some countries reporting substan-tially larger reductions.
Labor market slack has not eased since spring 2020
On the back of public support and more benign general economic conditions than in the first half of 2020, the officially reported unemployment rate according to labor force survey (LFS) methodology declined by 0.7 percentage points from its height in June 2020 and stood at an average 6.9% in February 2021. Also, nominal wage growth recovered somewhat from its trough in the second quarter.4 A look at unemployment rates alone, however, leads to an underestimation of current slack in the labor market. An indicator of actual labor market slack provided by Eurostat (not available for Russia) reveals that persons with an unmet need for employment5 accounted for an average of 13.6% of the extended CESEE labor force in the fourth quarter of 2020. This figure has remained virtually unchanged since spring and is twice as high as LFS unemployment. Furthermore, employment
4 Wage figures, however, need to be interpreted with caution as emergency measures, such as furlough schemes, substantially limited the explanatory power of wage statistics in the past quarters.
5 This includes unemployed and underemployed persons, persons available for the labor market but not seeking employment, as well as persons seeking employment but not available for the labor market.
lifting restrictions on public life and the economy at a comparatively early stage. This led to a somewhat smaller contraction of domestic demand (and especially investments) in many countries. At the same time, export volumes of certain key products started to increase already in spring thanks, in part, to the rapid recovery of the Chinese economy.
The third quarter brought about a rather strong rebound, and many CESEE countries reported quarter-on-quarter growth in the double digits after lifting most coronavirus-related restrictions. In the fourth quarter of 2020, GDP growth in CESEE declined again but remained positive and in some countries – especially Romania, but also Bulgaria and Croatia – outpaced euro area growth by a large margin.
Industry fared better than most other sectors
This comparatively strong development in late 2020 was related to a rebound of world trade that allowed industrial dynamics to break away from trends in most other sectors, especially services. Global goods trade recovered more swiftly than during the global financial crisis and its volume already surpassed its pre-pandemic level in November 2020. CESEE – as an internationally integrated and highly open economic area – benefited strongly from this development. Unlike in spring, lock-down measures mainly targeted contact-intensive sectors like services and retail trade, while industrial production remained largely unrestricted. Structural features of CESEE economies (especially a comparatively high share of industry and a com-paratively low share of services in gross value added) acted as further stabilizing factors.
GDP data clearly confirm the dichotomy between industry and services. On the production side, the industrial sector was the most important pillar of growth in half of the countries under observation in the review period. At the same time, services dampened GDP growth quite a bit in all countries but Turkey.
Strong external momentum lifts growth
On the expenditure side of GDP, industrial strength was mirrored in a clear revival of exports: Export performance improved throughout the review period and export volumes again embarked on an upward trend in the final quarter of 2020 in half of the CESEE countries. As domestic demand weakness put a brake on imports, this often translated into a positive growth contribution of net exports to GDP growth (see chart 1). It needs to be noted, however, that the external sector also reduced growth to a substantial extent in some parts of CESEE. This is particularly true for the countries that are most reliant on tourism, i.e. Bulgaria, Croatia and Turkey, where a strong reduction of tourist visits given COVID-19-induced travel restric-tions weighed on services exports.
While public consumption bolstered economic activity – in part thanks to large-scale fiscal crisis mitigation packages (see below) – the other components of domestic demand remained weak throughout CESEE. The only exception was Turkey, where a large buildup of stocks and a notable credit impulse from state-owned banks fueled domestic economic momentum.
Percentage points, GDP growth in % (year on year)
20
16
12
8
4
0
−4
−8
−12
−16
−20
−24
GDP growth and its main components
Chart 1
Source: Eurostat, national statistical offices.
Private consumption Public consumptionGDP growth
Gross fixed capital formation Stock changes Net exportsStatistical discrepancy
Q1 Q2 Q3 Q4 Q1 Q2 Q3 Q4 Q1 Q2 Q3 Q4 Q1 Q2 Q3 Q4 Q1 Q2 Q3 Q4 Q1 Q2 Q3 Q4 Q1 Q2 Q3 Q4 Q1 Q2 Q3 Q4 Q1 Q2 Q3 Q4 Q1 Q2 Q3 Q42020 2020 2020 2020 2020 2020 2020 2020 2020 2020
Slovakia Slovenia Bulgaria Croatia Czechia Hungary Poland Romania Turkey Russia

Developments in selected CESEE countries
10 OESTERREICHISCHE NATIONALBANK
continued to trend downward throughout the region in the second half of 2020, pushing down average annual employment figures to their lowest level in five years.
Cautious recovery of investment activity in late 2020
Uncertainty about the further course of the pandemic kept capital spending low. Apart from Turkey, all CESEE countries reported lower investments than a year earlier, and gross fixed capital formation declined by an average of 2.3% during the second half of 2020. Dynamics, however, picked up somewhat toward the end of 2020, reflecting rising capacity utilization rates amid the recovery of external demand and strengthening industrial production. By the fourth quarter of 2020, investment activity again moderately lifted GDP growth in six of the ten CESEE countries under consideration.
Trends largely unchanged in early 2021
The trends outlined above continued in early 2021: While consumer and retail trade spending remained muted, economic data continue to confirm the resilience of the manufacturing sector to the pandemic as firms face high demand, especially from abroad. Against this backdrop, industrial production has, on average, been growing since October 2020, and did so also in January and February 2021. Indus-trial output currently stands at a level broadly comparable to its 2019 average (and even notably higher in Turkey and Poland). The pace of recovery in goods trade, however, appears to have been moderating recently as transport capacities and sector-specific production bottlenecks (e.g. semiconductors) weigh on dynamics. Some disruptions in supply chains are also suggested by survey findings within the framework of the Purchasing Managers’ Index (PMI): Central European companies are increasingly struggling with growing backlogs of work coupled with longer supplier delivery times. Furthermore, input price growth is accelerating noticeably. These supply-side constraints may weigh on industrial production in the coming months but are in principle also a sign of healthy global demand for industrial produce.
Industrial sentiment has recovered fully from its pandemic-related trough: In March 2021, sentiment in industry in the CESEE EU member states as measured by the European Commission’s Economic Sentiment Indicator (ESI) stood at the same level as 12 months earlier. In Turkey, the indicator was even 9.7 points higher than in March 2020. PMIs (available for Czechia, Poland, Russia and Turkey) crossed the threshold of 50 points (indicating an economic expansion) in summer or early fall 2020 and remained above this level throughout the first quarter of 2021. In Czechia, the PMI even reached 58 points in March 2021, which was close to historical highs. PMI developments were clearly driven by future output expecta-tions and – in the case of CESEE EU member states – also export expectations.
In contrast to industrial dynamism, construction output growth remained flat in the review period.
New COVID-19 waves weighed on consumer spending and sentiment in early 2021
Retail sales recovered until October 2020, but then again weakened during the past months. In February 2021, they were largely unchanged compared to the pre-vious year. As many CESEE countries have been hit by new waves of COVID-19 infections since fall 2020 (and some countries reported historically high figures in late March 2021), the deterioration of the pandemic situation has clearly weighed

Developments in selected CESEE countries
FOCUS ON EUROPEAN ECONOMIC INTEGRATION Q2/21 11
on consumer spending and sentiment: Consumer, retail and services confidence indicators remained notably below their pre-crisis levels in the review period, despite some moderate improvements seen recently. This points toward an ongoing dichotomy between industry on the one hand and more contact-intensive sectors (retail, services) on the other hand. For more information on prospective develop-ments in 2021 and beyond, please consult the recent GDP growth projections in the OeNB’s current Outlook for selected CESEE countries and Russia in this issue of Focus on European Economic Integration.
Inflation rates in CESEE EU member states declined only moderately
Despite weak economic activity, inflation has declined only very moderately since the start of the coronavirus pandemic. In the CESEE EU member states, average inflation fell from 3.2% in March 2020 to 2.4% in December 2020. The decline, however, was not evenly spread across the region, and inflation fell more in euro area countries and countries that have pegged their currency against the euro (i.e. in Slovakia, Slovenia, Bulgaria and Croatia; see chart 2). This suggests that the exchange rate pass-through prevented prices from falling more strongly in the countries with a freely floating exchange rate. In the first quarter of 2021, the Czech koruna, the Hungarian forint and the Polish złoty traded 1.7%, 6.1% and 4.9%, respectively, below their corresponding euro values in the same period of the previous year.
Percentage points, contribution to year-on-year change in HICP; HICP in %
18
16
14
12
10
8
6
4
2
0
−2
−4Q2 Q3 Q4 Q2 Q3 Q4 Q2 Q3 Q4 Q2 Q3 Q4 Q2 Q3 Q4 Q2 Q3 Q4 Q2 Q3 Q4 Q2 Q3 Q4 Q2 Q3 Q4 Q4Feb. Feb. Feb. Feb. Feb. Feb. Feb. Feb. Feb. Feb.Q2 Q3
HICP inflation and its main drivers
Chart 2
Source: Eurostat.
Note: CPI data for Russia. No breakdown according to COICOP available.
Processed food (including alcohol and tobacco) Nonenergy industrial goods Services Energy Unprocessed food HICP
Slovakia Slovenia Bulgaria Croatia Czechia Hungary Poland Romania Turkey Russia2020 2021 2020 2021 2020 2021 2020 2021 2020 2021 2020 2021 2020 2021 2020 2021 2020 2021 2020 2021

Developments in selected CESEE countries
12 OESTERREICHISCHE NATIONALBANK
On the level of individual HICP components, lower price growth in the CESEE EU member states was mainly related to lower price pressure from non-core items (i.e. energy and unprocessed food) and processed food. Consequently, core inflation remained constant in the second half of 2020 and stood at an average of 3.3% in December 2020 (3.3% in March 2020). The first two months of 2021 brought about some reacceleration of regional headline inflation (to 2.6% in February 2021) on the back of higher energy prices, while core inflation remained broadly unchanged (3.2% in February 2021).
Price pressures in Russia and Turkey increased notably
Outside the EU, inflation was not only higher, it also accelerated notably in the review period. In February 2021, headline inflation came in at 5.8% in Russia and at 15.6% in Turkey. Both countries have struggled with exchange rate volatility in the past quarters fueled by political uncertainty and – in the case of Russia – oil price developments. In the first quarter of 2021, the Russian ruble and the Turkish lira traded 17.9% and 24.3%, respectively, below their corresponding euro values in the same period of the previous year.
In the course of 2021, we may see further price growth in many CESEE coun-tries and challenges for policymakers owing to base effects, country-specific factors (e.g. a hike in electricity tariffs in Romania), the release of pent-up demand once COVID-19-related restrictions are finally suspended, rising fuel prices, demand- supply frictions as the economy restarts, and rising producer price pressures.
Monetary accommodation and liquidity provision continued in CESEE EU member states
Most inflation-targeting central banks in the CESEE EU member states have already increased their near-term inflation forecasts and/or assume higher volatil-ity in inflation and more upside risks. This could lead to a (temporary) deviation of inflation from its target ranges. So far, however, policy rates have not been raised. On the contrary, the most recent adjustments to monetary policy include a rate cut by 25 basis points in Romania in January 2021 (to 1.25%; see chart 3) and foreign exchange purchases in Poland (Poland’s official reserve assets increased from EUR 120.5 billion in November 2020 to EUR 134.8 billion in March 2021). Fur-thermore, several central banks (e.g. in Croatia, Hungary, Poland, Romania and Turkey) continued the expansion of their balance sheets initiated in spring 2020 as a response to the coronavirus pandemic. As a result, financial conditions remained accommodative.
Crisis-driven additional liquidity-providing measures for the banking sectors (such as adjusted reserve requirements, longer-term refinancing operations, etc.) have been selectively adjusted but largely remained in place. Most existing bilateral euro liquidity lines with the ECB have been extended by nine months to March 2022, including repo facilities with the central banks of Hungary and Romania (EUR 4 billion and EUR 4.5 billion, respectively) and a swap facility with the central bank of Croatia (EUR 2 billion). The swap line with the central bank of Bulgaria was not extended and remained in place until December 31, 2020.
%
CESEE EU member states%
Russia and Turkey
3.0
2.5
2.0
1.5
1.0
0.5
0
25
20
15
10
5
0
Policy rate developments in CESEE
Chart 3
Source: Macrobond.
Hungary PolandCzechia Romania
Russia Turkey
2019 2020 2021 2019 2020 2021

Developments in selected CESEE countries
FOCUS ON EUROPEAN ECONOMIC INTEGRATION Q2/21 13
On the level of individual HICP components, lower price growth in the CESEE EU member states was mainly related to lower price pressure from non-core items (i.e. energy and unprocessed food) and processed food. Consequently, core inflation remained constant in the second half of 2020 and stood at an average of 3.3% in December 2020 (3.3% in March 2020). The first two months of 2021 brought about some reacceleration of regional headline inflation (to 2.6% in February 2021) on the back of higher energy prices, while core inflation remained broadly unchanged (3.2% in February 2021).
Price pressures in Russia and Turkey increased notably
Outside the EU, inflation was not only higher, it also accelerated notably in the review period. In February 2021, headline inflation came in at 5.8% in Russia and at 15.6% in Turkey. Both countries have struggled with exchange rate volatility in the past quarters fueled by political uncertainty and – in the case of Russia – oil price developments. In the first quarter of 2021, the Russian ruble and the Turkish lira traded 17.9% and 24.3%, respectively, below their corresponding euro values in the same period of the previous year.
In the course of 2021, we may see further price growth in many CESEE coun-tries and challenges for policymakers owing to base effects, country-specific factors (e.g. a hike in electricity tariffs in Romania), the release of pent-up demand once COVID-19-related restrictions are finally suspended, rising fuel prices, demand- supply frictions as the economy restarts, and rising producer price pressures.
Monetary accommodation and liquidity provision continued in CESEE EU member states
Most inflation-targeting central banks in the CESEE EU member states have already increased their near-term inflation forecasts and/or assume higher volatil-ity in inflation and more upside risks. This could lead to a (temporary) deviation of inflation from its target ranges. So far, however, policy rates have not been raised. On the contrary, the most recent adjustments to monetary policy include a rate cut by 25 basis points in Romania in January 2021 (to 1.25%; see chart 3) and foreign exchange purchases in Poland (Poland’s official reserve assets increased from EUR 120.5 billion in November 2020 to EUR 134.8 billion in March 2021). Fur-thermore, several central banks (e.g. in Croatia, Hungary, Poland, Romania and Turkey) continued the expansion of their balance sheets initiated in spring 2020 as a response to the coronavirus pandemic. As a result, financial conditions remained accommodative.
Crisis-driven additional liquidity-providing measures for the banking sectors (such as adjusted reserve requirements, longer-term refinancing operations, etc.) have been selectively adjusted but largely remained in place. Most existing bilateral euro liquidity lines with the ECB have been extended by nine months to March 2022, including repo facilities with the central banks of Hungary and Romania (EUR 4 billion and EUR 4.5 billion, respectively) and a swap facility with the central bank of Croatia (EUR 2 billion). The swap line with the central bank of Bulgaria was not extended and remained in place until December 31, 2020.
%
CESEE EU member states%
Russia and Turkey
3.0
2.5
2.0
1.5
1.0
0.5
0
25
20
15
10
5
0
Policy rate developments in CESEE
Chart 3
Source: Macrobond.
Hungary PolandCzechia Romania
Russia Turkey
2019 2020 2021 2019 2020 2021
Russia and Turkey needed to increase policy ratesUnlike the CESEE EU member states, both Russia and Turkey have tightened their monetary policy in the review period. Russia increased its policy rate by 25 basis points to 4.5% in March 2021, as inflation exceeded the forecast by Russia’s central bank (CBR) and ran above its target in the first quarter of 2021. The CBR also cited rising inflation expectations over the course of the pandemic as a reason for its decision.
In Turkey, rates were raised in four steps by a total of 1,075 basis points to 19% between September 2020 and early April 2021, after a loose policy stance and repeated rate cuts in the first half of 2020 had helped economic activity to recover but had contributed to high annual consumer price inflation, a persistent current account deficit, a rapid loss of foreign exchange reserves and a sell-off in the lira. As noted above, the Turkish lira depreciated substantially in the course of 2020 and reached a historical low in early November 2020 against the euro and the US dollar. After rallying markedly between November 2020 and February 2021, it started to weaken again from mid-February onward. Although the lira’s latest weaknesses were partly related to global trends – emerging-market currencies have been hit by expectations of higher US interest rates – they may also have reflected renewed concern about the Turkish authorities’ commitment to policy tightening.
Spillovers from expectations of higher US interest rates remain limited so far
The announcement of the US fiscal stimulus package amid rising inflation rates in major markets has had limited spillovers for European yields so far. 10-year govern-ment bond yields in the CESEE EU member states have increased by between 12 basis points in Romania and 66 basis points in Czechia since the beginning of 2021 (with some moderate decline in Croatia). This was less than the increase in US bond yields (+75 basis points). Furthermore, yields in early April 2021 were lower than in early March 2020 in all CESEE EU member states but Czechia. Central banks’ large-scale purchases of government securities in the framework of their quantitative easing programs were probably instrumental in keeping yields low despite increased financing requirements for government budgets. In addition, stepped-up liquidity
Developments in selected CESEE countries
14 OESTERREICHISCHE NATIONALBANK
provision to banks and decreased credit demand by the private sector also likely helped absorb increased government bond supply.
Stronger increases in 10-year government bond yields, however, were reported for Russia and Turkey (+140 basis points and +578 basis points, respectively, year to date), where domestic (political) factors amplified global trends.
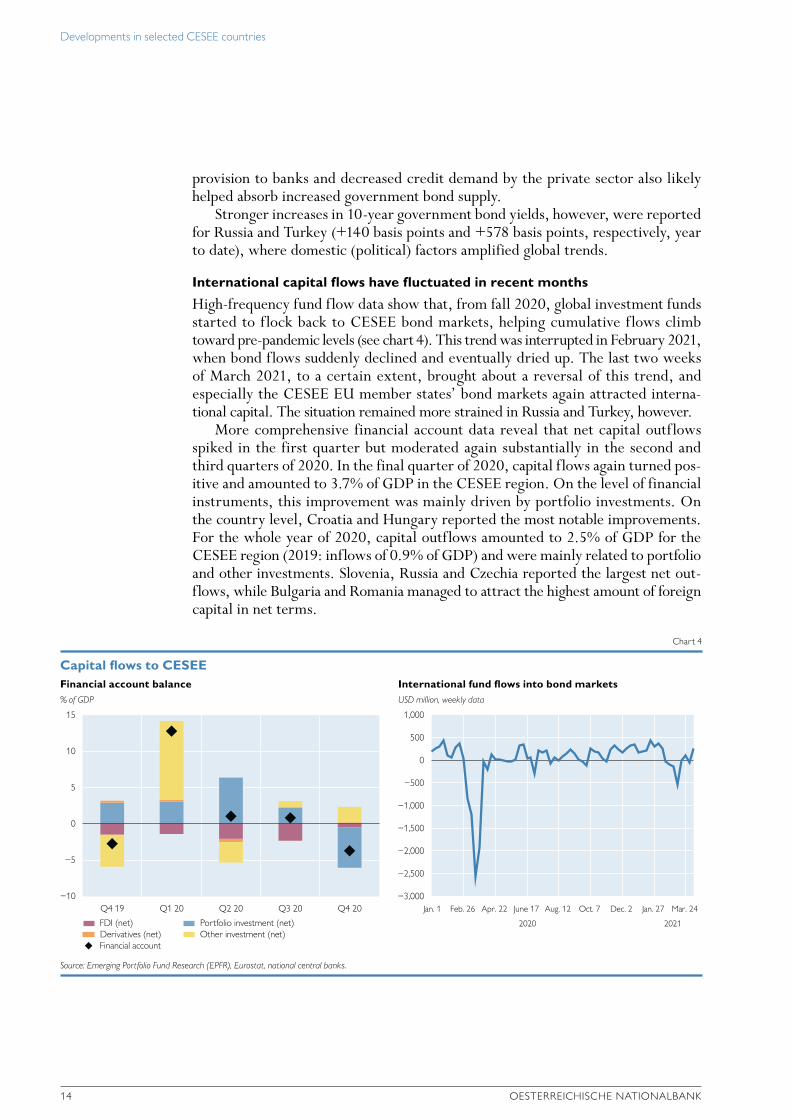
International capital flows have fluctuated in recent months
High-frequency fund flow data show that, from fall 2020, global investment funds started to flock back to CESEE bond markets, helping cumulative flows climb toward pre-pandemic levels (see chart 4). This trend was interrupted in February 2021, when bond flows suddenly declined and eventually dried up. The last two weeks of March 2021, to a certain extent, brought about a reversal of this trend, and especially the CESEE EU member states’ bond markets again attracted interna-tional capital. The situation remained more strained in Russia and Turkey, however.
More comprehensive financial account data reveal that net capital outflows spiked in the first quarter but moderated again substantially in the second and third quarters of 2020. In the final quarter of 2020, capital flows again turned pos-itive and amounted to 3.7% of GDP in the CESEE region. On the level of financial instruments, this improvement was mainly driven by portfolio investments. On the country level, Croatia and Hungary reported the most notable improvements. For the whole year of 2020, capital outflows amounted to 2.5% of GDP for the CESEE region (2019: inflows of 0.9% of GDP) and were mainly related to portfolio and other investments. Slovenia, Russia and Czechia reported the largest net out-flows, while Bulgaria and Romania managed to attract the highest amount of foreign capital in net terms.
% of GDP
Financial account balanceUSD million, weekly data
International fund flows into bond markets
15
10
5
0
−5
−10
1,000
500
0
−500
−1,000
−1,500
−2,000
−2,500
−3,000
Capital flows to CESEE
Chart 4
Source: Emerging Portfolio Fund Research (EPFR), Eurostat, national central banks.
FDI (net)
Financial account
Portfolio investment (net)Derivatives (net) Other investment (net)
Q4 19 Q1 20 Q2 20 Q3 20 Q4 20
2020 2021
Jan. 1 Feb. 26 Apr. 22 June 17 Aug. 12 Oct. 7 Dec. 2 Jan. 27 Mar. 24

Developments in selected CESEE countries
FOCUS ON EUROPEAN ECONOMIC INTEGRATION Q2/21 15
Combined current and capital accounts remain clearly in surplus
Aggregate current account balances deteriorated somewhat in the second half of 2020 because of lower goods and services surpluses. This was an especially impor-tant factor in tourism-reliant countries (such as Bulgaria, Croatia and Turkey) as well as in Russia (related to global oil and gas demand and price developments). At the same time, the lockdown-induced recession put the brakes on profit outflows via the primary income account. The current account balance for the CESEE region as a whole remained positive and amounted to 0.5% of GDP in 2020 (2019: 1.6% of GDP). The highest surpluses were reported in Slovenia and Poland (6% of GDP and more), while Romania and Turkey reported the largest deficits (3.3% of GDP and 5.2% of GDP, respectively; see chart 5). Capital account balances were largely unaffected by the recession, and the surplus for the CESEE region increased moderately to 0.8% of GDP in 2020 (2019: 0.5% of GDP). EU member states continued to record the highest capital account surpluses, which reflected EU fund disbursements.
Policy action prevents a more pronounced deterioration of credit dynamics
In the banking sector, the coronavirus pandemic brought about a reversal of previous years’ trends. Its impact on banking sector indicators, however, was much weaker than in the global financial crisis of 2008. On the one hand, this was related to the very nature of the shock that sent the region into recession. On the other hand, the region’s banking sectors entered the downturn on a much stronger footing than in 2008 (i.e. with stronger capital buffers, no excessive loan growth, a much lower foreign currency-denominated exposure and a strengthened regulatory environment).
% of GDP, four-quarter moving sum
12
10
8
6
4
2
0
−2
−4
−6
−8Q4 Q1 Q2 Q3
2019 2020 2019 2020 2019 2020 2019 2020 2019 2020 2019 2020 2019 2020 2019 2020 2019 2020 2019 2020Q4 Q4 Q1 Q2 Q3 Q4 Q4 Q1 Q2 Q3 Q4 Q4 Q1 Q2 Q3 Q4 Q4 Q1 Q2 Q3 Q4 Q4 Q1 Q2 Q3 Q4 Q4 Q1 Q2 Q3 Q4 Q4 Q1 Q2 Q3 Q4 Q4 Q1 Q2 Q3 Q4 Q4 Q1 Q2 Q3 Q4
Combined current and capital account balance
Chart 5
Source: Eurostat, IMF, national central banks.
Trade and services balance Primary income Secondary income Capital account Combined current and capital account
Slovakia Slovenia Bulgaria Croatia Czechia Hungary Poland Romania Turkey Russia

Developments in selected CESEE countries
16 OESTERREICHISCHE NATIONALBANK
Nevertheless, loan growth declined in nearly all countries of the region in the review period, as weaker demand and worsening credit supply conditions impacted on credit dynamics (see chart 6). Demand suffered from faltering domestic demand and souring sentiment. Supply was negatively affected by tightened collateral requirements, groups’ limited funding, a weakening local and international envi-ronment and nonperforming exposures. The decline in credit expansion, however, was rather moderate in many countries, as the recession turned out weaker than initially expected. Furthermore, surveys suggest that regulatory action (e.g. more flexible treatment of nonperforming loans (NPLs), relaxation of liquidity ratios, various forms of capital relief measures and adjustments of risk weights), monetary policy measures (e.g. long- term liquidity provisions) and public guarantee schemes have supported lending activity.
All countries also introduced moratoria of some sort on the repayment of loans to alleviate financial strains for borrowers. Surveys indicate that no more than 20% of borrowers renegotiated loan repayments in most CESEE countries. Even in countries where blanket moratoria were imposed by law (e.g. Hungary), pene-tration did not reach higher levels than some 50% of private sector loans. This is a sign that the remaining borrowers were able to service their debt amid falling interest rates and borrowing costs and despite the economic downturn. Against this backdrop, NPLs have not yet embarked on a clear upward trend. Banks, how-ever, expect that the quality of loan applications will deteriorate across the client spectrum and that NPLs will increase notably in the future.
The COVID-19 pandemic has brought about a further remarkable shift in the refinancing structure of CESEE banking sectors toward domestic deposits. A mod-erate decline in domestic claims was matched by a strong increase in private sector deposits in the year 2020. Apparently, corporations and households increased savings as consumption and investment decisions were postponed in an uncertain environment.
Year-on-year change in %, adjusted for exchange rate changes Year-on-year change in %, adjusted for exchange rate changes
25
20
15
10
5
0
−5
25
20
15
10
5
0
−5
2018 2019 2020 2021
Growth of credit to the private sector
Chart 6
Source: National central banks.
SlovakiaCroatia
Slovenia BulgariaCzechia
HungaryTurkey
Poland RomaniaRussia
Jan. Apr. Jul. Oct. Jan. Apr. Jul. Oct. Jan. Apr. Jul. Oct. Jan.2018 2019 2020 2021
Jan. Apr. Jul. Oct. Jan. Apr. Jul. Oct. Jan. Apr. Jul. Oct. Jan.

Developments in selected CESEE countries
FOCUS ON EUROPEAN ECONOMIC INTEGRATION Q2/21 17
CESEE banks still report profits despite general economic recession
The crisis has had a notable impact on the profitability of the CESEE banking sectors. Throughout the region, the return on assets in 2020 was notably lower than a year earlier and declined by close to 40% on average. The return on assets ranged between 0.3% in Poland and 1.9% in Russia at the end of 2020. Rising loan loss provisions in response to the recession were a main driver of lower profits. Central bank rate cuts put additional pressure on net interest margins and lower loan growth weighed on operating income. Profitability will likely remain under stress, as eased regulatory requirements and loan moratoria only temporarily sheltered banking sectors from some of the COVID-19-related impact. Deteriorating prof-itability coupled with rising NPLs will likely weigh on banks’ capital ratios. At the end of 2020, however, most CESEE banking sectors still reported substantial capital buffers. The overall capital adequacy ratio hovered between 14.1% in Turkey and 24.3% in Croatia. Substantially lower figures were only reported for Russia (9.7%).
Fiscal crisis mitigation measures are driving up budget deficits
Measures to mitigate the economic fallout of the COVID-19 pandemic as well as automatic stabilizers led to a strong increase in public deficits. The average general government balance deteriorated from –0.2% of GDP in 2019 to –5.9% of GDP in 2020 (with a range from –3.4% of GDP in Bulgaria to –9.2% of GDP in Romania). Direct fiscal measures included tax cuts, subsidies for wages and social security contributions, compensation for people in quarantine and for firms affected by shutdown measures, higher allowances (e.g. for children) and bonuses (e.g. workers in health care), higher minimum wages and/or furlough schemes subsidizing wages and shorter work hours. The latter measures were imperative in preventing a sharper deterioration in labor market conditions. Indirect fiscal measures mainly included guarantees and deferrals for tax payments and social security contributions.
According to the IMF, the fiscal measures governments have announced or taken in response to the COVID-19 pandemic, in terms of their amount relative to GDP, range from some 6% in Romania and Russia, some 9% in Bulgaria, Croatia and Slovakia and some 13% to 15% in Hungary, Poland, Slovenia and Turkey to as much as 21.5% in Czechia (these figures cover measures scheduled for implemen-tation in 2020, 2021 and beyond). This compares to an average 29.2% of GDP for the euro area. As these numbers include (sometimes sizable) contingent liabilities (mainly guarantees), the actual fiscal stimulus will crucially depend on the effective utilization of the available funds.
In addition to domestic spending, CESEE EU member states made use of loans provided under the EU’s SURE instrument (Support to mitigate Unemployment Risks in an Emergency) that was designed to tackle sudden increases in public expenditure for the preservation of employment. By the end of March 2021, some EUR 15 billion had been disbursed to CESEE EU member states under this heading.
Developments in selected CESEE countries
18 OESTERREICHISCHE NATIONALBANK
Box 1
Ukraine: recession in 2020 moderate compared with previous crises, but slow progress with vaccinations amid new infection waves; IMF program still on hold
Ukraine’s GDP shrank by 4% in 2020, which means that the latest recession turned out relatively moderate compared to the economic plunges recorded during the global financial crisis and the crisis in 2014/2015. After restrictions related to the COVID-19 pandemic had strongly hit economic activity in the second quarter, GDP contracted much less severely in year-on-year terms in the second half of 2020. Private consumption even posted positive year-on-year growth rates, as the easing of containment measures and improved wage growth supported consumption spending. However, year-on-year growth rates of gross fixed capital formation remained deeply negative. Exports continued to decline markedly in the second half of 2020 due to lower crop yields among other factors, while import compression moderated somewhat. The contribution of net exports was clearly positive when looking at full-year data but turned negative in the final quarter. The budget deficit amounted to 5.3% of GDP in 2020, with expenditures rising in the areas of road infrastructure, healthcare and defense, among others. It should be noted that a rise in ceasefire violations at the contact line in Eastern Ukraine was reported by the OSCE special monitoring mission in spring 2021.
COVID-19-related restrictions will negatively affect the economic recovery in early 2021. At the beginning of the year, a country-wide two-week lockdown was implemented with the aim of bringing down the numbers of new infections. Moreover, lockdown measures were taken at the regional level in March 2021 (e.g. in Kyiv) as the spread of coronavirus accelerated once more. Ukraine started to vaccinate its population relatively late (in late February 2021) and at a relatively slow pace, so that Ukraine lags behind other CESEE countries in this respect.
Year-on-year inflation rates averaged 2.4% in the first ten months of 2020 and, thus, inflation was clearly below the central bank target range of 5% ±1 percentage point. However, inflation started to rise markedly toward the end of the year and climbed to 7.5% in February 2021. At the same time, core inflation went up from about 3% in the first ten months of 2020 to 5.6% in February 2021. Against the background of inflationary pressures, the National Bank of Ukraine (NBU) raised its key policy rate by 50 basis points to 6.5% in early March 2021. The NBU expects inflation to peak in mid-2021 before coming down to the target band in the first half of 2022.
Official foreign currency (FX) reserves have held up quite well since mid-2020, even though no further IMF funds have reached Ukraine since the disbursal of the first tranche under the IMF Stand-By Arrangement (SBA) in June 2020. In fact, the level of FX reserves stood at USD 28.5 billion at end-February 2021 (4.6 months of imports) and thus exactly at the same level as at end-June 2020. Official FX reserves were backed by a Eurobond issuance and the disbursal of EUR 600 million to Ukraine under the EU’s COVID-19-related macro- financial assistance program in late 2020 as well as by net FX purchases carried out by the NBU. Support also came from the current account surplus (4.1% of GDP over the whole year). This year’s external debt repayment schedule shows a spike in public debt repayment volumes at USD 3.8 billion in the third quarter of 2021.
The first review under the IMF SBA, originally scheduled for September 2020, has not been concluded so far. In late 2020/early 2021, a virtual IMF mission was held, but no agree-ment was reached and thus discussions continue. The IMF repeatedly stressed the importance of central bank independence and sound central bank governance (following changes at the NBU board and related disputes) as well as the signif icance of independent and effective anti-corruption institutions. Judicial integrity and the gas market (after Ukraine temporarily capped gas prices for households) have been further important issues during the talks.

Developments in selected CESEE countries
FOCUS ON EUROPEAN ECONOMIC INTEGRATION Q2/21 19
Box 2
Western Balkans6: COVID-19 pandemic significantly left its mark on the Western Balkan economies
The COVID-19 pandemic has continued to determine economic developments in the Western Balkans since our last reporting in fall 2020. All countries have been hit severely by the crisis and have had to cope with renewed waves of COVID-19 infections since February 2021 (see chart 1). Moreover, the reintroduction of containment measures has brought severe head-winds for economic growth. However, at the time of writing, all Western Balkan countries had passed the peak of the latest COVID-19 wave, which occurred between February 2021 in Albania, mid-March in Montenegro and end-March/early April in the remaining countries.
The speed of vaccination differs greatly across the region. Serbia is the frontrunner (also in comparison to EU countries): in mid-April already 25% of the population had received at least one dose of a COVID-19 vaccine. Montenegro has vaccinated 5.5% of the population and North Macedonia 1.2%. No comparable data is available for the other countries, but Albania has started vaccinating on a larger scale. In mid-April the European Commission announced that it will provide 651,000 vaccine doses to the Western Balkan countries until August 2021.
Moving to the economic situation of the region, annual GDP growth remained in negative territory in all Western Balkan countries in the third quarter of 2020 but – amid the easing of lockdown measures, at least to some extent – the growth performance was somewhat better than in the second quarter of 2020 (see chart 2). Only in Montenegro, GDP growth decelerated even more, reaching almost –27% year on year (second quarter of 2020: –20.3%), as the country is particularly dependent on the tourism sector, which was severely hit by travel restrictions. In the final quarter of 2020, economic performance improved in all Western Balkan countries. Notably, annual GDP growth turned positive in Albania with year-on-year growth of 3% (sup-ported by a base effect after the devastating earthquake in fall 2019 that had halted GDP growth in the fourth quarter of 2019) and in Kosovo with 0.7%. Regarding full-year growth, Serbia was least hit by the COVID-19 pandemic in 2020. GDP growth only declined by around 1%, largely due to a very large fiscal support package (see below). Montenegro is at the other end of the scale, where the crisis took a sizable toll, with growth slumping by more than 15%.
6 The Western Balkans comprise Albania, Bosnia and Herzegovina, Kosovo, Montenegro, North Macedonia and Serbia. The designation “Kosovo” is used without prejudice to positions on status and in line with UNSC 1244 and the opinion on the Kosovo Declaration of Independence.
Number of new infections per 100,000 inhabitants
800
700
600
500
400
300
200
100
0
New COVID-19 infections over past seven days
Source: Our World in Data.
Chart 1
Albania MontenegroBosnia and Herzegovina North MacedoniaKosovo Serbia
Mar. 20 May 20 July 20 Sep. 20 Nov. 20 Jan. 21 Mar. 21

Developments in selected CESEE countries
20 OESTERREICHISCHE NATIONALBANK
Until the outbreak of the COVID-19 pandemic, private consumption was an important growth contributor generally driven by swift credit expansion, rising wages and remittances and positive developments on the labor market. With the onset of the crisis and the strict containment measures, these supportive factors moved in a less favorable direction, leaving a mark on private consumption. With the (partial) reopening of the economies in the second half of 2020, however, private consumption growth declined less severely compared to the first half of 2020 or even rebounded. In Kosovo, private consumption was particularly strong, owing largely to a greater inflow of remittances. Public consumption growth presented a quite mixed picture in the second half of 2020. In Kosovo and North Macedonia, public consumption accelerated quite strongly year on year in the third quarter of 2020 due to specific support measures such as transfers to the most vulnerable groups.
Due to depressed economic activity and an elevated level of uncertainty, investment activity only improved partially in the second half of 2020, after it had collapsed in all Western Balkan countries with the start of the COVID-19 pandemic. Albania represents a notable exception where gross fixed capital formation accelerated strongly in the second half of 2020, owing to the start of post-earthquake reconstruction.
In the third quarter of 2020, the year-on-year decline of exports of goods and services was less severe than in the second quarter of 2020 in most Western Balkan countries (notable exceptions are Kosovo and Montenegro due to a significant slump in service exports). Never-theless, the still low demand from the main trading partners (predominately EU countries) and the disruption of global value chains, which are particularly relevant for North Macedonia,7 negatively impacted export performance. In several countries (Kosovo, North Macedonia and Serbia), export growth, however, rebounded in the final quarter of 2020 for different reasons, such as improving global value chain trade (particularly relevant for North Macedonia), favorable agricultural output (as was the case in Serbia) or increased exports of base metals (Kosovo). Import growth declined strongly in the third quarter of 2020 (but less than in the second quarter of 2020) before improving somewhat in the f inal quarter of 2020. In all Western Balkan
7 See also Reiter, O. and R. Stehrer. 2021. Value Chain Integration of the Western Balkan Countries and Policy Options for the Post-COVID-19 Period. Policy Notes and Report. March 2021. wiiw.
Percentage points, year-on-year GDP growth in %
30
20
10
0
−10
−20
−30
−40
−50
GDP growth visibly recovered in H2 20
Source: National statistical offices.1 Gross capital formation for Bosnia and Herzegovina, Kosovo and North Macedonia.
Chart 2
Private consumption Public consumption Gross fixed capital formation1
Stock changes and statistical discrepancy Exports of goods and servicesGDP growth Net exports
Imports of goods and services
−2.3
−10.6
−2.8
3.0 2.3
−9.0−6.3
−3.8
1.3
−9.3 −7.3
0.7 2.6
−20.3
−26.9
−7.6
0.9
−14.9
−3.3−0.7
5.2
−6.2−1.4 −1.1
Q1 Q2 Q3 Q4 Q1 Q2 Q3 Q4 Q1 Q2 Q3 Q4 Q1 Q2 Q3 Q4 Q1 Q2 Q3 Q4 Q1 Q2 Q3 Q42020 2020 2020 2020 2020 2020
Albania Bosnia and Herzegovina Kosovo Montenegro North Macedonia Serbia

Developments in selected CESEE countries
FOCUS ON EUROPEAN ECONOMIC INTEGRATION Q2/21 21
countries, net exports contributed negatively to GDP growth in the third quarter of 2020, but the growth contribution from the external sector turned positive in the final quarter of 2020.
Due to the economic shock caused by the COVID-19 pandemic, labor market figures wors-ened in many Western Balkan countries, but f iscal measures – in particular wage subsidy schemes8 – mitigated the negative impact at least to some extent. Albania, Bosnia and Herzegovina, North Macedonia and Kosovo reached an unemployment peak in the second quarter of 2020, with some improvements of employment figures taking place thereafter. The unemployment rate (according to labor force survey data) increased significantly in Montenegro: growing by almost 4 percentage points between the third quarter of 2019 and the same period of 2020,9 it reached an elevated level of 19.6%. At the same time, employment fell by 8.5 per-centage points to below 50% because people left the labor market, possibly shifting to the informal sector or due to retirements. In Serbia, by contrast, the employment rate accelerated in the final quarter of 2020 in an annual comparison, possibly due to very strong support for the business sector accompanied by higher labor market participation.
On a four-quarter moving average basis, current account deficits worsened in most Western Balkan countries in the second half of 2020 compared to the same period of the previous year, largely due to a drop in the services balance (see chart 3). Particularly in Montenegro, the services surplus slumped due to the poor tourist season. Similarly, in Kosovo, the diaspora stayed away in the second half of 2020 mainly because of travel restrictions. The shortfalls of the goods balance narrowed across the board (at least to some extent) due to a strong decline of import growth (weak private consumption, lower investment activity) and a less pronounced drop of exports compared to imports. Remittances presented a quite mixed picture; they even increased in some countries in the second half of 2020 compared to the same period of the previous year. This was particularly the case for Kosovo, where declining informal remittances
8 A detailed overview of wage subsidy schemes is provided by the World Bank. 2020. An Uncertain Recovery. Western Balkans Regular Economic Report. No. 18. Fall 2020.
9 For Montenegro, no figures for the last quarter of 2020 are available yet.
% of GDP, four-quarter moving average
45
35
25
15
5
−5
−15
−25
−35
−45
Current account deficits more or less stable in most Western Balkan countries
Source: National central banks, national statistical offices.
Note: A positive value in the category of direct investments indicates that net acquisition of assets is higher than net incurrence of liabilities; a negative value indicates the opposite.
Chart 3
Goods Services Primary incomeSecondary income Current account Direct investment
Q1 Q2 Q3 Q4 Q1 Q2 Q3 Q4 Q1 Q2 Q3 Q4 Q1 Q2 Q3 Q4 Q1 Q2 Q3 Q4 Q1 Q2 Q32020 2020 2020 2020 2020 2020
Albania Bosnia and Herzegovina Kosovo Montenegro North Macedonia Serbia

Developments in selected CESEE countries
22 OESTERREICHISCHE NATIONALBANK
were more than compensated by an accelerating inflow of formal remittances.10 Foreign direct investment (FDI) decelerated in the second half of 2020 in annual terms in most Western Balkan countries. The COVID-19 pandemic certainly played a key role due to restrictive measures and a high level of uncertainty. In addition, some large infrastructure projects, particularly in Albania, were finalized, leading to smaller inflows of foreign capital.
Inflationary pressure was subdued in most Western Balkan countries owing to low energy prices and a weak propensity to consume as a result of lockdown measures and elevated uncertainty among households. Bosnia and Herzegovina, Kosovo and Montenegro reported negative inflation rates in the third and fourth quarters of 2020. North Macedonia was a notable exception: annual inflation accelerated to 2.2% in the fourth quarter of 2020 and the first quarter of 2021, mainly due to higher prices for food, alcohol and tobacco. Kosovo and Serbia saw accelerating inflation rates in early 2021 as well. Albania and Serbia are the only two countries in the Western Balkans with a flexible exchange rate regime and both exchange rates have remained rather stable against the euro since our last reporting. In the case of Serbia, however, it was to a large extent thanks to interventions by the National Bank of Serbia (NBS) as the dinar faced both depreciation and appreciation pressures. Central banks have implemented a range of measures to support the economy in light of the severe economic disruptions caused by the COVID-19 pandemic. Regarding interest rates, the NBS trimmed its key policy rate in December 2020 for the fourth time since the start of the COVID-19 pandemic, reducing it by 25 basis points to 1%. The NBS, in particular, was very active in providing addi-tional liquidity to the banking sector.11 For the third time since March 2020, the National Bank of the Republic of North Macedonia (NBRNM) cut its policy rate, from 1.5% to 1.25% in March 2021. The usage of loan moratoria was quite extensive. In North Macedonia, for instance, 44% of the total credit portfolio was under eased repayment conditions in April 2021, according to the NBRNM. Comparing end-2019 with end-2020 growth rates, we find that credit activity generally moderated in the Western Balkan countries due to demand- and supply- side factors. In Bosnia and Herzegovina, credit growth was already weak before the crisis, turned negative in March 2020 and has remained in negative territory since. Serbia, by contrast, has recorded accelerating credit activity, likely related to loan guarantee schemes, cheap loans to most affected sectors or relaxed standards for taking up housing loans. Despite the severe economic crisis, NPL ratios did not accelerate significantly from end-2019 to end-2020 and even declined in some countries (see Statistical annex, table 3). The most notable NPL decline was registered in North Macedonia due to crisis-related changes of reclassification requirements. As a consequence, the full impact of the crisis has not yet come to the fore – as in other areas of the economy – due to measures (particularly loan moratoria) implemented to cushion the immediate impact of the crisis. Apparently, the profitability of the banking sector has worsened since the outbreak of the COVID-19 pandemic in most Western Balkan countries. Return on equity and return on assets dropped most strongly in Montenegro and Serbia.
The COVID-19-induced shock also changed fiscal plans for all Western Balkan countries. Economic disruptions and fiscal support packages to mitigate the negative impact of the crisis are reflected in significant increases of budget deficits and government debt. In 2020, budget deficits reached almost 9% of GDP in Montenegro, North Macedonia and Serbia. The accel-eration was strongest in Serbia (budget deficit in 2019: 0.2%). Regarding the debt-to-GDP ratio, the increase was highest in Albania (almost +15 percentage points) and the ratio amounted to almost 80% at the end of 2020. In Montenegro, the debt ratio stood at close to 90% in 2020, the highest in the region. A large share of the debt relates to a Chinese loan of USD 1 billion taken out in 2014 for the construction of a highway. Montenegro has asked the EU for assistance to repay the loan, but so far the European Commission has refused to repay the
10 According to the central bank of Kosovo, formal remittances transferred through money-transferring agencies accelerated by more than 54% in annual terms in the fourth quarter of 2020 and formal remittances through banks by almost 30%, whereas informal remittances declined by about 14%.
11 In November 2020, the NBS announced additional FX purchase swap auctions and securities purchase repo auctions. Additional FX swap auctions were stopped in March 2021 but the NBS continues with additional repo purchase auctions of dinar securities on a regular weekly basis.

Developments in selected CESEE countries
FOCUS ON EUROPEAN ECONOMIC INTEGRATION Q2/21 23
debt, offering funding for the completion of the highway projects instead. By contrast, Kosovo reported a debt-to-GDP ratio of just 22% (2019: 17%). Support packages varied in size across the Western Balkan countries. With more than 12% of GDP in 2020 (including loan guarantees, tax deferrals, etc.), Serbia is expected to be the frontrunner, whereas Albania as well as Bosnia and Herzegovina have allocated relief packages of less than 3% of GDP. Since the start of the crisis, several countries have placed Eurobonds on international markets in response to the COVID-19 pandemic.12 There were some noteworthy rating changes, e.g. for Montenegro – Standard & Poor’s downgraded the long-term FX sovereign debt rating from B+ to B in March 2021 due to the country’s strained fiscal and balance-of-payments positions. In the case of Serbia, the rating was upgraded by Moody’s to Ba2 in March 2021.
International institutions, in particular the European Commission and the IMF, have sup-ported the Western Balkan countries since the start of the pandemic. Most importantly, under its macro-financial assistance (MFA), the EU is providing a total of EUR 750 million to the Western Balkan countries, equaling roughly 1.2% to 1.4% of GDP for each country (except for Serbia). The assistance will be paid out in tranches and the first installment was disbursed to Kosovo, Montenegro and North Macedonia in October 2020 and to Albania in March 2021. The IMF supports the Western Balkan countries13 under its Rapid Financing Instrument (RFI), which is comparable in size with the MFA. As a backstop facility, the ECB granted repo lines to Albania (EUR 400 million), North Macedonia (EUR 400 million) and Serbia (EUR 1 billion). The repo lines will expire in June 2022. According to the Central Bank of Montenegro (CBCG), Montenegro is allowed to apply for systemic liquidity support of up to EUR 250 million under the Eurosystem repo facility for central banks, and the deadline for using this tool was extended until March 2022. After the EU finally gave the green light for starting accession negotiations with Albania and North Macedonia in March 2020, the EU member state Bulgaria is blocking the actual start of negotiations over some historical issues. The EU member states have to decide unanimously to start accession negotiations with a candidate country. In December 2020, the IMF discussed the resumption of a new three-year Extended Fund Facility (EFF) with the authorities from Bosnia and Herzegovina but no consensus has been reached due to dis-agreements regarding some reform items that should be part of the program (for instance, improved economic cooperation at the different state and entity levels or the strengthening of the financial stability framework).
12 Albania (7-year Eurobond of EUR 650 million in June 2020), Montenegro (7-year Eurobond of EUR 750 million in December 2020), North Macedonia (7-year Eurobond of EUR 700 million in June 2020) and Serbia (7-year Eurobond of EUR 2 billion in May 2020, 10-year Eurobond of EUR 1 billion in November 2020 and 12-year Eurobond of EUR 1 billion in February 2021). Furthermore, Republika Srpska, one of the two entities of Bosnia and Herzegovina, issued a 5-year Eurobond of EUR 300 million.
13 From 2018, Serbia had made use of the IMF Policy Coordination Instrument (PCI), which does not provide any funding. The PCI expired in January 2021. Talks between the IMF and Serbian authorities on a new nonfinancial arrangement are currently ongoing.
Developments in selected CESEE countries
24 OESTERREICHISCHE NATIONALBANK
2 Slovakia: recession moderated after economic plunge in spring
The coronavirus pandemic and the ensuing large-scale lockdown led to a deep recession in the first half of 2020. As COVID-19 infections receded and contain-ment measures were loosened during the summer of 2020, Slovakia’s economy experienced its strongest quarter-on-quarter GDP growth on record (+12% in the third quarter of 2020). Yet, the fall of 2020 brought about a renewed massive surge in coronavirus cases which peaked in early January and March 2021. While the country’s industry has been spared from the re-tightening of containment measures, the retail and services sectors have suffered from fierce restrictions. As a result, even though the massive economic downturn of the second quarter of 2020 could be stopped, the economy continued to shrink in the second half of the year. How-ever, at –5.2%, real GDP developments in 2020 fared better than the euro area average (–6.6%), the level recorded during the trough in 2009 (–5.5%) and, in particular, much better than the projections made at the onset of the COVID-19 pandemic. In the six months to December, all domestic demand components but government consumption put a significant drag on economic output. The slightly positive contribution of private consumption to GDP growth in the third quarter turned back into noticeably negative territory following the reintroduction of con-tainment measures in the final quarter of 2020. Firms’ investment in machinery and equipment as well as housing investment contributed to the recovery of fixed capital formation in the third quarter of 2020. Nonetheless, the contribution of fixed capital formation to growth remained negative and worsened further in the fourth quarter of 2020 on the back of the deteriorating pandemic situation and resulting uncer-tainty. Despite accelerated stock-building toward year-end, inventories made the single most negative contribution to GDP growth in the second half of 2020. Net exports had a significant positive impact on economic growth in the second half of last year, benefiting largely from a fast recovery of the automotive industry.
Following a marked increase in unemployment from 5.6% in December 2019 to 7.2% in August 2020, the jobless rate has been broadly stable since (7.3% in February 2021). Moreover, the positive impulse to economic activity in the second half of 2020 triggered a renewed rise in wages. Driven by food, some services, transport and energy prices, headline inflation had come down from 3.2% in December 2019 to 1.4% in August 2020, and stayed at about that level until the end of the year. Early 2021 saw some further moderation of inflation (0.7% in January and 0.9% in February) owing to a reduction in food and regulated energy prices.
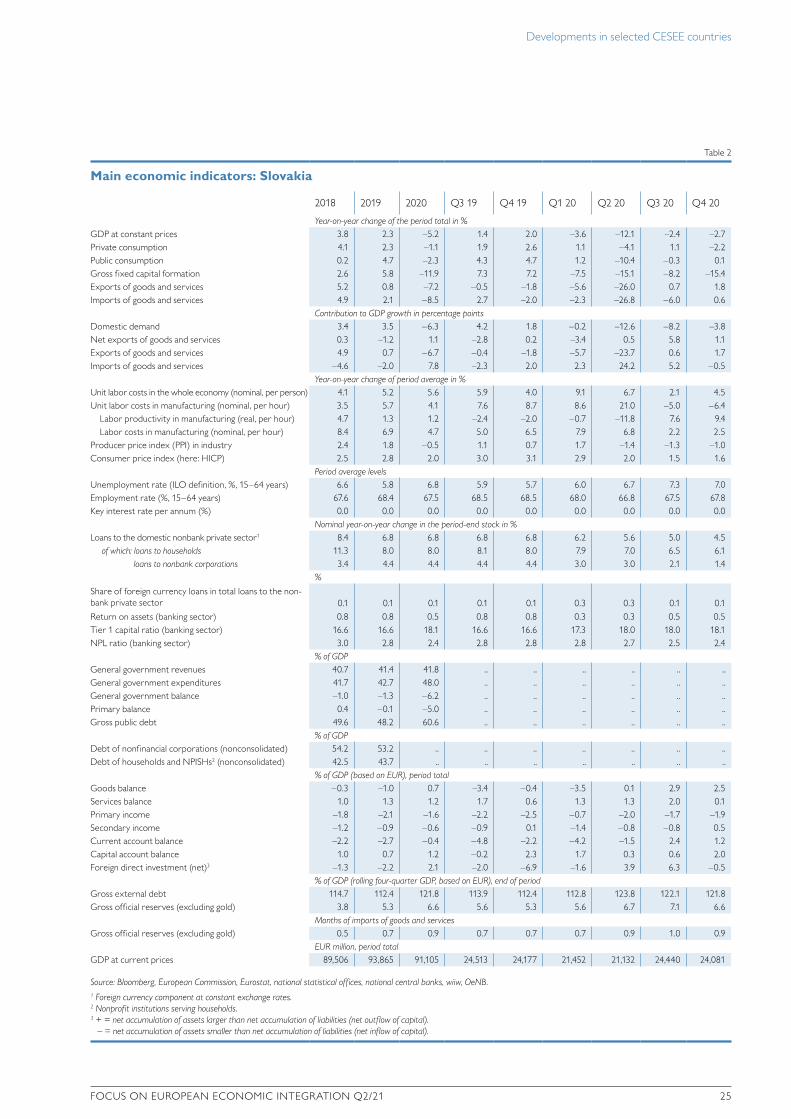
To cushion the impact of the pandemic, Slovakia’s “first-aid” package has been extended repeatedly in terms of size, eligible recipients and duration (currently in place until June 2021). It encompasses measures worth some 4.3% of 2020 GDP figures and focuses on employment support, sickness and nursing benefits as well as subsidized rents. In addition, several state guarantee schemes totaling 4.4% of last year’s GDP were put in place. According to Národná banka Slovenska (NBS), the utilization rate of the “first-aid” program fell from almost 90% of the potential at the beginning of the pandemic to 68% at end-2020. Actual payouts in 2020 thus amounted to 3.5% of GDP only. The general government fiscal deficit, which was originally targeted to reach 0.5% of GDP in 2020, eventually came in at 6.2% of GDP. For 2021, a deficit of 7.4% of GDP has been approved. Consequently, public debt is projected to go up from 48.2% of GDP in 2019 to roughly 65% of GDP in 2021. The NBS has continued its accommodative monetary stance, including keeping the countercyclical capital buffer rate at 1.0%.
Table 2
Main economic indicators: Slovakia
2018 2019 2020 Q3 19 Q4 19 Q1 20 Q2 20 Q3 20 Q4 20
Year-on-year change of the period total in %GDP at constant prices 3.8 2.3 –5.2 1.4 2.0 –3.6 –12.1 –2.4 –2.7Private consumption 4.1 2.3 –1.1 1.9 2.6 1.1 –4.1 1.1 –2.2Public consumption 0.2 4.7 –2.3 4.3 4.7 1.2 –10.4 –0.3 0.1Gross fixed capital formation 2.6 5.8 –11.9 7.3 7.2 –7.5 –15.1 –8.2 –15.4Exports of goods and services 5.2 0.8 –7.2 –0.5 –1.8 –5.6 –26.0 0.7 1.8Imports of goods and services 4.9 2.1 –8.5 2.7 –2.0 –2.3 –26.8 –6.0 0.6
Contribution to GDP growth in percentage pointsDomestic demand 3.4 3.5 –6.3 4.2 1.8 –0.2 –12.6 –8.2 –3.8Net exports of goods and services 0.3 –1.2 1.1 –2.8 0.2 –3.4 0.5 5.8 1.1Exports of goods and services 4.9 0.7 –6.7 –0.4 –1.8 –5.7 –23.7 0.6 1.7Imports of goods and services –4.6 –2.0 7.8 –2.3 2.0 2.3 24.2 5.2 –0.5
Year-on-year change of period average in %Unit labor costs in the whole economy (nominal, per person) 4.1 5.2 5.6 5.9 4.0 9.1 6.7 2.1 4.5Unit labor costs in manufacturing (nominal, per hour) 3.5 5.7 4.1 7.6 8.7 8.6 21.0 –5.0 –6.4
Labor productivity in manufacturing (real, per hour) 4.7 1.3 1.2 –2.4 –2.0 –0.7 –11.8 7.6 9.4Labor costs in manufacturing (nominal, per hour) 8.4 6.9 4.7 5.0 6.5 7.9 6.8 2.2 2.5
Producer price index (PPI) in industry 2.4 1.8 –0.5 1.1 0.7 1.7 –1.4 –1.3 –1.0Consumer price index (here: HICP) 2.5 2.8 2.0 3.0 3.1 2.9 2.0 1.5 1.6
Period average levelsUnemployment rate (ILO definition, %, 15–64 years) 6.6 5.8 6.8 5.9 5.7 6.0 6.7 7.3 7.0Employment rate (%, 15–64 years) 67.6 68.4 67.5 68.5 68.5 68.0 66.8 67.5 67.8Key interest rate per annum (%) 0.0 0.0 0.0 0.0 0.0 0.0 0.0 0.0 0.0
Nominal year-on-year change in the period-end stock in %Loans to the domestic nonbank private sector1 8.4 6.8 6.8 6.8 6.8 6.2 5.6 5.0 4.5
of which: loans to households 11.3 8.0 8.0 8.1 8.0 7.9 7.0 6.5 6.1loans to nonbank corporations 3.4 4.4 4.4 4.4 4.4 3.0 3.0 2.1 1.4
%
Share of foreign currency loans in total loans to the non-bank private sector 0.1 0.1 0.1 0.1 0.1 0.3 0.3 0.1 0.1Return on assets (banking sector) 0.8 0.8 0.5 0.8 0.8 0.3 0.3 0.5 0.5Tier 1 capital ratio (banking sector) 16.6 16.6 18.1 16.6 16.6 17.3 18.0 18.0 18.1NPL ratio (banking sector) 3.0 2.8 2.4 2.8 2.8 2.8 2.7 2.5 2.4
% of GDPGeneral government revenues 40.7 41.4 41.8 .. .. .. .. .. ..General government expenditures 41.7 42.7 48.0 .. .. .. .. .. ..General government balance –1.0 –1.3 –6.2 .. .. .. .. .. ..Primary balance 0.4 –0.1 –5.0 .. .. .. .. .. ..Gross public debt 49.6 48.2 60.6 .. .. .. .. .. ..
% of GDPDebt of nonfinancial corporations (nonconsolidated) 54.2 53.2 .. .. .. .. .. .. ..Debt of households and NPISHs2 (nonconsolidated) 42.5 43.7 .. .. .. .. .. .. ..
% of GDP (based on EUR), period totalGoods balance –0.3 –1.0 0.7 –3.4 –0.4 –3.5 0.1 2.9 2.5Services balance 1.0 1.3 1.2 1.7 0.6 1.3 1.3 2.0 0.1Primary income –1.8 –2.1 –1.6 –2.2 –2.5 –0.7 –2.0 –1.7 –1.9Secondary income –1.2 –0.9 –0.6 –0.9 0.1 –1.4 –0.8 –0.8 0.5Current account balance –2.2 –2.7 –0.4 –4.8 –2.2 –4.2 –1.5 2.4 1.2Capital account balance 1.0 0.7 1.2 –0.2 2.3 1.7 0.3 0.6 2.0Foreign direct investment (net)3 –1.3 –2.2 2.1 –2.0 –6.9 –1.6 3.9 6.3 –0.5
% of GDP (rolling four-quarter GDP, based on EUR), end of periodGross external debt 114.7 112.4 121.8 113.9 112.4 112.8 123.8 122.1 121.8Gross official reserves (excluding gold) 3.8 5.3 6.6 5.6 5.3 5.6 6.7 7.1 6.6
Months of imports of goods and servicesGross official reserves (excluding gold) 0.5 0.7 0.9 0.7 0.7 0.7 0.9 1.0 0.9
EUR million, period totalGDP at current prices 89,506 93,865 91,105 24,513 24,177 21,452 21,132 24,440 24,081
Source: Bloomberg, European Commission, Eurostat, national statistical offices, national central banks, wiiw, OeNB.1 Foreign currency component at constant exchange rates.2 Nonprofit institutions serving households.3 + = net accumulation of assets larger than net accumulation of liabilities (net outflow of capital). – = net accumulation of assets smaller than net accumulation of liabilities (net inf low of capital).
Developments in selected CESEE countries
FOCUS ON EUROPEAN ECONOMIC INTEGRATION Q2/21 25
2 Slovakia: recession moderated after economic plunge in spring
The coronavirus pandemic and the ensuing large-scale lockdown led to a deep recession in the first half of 2020. As COVID-19 infections receded and contain-ment measures were loosened during the summer of 2020, Slovakia’s economy experienced its strongest quarter-on-quarter GDP growth on record (+12% in the third quarter of 2020). Yet, the fall of 2020 brought about a renewed massive surge in coronavirus cases which peaked in early January and March 2021. While the country’s industry has been spared from the re-tightening of containment measures, the retail and services sectors have suffered from fierce restrictions. As a result, even though the massive economic downturn of the second quarter of 2020 could be stopped, the economy continued to shrink in the second half of the year. How-ever, at –5.2%, real GDP developments in 2020 fared better than the euro area average (–6.6%), the level recorded during the trough in 2009 (–5.5%) and, in particular, much better than the projections made at the onset of the COVID-19 pandemic. In the six months to December, all domestic demand components but government consumption put a significant drag on economic output. The slightly positive contribution of private consumption to GDP growth in the third quarter turned back into noticeably negative territory following the reintroduction of con-tainment measures in the final quarter of 2020. Firms’ investment in machinery and equipment as well as housing investment contributed to the recovery of fixed capital formation in the third quarter of 2020. Nonetheless, the contribution of fixed capital formation to growth remained negative and worsened further in the fourth quarter of 2020 on the back of the deteriorating pandemic situation and resulting uncer-tainty. Despite accelerated stock-building toward year-end, inventories made the single most negative contribution to GDP growth in the second half of 2020. Net exports had a significant positive impact on economic growth in the second half of last year, benefiting largely from a fast recovery of the automotive industry.
Following a marked increase in unemployment from 5.6% in December 2019 to 7.2% in August 2020, the jobless rate has been broadly stable since (7.3% in February 2021). Moreover, the positive impulse to economic activity in the second half of 2020 triggered a renewed rise in wages. Driven by food, some services, transport and energy prices, headline inflation had come down from 3.2% in December 2019 to 1.4% in August 2020, and stayed at about that level until the end of the year. Early 2021 saw some further moderation of inflation (0.7% in January and 0.9% in February) owing to a reduction in food and regulated energy prices.
To cushion the impact of the pandemic, Slovakia’s “first-aid” package has been extended repeatedly in terms of size, eligible recipients and duration (currently in place until June 2021). It encompasses measures worth some 4.3% of 2020 GDP figures and focuses on employment support, sickness and nursing benefits as well as subsidized rents. In addition, several state guarantee schemes totaling 4.4% of last year’s GDP were put in place. According to Národná banka Slovenska (NBS), the utilization rate of the “first-aid” program fell from almost 90% of the potential at the beginning of the pandemic to 68% at end-2020. Actual payouts in 2020 thus amounted to 3.5% of GDP only. The general government fiscal deficit, which was originally targeted to reach 0.5% of GDP in 2020, eventually came in at 6.2% of GDP. For 2021, a deficit of 7.4% of GDP has been approved. Consequently, public debt is projected to go up from 48.2% of GDP in 2019 to roughly 65% of GDP in 2021. The NBS has continued its accommodative monetary stance, including keeping the countercyclical capital buffer rate at 1.0%.
Table 2
Main economic indicators: Slovakia
2018 2019 2020 Q3 19 Q4 19 Q1 20 Q2 20 Q3 20 Q4 20
Year-on-year change of the period total in %GDP at constant prices 3.8 2.3 –5.2 1.4 2.0 –3.6 –12.1 –2.4 –2.7Private consumption 4.1 2.3 –1.1 1.9 2.6 1.1 –4.1 1.1 –2.2Public consumption 0.2 4.7 –2.3 4.3 4.7 1.2 –10.4 –0.3 0.1Gross fixed capital formation 2.6 5.8 –11.9 7.3 7.2 –7.5 –15.1 –8.2 –15.4Exports of goods and services 5.2 0.8 –7.2 –0.5 –1.8 –5.6 –26.0 0.7 1.8Imports of goods and services 4.9 2.1 –8.5 2.7 –2.0 –2.3 –26.8 –6.0 0.6
Contribution to GDP growth in percentage pointsDomestic demand 3.4 3.5 –6.3 4.2 1.8 –0.2 –12.6 –8.2 –3.8Net exports of goods and services 0.3 –1.2 1.1 –2.8 0.2 –3.4 0.5 5.8 1.1Exports of goods and services 4.9 0.7 –6.7 –0.4 –1.8 –5.7 –23.7 0.6 1.7Imports of goods and services –4.6 –2.0 7.8 –2.3 2.0 2.3 24.2 5.2 –0.5
Year-on-year change of period average in %Unit labor costs in the whole economy (nominal, per person) 4.1 5.2 5.6 5.9 4.0 9.1 6.7 2.1 4.5Unit labor costs in manufacturing (nominal, per hour) 3.5 5.7 4.1 7.6 8.7 8.6 21.0 –5.0 –6.4
Labor productivity in manufacturing (real, per hour) 4.7 1.3 1.2 –2.4 –2.0 –0.7 –11.8 7.6 9.4Labor costs in manufacturing (nominal, per hour) 8.4 6.9 4.7 5.0 6.5 7.9 6.8 2.2 2.5
Producer price index (PPI) in industry 2.4 1.8 –0.5 1.1 0.7 1.7 –1.4 –1.3 –1.0Consumer price index (here: HICP) 2.5 2.8 2.0 3.0 3.1 2.9 2.0 1.5 1.6
Period average levelsUnemployment rate (ILO definition, %, 15–64 years) 6.6 5.8 6.8 5.9 5.7 6.0 6.7 7.3 7.0Employment rate (%, 15–64 years) 67.6 68.4 67.5 68.5 68.5 68.0 66.8 67.5 67.8Key interest rate per annum (%) 0.0 0.0 0.0 0.0 0.0 0.0 0.0 0.0 0.0
Nominal year-on-year change in the period-end stock in %Loans to the domestic nonbank private sector1 8.4 6.8 6.8 6.8 6.8 6.2 5.6 5.0 4.5
of which: loans to households 11.3 8.0 8.0 8.1 8.0 7.9 7.0 6.5 6.1loans to nonbank corporations 3.4 4.4 4.4 4.4 4.4 3.0 3.0 2.1 1.4
%
Share of foreign currency loans in total loans to the non-bank private sector 0.1 0.1 0.1 0.1 0.1 0.3 0.3 0.1 0.1Return on assets (banking sector) 0.8 0.8 0.5 0.8 0.8 0.3 0.3 0.5 0.5Tier 1 capital ratio (banking sector) 16.6 16.6 18.1 16.6 16.6 17.3 18.0 18.0 18.1NPL ratio (banking sector) 3.0 2.8 2.4 2.8 2.8 2.8 2.7 2.5 2.4
% of GDPGeneral government revenues 40.7 41.4 41.8 .. .. .. .. .. ..General government expenditures 41.7 42.7 48.0 .. .. .. .. .. ..General government balance –1.0 –1.3 –6.2 .. .. .. .. .. ..Primary balance 0.4 –0.1 –5.0 .. .. .. .. .. ..Gross public debt 49.6 48.2 60.6 .. .. .. .. .. ..
% of GDPDebt of nonfinancial corporations (nonconsolidated) 54.2 53.2 .. .. .. .. .. .. ..Debt of households and NPISHs2 (nonconsolidated) 42.5 43.7 .. .. .. .. .. .. ..
% of GDP (based on EUR), period totalGoods balance –0.3 –1.0 0.7 –3.4 –0.4 –3.5 0.1 2.9 2.5Services balance 1.0 1.3 1.2 1.7 0.6 1.3 1.3 2.0 0.1Primary income –1.8 –2.1 –1.6 –2.2 –2.5 –0.7 –2.0 –1.7 –1.9Secondary income –1.2 –0.9 –0.6 –0.9 0.1 –1.4 –0.8 –0.8 0.5Current account balance –2.2 –2.7 –0.4 –4.8 –2.2 –4.2 –1.5 2.4 1.2Capital account balance 1.0 0.7 1.2 –0.2 2.3 1.7 0.3 0.6 2.0Foreign direct investment (net)3 –1.3 –2.2 2.1 –2.0 –6.9 –1.6 3.9 6.3 –0.5
% of GDP (rolling four-quarter GDP, based on EUR), end of periodGross external debt 114.7 112.4 121.8 113.9 112.4 112.8 123.8 122.1 121.8Gross official reserves (excluding gold) 3.8 5.3 6.6 5.6 5.3 5.6 6.7 7.1 6.6
Months of imports of goods and servicesGross official reserves (excluding gold) 0.5 0.7 0.9 0.7 0.7 0.7 0.9 1.0 0.9
EUR million, period totalGDP at current prices 89,506 93,865 91,105 24,513 24,177 21,452 21,132 24,440 24,081
Source: Bloomberg, European Commission, Eurostat, national statistical offices, national central banks, wiiw, OeNB.1 Foreign currency component at constant exchange rates.2 Nonprofit institutions serving households.3 + = net accumulation of assets larger than net accumulation of liabilities (net outflow of capital). – = net accumulation of assets smaller than net accumulation of liabilities (net inf low of capital).

Developments in selected CESEE countries
26 OESTERREICHISCHE NATIONALBANK
3 Slovenia: pandemic continues to weigh on economy in late 2020Slovenia’s GDP contracted by 5.5% in 2020, hence to a lesser extent than expected in the most recent official forecasts (between –6% and –8%). The sharp drop in output during the second quarter of 2020 was followed by a recovery in the third quarter. However, the reintroduction of selected lockdown measures led to an even sharper decline in GDP in the final quarter of the year. Net real exports were supportive in the second half of 2020, as imports continued to contract more than exports. Investments gradually recovered during the second half of the year, mainly owing to the recovery of construction activity. The reintroduction of lock-down measures in the fourth quarter of 2020 left a clear mark on private consump-tion, which contracted almost as much as in the second quarter of 2020. Consumer confidence almost fell back to its spring lows, despite the decrease in unemploy-ment figures and increase in real wages (supported also by HICP deflation). By contrast, public consumption expanded in the second half of 2020 in connection with measures taken by the government in response to the pandemic (e.g. salary bonuses, COVID-19-related medical expenditure). High-frequency indicators improved at the beginning of 2021, but new restrictions imposed in early April are likely to further delay a sustained economic recovery.
The general government budget deficit reached 8.4% of GDP in 2020 and public debt rose to 80.8%. This increase was attributable to the decline in economic activity, the workings of automatic stabilizers, and government measures put in place to mitigate the economic impact of the coronavirus pandemic. According to the Fiscal Council of Slovenia, the direct effects of COVID-19-related measures on the general government budget balance amounted to around 6.3% of GDP in 2020 (including measures with indirect effects), which was substantially lower than the estimated size of the seven anti-crisis packages introduced thus far. At the beginning of February 2021, Slovenia’s parliament adopted an eighth package with an estimated size of some EUR 320 million, which is mainly aimed at helping companies shoulder the minimum wage rise by nearly 9% in early 2021 and at extending the furlough and short-time work schemes. According to the country’s draft budgetary plan for 2021, the budget deficit should fall to 6.6% of GDP, mainly due to the expected economic rebound (GDP is expected to grow by 5.1% in 2021) and smaller discre-tionary COVID-19-related spending.
Annual consumer price index (CPI) growth remained negative from August 2020 up to February 2021, coming in at –1.1% in February 2021. Deflation was partly the result of the still prevailing base effect caused by the sharp fall in energy prices in March and April 2020 and the considerable deceleration in unprocessed food price inflation. At the same time, core inflationary pressures remained low and even turned negative in February 2021.
Growth in credit to households and corporates moderated between July 2020 and February 2021, with corporate credit growth becoming increasingly negative from August 2020 onward (despite the extension of state guarantees for corporate liquidity loans in November 2020) and household credit growth turning negative in January 2021 (despite the favorable impact of the loan moratorium on outstanding loan amounts). These developments were likely driven by both demand factors and the tightening of banks’ lending standards in each client segment. According to the assessment of Banka Slovenije, risks to financial stability remained greatly elevated at the beginning of 2021 due to the economic impact of the pandemic. Income and credit risks are the most prominent ones, weighing severely on bank profitability.
Table 3
Main economic indicators: Slovenia
2018 2019 2020 Q3 19 Q4 19 Q1 20 Q2 20 Q3 20 Q4 20
Year-on-year change of the period total in %GDP at constant prices 4.4 3.2 –5.5 3.1 2.0 –2.3 –12.9 –2.4 –4.5Private consumption 3.6 4.8 –9.7 5.8 2.3 –6.4 –17.2 –0.5 –14.4Public consumption 3.0 1.7 1.8 2.5 –0.3 4.1 –1.1 1.3 2.8Gross fixed capital formation 9.6 5.8 –4.1 4.8 –1.2 –3.5 –13.8 –0.8 2.0Exports of goods and services 6.3 4.1 –8.7 4.9 1.1 –0.8 –23.4 –9.5 –0.4Imports of goods and services 7.2 4.4 –10.2 7.6 –0.3 –1.9 –24.0 –12.5 –2.0
Contribution to GDP growth in percentage pointsDomestic demand 4.5 3.1 –6.0 4.6 0.9 –3.1 –11.2 –3.9 –5.6Net exports of goods and services –0.1 0.1 0.4 –1.5 1.1 0.7 –1.5 1.6 1.2Exports of goods and services 5.2 3.5 –7.3 4.1 0.9 –0.8 –20.0 –7.9 –0.3Imports of goods and services –5.3 –3.4 7.7 –5.7 0.3 1.5 18.5 9.4 1.5
Year-on-year change of period average in %Unit labor costs in the whole economy (nominal, per person) 2.8 4.2 7.4 4.2 3.9 6.8 9.8 3.8 9.1Unit labor costs in manufacturing (nominal, per hour) –2.7 0.0 7.1 –1.8 0.4 2.0 21.4 4.8 1.7
Labor productivity in manufacturing (real, per hour) 6.5 4.0 –3.9 3.7 2.3 2.4 –14.4 –2.7 –0.6Labor costs in manufacturing (nominal, per hour) 3.6 3.9 2.8 1.8 2.7 4.5 3.9 2.0 1.1
Producer price index (PPI) in industry 2.1 0.6 –0.3 0.3 0.4 –0.1 –0.6 –0.3 –0.2Consumer price index (here: HICP) 1.9 1.7 –0.3 2.1 1.6 1.6 –1.2 –0.6 –0.9
Period average levelsUnemployment rate (ILO definition, %, 15–64 years) 5.2 4.5 5.0 4.8 4.0 4.6 5.2 5.2 5.1Employment rate (%, 15–64 years) 71.1 71.9 70.9 72.1 71.6 71.5 70.0 70.8 71.1Key interest rate per annum (%) 0.0 0.0 0.0 0.0 0.0 0.0 0.0 0.0 0.0
Nominal year-on-year change in the period-end stock in %Loans to the domestic nonbank private sector1 1.9 4.3 4.3 3.9 4.3 5.1 1.3 0.1 –1.0
of which: loans to households 6.4 5.8 5.8 5.7 5.8 4.1 1.6 1.2 0.1loans to nonbank corporations –2.2 2.8 2.8 2.1 2.8 6.1 1.1 –1.0 –2.2
%
Share of foreign currency loans in total loans to the non-bank private sector 2.0 1.7 1.4 1.8 1.7 1.6 1.6 1.5 1.4Return on assets (banking sector) 1.3 1.3 1.0 1.6 1.3 0.6 0.6 1.2 1.0Tier 1 capital ratio (banking sector) 17.6 17.8 16.7 17.7 17.8 16.3 17.7 18.2 16.7NPL ratio (banking sector) 2.3 1.1 1.1 1.5 1.1 1.1 1.2 1.0 1.1
% of GDPGeneral government revenues 44.3 43.7 43.6 .. .. .. .. .. ..General government expenditures 43.5 43.3 52.0 .. .. .. .. .. ..General government balance 0.7 0.4 –8.4 .. .. .. .. .. ..Primary balance 2.8 2.1 –6.8 .. .. .. .. .. ..Gross public debt 70.3 65.6 80.8 .. .. .. .. .. ..
% of GDPDebt of nonfinancial corporations (nonconsolidated) 51.5 48.5 .. .. .. .. .. .. ..Debt of households and NPISHs2 (nonconsolidated) 26.9 26.9 .. .. .. .. .. .. ..
% of GDP (based on EUR), period totalGoods balance 2.8 2.7 5.4 1.6 2.2 5.2 5.4 6.0 5.1Services balance 5.7 5.8 4.3 6.7 5.9 4.5 3.6 4.4 4.5Primary income –1.8 –1.8 –1.5 –1.9 –2.2 –1.0 –1.8 –2.2 –1.0Secondary income –0.9 –1.1 –1.1 –1.1 –0.6 –1.5 –1.3 –0.8 –1.0Current account balance 5.8 5.6 7.1 5.3 5.3 7.3 5.9 7.4 7.6Capital account balance –0.5 –0.4 –0.5 –0.2 –1.0 –0.5 –0.2 –0.2 –1.0Foreign direct investment (net)3 –2.0 –1.5 0.0 –1.0 –0.9 –1.5 –1.0 –0.9 3.5
% of GDP (rolling four-quarter GDP, based on EUR), end of periodGross external debt 91.9 90.5 104.1 93.1 90.5 94.7 102.1 102.3 104.1Gross official reserves (excluding gold) 1.5 1.6 2.0 1.6 1.6 1.7 1.8 1.9 2.0
Months of imports of goods and servicesGross official reserves (excluding gold) 0.2 0.3 0.3 0.3 0.3 0.3 0.3 0.3 0.3
EUR million, period totalGDP at current prices 45,863 48,393 46,297 12,489 12,462 11,283 10,915 12,164 11,935
Source: Bloomberg, European Commission, Eurostat, national statistical offices, national central banks, wiiw, OeNB.1 Foreign currency component at constant exchange rates.2 Nonprofit institutions serving households.3 + = net accumulation of assets larger than net accumulation of liabilities (net outflow of capital).– = net accumulation of assets smaller than net accumulation of liabilities (net inf low of capital).

Developments in selected CESEE countries
FOCUS ON EUROPEAN ECONOMIC INTEGRATION Q2/21 27
3 Slovenia: pandemic continues to weigh on economy in late 2020Slovenia’s GDP contracted by 5.5% in 2020, hence to a lesser extent than expected in the most recent official forecasts (between –6% and –8%). The sharp drop in output during the second quarter of 2020 was followed by a recovery in the third quarter. However, the reintroduction of selected lockdown measures led to an even sharper decline in GDP in the final quarter of the year. Net real exports were supportive in the second half of 2020, as imports continued to contract more than exports. Investments gradually recovered during the second half of the year, mainly owing to the recovery of construction activity. The reintroduction of lock-down measures in the fourth quarter of 2020 left a clear mark on private consump-tion, which contracted almost as much as in the second quarter of 2020. Consumer confidence almost fell back to its spring lows, despite the decrease in unemploy-ment figures and increase in real wages (supported also by HICP deflation). By contrast, public consumption expanded in the second half of 2020 in connection with measures taken by the government in response to the pandemic (e.g. salary bonuses, COVID-19-related medical expenditure). High-frequency indicators improved at the beginning of 2021, but new restrictions imposed in early April are likely to further delay a sustained economic recovery.
The general government budget deficit reached 8.4% of GDP in 2020 and public debt rose to 80.8%. This increase was attributable to the decline in economic activity, the workings of automatic stabilizers, and government measures put in place to mitigate the economic impact of the coronavirus pandemic. According to the Fiscal Council of Slovenia, the direct effects of COVID-19-related measures on the general government budget balance amounted to around 6.3% of GDP in 2020 (including measures with indirect effects), which was substantially lower than the estimated size of the seven anti-crisis packages introduced thus far. At the beginning of February 2021, Slovenia’s parliament adopted an eighth package with an estimated size of some EUR 320 million, which is mainly aimed at helping companies shoulder the minimum wage rise by nearly 9% in early 2021 and at extending the furlough and short-time work schemes. According to the country’s draft budgetary plan for 2021, the budget deficit should fall to 6.6% of GDP, mainly due to the expected economic rebound (GDP is expected to grow by 5.1% in 2021) and smaller discre-tionary COVID-19-related spending.
Annual consumer price index (CPI) growth remained negative from August 2020 up to February 2021, coming in at –1.1% in February 2021. Deflation was partly the result of the still prevailing base effect caused by the sharp fall in energy prices in March and April 2020 and the considerable deceleration in unprocessed food price inflation. At the same time, core inflationary pressures remained low and even turned negative in February 2021.
Growth in credit to households and corporates moderated between July 2020 and February 2021, with corporate credit growth becoming increasingly negative from August 2020 onward (despite the extension of state guarantees for corporate liquidity loans in November 2020) and household credit growth turning negative in January 2021 (despite the favorable impact of the loan moratorium on outstanding loan amounts). These developments were likely driven by both demand factors and the tightening of banks’ lending standards in each client segment. According to the assessment of Banka Slovenije, risks to financial stability remained greatly elevated at the beginning of 2021 due to the economic impact of the pandemic. Income and credit risks are the most prominent ones, weighing severely on bank profitability.
Table 3
Main economic indicators: Slovenia
2018 2019 2020 Q3 19 Q4 19 Q1 20 Q2 20 Q3 20 Q4 20
Year-on-year change of the period total in %GDP at constant prices 4.4 3.2 –5.5 3.1 2.0 –2.3 –12.9 –2.4 –4.5Private consumption 3.6 4.8 –9.7 5.8 2.3 –6.4 –17.2 –0.5 –14.4Public consumption 3.0 1.7 1.8 2.5 –0.3 4.1 –1.1 1.3 2.8Gross fixed capital formation 9.6 5.8 –4.1 4.8 –1.2 –3.5 –13.8 –0.8 2.0Exports of goods and services 6.3 4.1 –8.7 4.9 1.1 –0.8 –23.4 –9.5 –0.4Imports of goods and services 7.2 4.4 –10.2 7.6 –0.3 –1.9 –24.0 –12.5 –2.0
Contribution to GDP growth in percentage pointsDomestic demand 4.5 3.1 –6.0 4.6 0.9 –3.1 –11.2 –3.9 –5.6Net exports of goods and services –0.1 0.1 0.4 –1.5 1.1 0.7 –1.5 1.6 1.2Exports of goods and services 5.2 3.5 –7.3 4.1 0.9 –0.8 –20.0 –7.9 –0.3Imports of goods and services –5.3 –3.4 7.7 –5.7 0.3 1.5 18.5 9.4 1.5
Year-on-year change of period average in %Unit labor costs in the whole economy (nominal, per person) 2.8 4.2 7.4 4.2 3.9 6.8 9.8 3.8 9.1Unit labor costs in manufacturing (nominal, per hour) –2.7 0.0 7.1 –1.8 0.4 2.0 21.4 4.8 1.7
Labor productivity in manufacturing (real, per hour) 6.5 4.0 –3.9 3.7 2.3 2.4 –14.4 –2.7 –0.6Labor costs in manufacturing (nominal, per hour) 3.6 3.9 2.8 1.8 2.7 4.5 3.9 2.0 1.1
Producer price index (PPI) in industry 2.1 0.6 –0.3 0.3 0.4 –0.1 –0.6 –0.3 –0.2Consumer price index (here: HICP) 1.9 1.7 –0.3 2.1 1.6 1.6 –1.2 –0.6 –0.9
Period average levelsUnemployment rate (ILO definition, %, 15–64 years) 5.2 4.5 5.0 4.8 4.0 4.6 5.2 5.2 5.1Employment rate (%, 15–64 years) 71.1 71.9 70.9 72.1 71.6 71.5 70.0 70.8 71.1Key interest rate per annum (%) 0.0 0.0 0.0 0.0 0.0 0.0 0.0 0.0 0.0
Nominal year-on-year change in the period-end stock in %Loans to the domestic nonbank private sector1 1.9 4.3 4.3 3.9 4.3 5.1 1.3 0.1 –1.0
of which: loans to households 6.4 5.8 5.8 5.7 5.8 4.1 1.6 1.2 0.1loans to nonbank corporations –2.2 2.8 2.8 2.1 2.8 6.1 1.1 –1.0 –2.2
%
Share of foreign currency loans in total loans to the non-bank private sector 2.0 1.7 1.4 1.8 1.7 1.6 1.6 1.5 1.4Return on assets (banking sector) 1.3 1.3 1.0 1.6 1.3 0.6 0.6 1.2 1.0Tier 1 capital ratio (banking sector) 17.6 17.8 16.7 17.7 17.8 16.3 17.7 18.2 16.7NPL ratio (banking sector) 2.3 1.1 1.1 1.5 1.1 1.1 1.2 1.0 1.1
% of GDPGeneral government revenues 44.3 43.7 43.6 .. .. .. .. .. ..General government expenditures 43.5 43.3 52.0 .. .. .. .. .. ..General government balance 0.7 0.4 –8.4 .. .. .. .. .. ..Primary balance 2.8 2.1 –6.8 .. .. .. .. .. ..Gross public debt 70.3 65.6 80.8 .. .. .. .. .. ..
% of GDPDebt of nonfinancial corporations (nonconsolidated) 51.5 48.5 .. .. .. .. .. .. ..Debt of households and NPISHs2 (nonconsolidated) 26.9 26.9 .. .. .. .. .. .. ..
% of GDP (based on EUR), period totalGoods balance 2.8 2.7 5.4 1.6 2.2 5.2 5.4 6.0 5.1Services balance 5.7 5.8 4.3 6.7 5.9 4.5 3.6 4.4 4.5Primary income –1.8 –1.8 –1.5 –1.9 –2.2 –1.0 –1.8 –2.2 –1.0Secondary income –0.9 –1.1 –1.1 –1.1 –0.6 –1.5 –1.3 –0.8 –1.0Current account balance 5.8 5.6 7.1 5.3 5.3 7.3 5.9 7.4 7.6Capital account balance –0.5 –0.4 –0.5 –0.2 –1.0 –0.5 –0.2 –0.2 –1.0Foreign direct investment (net)3 –2.0 –1.5 0.0 –1.0 –0.9 –1.5 –1.0 –0.9 3.5
% of GDP (rolling four-quarter GDP, based on EUR), end of periodGross external debt 91.9 90.5 104.1 93.1 90.5 94.7 102.1 102.3 104.1Gross official reserves (excluding gold) 1.5 1.6 2.0 1.6 1.6 1.7 1.8 1.9 2.0
Months of imports of goods and servicesGross official reserves (excluding gold) 0.2 0.3 0.3 0.3 0.3 0.3 0.3 0.3 0.3
EUR million, period totalGDP at current prices 45,863 48,393 46,297 12,489 12,462 11,283 10,915 12,164 11,935
Source: Bloomberg, European Commission, Eurostat, national statistical offices, national central banks, wiiw, OeNB.1 Foreign currency component at constant exchange rates.2 Nonprofit institutions serving households.3 + = net accumulation of assets larger than net accumulation of liabilities (net outflow of capital).– = net accumulation of assets smaller than net accumulation of liabilities (net inf low of capital).
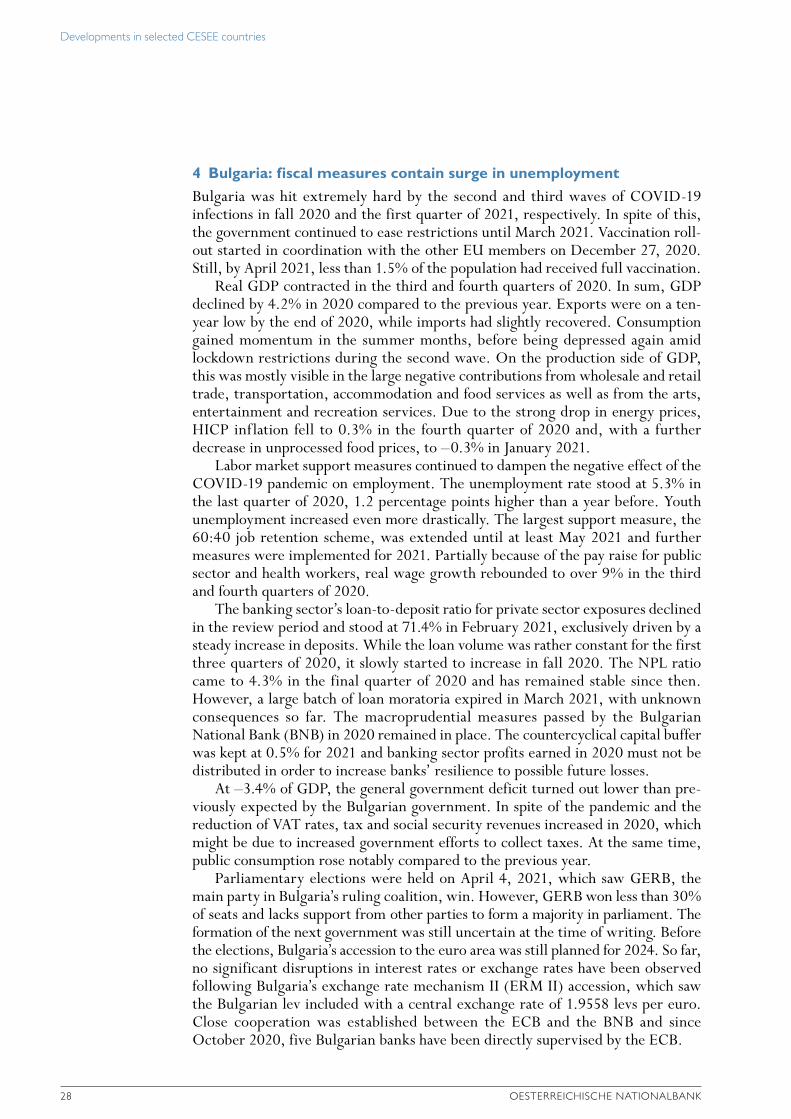
Developments in selected CESEE countries
28 OESTERREICHISCHE NATIONALBANK
4 Bulgaria: fiscal measures contain surge in unemployment
Bulgaria was hit extremely hard by the second and third waves of COVID-19 infections in fall 2020 and the first quarter of 2021, respectively. In spite of this, the government continued to ease restrictions until March 2021. Vaccination roll-out started in coordination with the other EU members on December 27, 2020. Still, by April 2021, less than 1.5% of the population had received full vaccination.
Real GDP contracted in the third and fourth quarters of 2020. In sum, GDP declined by 4.2% in 2020 compared to the previous year. Exports were on a ten-year low by the end of 2020, while imports had slightly recovered. Consumption gained momentum in the summer months, before being depressed again amid lockdown restrictions during the second wave. On the production side of GDP, this was mostly visible in the large negative contributions from wholesale and retail trade, transportation, accommodation and food services as well as from the arts, entertainment and recreation services. Due to the strong drop in energy prices, HICP inflation fell to 0.3% in the fourth quarter of 2020 and, with a further decrease in unprocessed food prices, to –0.3% in January 2021.
Labor market support measures continued to dampen the negative effect of the COVID-19 pandemic on employment. The unemployment rate stood at 5.3% in the last quarter of 2020, 1.2 percentage points higher than a year before. Youth unemployment increased even more drastically. The largest support measure, the 60:40 job retention scheme, was extended until at least May 2021 and further measures were implemented for 2021. Partially because of the pay raise for public sector and health workers, real wage growth rebounded to over 9% in the third and fourth quarters of 2020.
The banking sector’s loan-to-deposit ratio for private sector exposures declined in the review period and stood at 71.4% in February 2021, exclusively driven by a steady increase in deposits. While the loan volume was rather constant for the first three quarters of 2020, it slowly started to increase in fall 2020. The NPL ratio came to 4.3% in the final quarter of 2020 and has remained stable since then. However, a large batch of loan moratoria expired in March 2021, with unknown consequences so far. The macroprudential measures passed by the Bulgarian National Bank (BNB) in 2020 remained in place. The countercyclical capital buffer was kept at 0.5% for 2021 and banking sector profits earned in 2020 must not be distributed in order to increase banks’ resilience to possible future losses.
At –3.4% of GDP, the general government deficit turned out lower than pre-viously expected by the Bulgarian government. In spite of the pandemic and the reduction of VAT rates, tax and social security revenues increased in 2020, which might be due to increased government efforts to collect taxes. At the same time, public consumption rose notably compared to the previous year.
Parliamentary elections were held on April 4, 2021, which saw GERB, the main party in Bulgaria’s ruling coalition, win. However, GERB won less than 30% of seats and lacks support from other parties to form a majority in parliament. The formation of the next government was still uncertain at the time of writing. Before the elections, Bulgaria’s accession to the euro area was still planned for 2024. So far, no significant disruptions in interest rates or exchange rates have been observed following Bulgaria’s exchange rate mechanism II (ERM II) accession, which saw the Bulgarian lev included with a central exchange rate of 1.9558 levs per euro. Close cooperation was established between the ECB and the BNB and since October 2020, five Bulgarian banks have been directly supervised by the ECB.

Developments in selected CESEE countries
FOCUS ON EUROPEAN ECONOMIC INTEGRATION Q2/21 29
Table 4
Main economic indicators: Bulgaria
2018 2019 2020 Q3 19 Q4 19 Q1 20 Q2 20 Q3 20 Q4 20
Year-on-year change of the period total in %GDP at constant prices 3.1 3.7 –4.2 3.1 3.2 1.8 –8.5 –4.2 –4.7Private consumption 4.4 5.5 0.2 5.9 6.3 2.9 –4.0 7.1 –4.3Public consumption 5.3 2.0 7.5 2.1 4.2 6.3 3.9 5.8 12.5Gross fixed capital formation 5.4 4.5 –5.1 3.2 8.0 –10.2 –11.8 –1.4 0.9Exports of goods and services 1.7 3.9 –11.3 6.5 2.2 3.2 –19.0 –17.7 –9.3Imports of goods and services 5.7 5.2 –6.6 7.2 5.8 0.4 –19.5 –6.1 –1.2
Contribution to GDP growth in percentage pointsDomestic demand 5.6 4.4 –0.9 2.9 5.4 –0.3 –8.8 4.8 –0.1Net exports of goods and services –2.5 –0.7 –3.2 0.3 –2.1 1.9 0.3 –8.8 –4.6Exports of goods and services 1.1 2.5 –7.3 4.5 1.3 2.2 –11.8 –12.3 –5.3Imports of goods and services –3.6 –3.3 4.0 –4.2 –3.4 –0.3 12.1 3.5 0.7
Year-on-year change of period average in %Unit labor costs in the whole economy (nominal, per person) 6.3 3.5 7.6 2.2 3.7 3.1 8.9 8.5 10.5Unit labor costs in manufacturing (nominal, per hour) 4.9 3.5 2.9 6.0 4.8 7.3 9.6 –3.1 –2.3
Labor productivity in manufacturing (real, per hour) 3.7 7.7 2.5 3.6 7.6 1.5 1.1 1.2 5.8Labor costs in manufacturing (nominal, per hour) 8.8 11.6 5.2 9.8 12.8 9.0 10.9 –1.9 3.3
Producer price index (PPI) in industry 4.0 3.0 –2.0 3.4 2.8 1.4 –4.4 –2.8 –2.1Consumer price index (here: HICP) 2.6 2.5 1.2 2.2 2.3 3.0 1.1 0.6 0.3EUR per 1 BGN, + = BGN appreciation 0.0 0.0 0.0 0.0 0.0 0.0 0.0 0.0 0.0
Period average levelsUnemployment rate (ILO definition, %, 15–64 years) 5.3 4.3 5.2 3.7 4.1 4.6 6.0 4.9 5.3Employment rate (%, 15–64 years) 67.7 70.1 68.5 71.4 70.0 68.1 67.4 69.6 68.8Key interest rate per annum (%)1 .. .. .. .. .. .. .. .. ..BGN per 1 EUR 2.0 2.0 2.0 2.0 2.0 2.0 2.0 2.0 2.0
Nominal year-on-year change in period-end stock in %Loans to the domestic nonbank private sector2 8.3 9.4 9.4 7.2 9.4 9.1 6.6 5.8 4.3
of which: loans to households 11.2 9.5 9.5 9.1 9.5 9.9 8.0 7.5 6.6loans to nonbank corporations 6.6 9.3 9.3 6.0 9.3 8.7 5.7 4.7 2.9
%
Share of foreign currency loans in total loans to the non-bank private sector 34.9 33.2 31.9 33.1 33.2 32.7 32.6 31.6 31.9Return on assets (banking sector) 1.7 1.5 0.7 1.6 1.5 1.0 0.9 0.8 0.7Tier 1 capital ratio (banking sector) 19.4 19.5 22.1 20.2 19.5 19.8 22.5 22.3 22.1NPL ratio (banking sector) 5.1 4.2 4.3 5.0 4.2 4.2 5.2 4.9 4.3
% of GDPGeneral government revenues 38.6 38.5 39.5 .. .. .. .. .. ..General government expenditures 36.6 36.3 42.9 .. .. .. .. .. ..General government balance 2.0 2.1 –3.4 .. .. .. .. .. ..Primary balance 2.7 2.8 –2.8 .. .. .. .. .. ..Gross public debt 22.3 20.2 25.0 .. .. .. .. .. ..
% of GDPDebt of nonfinancial corporations (nonconsolidated) 83.5 79.5 .. .. .. .. .. .. ..Debt of households and NPISHs3 (nonconsolidated) 23.0 23.1 .. .. .. .. .. .. ..
% of GDP (based on EUR), period totalGoods balance –4.8 –4.7 –3.1 –2.9 –5.6 –3.1 –1.3 –2.4 –5.3Services balance 7.3 7.9 4.9 14.7 4.6 5.5 4.5 6.2 3.4Primary income –4.8 –3.1 –3.5 –3.4 –2.3 –3.9 –3.5 –4.0 –2.6Secondary income 3.2 2.9 1.0 2.5 1.7 3.6 1.1 0.3 –0.5Current account balance 0.9 3.0 –0.7 10.9 –1.5 2.2 0.9 0.1 –4.9Capital account balance 1.1 1.5 1.6 1.6 1.2 1.4 2.0 1.6 1.3Foreign direct investment (net)4 –1.4 –1.4 –3.2 –2.1 –0.7 –2.1 –2.0 –9.6 1.0
% of GDP (rolling four-quarter GDP, based on EUR), end of periodGross external debt 66.3 62.3 66.1 64.8 62.3 61.0 62.0 66.6 66.1Gross official reserves (excluding gold) 42.1 37.7 47.5 39.3 37.7 39.8 42.8 47.7 47.5
Months of imports of goods and servicesGross official reserves (excluding gold) 8.0 7.4 10.4 7.6 7.4 7.9 8.9 10.3 10.4
EUR million, period totalGDP at current prices 56,112 61,240 60,643 16,198 17,014 13,290 14,201 16,196 16,956
Source: Bloomberg, European Commission, Eurostat, national statistical offices, national central banks, wiiw, OeNB.1 Not available in a currency board regime.2 Foreign currency component at constant exchange rates.3 Nonprofit institutions serving households.4 + = net accumulation of assets larger than net accumulation of liabilities (net outflow of capital). – = net accumulation of assets smaller than net accumulation of liabilities (net inf low of capital).

Developments in selected CESEE countries
30 OESTERREICHISCHE NATIONALBANK
5 Croatia: domestic demand supported by policy measures, tourism revenues plummet
Croatia’s GDP contracted by 8.5% in the second half of 2020, leading to a GDP contraction of 8.4% in 2020. GDP growth was somewhat weaker in the second half of the year compared to the first half due to the substantial negative contribution of net exports. Exports contracted more than imports, driven by the drop in service exports from tourism. Tourist arrivals dropped by some 60% compared to the second half of 2019. This also led to Croatia’s first current account deficit since 2014 (0.8% of GDP in 2020). Of the other GDP components, private consumption con-tracted by 5.9% in the review period, while investments grew by 0.7%. Changes in inventories made a large positive contribution to growth, reflecting a buildup of inventories in the third quarter of 2020. On the output side of GDP, the construction, agriculture and ICT sectors grew in the second half of 2020, while all other sectors contracted. Wholesale and retail trade, transport, accommodation and food services as well as taxes (less subsidies on products) accounted for most of the drop in GDP.
According to the Croatian National Bank (HNB), the Croatian government provided roughly 4.4% of GDP in policy support for companies in 2020. Roughly half of this amount was attributable to wage subsidies, which were slowly scaled back in the second half of 2020. In December, 96,179 employees were still bene-fiting from the scheme (down from a peak of around 550,000 in May). Additional support was provided through tax exemptions and deferrals as well as public loans and guarantees. The measures helped support the labor market, and the unem-ployment rate increased only moderately in 2020. However, the government’s budget deficit soared to 6.5% of GDP, as government expenditures increased by nearly 18% year on year. Government debt increased to 86.6% of GDP at end-2020, up from 72.8% at end-2019. Croatia’s gross external debt also increased substan-tially to 82.7% of GDP, mostly due to an increase in external government debt. By contrast, net external debt declined by 1.2 percentage points to 16.7% of GDP.
There were only few monetary policy interventions in the second half of 2020. The precautionary currency agreement (swap line) with the ECB was prolonged until March 2022. International reserves grew over the review period, totaling EUR 19.7 billion (roughly equaling 11 months of imports) in January 2021. HICP inflation was –0.3% in the second half of 2020, while core inflation stood at 0.7%. Strong energy price deflation led to the wedge between the two measures.
Croatian banking sector profits halved, with return on assets dropping from 1.4% in 2019 to 0.6% in 2020. This drop was mostly due to lower operating income and – to a lesser extent – attributable to higher provisions. The tier 1 capital ratio of the banking system stood at 24.3% at end-2020. The NPL ratio remained roughly unchanged at 5.4%. Regulatory easing and moratoria continued to prevent a rise in NPLs, but loans with higher credit risk (IFRS 9 “stage 2” loans) kept increas-ing during the second half of 2020. At end-2020, 11% of the banking sector’s credit volume, mostly consisting of corporate exposures, was covered by a mora-torium, according to HNB data.
In July, the Croatian kuna was included in the ERM II with a central exchange rate of 7.5345 kuna per euro. The ECB and the HNB established close cooperation and since October 2020, eight Croatian banks have been directly supervised by the ECB. Croatia has to successfully participate in the ERM II for two years and fulfill all additional convergence criteria as well as post-ERM-II commitments before it can adopt the euro.
Table 5
Main economic indicators: Croatia
2018 2019 2020 Q3 19 Q4 19 Q1 20 Q2 20 Q3 20 Q4 20
Year-on-year change of the period total in %GDP at constant prices 2.8 2.9 –8.4 2.8 2.3 0.2 –15.4 –10.0 –7.0Private consumption 3.3 3.5 –6.2 3.0 4.0 0.8 –13.8 –7.3 –4.4Public consumption 2.3 3.4 2.0 2.7 3.3 4.7 0.5 1.5 1.6Gross fixed capital formation 6.5 7.1 –2.9 5.0 4.0 3.1 –14.7 –3.0 4.2Exports of goods and services 3.7 6.8 –25.0 7.9 6.9 –2.0 –40.7 –32.3 –9.8Imports of goods and services 7.5 6.3 –13.8 5.2 2.5 –5.0 –27.5 –14.1 –7.6
Contribution to GDP growth in percentage pointsDomestic demand 4.6 2.7 –2.6 0.4 0.5 –2.3 –10.3 8.0 –7.0Net exports of goods and services –1.8 0.2 –5.8 3.2 1.5 2.1 –4.6 –17.5 –0.1Exports of goods and services 1.9 3.4 –13.0 5.7 2.8 –1.1 –19.8 –24.2 –4.1Imports of goods and services –3.7 –3.2 7.2 –2.4 –1.3 3.2 15.2 6.7 4.0
Year-on-year change of period average in %Unit labor costs in the whole economy (nominal, per person) .. .. .. .. .. .. .. .. ..Unit labor costs in manufacturing (nominal, per hour) 6.4 11.5 2.5 12.2 14.5 4.9 6.5 1.2 –2.4
Labor productivity in manufacturing (real, per hour) 2.1 –7.2 –2.4 –8.1 –10.3 –4.9 –6.1 –1.6 3.0Labor costs in manufacturing (nominal, per hour) 8.9 3.6 0.0 3.2 2.7 –0.3 0.0 –0.4 0.5
Producer price index (PPI) in industry 2.2 0.8 –3.2 –0.2 0.3 –0.1 –5.4 –4.2 –2.9Consumer price index (here: HICP) 1.6 0.8 0.0 0.7 0.9 1.2 –0.4 –0.5 –0.2EUR per 1 HRK, + = HRK appreciation 0.6 0.0 –1.6 0.3 –0.3 –0.9 –2.1 –1.8 –1.6
Period average levelsUnemployment rate (ILO definition, %, 15–64 years) 8.6 6.7 7.6 5.8 7.3 7.1 6.5 7.5 9.2Employment rate (%, 15–64 years) 60.7 62.1 62.0 63.0 62.2 61.4 62.2 63.0 61.5Key interest rate per annum (%) .. .. .. .. .. .. .. .. ..HRK per 1 EUR 7.4 7.4 7.5 7.4 7.4 7.5 7.6 7.5 7.6
Nominal year-on-year change in the period-end stock in %Loans to the domestic nonbank private sector1 2.4 3.4 3.4 2.3 3.4 4.7 2.3 3.0 2.8
of which: loans to households 4.7 6.7 6.7 6.3 6.7 5.3 3.0 3.2 1.6loans to nonbank corporations –0.8 –1.3 –1.3 –3.3 –1.3 3.9 1.2 2.8 4.8
%
Share of foreign currency loans in total loans to the non-bank private sector 54.7 51.5 52.0 51.9 51.5 51.5 51.4 51.1 52.0Return on assets (banking sector) 1.2 1.4 0.6 1.4 1.4 1.0 0.8 0.7 0.6Tier 1 capital ratio (banking sector) 22.1 24.0 24.3 22.0 24.0 22.7 24.0 24.3 24.3NPL ratio (banking sector) 7.5 5.5 5.4 6.0 5.5 5.3 5.4 5.5 5.4
% of GDPGeneral government revenues 46.3 47.4 48.8 .. .. .. .. .. ..General government expenditures 46.0 47.0 55.3 .. .. .. .. .. ..General government balance 0.2 0.4 –6.5 .. .. .. .. .. ..Primary balance 2.5 2.6 –4.2 .. .. .. .. .. ..Gross public debt 74.3 72.8 86.6 .. .. .. .. .. ..
% of GDPDebt of nonfinancial corporations (nonconsolidated) 91.7 85.9 .. .. .. .. .. .. ..Debt of households and NPISHs2 (nonconsolidated) 33.9 34.5 .. .. .. .. .. .. ..
% of GDP (based on EUR), period totalGoods balance –18.6 –19.3 –17.6 –15.8 –18.2 –20.8 –17.2 –15.7 –16.9Services balance 17.7 19.0 10.7 43.5 8.1 3.2 6.1 26.5 5.0Primary income –1.6 –1.6 0.4 –1.6 –0.4 0.6 0.2 –0.6 1.6Secondary income 4.2 4.6 5.7 3.6 5.9 5.1 6.4 4.3 7.2Current account balance 1.8 2.8 –0.8 29.8 –4.6 –12.0 –4.5 14.5 –3.0Capital account balance 1.4 2.1 2.7 1.5 2.3 1.9 3.1 2.2 3.6Foreign direct investment (net)3 –1.6 –1.9 –1.9 –2.3 –1.9 –2.5 –1.2 –2.4 –1.4
% of GDP (rolling four-quarter GDP, based on EUR), end of periodGross external debt 82.3 75.1 82.7 80.8 75.1 74.5 80.1 82.4 82.7Gross official reserves (excluding gold) 33.6 34.1 38.6 38.1 34.1 30.4 33.3 36.5 38.6
Months of imports of goods and servicesGross official reserves (excluding gold) 7.9 7.8 9.3 8.7 7.8 7.1 8.0 8.8 9.3
EUR million, period totalGDP at current prices 51,956 54,244 49,108 15,312 13,350 12,068 11,242 13,471 12,328
Source: Bloomberg, European Commission, Eurostat, national statistical offices, national central banks, wiiw, OeNB.1 Foreign currency component at constant exchange rates.2 Nonprofit institutions serving households.3 + = net accumulation of assets larger than net accumulation of liabilities (net outflow of capital). – = net accumulation of assets smaller than net accumulation of liabilities (net inf low of capital).

Developments in selected CESEE countries
FOCUS ON EUROPEAN ECONOMIC INTEGRATION Q2/21 31
5 Croatia: domestic demand supported by policy measures, tourism revenues plummet
Croatia’s GDP contracted by 8.5% in the second half of 2020, leading to a GDP contraction of 8.4% in 2020. GDP growth was somewhat weaker in the second half of the year compared to the first half due to the substantial negative contribution of net exports. Exports contracted more than imports, driven by the drop in service exports from tourism. Tourist arrivals dropped by some 60% compared to the second half of 2019. This also led to Croatia’s first current account deficit since 2014 (0.8% of GDP in 2020). Of the other GDP components, private consumption con-tracted by 5.9% in the review period, while investments grew by 0.7%. Changes in inventories made a large positive contribution to growth, reflecting a buildup of inventories in the third quarter of 2020. On the output side of GDP, the construction, agriculture and ICT sectors grew in the second half of 2020, while all other sectors contracted. Wholesale and retail trade, transport, accommodation and food services as well as taxes (less subsidies on products) accounted for most of the drop in GDP.
According to the Croatian National Bank (HNB), the Croatian government provided roughly 4.4% of GDP in policy support for companies in 2020. Roughly half of this amount was attributable to wage subsidies, which were slowly scaled back in the second half of 2020. In December, 96,179 employees were still bene-fiting from the scheme (down from a peak of around 550,000 in May). Additional support was provided through tax exemptions and deferrals as well as public loans and guarantees. The measures helped support the labor market, and the unem-ployment rate increased only moderately in 2020. However, the government’s budget deficit soared to 6.5% of GDP, as government expenditures increased by nearly 18% year on year. Government debt increased to 86.6% of GDP at end-2020, up from 72.8% at end-2019. Croatia’s gross external debt also increased substan-tially to 82.7% of GDP, mostly due to an increase in external government debt. By contrast, net external debt declined by 1.2 percentage points to 16.7% of GDP.
There were only few monetary policy interventions in the second half of 2020. The precautionary currency agreement (swap line) with the ECB was prolonged until March 2022. International reserves grew over the review period, totaling EUR 19.7 billion (roughly equaling 11 months of imports) in January 2021. HICP inflation was –0.3% in the second half of 2020, while core inflation stood at 0.7%. Strong energy price deflation led to the wedge between the two measures.
Croatian banking sector profits halved, with return on assets dropping from 1.4% in 2019 to 0.6% in 2020. This drop was mostly due to lower operating income and – to a lesser extent – attributable to higher provisions. The tier 1 capital ratio of the banking system stood at 24.3% at end-2020. The NPL ratio remained roughly unchanged at 5.4%. Regulatory easing and moratoria continued to prevent a rise in NPLs, but loans with higher credit risk (IFRS 9 “stage 2” loans) kept increas-ing during the second half of 2020. At end-2020, 11% of the banking sector’s credit volume, mostly consisting of corporate exposures, was covered by a mora-torium, according to HNB data.
In July, the Croatian kuna was included in the ERM II with a central exchange rate of 7.5345 kuna per euro. The ECB and the HNB established close cooperation and since October 2020, eight Croatian banks have been directly supervised by the ECB. Croatia has to successfully participate in the ERM II for two years and fulfill all additional convergence criteria as well as post-ERM-II commitments before it can adopt the euro.
Table 5
Main economic indicators: Croatia
2018 2019 2020 Q3 19 Q4 19 Q1 20 Q2 20 Q3 20 Q4 20
Year-on-year change of the period total in %GDP at constant prices 2.8 2.9 –8.4 2.8 2.3 0.2 –15.4 –10.0 –7.0Private consumption 3.3 3.5 –6.2 3.0 4.0 0.8 –13.8 –7.3 –4.4Public consumption 2.3 3.4 2.0 2.7 3.3 4.7 0.5 1.5 1.6Gross fixed capital formation 6.5 7.1 –2.9 5.0 4.0 3.1 –14.7 –3.0 4.2Exports of goods and services 3.7 6.8 –25.0 7.9 6.9 –2.0 –40.7 –32.3 –9.8Imports of goods and services 7.5 6.3 –13.8 5.2 2.5 –5.0 –27.5 –14.1 –7.6
Contribution to GDP growth in percentage pointsDomestic demand 4.6 2.7 –2.6 0.4 0.5 –2.3 –10.3 8.0 –7.0Net exports of goods and services –1.8 0.2 –5.8 3.2 1.5 2.1 –4.6 –17.5 –0.1Exports of goods and services 1.9 3.4 –13.0 5.7 2.8 –1.1 –19.8 –24.2 –4.1Imports of goods and services –3.7 –3.2 7.2 –2.4 –1.3 3.2 15.2 6.7 4.0
Year-on-year change of period average in %Unit labor costs in the whole economy (nominal, per person) .. .. .. .. .. .. .. .. ..Unit labor costs in manufacturing (nominal, per hour) 6.4 11.5 2.5 12.2 14.5 4.9 6.5 1.2 –2.4
Labor productivity in manufacturing (real, per hour) 2.1 –7.2 –2.4 –8.1 –10.3 –4.9 –6.1 –1.6 3.0Labor costs in manufacturing (nominal, per hour) 8.9 3.6 0.0 3.2 2.7 –0.3 0.0 –0.4 0.5
Producer price index (PPI) in industry 2.2 0.8 –3.2 –0.2 0.3 –0.1 –5.4 –4.2 –2.9Consumer price index (here: HICP) 1.6 0.8 0.0 0.7 0.9 1.2 –0.4 –0.5 –0.2EUR per 1 HRK, + = HRK appreciation 0.6 0.0 –1.6 0.3 –0.3 –0.9 –2.1 –1.8 –1.6
Period average levelsUnemployment rate (ILO definition, %, 15–64 years) 8.6 6.7 7.6 5.8 7.3 7.1 6.5 7.5 9.2Employment rate (%, 15–64 years) 60.7 62.1 62.0 63.0 62.2 61.4 62.2 63.0 61.5Key interest rate per annum (%) .. .. .. .. .. .. .. .. ..HRK per 1 EUR 7.4 7.4 7.5 7.4 7.4 7.5 7.6 7.5 7.6
Nominal year-on-year change in the period-end stock in %Loans to the domestic nonbank private sector1 2.4 3.4 3.4 2.3 3.4 4.7 2.3 3.0 2.8
of which: loans to households 4.7 6.7 6.7 6.3 6.7 5.3 3.0 3.2 1.6loans to nonbank corporations –0.8 –1.3 –1.3 –3.3 –1.3 3.9 1.2 2.8 4.8
%
Share of foreign currency loans in total loans to the non-bank private sector 54.7 51.5 52.0 51.9 51.5 51.5 51.4 51.1 52.0Return on assets (banking sector) 1.2 1.4 0.6 1.4 1.4 1.0 0.8 0.7 0.6Tier 1 capital ratio (banking sector) 22.1 24.0 24.3 22.0 24.0 22.7 24.0 24.3 24.3NPL ratio (banking sector) 7.5 5.5 5.4 6.0 5.5 5.3 5.4 5.5 5.4
% of GDPGeneral government revenues 46.3 47.4 48.8 .. .. .. .. .. ..General government expenditures 46.0 47.0 55.3 .. .. .. .. .. ..General government balance 0.2 0.4 –6.5 .. .. .. .. .. ..Primary balance 2.5 2.6 –4.2 .. .. .. .. .. ..Gross public debt 74.3 72.8 86.6 .. .. .. .. .. ..
% of GDPDebt of nonfinancial corporations (nonconsolidated) 91.7 85.9 .. .. .. .. .. .. ..Debt of households and NPISHs2 (nonconsolidated) 33.9 34.5 .. .. .. .. .. .. ..
% of GDP (based on EUR), period totalGoods balance –18.6 –19.3 –17.6 –15.8 –18.2 –20.8 –17.2 –15.7 –16.9Services balance 17.7 19.0 10.7 43.5 8.1 3.2 6.1 26.5 5.0Primary income –1.6 –1.6 0.4 –1.6 –0.4 0.6 0.2 –0.6 1.6Secondary income 4.2 4.6 5.7 3.6 5.9 5.1 6.4 4.3 7.2Current account balance 1.8 2.8 –0.8 29.8 –4.6 –12.0 –4.5 14.5 –3.0Capital account balance 1.4 2.1 2.7 1.5 2.3 1.9 3.1 2.2 3.6Foreign direct investment (net)3 –1.6 –1.9 –1.9 –2.3 –1.9 –2.5 –1.2 –2.4 –1.4
% of GDP (rolling four-quarter GDP, based on EUR), end of periodGross external debt 82.3 75.1 82.7 80.8 75.1 74.5 80.1 82.4 82.7Gross official reserves (excluding gold) 33.6 34.1 38.6 38.1 34.1 30.4 33.3 36.5 38.6
Months of imports of goods and servicesGross official reserves (excluding gold) 7.9 7.8 9.3 8.7 7.8 7.1 8.0 8.8 9.3
EUR million, period totalGDP at current prices 51,956 54,244 49,108 15,312 13,350 12,068 11,242 13,471 12,328
Source: Bloomberg, European Commission, Eurostat, national statistical offices, national central banks, wiiw, OeNB.1 Foreign currency component at constant exchange rates.2 Nonprofit institutions serving households.3 + = net accumulation of assets larger than net accumulation of liabilities (net outflow of capital). – = net accumulation of assets smaller than net accumulation of liabilities (net inf low of capital).

Developments in selected CESEE countries
32 OESTERREICHISCHE NATIONALBANK
6 Czechia: deepest economic crisis in thirty years
With one of the highest numbers of confirmed coronavirus cases and deaths per million people, Czechia has been one of the most severely hit countries worldwide. Because of the pandemic and ensuing containment restrictions, the country has lived through the worst economic slump since the beginning of transition. While real GDP growth plummeted to –5.6% in 2020, the slump was somewhat less severe than in the EU on average (–6.2%) and less dramatic than initially expected.
Following the easing of COVID-19-related measures in summer, GDP recov-ered notably in the third quarter of 2020 (+7.1% quarter on quarter). Then, however, a dire second wave of infections hit the country in fall, with infections peaking in October 2020 as well as in January and March 2021. Consequently, the country has operated under a state of emergency and tight measures have been brought in, including extensive shutdowns in retail and services for most of the time since early October 2020. Yet, in contrast to the first wave, these restrictions have had a less devastating economic impact, as Czechia’s export-oriented industry has been spared from lockdown measures and has benefited from relatively crisis-resilient global industrial production, trade and global value chains. As a result, the eco-nomic contraction moderated in the second half of the year, mainly on the back of net exports whose contribution to GDP growth turned significantly positive. A slightly positive contribution also came from public consumption boosted by extraordinary spending on healthcare. Other domestic demand components further increased their drag on GDP despite continued accommodative monetary and fiscal policies.
Even though the primary income deficit, which had been unusually low due to a significantly lower outflow of dividends, widened toward the end of the year, the surge in the goods balance in 2020 led to the highest current account surplus (3.6% of GDP) since the transformation years. The originally envisaged general government fiscal deficit of 0.7% of GDP for 2020 was revised three times and eventually came in at 6.2% of GDP (nearly twice as high as in 2009). For 2021, government revenues are estimated to exceed expenditures by roughly CZK 400 billion. Public debt rose from 30.3% of GDP in 2019 to 38.1% of GDP in 2020. Actual crisis support in 2020 turned out to be only a fraction of the originally announced fiscal package worth more than 20% of GDP. In 2020, employees and firms received about 58% of overall direct support previously announced by the government (according to the Czech Chamber of Commerce). Of the additional guarantee pro-gram, only about 5% were used. The overall fiscal package thus effectively amounted to about 3% to 4% of GDP, barring deferrals of taxes, loans and rents, which will have to be paid at a later stage.
Owing to government support schemes, the harm done to the labor market during the pandemic has been contained (so far). While inflation averaged 3.5% in the first seven months of 2020, it has continuously decreased since, reaching 2.1% in February 2021, which is well within the Czech National Bank’s (CNB) tolerance band (2% ±1 percentage point). This is because the previously predominant inflation drivers, such as increased food and administered prices, have wound down. Earlier this year, the CNB signaled readiness to start normalizing its monetary policy. Yet, according to the CNB’s most recent assessments, uncertainties and risks have again become more substantial, suggesting that monetary conditions might remain accommodative for longer. Banking sector profits halved in 2020 on the back of lower interest income and higher provisioning needs.
Table 6
Main economic indicators: Czechia
2018 2019 2020 Q3 19 Q4 19 Q1 20 Q2 20 Q3 20 Q4 20
Year-on-year change of the period total in %GDP at constant prices 3.2 2.3 –5.6 3.0 1.7 –1.4 –10.6 –5.3 –4.8Private consumption 3.5 3.0 –5.2 3.3 2.9 –0.1 –8.4 –3.7 –8.1Public consumption 3.8 2.2 3.5 3.0 1.4 4.3 2.0 0.5 6.8Gross fixed capital formation 10.0 2.3 –8.1 2.0 4.2 –3.4 –4.5 –10.1 –12.7Exports of goods and services 3.7 1.3 –5.9 4.3 –1.7 –1.5 –23.1 –3.5 4.7Imports of goods and services 5.8 1.4 –6.1 2.2 0.7 –1.1 –18.2 –5.6 0.3
Contribution to GDP growth in percentage pointsDomestic demand 4.4 2.3 –5.3 1.3 3.5 –1.0 –5.4 –6.5 –8.1Net exports of goods and services –1.2 0.0 –0.3 1.6 –1.8 –0.3 –5.1 1.2 3.2Exports of goods and services 2.9 1.0 –4.4 3.1 –1.3 –1.2 –17.4 –2.5 3.5Imports of goods and services –4.1 –1.0 4.2 –1.5 –0.5 0.9 12.4 3.7 –0.2
Year-on-year change of period average in %Unit labor costs in the whole economy (nominal, per person) 6.1 4.2 7.4 3.2 4.2 5.3 9.1 5.9 9.2Unit labor costs in manufacturing (nominal, per hour) 4.7 7.9 3.1 7.2 8.4 2.6 15.7 –0.9 –4.2
Labor productivity in manufacturing (real, per hour) 3.9 –0.8 3.1 –0.1 –1.7 4.2 –7.5 4.1 11.6Labor costs in manufacturing (nominal, per hour) 8.8 7.0 6.0 7.1 6.6 6.9 7.0 3.1 7.0
Producer price index (PPI) in industry 0.7 1.7 0.6 1.2 0.1 0.1 1.0 0.1 1.1Consumer price index (here: HICP) 2.0 2.6 3.3 2.6 3.0 3.7 3.3 3.5 2.7EUR per 1 CZK, + = CZK appreciation 2.7 –0.1 –3.0 –0.1 1.1 0.3 –5.1 –2.8 –4.1
Period average levelsUnemployment rate (ILO definition, %, 15–64 years) 2.3 2.1 2.6 2.2 2.1 2.0 2.4 2.9 3.1Employment rate (%, 15–64 years) 74.8 75.1 74.4 75.2 75.3 74.8 74.1 74.4 74.3Key interest rate per annum (%) 1.1 1.9 0.8 2.0 2.0 2.0 0.6 0.3 0.3CZK per 1 EUR 25.6 25.7 26.5 25.7 25.6 25.6 27.1 26.5 26.7
Nominal year-on-year change in period-end stock in %Loans to the domestic nonbank private sector1 6.8 5.0 5.0 3.9 5.0 5.6 3.6 3.5 3.0
of which: loans to households 7.5 6.1 6.1 6.3 6.1 6.3 6.1 6.3 6.5loans to nonbank corporations 5.8 3.8 3.8 1.2 3.8 4.8 0.7 0.1 –1.3
%
Share of foreign currency loans in total loans to the non-bank private sector 14.1 14.5 14.6 15.3 14.5 16.9 16.0 16.1 14.6Return on assets (banking sector) 1.1 1.2 0.6 1.2 1.2 0.7 0.7 0.6 0.6Tier 1 capital ratio (banking sector) 19.1 20.8 23.6 19.8 20.8 20.9 22.5 22.6 23.6NPL ratio (banking sector) 3.1 2.4 2.6 2.5 2.4 2.3 2.4 2.2 2.6
% of GDPGeneral government revenues 41.5 41.7 41.3 .. .. .. .. .. ..General government expenditures 40.6 41.4 47.5 .. .. .. .. .. ..General government balance 0.9 0.3 –6.2 .. .. .. .. .. ..Primary balance 1.6 1.0 –5.4 .. .. .. .. .. ..Gross public debt 32.1 30.3 38.1 .. .. .. .. .. ..
% of GDPDebt of nonfinancial corporations (nonconsolidated) 59.8 57.3 .. .. .. .. .. .. ..Debt of households and NPISHs2 (nonconsolidated) 31.6 31.9 .. .. .. .. .. .. ..
% of GDP (based on EUR), period totalGoods balance 3.7 4.1 5.1 3.4 2.3 4.9 2.2 5.4 7.3Services balance 2.2 1.8 1.9 1.4 0.9 2.7 2.1 2.1 0.6Primary income –4.8 –5.6 –2.8 –8.3 –4.9 –0.3 –2.8 –1.0 –6.7Secondary income –0.7 –0.6 –0.5 –0.7 0.2 –1.1 –0.2 –0.7 –0.1Current account balance 0.5 –0.3 3.6 –4.2 –1.6 6.2 1.3 5.8 1.2Capital account balance 0.2 0.5 1.3 0.4 1.0 1.5 1.5 1.3 0.8Foreign direct investment (net)3 –0.9 –1.1 –1.3 –1.8 –0.1 0.5 –2.6 1.5 –4.4
% of GDP (rolling four-quarter GDP, based on EUR), end of periodGross external debt 81.3 77.0 76.7 78.2 77.0 72.7 74.8 74.2 76.7Gross official reserves (excluding gold) 58.9 59.4 63.1 59.8 59.4 58.6 61.6 61.9 63.2
Months of imports of goods and servicesGross official reserves (excluding gold) 9.9 10.4 11.7 10.3 10.4 10.4 11.3 11.5 11.7
EUR million, period totalGDP at current prices 210,881 223,961 213,678 57,146 59,015 52,884 49,531 54,909 56,282
Source: Bloomberg, European Commission, Eurostat, national statistical offices, national central banks, wiiw, OeNB.1 Foreign currency component at constant exchange rates.2 Nonprofit institutions serving households.3 + = net accumulation of assets larger than net accumulation of liabilities (net outflow of capital).– = net accumulation of assets smaller than net accumulation of liabilities (net inf low of capital).
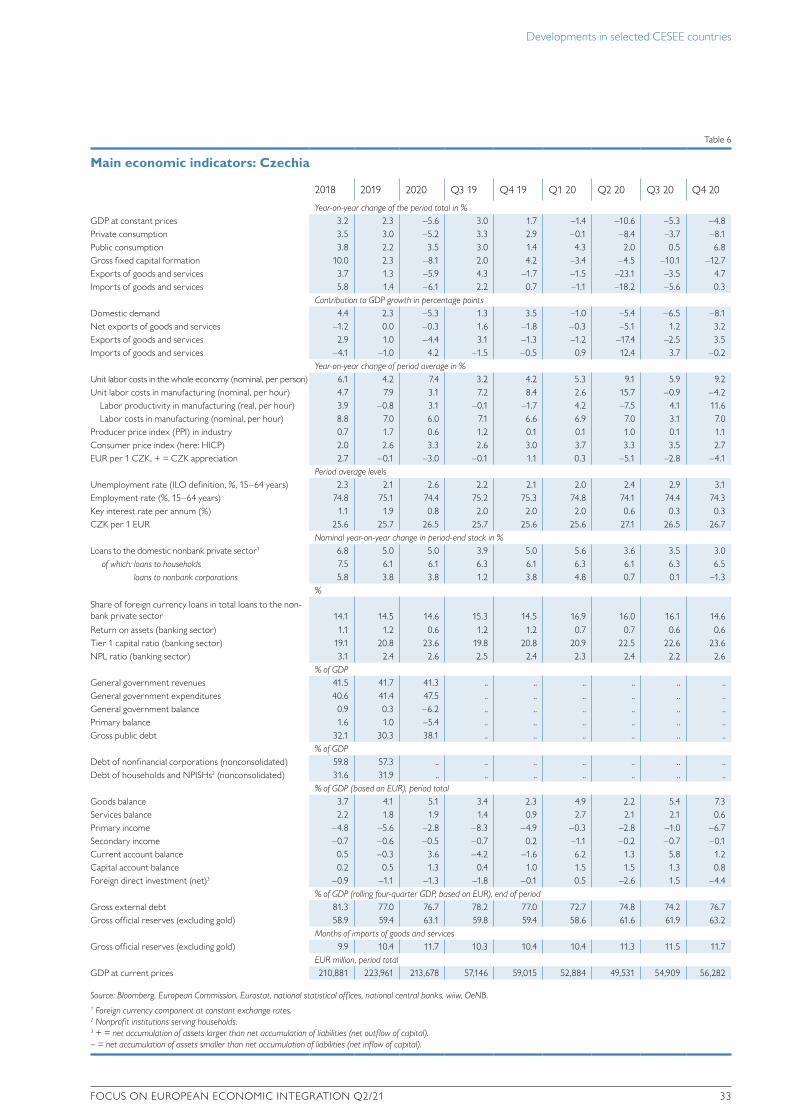
Developments in selected CESEE countries
FOCUS ON EUROPEAN ECONOMIC INTEGRATION Q2/21 33
6 Czechia: deepest economic crisis in thirty years
With one of the highest numbers of confirmed coronavirus cases and deaths per million people, Czechia has been one of the most severely hit countries worldwide. Because of the pandemic and ensuing containment restrictions, the country has lived through the worst economic slump since the beginning of transition. While real GDP growth plummeted to –5.6% in 2020, the slump was somewhat less severe than in the EU on average (–6.2%) and less dramatic than initially expected.
Following the easing of COVID-19-related measures in summer, GDP recov-ered notably in the third quarter of 2020 (+7.1% quarter on quarter). Then, however, a dire second wave of infections hit the country in fall, with infections peaking in October 2020 as well as in January and March 2021. Consequently, the country has operated under a state of emergency and tight measures have been brought in, including extensive shutdowns in retail and services for most of the time since early October 2020. Yet, in contrast to the first wave, these restrictions have had a less devastating economic impact, as Czechia’s export-oriented industry has been spared from lockdown measures and has benefited from relatively crisis-resilient global industrial production, trade and global value chains. As a result, the eco-nomic contraction moderated in the second half of the year, mainly on the back of net exports whose contribution to GDP growth turned significantly positive. A slightly positive contribution also came from public consumption boosted by extraordinary spending on healthcare. Other domestic demand components further increased their drag on GDP despite continued accommodative monetary and fiscal policies.
Even though the primary income deficit, which had been unusually low due to a significantly lower outflow of dividends, widened toward the end of the year, the surge in the goods balance in 2020 led to the highest current account surplus (3.6% of GDP) since the transformation years. The originally envisaged general government fiscal deficit of 0.7% of GDP for 2020 was revised three times and eventually came in at 6.2% of GDP (nearly twice as high as in 2009). For 2021, government revenues are estimated to exceed expenditures by roughly CZK 400 billion. Public debt rose from 30.3% of GDP in 2019 to 38.1% of GDP in 2020. Actual crisis support in 2020 turned out to be only a fraction of the originally announced fiscal package worth more than 20% of GDP. In 2020, employees and firms received about 58% of overall direct support previously announced by the government (according to the Czech Chamber of Commerce). Of the additional guarantee pro-gram, only about 5% were used. The overall fiscal package thus effectively amounted to about 3% to 4% of GDP, barring deferrals of taxes, loans and rents, which will have to be paid at a later stage.
Owing to government support schemes, the harm done to the labor market during the pandemic has been contained (so far). While inflation averaged 3.5% in the first seven months of 2020, it has continuously decreased since, reaching 2.1% in February 2021, which is well within the Czech National Bank’s (CNB) tolerance band (2% ±1 percentage point). This is because the previously predominant inflation drivers, such as increased food and administered prices, have wound down. Earlier this year, the CNB signaled readiness to start normalizing its monetary policy. Yet, according to the CNB’s most recent assessments, uncertainties and risks have again become more substantial, suggesting that monetary conditions might remain accommodative for longer. Banking sector profits halved in 2020 on the back of lower interest income and higher provisioning needs.
Table 6
Main economic indicators: Czechia
2018 2019 2020 Q3 19 Q4 19 Q1 20 Q2 20 Q3 20 Q4 20
Year-on-year change of the period total in %GDP at constant prices 3.2 2.3 –5.6 3.0 1.7 –1.4 –10.6 –5.3 –4.8Private consumption 3.5 3.0 –5.2 3.3 2.9 –0.1 –8.4 –3.7 –8.1Public consumption 3.8 2.2 3.5 3.0 1.4 4.3 2.0 0.5 6.8Gross fixed capital formation 10.0 2.3 –8.1 2.0 4.2 –3.4 –4.5 –10.1 –12.7Exports of goods and services 3.7 1.3 –5.9 4.3 –1.7 –1.5 –23.1 –3.5 4.7Imports of goods and services 5.8 1.4 –6.1 2.2 0.7 –1.1 –18.2 –5.6 0.3
Contribution to GDP growth in percentage pointsDomestic demand 4.4 2.3 –5.3 1.3 3.5 –1.0 –5.4 –6.5 –8.1Net exports of goods and services –1.2 0.0 –0.3 1.6 –1.8 –0.3 –5.1 1.2 3.2Exports of goods and services 2.9 1.0 –4.4 3.1 –1.3 –1.2 –17.4 –2.5 3.5Imports of goods and services –4.1 –1.0 4.2 –1.5 –0.5 0.9 12.4 3.7 –0.2
Year-on-year change of period average in %Unit labor costs in the whole economy (nominal, per person) 6.1 4.2 7.4 3.2 4.2 5.3 9.1 5.9 9.2Unit labor costs in manufacturing (nominal, per hour) 4.7 7.9 3.1 7.2 8.4 2.6 15.7 –0.9 –4.2
Labor productivity in manufacturing (real, per hour) 3.9 –0.8 3.1 –0.1 –1.7 4.2 –7.5 4.1 11.6Labor costs in manufacturing (nominal, per hour) 8.8 7.0 6.0 7.1 6.6 6.9 7.0 3.1 7.0
Producer price index (PPI) in industry 0.7 1.7 0.6 1.2 0.1 0.1 1.0 0.1 1.1Consumer price index (here: HICP) 2.0 2.6 3.3 2.6 3.0 3.7 3.3 3.5 2.7EUR per 1 CZK, + = CZK appreciation 2.7 –0.1 –3.0 –0.1 1.1 0.3 –5.1 –2.8 –4.1
Period average levelsUnemployment rate (ILO definition, %, 15–64 years) 2.3 2.1 2.6 2.2 2.1 2.0 2.4 2.9 3.1Employment rate (%, 15–64 years) 74.8 75.1 74.4 75.2 75.3 74.8 74.1 74.4 74.3Key interest rate per annum (%) 1.1 1.9 0.8 2.0 2.0 2.0 0.6 0.3 0.3CZK per 1 EUR 25.6 25.7 26.5 25.7 25.6 25.6 27.1 26.5 26.7
Nominal year-on-year change in period-end stock in %Loans to the domestic nonbank private sector1 6.8 5.0 5.0 3.9 5.0 5.6 3.6 3.5 3.0
of which: loans to households 7.5 6.1 6.1 6.3 6.1 6.3 6.1 6.3 6.5loans to nonbank corporations 5.8 3.8 3.8 1.2 3.8 4.8 0.7 0.1 –1.3
%
Share of foreign currency loans in total loans to the non-bank private sector 14.1 14.5 14.6 15.3 14.5 16.9 16.0 16.1 14.6Return on assets (banking sector) 1.1 1.2 0.6 1.2 1.2 0.7 0.7 0.6 0.6Tier 1 capital ratio (banking sector) 19.1 20.8 23.6 19.8 20.8 20.9 22.5 22.6 23.6NPL ratio (banking sector) 3.1 2.4 2.6 2.5 2.4 2.3 2.4 2.2 2.6
% of GDPGeneral government revenues 41.5 41.7 41.3 .. .. .. .. .. ..General government expenditures 40.6 41.4 47.5 .. .. .. .. .. ..General government balance 0.9 0.3 –6.2 .. .. .. .. .. ..Primary balance 1.6 1.0 –5.4 .. .. .. .. .. ..Gross public debt 32.1 30.3 38.1 .. .. .. .. .. ..
% of GDPDebt of nonfinancial corporations (nonconsolidated) 59.8 57.3 .. .. .. .. .. .. ..Debt of households and NPISHs2 (nonconsolidated) 31.6 31.9 .. .. .. .. .. .. ..
% of GDP (based on EUR), period totalGoods balance 3.7 4.1 5.1 3.4 2.3 4.9 2.2 5.4 7.3Services balance 2.2 1.8 1.9 1.4 0.9 2.7 2.1 2.1 0.6Primary income –4.8 –5.6 –2.8 –8.3 –4.9 –0.3 –2.8 –1.0 –6.7Secondary income –0.7 –0.6 –0.5 –0.7 0.2 –1.1 –0.2 –0.7 –0.1Current account balance 0.5 –0.3 3.6 –4.2 –1.6 6.2 1.3 5.8 1.2Capital account balance 0.2 0.5 1.3 0.4 1.0 1.5 1.5 1.3 0.8Foreign direct investment (net)3 –0.9 –1.1 –1.3 –1.8 –0.1 0.5 –2.6 1.5 –4.4
% of GDP (rolling four-quarter GDP, based on EUR), end of periodGross external debt 81.3 77.0 76.7 78.2 77.0 72.7 74.8 74.2 76.7Gross official reserves (excluding gold) 58.9 59.4 63.1 59.8 59.4 58.6 61.6 61.9 63.2
Months of imports of goods and servicesGross official reserves (excluding gold) 9.9 10.4 11.7 10.3 10.4 10.4 11.3 11.5 11.7
EUR million, period totalGDP at current prices 210,881 223,961 213,678 57,146 59,015 52,884 49,531 54,909 56,282
Source: Bloomberg, European Commission, Eurostat, national statistical offices, national central banks, wiiw, OeNB.1 Foreign currency component at constant exchange rates.2 Nonprofit institutions serving households.3 + = net accumulation of assets larger than net accumulation of liabilities (net outflow of capital).– = net accumulation of assets smaller than net accumulation of liabilities (net inf low of capital).

Developments in selected CESEE countries
34 OESTERREICHISCHE NATIONALBANK
7 Hungary: sustained recovery hinges on progress with vaccinations
Hungarian GDP contracted by 5% in 2020. The slump in GDP in the second quarter of 2020 was followed by a sharp recovery in the third quarter, which lost speed due to the reintroduction of some lockdown measures in the final quarter of the year, however. Net real exports, which had been the single biggest drag on GDP during the first half of 2020, turned neutral in the second half, as exports improved more than imports. Investments contracted substantially, but less than during the first half of the year, supported by a favorable base effect and investments in dwellings. Private consumption recovered in the third quarter of 2020, before worsening again in the fourth quarter following the reintroduction of various lockdown mea-sures. Despite increased government outlays, public consumption growth remained negative in the review period. High-frequency indicators improved somewhat into 2021, but a sustained recovery has been delayed by additional lockdown measures imposed in March 2021 and despite a comparatively rapid vaccination rollout.
The budget deficit shot up to 8.1% of GDP in 2020 as a result of the economic slump, the workings of automatic stabilizers and various fiscal measures taken to mitigate the impact of the crisis. Consolidated state debt had risen to 80.4% of GDP by end-2020. To cushion the impact of lockdown measures, the government stepped up support for companies. In addition, the debt repayment moratorium for companies and households has been extended until mid-2021. In February 2021, pensioners received one fourth of the extra 13th month pension payment. VAT on new home sales has been slashed to 5%, subsidies for families for home purchases have been further expanded, and a new home reconstruction subsidy has been created. Those under age 25 on low income (below the average wage) will be exempted from personal income tax from 2022 onward. Thus, fiscal policy remains supportive for growth, presumably also with an eye to parliamentary elections in spring 2022.
Headline inflation decreased over the reporting period from 4% in August 2020 to 2.8% at end-2020, before edging up to 3.3% in February 2021. Core inflation was fairly stable at around 3.5%. The National Bank of Hungary (MNB) expects headline inflation to temporarily approach 5% in the second quarter of 2021 due to base effects, the increase in fuel prices, consumption tax hikes and the asym-metric development of demand and supply conditions once lockdown measures are lifted. Thereafter, inflation should move toward the target range (3% ±1 percent-age point). The MNB has remained committed to providing sufficient liquidity to the economy, while keeping on fine-tuning the structure of its monetary policy instruments. In January 2021, it decided to gradually tone down its long-term covered loans to banks and expand its government bond purchases. In parallel, it increased the overall volume of its corporate bond purchase program (and extended secondary market purchases to include public nonfinancial companies in March 2021), after having already substantially increased the overall volume of its “F4G Go!” program for SMEs in November 2020. These liquidity injections have mitigated the impact of tightening corporate lending standards. Growth in loans to corporates remained broadly unchanged compared to early 2020. Despite some moderation, lending to households continued to benefit from the government’s various loan programs for families. The profitability of banks fell well below its 2019 level, mainly due to increased provisioning. The NPL ratio, which had risen during the first half of 2020, was marginally lower at end-2020 compared to 2019. However, NPLs are widely expected to start rising once the moratorium is lifted in mid-2021.
Table 7
Main economic indicators: Hungary
2018 2019 2020 Q3 19 Q4 19 Q1 20 Q2 20 Q3 20 Q4 20
Year-on-year change of the period total in %GDP at constant prices 5.4 4.6 –5.0 4.7 4.2 2.3 –13.4 –4.6 –3.6Private consumption 5.1 4.5 –2.3 4.3 4.9 4.8 –7.5 –2.6 –3.3Public consumption 1.7 3.5 –1.2 3.0 8.3 0.3 –2.8 –1.0 –1.1Gross fixed capital formation 16.4 12.2 –7.3 14.2 4.0 –4.1 –10.9 –13.7 1.2Exports of goods and services 5.0 5.8 –6.7 10.2 2.3 0.5 –23.8 –4.8 1.7Imports of goods and services 7.0 7.5 –3.9 11.0 6.0 3.0 –15.1 –4.5 0.9
Contribution to GDP growth in percentage pointsDomestic demand 6.6 5.7 –2.6 5.0 6.9 4.4 –5.3 –4.3 –4.3Net exports of goods and services –1.2 –1.1 –2.4 –0.3 –2.7 –1.6 –7.7 –0.3 0.6Exports of goods and services 4.3 4.9 –5.5 8.1 1.9 –0.5 –20.3 –3.8 1.3Imports of goods and services –5.5 –6.0 3.1 –8.4 –4.6 –1.1 12.6 3.5 –0.7
Year-on-year change of period average in %Unit labor costs in the whole economy (nominal, per person) 3.4 1.8 8.4 1.8 2.1 4.7 15.2 6.8 6.9Unit labor costs in manufacturing (nominal, per hour) 7.3 6.4 8.5 3.6 6.1 5.9 25.5 2.0 0.9
Labor productivity in manufacturing (real, per hour) 1.6 4.3 –0.2 6.7 3.1 2.7 –11.9 2.4 5.8Labor costs in manufacturing (nominal, per hour) 9.0 10.9 7.6 10.6 9.4 8.7 10.5 4.5 6.7
Producer price index (PPI) in industry 5.6 2.2 4.3 1.2 2.1 4.1 2.8 4.0 6.1Consumer price index (here: HICP) 2.9 3.4 3.4 3.1 3.5 4.4 2.5 3.8 2.9EUR per 1 HUF, + = HUF appreciation –3.0 –2.0 –7.4 –1.2 –2.7 –6.3 –8.2 –7.2 –7.9
Period average levelsUnemployment rate (ILO definition, %, 15–64 years) 3.8 3.5 4.3 3.5 3.4 3.8 4.7 4.5 4.2Employment rate (%, 15–64 years) 69.3 70.1 69.7 70.3 70.3 69.7 68.7 70.2 70.2Key interest rate per annum (%) 0.9 0.9 0.8 0.9 0.9 0.9 0.9 0.6 0.6HUF per 1 EUR 318.8 325.2 351.2 328.2 331.9 339.1 351.7 353.6 360.5
Nominal year-on-year change in period-end stock in %Loans to the domestic nonbank private sector1 9.9 12.5 12.5 12.2 12.5 15.3 11.1 10.3 11.0
of which: loans to households 5.8 15.5 15.5 12.7 15.5 18.0 18.5 14.9 14.1loans to nonbank corporations 13.1 10.4 10.4 11.8 10.4 13.5 6.2 7.1 8.8
%
Share of foreign currency loans in total loans to the non-bank private sector 24.0 23.8 22.3 24.0 23.8 25.6 24.4 23.4 22.3Return on assets (banking sector) 1.4 1.2 0.4 1.3 1.2 0.2 0.3 0.5 0.4Tier 1 capital ratio (banking sector) 17.8 16.4 16.7 15.8 16.4 15.6 15.7 15.8 16.7NPL ratio (banking sector) 2.2 2.6 2.4 3.0 2.6 2.5 2.9 2.8 2.4
% of GDPGeneral government revenues 43.8 43.6 43.5 .. .. .. .. .. ..General government expenditures 45.9 45.7 51.6 .. .. .. .. .. ..General government balance –2.1 –2.1 –8.1 .. .. .. .. .. ..Primary balance 0.2 0.1 –5.7 .. .. .. .. .. ..Gross public debt 69.1 65.5 80.4 .. .. .. .. .. ..
% of GDPDebt of nonfinancial corporations (nonconsolidated) 64.7 61.8 .. .. .. .. .. .. ..Debt of households and NPISHs2 (nonconsolidated) 17.6 18.1 .. .. .. .. .. .. ..
% of GDP (based on EUR), period totalGoods balance –1.2 –2.1 –0.6 –3.3 –3.1 –0.7 –2.8 –0.2 0.8Services balance 5.7 4.9 2.9 5.9 3.6 4.1 1.9 4.1 1.7Primary income –3.7 –2.7 –1.7 –2.5 –2.5 –1.6 –1.6 –1.8 –1.7Secondary income –0.4 –0.6 –0.5 –1.0 –0.1 –1.2 –0.7 –0.1 –0.3Current account balance 0.3 –0.5 0.1 –0.9 –2.0 0.6 –3.1 1.9 0.5Capital account balance 2.3 1.8 2.0 1.3 3.6 1.7 2.1 2.1 2.1Foreign direct investment (net)3 –2.1 –0.6 0.0 –0.3 –2.1 –1.9 –1.2 –0.6 3.3
% of GDP (rolling four-quarter GDP, based on EUR), end of periodGross external debt 78.9 71.7 78.8 75.7 71.7 70.0 76.0 78.8 78.8Gross official reserves (excluding gold) 19.3 18.5 23.7 18.8 18.5 16.7 20.4 22.2 23.7
Months of imports of goods and servicesGross official reserves (excluding gold) 2.9 2.8 3.7 2.8 2.8 2.5 3.1 3.4 3.7
EUR million, period totalGDP at current prices 135,804 145,933 135,404 37,237 39,705 32,494 30,762 34,601 37,547
Source: Bloomberg, European Commission, Eurostat, national statistical offices, national central banks, wiiw, OeNB.1 Foreign currency component at constant exchange rates.2 Nonprofit institutions serving households.3 + = net accumulation of assets larger than net accumulation of liabilities (net outflow of capital). – = net accumulation of assets smaller than net accumulation of liabilities (net inf low of capital).

Developments in selected CESEE countries
FOCUS ON EUROPEAN ECONOMIC INTEGRATION Q2/21 35
7 Hungary: sustained recovery hinges on progress with vaccinations
Hungarian GDP contracted by 5% in 2020. The slump in GDP in the second quarter of 2020 was followed by a sharp recovery in the third quarter, which lost speed due to the reintroduction of some lockdown measures in the final quarter of the year, however. Net real exports, which had been the single biggest drag on GDP during the first half of 2020, turned neutral in the second half, as exports improved more than imports. Investments contracted substantially, but less than during the first half of the year, supported by a favorable base effect and investments in dwellings. Private consumption recovered in the third quarter of 2020, before worsening again in the fourth quarter following the reintroduction of various lockdown mea-sures. Despite increased government outlays, public consumption growth remained negative in the review period. High-frequency indicators improved somewhat into 2021, but a sustained recovery has been delayed by additional lockdown measures imposed in March 2021 and despite a comparatively rapid vaccination rollout.
The budget deficit shot up to 8.1% of GDP in 2020 as a result of the economic slump, the workings of automatic stabilizers and various fiscal measures taken to mitigate the impact of the crisis. Consolidated state debt had risen to 80.4% of GDP by end-2020. To cushion the impact of lockdown measures, the government stepped up support for companies. In addition, the debt repayment moratorium for companies and households has been extended until mid-2021. In February 2021, pensioners received one fourth of the extra 13th month pension payment. VAT on new home sales has been slashed to 5%, subsidies for families for home purchases have been further expanded, and a new home reconstruction subsidy has been created. Those under age 25 on low income (below the average wage) will be exempted from personal income tax from 2022 onward. Thus, fiscal policy remains supportive for growth, presumably also with an eye to parliamentary elections in spring 2022.
Headline inflation decreased over the reporting period from 4% in August 2020 to 2.8% at end-2020, before edging up to 3.3% in February 2021. Core inflation was fairly stable at around 3.5%. The National Bank of Hungary (MNB) expects headline inflation to temporarily approach 5% in the second quarter of 2021 due to base effects, the increase in fuel prices, consumption tax hikes and the asym-metric development of demand and supply conditions once lockdown measures are lifted. Thereafter, inflation should move toward the target range (3% ±1 percent-age point). The MNB has remained committed to providing sufficient liquidity to the economy, while keeping on fine-tuning the structure of its monetary policy instruments. In January 2021, it decided to gradually tone down its long-term covered loans to banks and expand its government bond purchases. In parallel, it increased the overall volume of its corporate bond purchase program (and extended secondary market purchases to include public nonfinancial companies in March 2021), after having already substantially increased the overall volume of its “F4G Go!” program for SMEs in November 2020. These liquidity injections have mitigated the impact of tightening corporate lending standards. Growth in loans to corporates remained broadly unchanged compared to early 2020. Despite some moderation, lending to households continued to benefit from the government’s various loan programs for families. The profitability of banks fell well below its 2019 level, mainly due to increased provisioning. The NPL ratio, which had risen during the first half of 2020, was marginally lower at end-2020 compared to 2019. However, NPLs are widely expected to start rising once the moratorium is lifted in mid-2021.
Table 7
Main economic indicators: Hungary
2018 2019 2020 Q3 19 Q4 19 Q1 20 Q2 20 Q3 20 Q4 20
Year-on-year change of the period total in %GDP at constant prices 5.4 4.6 –5.0 4.7 4.2 2.3 –13.4 –4.6 –3.6Private consumption 5.1 4.5 –2.3 4.3 4.9 4.8 –7.5 –2.6 –3.3Public consumption 1.7 3.5 –1.2 3.0 8.3 0.3 –2.8 –1.0 –1.1Gross fixed capital formation 16.4 12.2 –7.3 14.2 4.0 –4.1 –10.9 –13.7 1.2Exports of goods and services 5.0 5.8 –6.7 10.2 2.3 0.5 –23.8 –4.8 1.7Imports of goods and services 7.0 7.5 –3.9 11.0 6.0 3.0 –15.1 –4.5 0.9
Contribution to GDP growth in percentage pointsDomestic demand 6.6 5.7 –2.6 5.0 6.9 4.4 –5.3 –4.3 –4.3Net exports of goods and services –1.2 –1.1 –2.4 –0.3 –2.7 –1.6 –7.7 –0.3 0.6Exports of goods and services 4.3 4.9 –5.5 8.1 1.9 –0.5 –20.3 –3.8 1.3Imports of goods and services –5.5 –6.0 3.1 –8.4 –4.6 –1.1 12.6 3.5 –0.7
Year-on-year change of period average in %Unit labor costs in the whole economy (nominal, per person) 3.4 1.8 8.4 1.8 2.1 4.7 15.2 6.8 6.9Unit labor costs in manufacturing (nominal, per hour) 7.3 6.4 8.5 3.6 6.1 5.9 25.5 2.0 0.9
Labor productivity in manufacturing (real, per hour) 1.6 4.3 –0.2 6.7 3.1 2.7 –11.9 2.4 5.8Labor costs in manufacturing (nominal, per hour) 9.0 10.9 7.6 10.6 9.4 8.7 10.5 4.5 6.7
Producer price index (PPI) in industry 5.6 2.2 4.3 1.2 2.1 4.1 2.8 4.0 6.1Consumer price index (here: HICP) 2.9 3.4 3.4 3.1 3.5 4.4 2.5 3.8 2.9EUR per 1 HUF, + = HUF appreciation –3.0 –2.0 –7.4 –1.2 –2.7 –6.3 –8.2 –7.2 –7.9
Period average levelsUnemployment rate (ILO definition, %, 15–64 years) 3.8 3.5 4.3 3.5 3.4 3.8 4.7 4.5 4.2Employment rate (%, 15–64 years) 69.3 70.1 69.7 70.3 70.3 69.7 68.7 70.2 70.2Key interest rate per annum (%) 0.9 0.9 0.8 0.9 0.9 0.9 0.9 0.6 0.6HUF per 1 EUR 318.8 325.2 351.2 328.2 331.9 339.1 351.7 353.6 360.5
Nominal year-on-year change in period-end stock in %Loans to the domestic nonbank private sector1 9.9 12.5 12.5 12.2 12.5 15.3 11.1 10.3 11.0
of which: loans to households 5.8 15.5 15.5 12.7 15.5 18.0 18.5 14.9 14.1loans to nonbank corporations 13.1 10.4 10.4 11.8 10.4 13.5 6.2 7.1 8.8
%
Share of foreign currency loans in total loans to the non-bank private sector 24.0 23.8 22.3 24.0 23.8 25.6 24.4 23.4 22.3Return on assets (banking sector) 1.4 1.2 0.4 1.3 1.2 0.2 0.3 0.5 0.4Tier 1 capital ratio (banking sector) 17.8 16.4 16.7 15.8 16.4 15.6 15.7 15.8 16.7NPL ratio (banking sector) 2.2 2.6 2.4 3.0 2.6 2.5 2.9 2.8 2.4
% of GDPGeneral government revenues 43.8 43.6 43.5 .. .. .. .. .. ..General government expenditures 45.9 45.7 51.6 .. .. .. .. .. ..General government balance –2.1 –2.1 –8.1 .. .. .. .. .. ..Primary balance 0.2 0.1 –5.7 .. .. .. .. .. ..Gross public debt 69.1 65.5 80.4 .. .. .. .. .. ..
% of GDPDebt of nonfinancial corporations (nonconsolidated) 64.7 61.8 .. .. .. .. .. .. ..Debt of households and NPISHs2 (nonconsolidated) 17.6 18.1 .. .. .. .. .. .. ..
% of GDP (based on EUR), period totalGoods balance –1.2 –2.1 –0.6 –3.3 –3.1 –0.7 –2.8 –0.2 0.8Services balance 5.7 4.9 2.9 5.9 3.6 4.1 1.9 4.1 1.7Primary income –3.7 –2.7 –1.7 –2.5 –2.5 –1.6 –1.6 –1.8 –1.7Secondary income –0.4 –0.6 –0.5 –1.0 –0.1 –1.2 –0.7 –0.1 –0.3Current account balance 0.3 –0.5 0.1 –0.9 –2.0 0.6 –3.1 1.9 0.5Capital account balance 2.3 1.8 2.0 1.3 3.6 1.7 2.1 2.1 2.1Foreign direct investment (net)3 –2.1 –0.6 0.0 –0.3 –2.1 –1.9 –1.2 –0.6 3.3
% of GDP (rolling four-quarter GDP, based on EUR), end of periodGross external debt 78.9 71.7 78.8 75.7 71.7 70.0 76.0 78.8 78.8Gross official reserves (excluding gold) 19.3 18.5 23.7 18.8 18.5 16.7 20.4 22.2 23.7
Months of imports of goods and servicesGross official reserves (excluding gold) 2.9 2.8 3.7 2.8 2.8 2.5 3.1 3.4 3.7
EUR million, period totalGDP at current prices 135,804 145,933 135,404 37,237 39,705 32,494 30,762 34,601 37,547
Source: Bloomberg, European Commission, Eurostat, national statistical offices, national central banks, wiiw, OeNB.1 Foreign currency component at constant exchange rates.2 Nonprofit institutions serving households.3 + = net accumulation of assets larger than net accumulation of liabilities (net outflow of capital). – = net accumulation of assets smaller than net accumulation of liabilities (net inf low of capital).

Developments in selected CESEE countries
36 OESTERREICHISCHE NATIONALBANK
8 Poland: export performance contains GDP contraction
Poland’s GDP contracted by 2.7% in 2020, with the contraction accelerating from the third quarter to the fourth quarter. Domestic demand shrank by 4%, while exports declined only slightly on the back of strong positive growth in the final quarter of 2020. With imports declining considerably stronger and at roughly the same pace as total final demand, and hence GDP, the contribution of net exports to GDP growth remained positive at 1 percentage point. In parallel, the goods and services balance increased by about 2 percentage points to almost 7% of GDP. Coupled with a lower primary balance deficit, the current account surplus rose by 3 percentage points to 3.6% of GDP. The capital account surplus and net FDI inflows remained at about 2.5% and 1.5% of GDP, respectively, in the review period. Within domestic demand, public consumption registered robust growth despite the COVID-19 pandemic, albeit at a markedly slower rate than in 2019. While growth in public fixed investment was moderately positive in the first half of the year and roughly stagnant in the second half, private sector fixed investment posted negative growth rates throughout the year which accelerated from the third quarter to the fourth quarter, dragged down above all by investment in machinery and equipment, particularly transport equipment. The decline of inventory buildup lowered GDP growth by about 1 percentage point. Private consumption growth was again negative in the fourth quarter, after having slumped in the second quarter and stabilized in the third quarter. These developments stemmed from renewed lockdown measures, a general loss of confidence and precautionary savings. By con-trast, the real wage sum and real pension payments registered accelerated positive growth.
In manufacturing, the production volume fell less than employment (measured by total hours worked), resulting in an increase in labor productivity. The opposite was true for developments in the euro area. However, the growth differential in hourly labor costs implied slightly stronger average growth of nominal unit labor costs in Poland than in the euro area. This was more than offset, though, by the moderate decline in the złoty’s value against the euro. However, after having depre-ciated in early 2020, the złoty roughly ranged between 4.40 and 4.60 per euro in the period from April 2020 to March 2021. Headline inflation declined from 3.7% (HICP) and 2.9% (national CPI) in August to 3.6% and 2.4%, respectively, in February 2021. Core inflation declined in parallel from 4.6% (HICP excluding energy and unprocessed food) and 4.0% (CPI excluding energy and all food) to 4.2% and 3.7%, respectively. Services continued to be the main driver of inflation.
The Monetary Policy Council (MPC), pursuing an inflation target of 2.5% ±1 percentage point (CPI), has maintained an asymmetric band by keeping its main policy rate at 0.1%, the deposit rate at 0.0%, and the lombard rate at 0.5%. It increased the volume of its open-ended outright purchases of government(-guar-anteed) debt securities on the secondary market (with flexible scale to ensure the liquidity of these markets and to strengthen monetary transmission) from July to December 2020 and – yet only to a modest extent – for early 2021. At the same time, the MPC helped maintain the ten-year sovereign yield below 1.5%. In 2020, the volume totaled 4.6% of GDP, with purchases mainly occurring in the first half of 2020.
Regarding fiscal policy, the general government budget deficit rose from 0.7% of GDP in 2019 to 7% of GDP in 2020, as revenues increased by 0.6 percentage points and expenditures by 6.9 percentage points. Public debt rose from about 45.6% of GDP at end-2019 to about 57.5% at end-2020.
Table 8
Main economic indicators: Poland
2018 2019 2020 Q3 19 Q4 19 Q1 20 Q2 20 Q3 20 Q4 20
Year-on-year change of the period total in %GDP at constant prices 5.4 4.5 –2.7 4.6 3.7 1.9 –8.0 –1.8 –2.8Private consumption 4.5 3.9 –3.1 4.1 3.9 1.0 –10.6 0.4 –3.3Public consumption 3.5 6.2 3.2 7.1 4.6 2.6 3.0 3.7 3.5Gross fixed capital formation 9.4 7.2 –8.4 3.9 6.1 0.6 –10.8 –8.8 –10.8Exports of goods and services 6.9 5.1 –0.5 5.5 3.0 2.0 –14.4 1.6 8.2Imports of goods and services 7.4 3.3 –2.6 3.9 –0.4 0.4 –18.3 –0.6 7.9
Contribution to GDP growth in percentage pointsDomestic demand 5.3 3.4 –3.7 3.6 2.0 0.8 –9.3 –3.0 –3.2Net exports of goods and services 0.0 1.1 1.0 1.0 1.7 0.4 1.3 1.2 0.5Exports of goods and services 3.8 2.8 –0.3 3.0 1.6 0.4 –8.2 0.9 4.2Imports of goods and services –3.8 –1.7 1.3 –2.1 0.2 0.0 9.5 0.3 –3.7
Year-on-year change of period average in %Unit labor costs in the whole economy (nominal, per person) 3.2 3.4 7.6 3.7 4.2 5.1 10.8 5.8 8.8Unit labor costs in manufacturing (nominal, per hour) 4.7 4.2 4.8 5.5 4.3 6.2 15.3 –1.1 –1.0
Labor productivity in manufacturing (real, per hour) 3.1 2.4 1.7 1.7 2.1 2.1 –7.8 4.8 7.3Labor costs in manufacturing (nominal, per hour) 8.0 6.8 6.1 7.3 6.6 8.5 6.3 3.7 6.2
Producer price index (PPI) in industry 2.1 1.3 –0.5 0.8 0.3 0.3 –1.2 –1.0 –0.1Consumer price index (here: HICP) 1.2 2.1 3.7 2.5 2.6 3.9 3.4 3.7 3.6EUR per 1 PLN, + = PLN appreciation –0.1 –0.9 –3.3 –0.4 0.3 –0.5 –4.9 –2.7 –4.9
Period average levelsUnemployment rate (ILO definition, %, 15–64 years) 3.9 3.4 3.2 3.2 2.9 3.2 3.2 3.3 3.2Employment rate (%, 15–64 years) 67.4 68.2 68.7 68.9 68.5 68.4 67.9 69.0 69.4Key interest rate per annum (%) 1.5 1.5 0.5 1.5 1.5 1.4 0.4 0.1 0.1PLN per 1 EUR 4.3 4.3 4.4 4.3 4.3 4.3 4.5 4.4 4.5
Nominal year-on-year change in period-end stock in %Loans to the domestic nonbank private sector1 6.4 5.0 5.0 6.6 5.0 4.7 1.5 –0.8 –1.2
of which: loans to households 5.6 5.6 5.6 6.1 5.6 5.1 2.9 2.1 1.6loans to nonbank corporations 7.6 4.1 4.1 7.3 4.1 4.1 –0.9 –5.6 –6.0
%
Share of foreign currency loans in total loans to the non-bank private sector 20.8 19.2 19.6 20.0 19.2 20.2 19.8 19.6 19.6Return on assets (banking sector) 0.7 0.7 0.3 0.8 0.7 0.3 0.3 0.4 0.3Tier 1 capital ratio (banking sector) 17.1 17.0 18.8 17.0 17.0 16.3 18.0 18.4 18.8NPL ratio (banking sector) 6.8 6.6 6.9 6.8 6.6 6.7 6.9 7.0 6.9
% of GDPGeneral government revenues 41.3 41.1 41.7 .. .. .. .. .. ..General government expenditures 41.5 41.8 48.7 .. .. .. .. .. ..General government balance –0.2 –0.7 –7.0 .. .. .. .. .. ..Primary balance 1.2 0.7 –5.7 .. .. .. .. .. ..Gross public debt 48.8 45.6 57.5 .. .. .. .. .. ..
% of GDPDebt of nonfinancial corporations (nonconsolidated) 46.0 45.4 .. .. .. .. .. .. ..Debt of households and NPISHs2 (nonconsolidated) 34.7 34.8 .. .. .. .. .. .. ..
% of GDP (based on EUR), period totalGoods balance –1.2 0.2 2.4 –0.1 0.7 0.9 3.1 2.4 3.1Services balance 4.3 4.4 4.5 4.5 4.1 5.1 4.4 4.4 4.1Primary income –4.0 –3.8 –3.0 –4.6 –3.8 –1.5 –3.2 –4.1 –3.2Secondary income –0.3 –0.3 –0.3 –0.3 –0.1 –0.6 0.4 –0.2 –0.7Current account balance –1.3 0.5 3.6 –0.5 1.0 3.9 4.8 2.5 3.3Capital account balance 2.1 2.0 2.4 1.9 3.0 1.8 3.0 1.4 3.5Foreign direct investment (net)3 –2.6 –1.6 –1.4 –2.6 0.0 –4.1 –1.4 –1.3 0.8
% of GDP (rolling four-quarter GDP, based on EUR), end of periodGross external debt 63.6 59.2 58.1 60.6 59.2 56.3 57.0 57.3 58.1Gross official reserves (excluding gold) 19.6 19.6 21.9 19.3 19.6 18.4 19.6 20.4 21.9
Months of imports of goods and servicesGross official reserves (excluding gold) 4.5 4.6 5.4 4.5 4.6 4.4 4.8 5.1 5.4
EUR million, period totalGDP at current prices 497,645 532,403 521,416 131,570 149,283 128,680 117,302 131,154 144,279
Source: Bloomberg, European Commission, Eurostat, national statistical offices, national central banks, wiiw, OeNB.1 Foreign currency component at constant exchange rates.2 Nonprofit institutions serving households.3 + = net accumulation of assets larger than net accumulation of liabilities (net outflow of capital). – = net accumulation of assets smaller than net accumulation of liabilities (net inf low of capital).

Developments in selected CESEE countries
FOCUS ON EUROPEAN ECONOMIC INTEGRATION Q2/21 37
8 Poland: export performance contains GDP contraction
Poland’s GDP contracted by 2.7% in 2020, with the contraction accelerating from the third quarter to the fourth quarter. Domestic demand shrank by 4%, while exports declined only slightly on the back of strong positive growth in the final quarter of 2020. With imports declining considerably stronger and at roughly the same pace as total final demand, and hence GDP, the contribution of net exports to GDP growth remained positive at 1 percentage point. In parallel, the goods and services balance increased by about 2 percentage points to almost 7% of GDP. Coupled with a lower primary balance deficit, the current account surplus rose by 3 percentage points to 3.6% of GDP. The capital account surplus and net FDI inflows remained at about 2.5% and 1.5% of GDP, respectively, in the review period. Within domestic demand, public consumption registered robust growth despite the COVID-19 pandemic, albeit at a markedly slower rate than in 2019. While growth in public fixed investment was moderately positive in the first half of the year and roughly stagnant in the second half, private sector fixed investment posted negative growth rates throughout the year which accelerated from the third quarter to the fourth quarter, dragged down above all by investment in machinery and equipment, particularly transport equipment. The decline of inventory buildup lowered GDP growth by about 1 percentage point. Private consumption growth was again negative in the fourth quarter, after having slumped in the second quarter and stabilized in the third quarter. These developments stemmed from renewed lockdown measures, a general loss of confidence and precautionary savings. By con-trast, the real wage sum and real pension payments registered accelerated positive growth.
In manufacturing, the production volume fell less than employment (measured by total hours worked), resulting in an increase in labor productivity. The opposite was true for developments in the euro area. However, the growth differential in hourly labor costs implied slightly stronger average growth of nominal unit labor costs in Poland than in the euro area. This was more than offset, though, by the moderate decline in the złoty’s value against the euro. However, after having depre-ciated in early 2020, the złoty roughly ranged between 4.40 and 4.60 per euro in the period from April 2020 to March 2021. Headline inflation declined from 3.7% (HICP) and 2.9% (national CPI) in August to 3.6% and 2.4%, respectively, in February 2021. Core inflation declined in parallel from 4.6% (HICP excluding energy and unprocessed food) and 4.0% (CPI excluding energy and all food) to 4.2% and 3.7%, respectively. Services continued to be the main driver of inflation.
The Monetary Policy Council (MPC), pursuing an inflation target of 2.5% ±1 percentage point (CPI), has maintained an asymmetric band by keeping its main policy rate at 0.1%, the deposit rate at 0.0%, and the lombard rate at 0.5%. It increased the volume of its open-ended outright purchases of government(-guar-anteed) debt securities on the secondary market (with flexible scale to ensure the liquidity of these markets and to strengthen monetary transmission) from July to December 2020 and – yet only to a modest extent – for early 2021. At the same time, the MPC helped maintain the ten-year sovereign yield below 1.5%. In 2020, the volume totaled 4.6% of GDP, with purchases mainly occurring in the first half of 2020.
Regarding fiscal policy, the general government budget deficit rose from 0.7% of GDP in 2019 to 7% of GDP in 2020, as revenues increased by 0.6 percentage points and expenditures by 6.9 percentage points. Public debt rose from about 45.6% of GDP at end-2019 to about 57.5% at end-2020.
Table 8
Main economic indicators: Poland
2018 2019 2020 Q3 19 Q4 19 Q1 20 Q2 20 Q3 20 Q4 20
Year-on-year change of the period total in %GDP at constant prices 5.4 4.5 –2.7 4.6 3.7 1.9 –8.0 –1.8 –2.8Private consumption 4.5 3.9 –3.1 4.1 3.9 1.0 –10.6 0.4 –3.3Public consumption 3.5 6.2 3.2 7.1 4.6 2.6 3.0 3.7 3.5Gross fixed capital formation 9.4 7.2 –8.4 3.9 6.1 0.6 –10.8 –8.8 –10.8Exports of goods and services 6.9 5.1 –0.5 5.5 3.0 2.0 –14.4 1.6 8.2Imports of goods and services 7.4 3.3 –2.6 3.9 –0.4 0.4 –18.3 –0.6 7.9
Contribution to GDP growth in percentage pointsDomestic demand 5.3 3.4 –3.7 3.6 2.0 0.8 –9.3 –3.0 –3.2Net exports of goods and services 0.0 1.1 1.0 1.0 1.7 0.4 1.3 1.2 0.5Exports of goods and services 3.8 2.8 –0.3 3.0 1.6 0.4 –8.2 0.9 4.2Imports of goods and services –3.8 –1.7 1.3 –2.1 0.2 0.0 9.5 0.3 –3.7
Year-on-year change of period average in %Unit labor costs in the whole economy (nominal, per person) 3.2 3.4 7.6 3.7 4.2 5.1 10.8 5.8 8.8Unit labor costs in manufacturing (nominal, per hour) 4.7 4.2 4.8 5.5 4.3 6.2 15.3 –1.1 –1.0
Labor productivity in manufacturing (real, per hour) 3.1 2.4 1.7 1.7 2.1 2.1 –7.8 4.8 7.3Labor costs in manufacturing (nominal, per hour) 8.0 6.8 6.1 7.3 6.6 8.5 6.3 3.7 6.2
Producer price index (PPI) in industry 2.1 1.3 –0.5 0.8 0.3 0.3 –1.2 –1.0 –0.1Consumer price index (here: HICP) 1.2 2.1 3.7 2.5 2.6 3.9 3.4 3.7 3.6EUR per 1 PLN, + = PLN appreciation –0.1 –0.9 –3.3 –0.4 0.3 –0.5 –4.9 –2.7 –4.9
Period average levelsUnemployment rate (ILO definition, %, 15–64 years) 3.9 3.4 3.2 3.2 2.9 3.2 3.2 3.3 3.2Employment rate (%, 15–64 years) 67.4 68.2 68.7 68.9 68.5 68.4 67.9 69.0 69.4Key interest rate per annum (%) 1.5 1.5 0.5 1.5 1.5 1.4 0.4 0.1 0.1PLN per 1 EUR 4.3 4.3 4.4 4.3 4.3 4.3 4.5 4.4 4.5
Nominal year-on-year change in period-end stock in %Loans to the domestic nonbank private sector1 6.4 5.0 5.0 6.6 5.0 4.7 1.5 –0.8 –1.2
of which: loans to households 5.6 5.6 5.6 6.1 5.6 5.1 2.9 2.1 1.6loans to nonbank corporations 7.6 4.1 4.1 7.3 4.1 4.1 –0.9 –5.6 –6.0
%
Share of foreign currency loans in total loans to the non-bank private sector 20.8 19.2 19.6 20.0 19.2 20.2 19.8 19.6 19.6Return on assets (banking sector) 0.7 0.7 0.3 0.8 0.7 0.3 0.3 0.4 0.3Tier 1 capital ratio (banking sector) 17.1 17.0 18.8 17.0 17.0 16.3 18.0 18.4 18.8NPL ratio (banking sector) 6.8 6.6 6.9 6.8 6.6 6.7 6.9 7.0 6.9
% of GDPGeneral government revenues 41.3 41.1 41.7 .. .. .. .. .. ..General government expenditures 41.5 41.8 48.7 .. .. .. .. .. ..General government balance –0.2 –0.7 –7.0 .. .. .. .. .. ..Primary balance 1.2 0.7 –5.7 .. .. .. .. .. ..Gross public debt 48.8 45.6 57.5 .. .. .. .. .. ..
% of GDPDebt of nonfinancial corporations (nonconsolidated) 46.0 45.4 .. .. .. .. .. .. ..Debt of households and NPISHs2 (nonconsolidated) 34.7 34.8 .. .. .. .. .. .. ..
% of GDP (based on EUR), period totalGoods balance –1.2 0.2 2.4 –0.1 0.7 0.9 3.1 2.4 3.1Services balance 4.3 4.4 4.5 4.5 4.1 5.1 4.4 4.4 4.1Primary income –4.0 –3.8 –3.0 –4.6 –3.8 –1.5 –3.2 –4.1 –3.2Secondary income –0.3 –0.3 –0.3 –0.3 –0.1 –0.6 0.4 –0.2 –0.7Current account balance –1.3 0.5 3.6 –0.5 1.0 3.9 4.8 2.5 3.3Capital account balance 2.1 2.0 2.4 1.9 3.0 1.8 3.0 1.4 3.5Foreign direct investment (net)3 –2.6 –1.6 –1.4 –2.6 0.0 –4.1 –1.4 –1.3 0.8
% of GDP (rolling four-quarter GDP, based on EUR), end of periodGross external debt 63.6 59.2 58.1 60.6 59.2 56.3 57.0 57.3 58.1Gross official reserves (excluding gold) 19.6 19.6 21.9 19.3 19.6 18.4 19.6 20.4 21.9
Months of imports of goods and servicesGross official reserves (excluding gold) 4.5 4.6 5.4 4.5 4.6 4.4 4.8 5.1 5.4
EUR million, period totalGDP at current prices 497,645 532,403 521,416 131,570 149,283 128,680 117,302 131,154 144,279
Source: Bloomberg, European Commission, Eurostat, national statistical offices, national central banks, wiiw, OeNB.1 Foreign currency component at constant exchange rates.2 Nonprofit institutions serving households.3 + = net accumulation of assets larger than net accumulation of liabilities (net outflow of capital). – = net accumulation of assets smaller than net accumulation of liabilities (net inf low of capital).

Developments in selected CESEE countries
38 OESTERREICHISCHE NATIONALBANK
9 Romania: EU funds support economy and balance of payments as current account gap widens
After investments had cushioned the economic plunge in the first half of 2020, Romania’s economy recovered strongly in the second half of the year. All in all, GDP contraction was limited to 3.9% in 2020 despite weak agricultural output. In fact, the lifting of containment measures favored consumption spending from May 2020 onward. Continued recovery trends translated into vivid quarter-on-quarter growth in the third quarter of 2020. Labor support measures (in particular fur-lough schemes) prevented a more pronounced rise in unemployment and, with workers returning from furlough, wage growth picked up again over the summer. Despite the reintroduction of some containment measures in the fourth quarter of 2020, GDP continued to expand briskly. A 19% increase in child benefits in August and a 14% pension hike in September supported disposable income. Backed by public investments and better EU fund absorption as well as state-guaranteed loans for investments, gross fixed capital formation continued to play the key role on the GDP demand side. After movement restrictions and disruptions in international supply chains had put a brake on production in important export industries (such as the automotive industry), exports – supported by recovering external demand – bounced back in the second half of the year. Yet, as imports recovered as well, the GDP contribution of net exports remained negative.
Amid new infection waves accompanied by containment measures in early 2021, policy support was extended, but is expected to have a lower fiscal impact than in 2020. In general, the budget plan for 2021 avoids abrupt fiscal tightening despite a high structural deficit, which the government projects to decline slightly from 7.8% of GDP in 2020 to 7.4% of GDP in 2021. To reduce the deficit, the govern-ment opted for freezing public sector wages and pensions, while allowing for a further increase in public investments. With respect to the excessive deficit proce-dure, the European Commission requested Romania to avoid introducing new measures which might have a permanent negative impact on the budget, but emphasized that corrective action should not undermine efforts to support the health system and the economy. The European Commission also announced that the budgetary situation would be reassessed in spring 2021.
The National Bank of Romania (NBR) decided to cut its key policy rate further by 25 basis points to 1.25% in January 2021, citing disinflationary developments. In fact, the monetary policy-relevant consumer price inflation declined to 2.1% year on year at the end of 2020, and thus stood clearly below the mid-point of the target range of 2.5% ±1 percentage point. In early 2021, headline inflation moved up to 3.2% in February, but core inflation slightly declined to 3.1%, down from 3.3% at end-2020. The repo line with the ECB, set up in May 2020 to address pos-sible euro liquidity needs during the COVID-19 crisis, was extended once more until March 2022.
Romania’s current account deficit widened somewhat to 5.2% of GDP in 2020, while net FDI inflows declined markedly. Yet, better EU fund absorption, mani-festing itself in a higher capital account surplus, led to a marginal improvement in the net borrowing position from current and capital accounts. As regards external price competitiveness, unit labor cost increases in the manufacturing sector were again not fully compensated by the exchange rate when looking at full-year data. But the relation between unit labor cost increases and nominal depreciation of the leu vis-à-vis the euro (both in year-on-year terms) improved noticeably in the second half of 2020.
Table 9
Main economic indicators: Romania
2018 2019 2020 Q3 19 Q4 19 Q1 20 Q2 20 Q3 20 Q4 20
Year-on-year change of the period total in %GDP at constant prices 4.5 4.1 –3.9 3.0 4.3 2.4 –10.0 –5.6 –1.4Private consumption 7.6 4.0 –4.7 2.4 5.2 3.8 –12.7 –4.3 –5.5Public consumption 4.6 7.3 1.4 2.5 9.3 3.9 4.0 3.5 –1.2Gross fixed capital formation –1.0 12.8 5.9 19.3 9.8 17.6 2.3 2.7 6.5Exports of goods and services 5.3 4.0 –9.9 3.6 6.3 –1.7 –28.6 –5.2 –3.1Imports of goods and services 8.7 7.1 –6.6 7.7 6.2 2.1 –22.9 –4.3 0.0
Contribution to GDP growth in percentage pointsDomestic demand 6.1 5.3 –2.5 5.2 4.4 4.7 –8.1 –5.3 –0.2Net exports of goods and services –1.6 –1.2 –1.4 –1.7 0.1 –2.6 –2.4 –0.6 –1.2Exports of goods and services 2.2 1.9 –4.1 1.9 2.3 –0.4 –11.9 –2.6 –1.7Imports of goods and services –3.8 –3.1 2.7 –3.6 –2.2 –2.2 9.5 2.0 0.5
Year-on-year change of period average in %Unit labor costs in the whole economy (nominal, per person) 8.5 6.3 8.9 5.3 7.4 6.5 11.6 12.2 5.5Unit labor costs in manufacturing (nominal, per hour) 7.0 13.2 5.9 14.7 14.6 11.5 8.1 2.9 1.7
Labor productivity in manufacturing (real, per hour) 5.5 –0.8 0.4 –2.3 –2.6 –1.7 –5.0 1.7 6.8Labor costs in manufacturing (nominal, per hour) 12.8 12.4 6.4 12.1 11.6 9.6 2.7 4.7 8.6
Producer price index (PPI) in industry 5.0 4.0 0.0 3.5 3.2 2.7 –1.4 –0.8 –0.5Consumer price index (here: HICP) 4.1 3.9 2.3 3.9 3.7 3.1 2.1 2.4 1.8EUR per 1 RON, + = RON appreciation –1.8 –1.9 –1.9 –1.8 –2.2 –1.3 –1.9 –2.3 –2.1
Period average levelsUnemployment rate (ILO definition, %, 15–64 years) 4.3 4.0 5.2 4.0 4.0 4.4 5.5 5.4 5.4Employment rate (%, 15–64 years) 64.8 65.8 65.6 66.7 66.0 65.4 65.2 66.0 65.8Key interest rate per annum (%) 2.4 2.5 1.9 2.5 2.5 2.4 1.9 1.6 1.5RON per 1 EUR 4.7 4.7 4.8 4.7 4.8 4.8 4.8 4.8 4.9
Nominal year-on-year change in period-end stock in %Loans to the domestic nonbank private sector1 7.9 5.5 5.5 6.8 5.5 6.2 3.1 3.2 4.8
of which: loans to households 9.1 6.7 6.7 6.6 6.7 7.1 5.3 4.8 4.2loans to nonbank corporations 6.6 4.2 4.2 7.1 4.2 5.3 0.6 1.4 5.5
%
Share of foreign currency loans in total loans to the non-bank private sector 34.0 32.4 30.5 33.4 32.4 32.8 32.2 31.4 30.5Return on assets (banking sector) 1.6 1.4 1.0 1.5 1.4 1.3 1.1 1.2 1.0Tier 1 capital ratio (banking sector) 18.6 20.1 21.3 17.9 20.1 18.5 20.7 20.8 21.3NPL ratio (banking sector) 5.0 4.1 3.8 4.6 4.1 3.9 4.4 4.1 3.8
% of GDPGeneral government revenues 31.9 31.8 33.1 .. .. .. .. .. ..General government expenditures 34.9 36.2 42.4 .. .. .. .. .. ..General government balance –2.9 –4.4 –9.2 .. .. .. .. .. ..Primary balance –1.9 –3.2 –7.9 .. .. .. .. .. ..Gross public debt 34.7 35.3 47.3 .. .. .. .. .. ..
% of GDPDebt of nonfinancial corporations (nonconsolidated) 32.9 32.3 .. .. .. .. .. .. ..Debt of households and NPISHs2 (nonconsolidated) 15.8 15.4 .. .. .. .. .. .. ..
% of GDP (based on EUR), period totalGoods balance –7.2 –7.8 –8.8 –7.3 –7.8 –10.1 –9.5 –8.0 –8.2Services balance 4.1 3.9 4.3 3.4 3.8 4.9 4.8 4.2 3.7Primary income –1.8 –1.4 –1.7 –2.6 –0.9 2.2 –2.8 –3.5 –1.9Secondary income 0.6 0.7 0.9 0.7 1.2 0.7 0.8 0.8 1.2Current account balance –4.4 –4.7 –5.2 –5.9 –3.8 –2.2 –6.6 –6.5 –5.2Capital account balance 1.2 1.3 1.9 0.9 1.7 2.6 1.7 1.0 2.4Foreign direct investment (net)3 –2.4 –2.2 –0.9 –2.8 –0.7 0.9 –3.0 –0.9 –0.5
% of GDP (rolling four-quarter GDP, based on EUR), end of periodGross external debt 48.8 49.2 57.9 49.7 49.2 48.6 51.9 54.5 57.9Gross official reserves (excluding gold) 16.2 14.7 17.2 16.3 14.7 15.2 15.9 15.0 17.2
Months of imports of goods and servicesGross official reserves (excluding gold) 4.3 4.0 4.9 4.4 4.0 4.1 4.5 4.3 4.9
EUR million, period totalGDP at current prices 204,493 222,921 217,655 61,194 66,924 44,770 46,599 58,692 67,594
Source: Bloomberg, European Commission, Eurostat, national statistical offices, national central banks, wiiw, OeNB.1 Foreign currency component at constant exchange rates.2 Nonprofit institutions serving households.3 + = net accumulation of assets larger than net accumulation of liabilities (net outflow of capital). – = net accumulation of assets smaller than net accumulation of liabilities (net inf low of capital).

Developments in selected CESEE countries
FOCUS ON EUROPEAN ECONOMIC INTEGRATION Q2/21 39
9 Romania: EU funds support economy and balance of payments as current account gap widens
After investments had cushioned the economic plunge in the first half of 2020, Romania’s economy recovered strongly in the second half of the year. All in all, GDP contraction was limited to 3.9% in 2020 despite weak agricultural output. In fact, the lifting of containment measures favored consumption spending from May 2020 onward. Continued recovery trends translated into vivid quarter-on-quarter growth in the third quarter of 2020. Labor support measures (in particular fur-lough schemes) prevented a more pronounced rise in unemployment and, with workers returning from furlough, wage growth picked up again over the summer. Despite the reintroduction of some containment measures in the fourth quarter of 2020, GDP continued to expand briskly. A 19% increase in child benefits in August and a 14% pension hike in September supported disposable income. Backed by public investments and better EU fund absorption as well as state-guaranteed loans for investments, gross fixed capital formation continued to play the key role on the GDP demand side. After movement restrictions and disruptions in international supply chains had put a brake on production in important export industries (such as the automotive industry), exports – supported by recovering external demand – bounced back in the second half of the year. Yet, as imports recovered as well, the GDP contribution of net exports remained negative.
Amid new infection waves accompanied by containment measures in early 2021, policy support was extended, but is expected to have a lower fiscal impact than in 2020. In general, the budget plan for 2021 avoids abrupt fiscal tightening despite a high structural deficit, which the government projects to decline slightly from 7.8% of GDP in 2020 to 7.4% of GDP in 2021. To reduce the deficit, the govern-ment opted for freezing public sector wages and pensions, while allowing for a further increase in public investments. With respect to the excessive deficit proce-dure, the European Commission requested Romania to avoid introducing new measures which might have a permanent negative impact on the budget, but emphasized that corrective action should not undermine efforts to support the health system and the economy. The European Commission also announced that the budgetary situation would be reassessed in spring 2021.
The National Bank of Romania (NBR) decided to cut its key policy rate further by 25 basis points to 1.25% in January 2021, citing disinflationary developments. In fact, the monetary policy-relevant consumer price inflation declined to 2.1% year on year at the end of 2020, and thus stood clearly below the mid-point of the target range of 2.5% ±1 percentage point. In early 2021, headline inflation moved up to 3.2% in February, but core inflation slightly declined to 3.1%, down from 3.3% at end-2020. The repo line with the ECB, set up in May 2020 to address pos-sible euro liquidity needs during the COVID-19 crisis, was extended once more until March 2022.
Romania’s current account deficit widened somewhat to 5.2% of GDP in 2020, while net FDI inflows declined markedly. Yet, better EU fund absorption, mani-festing itself in a higher capital account surplus, led to a marginal improvement in the net borrowing position from current and capital accounts. As regards external price competitiveness, unit labor cost increases in the manufacturing sector were again not fully compensated by the exchange rate when looking at full-year data. But the relation between unit labor cost increases and nominal depreciation of the leu vis-à-vis the euro (both in year-on-year terms) improved noticeably in the second half of 2020.
Table 9
Main economic indicators: Romania
2018 2019 2020 Q3 19 Q4 19 Q1 20 Q2 20 Q3 20 Q4 20
Year-on-year change of the period total in %GDP at constant prices 4.5 4.1 –3.9 3.0 4.3 2.4 –10.0 –5.6 –1.4Private consumption 7.6 4.0 –4.7 2.4 5.2 3.8 –12.7 –4.3 –5.5Public consumption 4.6 7.3 1.4 2.5 9.3 3.9 4.0 3.5 –1.2Gross fixed capital formation –1.0 12.8 5.9 19.3 9.8 17.6 2.3 2.7 6.5Exports of goods and services 5.3 4.0 –9.9 3.6 6.3 –1.7 –28.6 –5.2 –3.1Imports of goods and services 8.7 7.1 –6.6 7.7 6.2 2.1 –22.9 –4.3 0.0
Contribution to GDP growth in percentage pointsDomestic demand 6.1 5.3 –2.5 5.2 4.4 4.7 –8.1 –5.3 –0.2Net exports of goods and services –1.6 –1.2 –1.4 –1.7 0.1 –2.6 –2.4 –0.6 –1.2Exports of goods and services 2.2 1.9 –4.1 1.9 2.3 –0.4 –11.9 –2.6 –1.7Imports of goods and services –3.8 –3.1 2.7 –3.6 –2.2 –2.2 9.5 2.0 0.5
Year-on-year change of period average in %Unit labor costs in the whole economy (nominal, per person) 8.5 6.3 8.9 5.3 7.4 6.5 11.6 12.2 5.5Unit labor costs in manufacturing (nominal, per hour) 7.0 13.2 5.9 14.7 14.6 11.5 8.1 2.9 1.7
Labor productivity in manufacturing (real, per hour) 5.5 –0.8 0.4 –2.3 –2.6 –1.7 –5.0 1.7 6.8Labor costs in manufacturing (nominal, per hour) 12.8 12.4 6.4 12.1 11.6 9.6 2.7 4.7 8.6
Producer price index (PPI) in industry 5.0 4.0 0.0 3.5 3.2 2.7 –1.4 –0.8 –0.5Consumer price index (here: HICP) 4.1 3.9 2.3 3.9 3.7 3.1 2.1 2.4 1.8EUR per 1 RON, + = RON appreciation –1.8 –1.9 –1.9 –1.8 –2.2 –1.3 –1.9 –2.3 –2.1
Period average levelsUnemployment rate (ILO definition, %, 15–64 years) 4.3 4.0 5.2 4.0 4.0 4.4 5.5 5.4 5.4Employment rate (%, 15–64 years) 64.8 65.8 65.6 66.7 66.0 65.4 65.2 66.0 65.8Key interest rate per annum (%) 2.4 2.5 1.9 2.5 2.5 2.4 1.9 1.6 1.5RON per 1 EUR 4.7 4.7 4.8 4.7 4.8 4.8 4.8 4.8 4.9
Nominal year-on-year change in period-end stock in %Loans to the domestic nonbank private sector1 7.9 5.5 5.5 6.8 5.5 6.2 3.1 3.2 4.8
of which: loans to households 9.1 6.7 6.7 6.6 6.7 7.1 5.3 4.8 4.2loans to nonbank corporations 6.6 4.2 4.2 7.1 4.2 5.3 0.6 1.4 5.5
%
Share of foreign currency loans in total loans to the non-bank private sector 34.0 32.4 30.5 33.4 32.4 32.8 32.2 31.4 30.5Return on assets (banking sector) 1.6 1.4 1.0 1.5 1.4 1.3 1.1 1.2 1.0Tier 1 capital ratio (banking sector) 18.6 20.1 21.3 17.9 20.1 18.5 20.7 20.8 21.3NPL ratio (banking sector) 5.0 4.1 3.8 4.6 4.1 3.9 4.4 4.1 3.8
% of GDPGeneral government revenues 31.9 31.8 33.1 .. .. .. .. .. ..General government expenditures 34.9 36.2 42.4 .. .. .. .. .. ..General government balance –2.9 –4.4 –9.2 .. .. .. .. .. ..Primary balance –1.9 –3.2 –7.9 .. .. .. .. .. ..Gross public debt 34.7 35.3 47.3 .. .. .. .. .. ..
% of GDPDebt of nonfinancial corporations (nonconsolidated) 32.9 32.3 .. .. .. .. .. .. ..Debt of households and NPISHs2 (nonconsolidated) 15.8 15.4 .. .. .. .. .. .. ..
% of GDP (based on EUR), period totalGoods balance –7.2 –7.8 –8.8 –7.3 –7.8 –10.1 –9.5 –8.0 –8.2Services balance 4.1 3.9 4.3 3.4 3.8 4.9 4.8 4.2 3.7Primary income –1.8 –1.4 –1.7 –2.6 –0.9 2.2 –2.8 –3.5 –1.9Secondary income 0.6 0.7 0.9 0.7 1.2 0.7 0.8 0.8 1.2Current account balance –4.4 –4.7 –5.2 –5.9 –3.8 –2.2 –6.6 –6.5 –5.2Capital account balance 1.2 1.3 1.9 0.9 1.7 2.6 1.7 1.0 2.4Foreign direct investment (net)3 –2.4 –2.2 –0.9 –2.8 –0.7 0.9 –3.0 –0.9 –0.5
% of GDP (rolling four-quarter GDP, based on EUR), end of periodGross external debt 48.8 49.2 57.9 49.7 49.2 48.6 51.9 54.5 57.9Gross official reserves (excluding gold) 16.2 14.7 17.2 16.3 14.7 15.2 15.9 15.0 17.2
Months of imports of goods and servicesGross official reserves (excluding gold) 4.3 4.0 4.9 4.4 4.0 4.1 4.5 4.3 4.9
EUR million, period totalGDP at current prices 204,493 222,921 217,655 61,194 66,924 44,770 46,599 58,692 67,594
Source: Bloomberg, European Commission, Eurostat, national statistical offices, national central banks, wiiw, OeNB.1 Foreign currency component at constant exchange rates.2 Nonprofit institutions serving households.3 + = net accumulation of assets larger than net accumulation of liabilities (net outflow of capital). – = net accumulation of assets smaller than net accumulation of liabilities (net inf low of capital).

Developments in selected CESEE countries
40 OESTERREICHISCHE NATIONALBANK
10 Turkey: low level of reserves, strong depreciation and high inflation challenge monetary policy
Turkey’s GDP growth accelerated to 1.8% in 2020, on account of positive annual rates since the third quarter. This acceleration resulted from very low growth in 2019 and extraordinarily large stock-building in 2020. Even excluding this buildup, domestic demand rendered a positive contribution to growth in 2020 after a negative one in 2019. Fixed investment was strongly supported by massive state-bank credit. By contrast, exports fell by 15.4% in 2020, with year-on-year growth being negative in each quarter and quarter-on-quarter growth being negative in the first half of 2020, but highly positive thereafter. As opposed to exports, imports benefitted from the correction of previous compression and then from sharply rising volumes of non-monetary gold imports. Hence, net exports’ contribution to annual GDP growth was negative at almost –6 percentage points. Correspondingly, at 4% of GDP, the goods and services balance was negative, after a surplus of 5% of GDP in 2019, and the current account deficit reached 5.2% of GDP, after a surplus of 1% of GDP in 2019. The tourism-related decline in the services surplus contrib-uted 3.5 percentage points to this deterioration, and the rise in net imports of non-monetary gold another 2 percentage points.
Exchange rate uncertainty boosted gold demand, which fueled currency depre-ciation. This, in turn, provoked further gold imports, preventing imports from falling despite depreciation. The lira depreciated against the euro throughout the year by 32% until end-October 2020, while official FX reserves declined to the FX amount borrowed via swaps for periods of up to 3 months. However, cumulative size-able lira depreciation had not translated into higher annual inflation by October 2020, with both annual headline and core HICP inflation close to their December 2019 levels, at about 12%. Still, in early November 2020, the Turkish President appointed a new head of the Central Bank of the Republic of Turkey (TCMB) who intensified the tightening that had begun in August 2020. The TCMB abolished remaining liquidity-providing facilities other than the one-week repo transaction, hiked the repo rate to 15% (from 10.25%) in November and further to 17% in December, and raised the reserve requirement ratios for lira, and particularly for FX deposits, in November. Moreover, regulatory measures aimed at strengthening loan growth had been abolished by year-end 2020. In response, the lira appreciated until March 2021. At the same time, however, annual inflation accelerated to 15.6% (headline inflation) and 16.6% (core inflation) in February 2021, strength-ening views that interest rates are the cause of inflation. After the TCMB had hiked the key rate further to 19% in March 2021, the President dismissed the bank’s governor.
Several COVID-19 measures were extended into 2021, e.g. less stringent reg-ulatory rules for banks and short-time work payments for registered workers. In 2020, the general government deficit rose by 3.2 percentage points to 6.2% of GDP, and the primary deficit by 1.5 percentage points to 2% of GDP. The increase of the deficit mainly reflected COVID-19-related discretionary measures (2 percentage points, of which 0.8 percentage points were accounted for by short-time work and 0.3 percentage points by VAT reductions). Apart from this direct budgetary sup-port, the total COVID-19-related economic support package amounting to about 12% of GDP consisted, i.a., of guarantees for loans to firms and households (6.8% of GDP), loan service deferrals by state-owned banks (1.5%), tax deferrals for businesses (1.5%), and equity injections into public banks (0.5%).
Table 10
Main economic indicators: Turkey
2018 2019 2020 Q3 19 Q4 19 Q1 20 Q2 20 Q3 20 Q4 20
Year-on-year change of the period total in %GDP at constant prices 3.0 0.9 1.8 1.0 6.4 4.5 –10.3 6.3 5.9Private consumption 0.5 1.6 3.2 2.0 8.2 4.7 –9.6 8.5 8.2Public consumption 6.6 4.4 2.3 6.3 1.6 3.2 –2.1 0.8 6.6Gross fixed capital formation –0.3 –12.4 6.5 –14.0 0.6 –0.4 –6.6 21.9 10.3Exports of goods and services 9.0 4.9 –15.4 4.7 0.6 –1.8 –36.9 –22.1 0.0Imports of goods and services –6.4 –5.3 7.4 3.6 27.8 21.4 –7.7 16.4 2.5
Contribution to GDP growth in percentage pointsDomestic demand 1.2 –2.0 3.8 –1.8 5.1 3.2 –7.6 10.1 8.3Net exports of goods and services 3.9 2.6 –5.9 0.5 –6.2 –5.0 –8.2 –9.8 –0.7Exports of goods and services 2.2 1.3 –4.1 1.3 0.2 –0.5 –9.9 –6.2 0.0Imports of goods and services 1.7 1.3 –1.7 –0.8 –6.3 –4.5 1.7 –3.6 –0.7
Year-on-year change of period average in %Unit labor costs in the whole economy (nominal, per person) .. .. .. .. .. .. .. .. ..Unit labor costs in manufacturing (nominal, per hour) 18.0 21.9 10.0 22.5 15.6 16.0 13.6 3.5 7.0
Labor productivity in manufacturing (real, per hour) 1.8 1.6 8.3 0.8 3.4 3.9 13.5 7.0 8.3Labor costs in manufacturing (nominal, per hour) 20.5 23.7 18.9 23.4 19.6 20.5 28.9 10.7 15.9
Producer price index (PPI) in industry 27.0 17.6 12.2 12.0 4.4 8.9 6.1 11.4 22.2Consumer price index (here: HICP) 16.3 15.2 12.3 13.5 10.3 12.1 11.7 11.8 13.5EUR per 1 TRY, + = TRY appreciation –27.7 –10.4 –21.0 4.7 –2.1 –9.4 –12.7 –25.5 –31.8
Period average levelsUnemployment rate (ILO definition, %, 15–64 years) 11.1 14.0 13.4 14.3 13.5 13.9 13.1 13.4 13.0Employment rate (%, 15–64 years) 52.0 50.3 47.5 51.0 50.2 47.6 45.9 48.8 47.7Key interest rate per annum (%) 15.5 20.6 10.2 20.3 14.3 11.0 8.8 8.4 12.5TRY per 1 EUR 5.7 6.4 8.0 6.3 6.4 6.7 7.6 8.5 9.4
Nominal year-on-year change in period-end stock in %Loans to the domestic nonbank private sector 12.0 11.0 36.3 –2.2 11.0 15.2 29.1 41.3 36.3
of which: loans to households 3.2 15.9 40.1 3.7 15.9 23.4 36.4 48.4 40.1loans to nonbank corporations 15.0 9.5 35.0 –3.8 9.5 12.9 27.0 39.1 35.0
%
Share of foreign currency loans in total loans to the nonbank private sector 38.5 35.1 30.9 35.5 35.1 34.9 31.6 32.0 30.9Return on assets (banking sector) 1.5 1.1 1.0 1.1 1.1 1.3 1.2 1.2 1.0Tier 1 capital ratio (banking sector) 13.4 13.9 14.1 13.9 13.9 13.3 14.8 14.5 14.1NPL ratio (banking sector) 4.1 5.7 4.4 5.3 5.7 5.3 4.7 4.4 4.4
% of GDPGeneral government revenues 31.9 32.9 31.4 .. .. .. .. .. ..General government expenditures 34.7 35.9 37.6 .. .. .. .. .. ..General government balance –2.8 –3.0 –6.2 .. .. .. .. .. ..Primary balance 0.1 0.5 –2.0 .. .. .. .. .. ..Gross public debt 30.4 32.8 41.3 .. .. .. .. .. ..
% of GDPDebt of nonfinancial corporations (nonconsolidated) .. .. .. .. .. .. .. .. ..Debt of households and NPISHs1 (nonconsolidated) .. .. .. .. .. .. .. .. ..
% of GDP (based on EUR), period totalGoods balance –5.1 –2.2 –5.3 –2.1 –2.6 –5.5 –5.8 –5.6 –4.4Services balance 3.9 4.7 1.3 7.2 4.0 2.0 –0.6 1.8 1.8Primary income –1.5 –1.7 –1.2 –1.5 –1.6 –1.4 –1.9 –0.8 –1.0Secondary income 0.1 0.1 0.0 0.1 0.2 –0.2 0.0 0.2 0.1Current account balance –2.7 0.9 –5.2 3.7 0.0 –5.0 –8.2 –4.4 –3.5Capital account balance 0.0 0.0 0.0 0.0 0.0 0.0 0.0 0.0 0.0Foreign direct investment (net)2 –1.2 –0.8 –0.7 –0.6 –0.8 –1.2 –0.1 –0.6 –0.7
% of GDP (rolling four-quarter GDP, based on EUR), end of periodGross external debt 57.8 54.7 53.9 58.6 54.7 53.8 52.9 52.8 53.9Gross official reserves (excluding gold) 9.6 10.3 6.5 10.6 10.3 8.1 6.3 5.0 6.5
Months of imports of goods and servicesGross official reserves (excluding gold) 3.6 4.1 2.4 4.2 4.1 3.2 2.5 1.9 2.4
EUR million, period totalGDP at current prices 662,351 679,154 625,420 183,630 188,394 159,211 136,850 167,156 162,203
Source: Bloomberg, European Commission, Eurostat, national statistical offices, national central banks, wiiw, OeNB.1 Nonprofit institutions serving households.2 + = net accumulation of assets larger than net accumulation of liabilities (net outflow of capital). – = net accumulation of assets smaller than net accumulation of liabilities (net inf low of capital).

Developments in selected CESEE countries
FOCUS ON EUROPEAN ECONOMIC INTEGRATION Q2/21 41
10 Turkey: low level of reserves, strong depreciation and high inflation challenge monetary policy
Turkey’s GDP growth accelerated to 1.8% in 2020, on account of positive annual rates since the third quarter. This acceleration resulted from very low growth in 2019 and extraordinarily large stock-building in 2020. Even excluding this buildup, domestic demand rendered a positive contribution to growth in 2020 after a negative one in 2019. Fixed investment was strongly supported by massive state-bank credit. By contrast, exports fell by 15.4% in 2020, with year-on-year growth being negative in each quarter and quarter-on-quarter growth being negative in the first half of 2020, but highly positive thereafter. As opposed to exports, imports benefitted from the correction of previous compression and then from sharply rising volumes of non-monetary gold imports. Hence, net exports’ contribution to annual GDP growth was negative at almost –6 percentage points. Correspondingly, at 4% of GDP, the goods and services balance was negative, after a surplus of 5% of GDP in 2019, and the current account deficit reached 5.2% of GDP, after a surplus of 1% of GDP in 2019. The tourism-related decline in the services surplus contrib-uted 3.5 percentage points to this deterioration, and the rise in net imports of non-monetary gold another 2 percentage points.
Exchange rate uncertainty boosted gold demand, which fueled currency depre-ciation. This, in turn, provoked further gold imports, preventing imports from falling despite depreciation. The lira depreciated against the euro throughout the year by 32% until end-October 2020, while official FX reserves declined to the FX amount borrowed via swaps for periods of up to 3 months. However, cumulative size-able lira depreciation had not translated into higher annual inflation by October 2020, with both annual headline and core HICP inflation close to their December 2019 levels, at about 12%. Still, in early November 2020, the Turkish President appointed a new head of the Central Bank of the Republic of Turkey (TCMB) who intensified the tightening that had begun in August 2020. The TCMB abolished remaining liquidity-providing facilities other than the one-week repo transaction, hiked the repo rate to 15% (from 10.25%) in November and further to 17% in December, and raised the reserve requirement ratios for lira, and particularly for FX deposits, in November. Moreover, regulatory measures aimed at strengthening loan growth had been abolished by year-end 2020. In response, the lira appreciated until March 2021. At the same time, however, annual inflation accelerated to 15.6% (headline inflation) and 16.6% (core inflation) in February 2021, strength-ening views that interest rates are the cause of inflation. After the TCMB had hiked the key rate further to 19% in March 2021, the President dismissed the bank’s governor.
Several COVID-19 measures were extended into 2021, e.g. less stringent reg-ulatory rules for banks and short-time work payments for registered workers. In 2020, the general government deficit rose by 3.2 percentage points to 6.2% of GDP, and the primary deficit by 1.5 percentage points to 2% of GDP. The increase of the deficit mainly reflected COVID-19-related discretionary measures (2 percentage points, of which 0.8 percentage points were accounted for by short-time work and 0.3 percentage points by VAT reductions). Apart from this direct budgetary sup-port, the total COVID-19-related economic support package amounting to about 12% of GDP consisted, i.a., of guarantees for loans to firms and households (6.8% of GDP), loan service deferrals by state-owned banks (1.5%), tax deferrals for businesses (1.5%), and equity injections into public banks (0.5%).
Table 10
Main economic indicators: Turkey
2018 2019 2020 Q3 19 Q4 19 Q1 20 Q2 20 Q3 20 Q4 20
Year-on-year change of the period total in %GDP at constant prices 3.0 0.9 1.8 1.0 6.4 4.5 –10.3 6.3 5.9Private consumption 0.5 1.6 3.2 2.0 8.2 4.7 –9.6 8.5 8.2Public consumption 6.6 4.4 2.3 6.3 1.6 3.2 –2.1 0.8 6.6Gross fixed capital formation –0.3 –12.4 6.5 –14.0 0.6 –0.4 –6.6 21.9 10.3Exports of goods and services 9.0 4.9 –15.4 4.7 0.6 –1.8 –36.9 –22.1 0.0Imports of goods and services –6.4 –5.3 7.4 3.6 27.8 21.4 –7.7 16.4 2.5
Contribution to GDP growth in percentage pointsDomestic demand 1.2 –2.0 3.8 –1.8 5.1 3.2 –7.6 10.1 8.3Net exports of goods and services 3.9 2.6 –5.9 0.5 –6.2 –5.0 –8.2 –9.8 –0.7Exports of goods and services 2.2 1.3 –4.1 1.3 0.2 –0.5 –9.9 –6.2 0.0Imports of goods and services 1.7 1.3 –1.7 –0.8 –6.3 –4.5 1.7 –3.6 –0.7
Year-on-year change of period average in %Unit labor costs in the whole economy (nominal, per person) .. .. .. .. .. .. .. .. ..Unit labor costs in manufacturing (nominal, per hour) 18.0 21.9 10.0 22.5 15.6 16.0 13.6 3.5 7.0
Labor productivity in manufacturing (real, per hour) 1.8 1.6 8.3 0.8 3.4 3.9 13.5 7.0 8.3Labor costs in manufacturing (nominal, per hour) 20.5 23.7 18.9 23.4 19.6 20.5 28.9 10.7 15.9
Producer price index (PPI) in industry 27.0 17.6 12.2 12.0 4.4 8.9 6.1 11.4 22.2Consumer price index (here: HICP) 16.3 15.2 12.3 13.5 10.3 12.1 11.7 11.8 13.5EUR per 1 TRY, + = TRY appreciation –27.7 –10.4 –21.0 4.7 –2.1 –9.4 –12.7 –25.5 –31.8
Period average levelsUnemployment rate (ILO definition, %, 15–64 years) 11.1 14.0 13.4 14.3 13.5 13.9 13.1 13.4 13.0Employment rate (%, 15–64 years) 52.0 50.3 47.5 51.0 50.2 47.6 45.9 48.8 47.7Key interest rate per annum (%) 15.5 20.6 10.2 20.3 14.3 11.0 8.8 8.4 12.5TRY per 1 EUR 5.7 6.4 8.0 6.3 6.4 6.7 7.6 8.5 9.4
Nominal year-on-year change in period-end stock in %Loans to the domestic nonbank private sector 12.0 11.0 36.3 –2.2 11.0 15.2 29.1 41.3 36.3
of which: loans to households 3.2 15.9 40.1 3.7 15.9 23.4 36.4 48.4 40.1loans to nonbank corporations 15.0 9.5 35.0 –3.8 9.5 12.9 27.0 39.1 35.0
%
Share of foreign currency loans in total loans to the nonbank private sector 38.5 35.1 30.9 35.5 35.1 34.9 31.6 32.0 30.9Return on assets (banking sector) 1.5 1.1 1.0 1.1 1.1 1.3 1.2 1.2 1.0Tier 1 capital ratio (banking sector) 13.4 13.9 14.1 13.9 13.9 13.3 14.8 14.5 14.1NPL ratio (banking sector) 4.1 5.7 4.4 5.3 5.7 5.3 4.7 4.4 4.4
% of GDPGeneral government revenues 31.9 32.9 31.4 .. .. .. .. .. ..General government expenditures 34.7 35.9 37.6 .. .. .. .. .. ..General government balance –2.8 –3.0 –6.2 .. .. .. .. .. ..Primary balance 0.1 0.5 –2.0 .. .. .. .. .. ..Gross public debt 30.4 32.8 41.3 .. .. .. .. .. ..
% of GDPDebt of nonfinancial corporations (nonconsolidated) .. .. .. .. .. .. .. .. ..Debt of households and NPISHs1 (nonconsolidated) .. .. .. .. .. .. .. .. ..
% of GDP (based on EUR), period totalGoods balance –5.1 –2.2 –5.3 –2.1 –2.6 –5.5 –5.8 –5.6 –4.4Services balance 3.9 4.7 1.3 7.2 4.0 2.0 –0.6 1.8 1.8Primary income –1.5 –1.7 –1.2 –1.5 –1.6 –1.4 –1.9 –0.8 –1.0Secondary income 0.1 0.1 0.0 0.1 0.2 –0.2 0.0 0.2 0.1Current account balance –2.7 0.9 –5.2 3.7 0.0 –5.0 –8.2 –4.4 –3.5Capital account balance 0.0 0.0 0.0 0.0 0.0 0.0 0.0 0.0 0.0Foreign direct investment (net)2 –1.2 –0.8 –0.7 –0.6 –0.8 –1.2 –0.1 –0.6 –0.7
% of GDP (rolling four-quarter GDP, based on EUR), end of periodGross external debt 57.8 54.7 53.9 58.6 54.7 53.8 52.9 52.8 53.9Gross official reserves (excluding gold) 9.6 10.3 6.5 10.6 10.3 8.1 6.3 5.0 6.5
Months of imports of goods and servicesGross official reserves (excluding gold) 3.6 4.1 2.4 4.2 4.1 3.2 2.5 1.9 2.4
EUR million, period totalGDP at current prices 662,351 679,154 625,420 183,630 188,394 159,211 136,850 167,156 162,203
Source: Bloomberg, European Commission, Eurostat, national statistical offices, national central banks, wiiw, OeNB.1 Nonprofit institutions serving households.2 + = net accumulation of assets larger than net accumulation of liabilities (net outflow of capital). – = net accumulation of assets smaller than net accumulation of liabilities (net inf low of capital).

Developments in selected CESEE countries
42 OESTERREICHISCHE NATIONALBANK
11 Russia: relatively mild recession in 2020 because of small services sector, limited restrictive measures and well-targeted fiscal stimulus
Russia’s coronavirus-triggered recession softened in the third and fourth quarters, resulting in a relatively mild annual GDP contraction of 3% in 2020. The rather strict lockdown of spring 2020, followed by reopening measures in the summer, which were replaced by new but much milder restrictions in the fall and winter, may explain part of the overall contraction and growth variations over the year. Accordingly, swiftly shrinking private consumption was the driving force of the economic contraction. Fixed investment also decreased markedly, while inventories grew somewhat. Other recessionary factors included the sharp drop of the oil price (–34% on average in 2020 against 2019) and the OPEC+ production ceiling agreement in force from May 2020 onward. Contrary to the past, government consumption expanded and boosted growth. Exports – supported by still expanding Chinese demand – declined less than expected, while imports contracted sharply.
Import contraction was partly due to the impact of intermittent sanction risks and oil price volatility that caused the ruble to slide further in the second half of the year (by 5% against the US dollar, and by 13% against the euro). This slide, combined with price spikes for some food items against the backdrop of a mediocre harvest, pushed up CPI inflation to 5.8% in March 2021, substantially surpassing the CBR’s target of 4.0%. In response to the price pressures, President Putin initiated some selective food price controls and grain export quotas from early to mid-2021. After having kept its key rate unchanged at a record low of 4.25% since mid-2020, the CBR raised the rate to 4.5% in March 2021. The CBR pointed to continued elevated inflation expectations, swifter than expected domestic eco-nomic recovery tendencies that are running up against some labor market rigidities, as well as to lingering geopolitical uncertainties that put pressure on the exchange rate.
The federal budget deficit reached about 3.8% of GDP in 2020. As a fiscal crisis response, while federal revenues shrank by 12% in real terms, federal expendi-tures expanded by 19%. A large part of this expansion is accounted for by targeted health and social spending as well as by subsidies to enterprises. While the vulnerable services sector is relatively small in Russia, the network of large state-owned firms was successfully supported. Moreover, tax deferrals and benefits have played an important role. The budget shortfall is largely being financed by placement of domestic debt. The National Welfare Fund (NWF) was not tapped into.
The much lower prices and quantities of oil and gas exports drove down Russia’s current account surplus to 2.3% of GDP in 2020. Meanwhile, private net capital outflows more than doubled to USD 47.8 billion in 2020, largely due to stepped-up deleveraging by banks and corporations. While Russia’s gross foreign debt conse-quently declined to EUR 389 billion (30.1% of GDP) at end-2020, the country’s much larger international reserves (including gold) also declined somewhat to EUR 486 billion at end-2020. Russia’s international reserves are now the fourth-largest in the world, following those of China, Japan, and Switzerland.
The coronavirus crisis and temporary regulatory forbearance are reflected in a still relatively high, but not increasing NPL ratio. In the course of 2020, loans to enterprises continued to grow at around 7%, while retail lending was stronger but losing momentum, partly due to CBR regulatory restrictions against unsecured consumer credit. As of late 2020, about 12% of total loans had been restructured.
Table 11
Main economic indicators: Russia
2018 2019 2020 Q3 19 Q4 19 Q1 20 Q2 20 Q3 20 Q4 20
Year-on-year change of the period total in %GDP at constant prices 2.8 2.0 –3.0 2.6 2.9 1.4 –7.8 –3.5 –1.8Private consumption 4.2 3.1 –8.5 3.2 3.2 2.2 –21.5 –9.0 –5.7Public consumption 1.3 2.4 4.0 2.5 2.4 3.6 4.1 4.2 4.1Gross fixed capital formation 0.6 1.5 –4.3 –0.9 3.4 –0.5 –6.7 –7.9 –2.1Exports of goods and services 5.6 0.7 –4.3 2.0 0.1 –2.4 0.1 –8.1 –6.5Imports of goods and services 2.7 3.4 –12.0 4.6 10.0 1.8 –22.6 –19.9 –5.5
Contribution to GDP growth in percentage pointsDomestic demand 2.1 2.9 –4.5 3.4 5.3 2.6 –13.4 –6.1 –0.9Net exports of goods and services 0.8 –0.6 1.7 –0.6 –2.2 –1.1 5.5 2.9 –0.3Exports of goods and services 1.5 0.2 –1.2 0.5 0.0 –0.7 0.0 –2.1 –1.7Imports of goods and services –0.6 –0.8 2.9 –1.1 –2.3 –0.4 5.5 5.0 1.3
Year-on-year change of period average in %Unit labor costs in the whole economy (nominal, per person) .. .. .. .. .. .. .. .. ..Unit labor costs in manufacturing (nominal, per hour) 1.8 3.9 8.3 3.7 4.9 5.9 11.1 9.3 6.5
Labor productivity in manufacturing (real, per hour) 4.8 3.7 –2.0 4.1 2.9 1.9 –6.2 –3.4 –0.6Labor costs in manufacturing (nominal, per hour) 6.6 7.8 5.9 8.0 8.0 8.0 4.1 5.6 6.2
Producer price index (PPI) in industry 12.1 2.3 –3.7 –1.0 –5.7 –2.4 –12.1 –1.9 1.6Consumer price index (here: HICP) 3.0 4.6 3.4 4.4 3.5 2.5 3.2 3.6 4.5EUR per 1 RUB, + = RUB appreciation –11.0 2.2 –12.3 6.2 7.7 1.6 –8.9 –16.8 –22.4
Period average levelsUnemployment rate (ILO definition, %, 15–64 years) 4.8 4.6 5.8 4.4 4.6 4.7 6.0 6.3 6.1Employment rate (%, 15–64 years) .. .. .. .. .. .. .. .. ..Key interest rate per annum (%) 7.4 7.3 5.0 7.3 6.6 6.1 5.5 4.3 4.3RUB per 1 EUR 74.1 72.5 82.6 71.8 70.5 73.7 79.7 86.3 90.9
Nominal year-on-year change in period-end stock in %Loans to the domestic nonbank private sector1 10.7 10.6 10.6 10.6 10.6 10.1 8.9 9.9 9.6
of which: loans to households 21.8 19.0 19.0 21.1 19.0 16.8 12.0 12.9 12.9loans to nonbank corporations 6.6 7.1 7.1 6.4 7.1 7.1 7.5 8.5 8.0
%
Share of foreign currency loans in total loans to the non-bank private sector 14.6 11.8 12.6 12.3 11.8 13.5 12.4 13.3 12.6Return on assets (banking sector) 1.5 2.2 1.9 2.1 2.2 2.4 1.6 1.8 1.9Tier 1 capital ratio (banking sector) 8.9 9.2 9.7 9.4 9.2 10.1 10.6 10.5 9.7NPL ratio (banking sector) 18.0 17.1 17.1 17.7 17.1 16.9 17.4 17.1 17.1
% of GDPGeneral government revenues 35.9 36.2 35.4 .. .. .. .. .. ..General government expenditures 33.0 34.2 39.4 .. .. .. .. .. ..General government balance 2.9 1.9 –4.0 .. .. .. .. .. ..Primary balance .. .. .. .. .. .. .. .. ..Gross public debt 12.1 12.4 17.8 .. .. .. .. .. ..
% of GDPDebt of nonfinancial corporations (nonconsolidated) .. .. .. .. .. .. .. .. ..Debt of households and NPISHs2 (nonconsolidated) .. .. .. .. .. .. .. .. ..
% of GDP (based on EUR), period totalGoods balance 11.8 9.8 6.2 8.7 8.7 8.9 5.0 4.9 5.9Services balance –1.8 –2.2 –1.2 –2.7 –2.1 –1.8 –0.6 –1.0 –1.3Primary income –2.4 –3.2 –2.3 –3.2 –3.2 –0.6 –3.6 –2.6 –2.8Secondary income –0.5 –0.6 –0.4 –0.4 –1.0 –0.3 –0.4 –0.4 –0.3Current account balance 7.0 3.8 2.3 2.4 2.3 6.2 0.4 0.9 1.5Capital account balance –0.1 0.0 0.0 0.0 –0.1 0.0 –0.1 0.0 –0.1Foreign direct investment (net)3 1.4 –0.6 –0.2 –1.6 –0.1 1.2 –0.5 –1.4 –0.2
% of GDP (rolling four-quarter GDP, based on EUR), end of periodGross external debt 28.4 29.5 30.1 30.0 29.5 27.9 30.4 29.3 30.1Gross official reserves (excluding gold) 23.8 26.2 28.8 26.4 26.2 26.7 27.0 27.6 28.8
Months of imports of goods and servicesGross official reserves (excluding gold) 13.7 15.0 16.8 15.3 15.0 15.2 15.6 16.2 16.8
EUR million, period totalGDP at current prices 1,399,811 1,510,646 1,293,140 393,148 423,479 335,903 297,025 319,507 340,705
Source: Bloomberg, European Commission, Eurostat, national statistical offices, national central banks, wiiw, OeNB.1 Foreign currency component at constant exchange rates.2 Nonprofit institutions serving households.3 + = net accumulation of assets larger than net accumulation of liabilities (net outflow of capital). – = net accumulation of assets smaller than net accumulation of liabilities (net inf low of capital).

Developments in selected CESEE countries
FOCUS ON EUROPEAN ECONOMIC INTEGRATION Q2/21 43
11 Russia: relatively mild recession in 2020 because of small services sector, limited restrictive measures and well-targeted fiscal stimulus
Russia’s coronavirus-triggered recession softened in the third and fourth quarters, resulting in a relatively mild annual GDP contraction of 3% in 2020. The rather strict lockdown of spring 2020, followed by reopening measures in the summer, which were replaced by new but much milder restrictions in the fall and winter, may explain part of the overall contraction and growth variations over the year. Accordingly, swiftly shrinking private consumption was the driving force of the economic contraction. Fixed investment also decreased markedly, while inventories grew somewhat. Other recessionary factors included the sharp drop of the oil price (–34% on average in 2020 against 2019) and the OPEC+ production ceiling agreement in force from May 2020 onward. Contrary to the past, government consumption expanded and boosted growth. Exports – supported by still expanding Chinese demand – declined less than expected, while imports contracted sharply.
Import contraction was partly due to the impact of intermittent sanction risks and oil price volatility that caused the ruble to slide further in the second half of the year (by 5% against the US dollar, and by 13% against the euro). This slide, combined with price spikes for some food items against the backdrop of a mediocre harvest, pushed up CPI inflation to 5.8% in March 2021, substantially surpassing the CBR’s target of 4.0%. In response to the price pressures, President Putin initiated some selective food price controls and grain export quotas from early to mid-2021. After having kept its key rate unchanged at a record low of 4.25% since mid-2020, the CBR raised the rate to 4.5% in March 2021. The CBR pointed to continued elevated inflation expectations, swifter than expected domestic eco-nomic recovery tendencies that are running up against some labor market rigidities, as well as to lingering geopolitical uncertainties that put pressure on the exchange rate.
The federal budget deficit reached about 3.8% of GDP in 2020. As a fiscal crisis response, while federal revenues shrank by 12% in real terms, federal expendi-tures expanded by 19%. A large part of this expansion is accounted for by targeted health and social spending as well as by subsidies to enterprises. While the vulnerable services sector is relatively small in Russia, the network of large state-owned firms was successfully supported. Moreover, tax deferrals and benefits have played an important role. The budget shortfall is largely being financed by placement of domestic debt. The National Welfare Fund (NWF) was not tapped into.
The much lower prices and quantities of oil and gas exports drove down Russia’s current account surplus to 2.3% of GDP in 2020. Meanwhile, private net capital outflows more than doubled to USD 47.8 billion in 2020, largely due to stepped-up deleveraging by banks and corporations. While Russia’s gross foreign debt conse-quently declined to EUR 389 billion (30.1% of GDP) at end-2020, the country’s much larger international reserves (including gold) also declined somewhat to EUR 486 billion at end-2020. Russia’s international reserves are now the fourth-largest in the world, following those of China, Japan, and Switzerland.
The coronavirus crisis and temporary regulatory forbearance are reflected in a still relatively high, but not increasing NPL ratio. In the course of 2020, loans to enterprises continued to grow at around 7%, while retail lending was stronger but losing momentum, partly due to CBR regulatory restrictions against unsecured consumer credit. As of late 2020, about 12% of total loans had been restructured.
Table 11
Main economic indicators: Russia
2018 2019 2020 Q3 19 Q4 19 Q1 20 Q2 20 Q3 20 Q4 20
Year-on-year change of the period total in %GDP at constant prices 2.8 2.0 –3.0 2.6 2.9 1.4 –7.8 –3.5 –1.8Private consumption 4.2 3.1 –8.5 3.2 3.2 2.2 –21.5 –9.0 –5.7Public consumption 1.3 2.4 4.0 2.5 2.4 3.6 4.1 4.2 4.1Gross fixed capital formation 0.6 1.5 –4.3 –0.9 3.4 –0.5 –6.7 –7.9 –2.1Exports of goods and services 5.6 0.7 –4.3 2.0 0.1 –2.4 0.1 –8.1 –6.5Imports of goods and services 2.7 3.4 –12.0 4.6 10.0 1.8 –22.6 –19.9 –5.5
Contribution to GDP growth in percentage pointsDomestic demand 2.1 2.9 –4.5 3.4 5.3 2.6 –13.4 –6.1 –0.9Net exports of goods and services 0.8 –0.6 1.7 –0.6 –2.2 –1.1 5.5 2.9 –0.3Exports of goods and services 1.5 0.2 –1.2 0.5 0.0 –0.7 0.0 –2.1 –1.7Imports of goods and services –0.6 –0.8 2.9 –1.1 –2.3 –0.4 5.5 5.0 1.3
Year-on-year change of period average in %Unit labor costs in the whole economy (nominal, per person) .. .. .. .. .. .. .. .. ..Unit labor costs in manufacturing (nominal, per hour) 1.8 3.9 8.3 3.7 4.9 5.9 11.1 9.3 6.5
Labor productivity in manufacturing (real, per hour) 4.8 3.7 –2.0 4.1 2.9 1.9 –6.2 –3.4 –0.6Labor costs in manufacturing (nominal, per hour) 6.6 7.8 5.9 8.0 8.0 8.0 4.1 5.6 6.2
Producer price index (PPI) in industry 12.1 2.3 –3.7 –1.0 –5.7 –2.4 –12.1 –1.9 1.6Consumer price index (here: HICP) 3.0 4.6 3.4 4.4 3.5 2.5 3.2 3.6 4.5EUR per 1 RUB, + = RUB appreciation –11.0 2.2 –12.3 6.2 7.7 1.6 –8.9 –16.8 –22.4
Period average levelsUnemployment rate (ILO definition, %, 15–64 years) 4.8 4.6 5.8 4.4 4.6 4.7 6.0 6.3 6.1Employment rate (%, 15–64 years) .. .. .. .. .. .. .. .. ..Key interest rate per annum (%) 7.4 7.3 5.0 7.3 6.6 6.1 5.5 4.3 4.3RUB per 1 EUR 74.1 72.5 82.6 71.8 70.5 73.7 79.7 86.3 90.9
Nominal year-on-year change in period-end stock in %Loans to the domestic nonbank private sector1 10.7 10.6 10.6 10.6 10.6 10.1 8.9 9.9 9.6
of which: loans to households 21.8 19.0 19.0 21.1 19.0 16.8 12.0 12.9 12.9loans to nonbank corporations 6.6 7.1 7.1 6.4 7.1 7.1 7.5 8.5 8.0
%
Share of foreign currency loans in total loans to the non-bank private sector 14.6 11.8 12.6 12.3 11.8 13.5 12.4 13.3 12.6Return on assets (banking sector) 1.5 2.2 1.9 2.1 2.2 2.4 1.6 1.8 1.9Tier 1 capital ratio (banking sector) 8.9 9.2 9.7 9.4 9.2 10.1 10.6 10.5 9.7NPL ratio (banking sector) 18.0 17.1 17.1 17.7 17.1 16.9 17.4 17.1 17.1
% of GDPGeneral government revenues 35.9 36.2 35.4 .. .. .. .. .. ..General government expenditures 33.0 34.2 39.4 .. .. .. .. .. ..General government balance 2.9 1.9 –4.0 .. .. .. .. .. ..Primary balance .. .. .. .. .. .. .. .. ..Gross public debt 12.1 12.4 17.8 .. .. .. .. .. ..
% of GDPDebt of nonfinancial corporations (nonconsolidated) .. .. .. .. .. .. .. .. ..Debt of households and NPISHs2 (nonconsolidated) .. .. .. .. .. .. .. .. ..
% of GDP (based on EUR), period totalGoods balance 11.8 9.8 6.2 8.7 8.7 8.9 5.0 4.9 5.9Services balance –1.8 –2.2 –1.2 –2.7 –2.1 –1.8 –0.6 –1.0 –1.3Primary income –2.4 –3.2 –2.3 –3.2 –3.2 –0.6 –3.6 –2.6 –2.8Secondary income –0.5 –0.6 –0.4 –0.4 –1.0 –0.3 –0.4 –0.4 –0.3Current account balance 7.0 3.8 2.3 2.4 2.3 6.2 0.4 0.9 1.5Capital account balance –0.1 0.0 0.0 0.0 –0.1 0.0 –0.1 0.0 –0.1Foreign direct investment (net)3 1.4 –0.6 –0.2 –1.6 –0.1 1.2 –0.5 –1.4 –0.2
% of GDP (rolling four-quarter GDP, based on EUR), end of periodGross external debt 28.4 29.5 30.1 30.0 29.5 27.9 30.4 29.3 30.1Gross official reserves (excluding gold) 23.8 26.2 28.8 26.4 26.2 26.7 27.0 27.6 28.8
Months of imports of goods and servicesGross official reserves (excluding gold) 13.7 15.0 16.8 15.3 15.0 15.2 15.6 16.2 16.8
EUR million, period totalGDP at current prices 1,399,811 1,510,646 1,293,140 393,148 423,479 335,903 297,025 319,507 340,705
Source: Bloomberg, European Commission, Eurostat, national statistical offices, national central banks, wiiw, OeNB.1 Foreign currency component at constant exchange rates.2 Nonprofit institutions serving households.3 + = net accumulation of assets larger than net accumulation of liabilities (net outflow of capital). – = net accumulation of assets smaller than net accumulation of liabilities (net inf low of capital).