Development Strategy Monitoring report · Auckland Plan, Strategy and Research Department Auckland...
24
Development Strategy Monitoring report October 2019
Transcript of Development Strategy Monitoring report · Auckland Plan, Strategy and Research Department Auckland...

Development Strategy Monitoring report
October 2019
CONTENTS
Executive summary .......................................................... 4Development strategy progress .................................... 6Growth and development .............................................. 12Existing urban area .......................................................... 13Nodes ................................................................................ 14Development areas .......................................................... 15Remaining existing urban area ...................................... 18Future urban areas ........................................................... 19Rural areas ........................................................................ 20Business .............................................................................. 22
© 2019 Auckland CouncilOctober 2019Auckland Plan, Strategy and Research DepartmentAuckland Council (2019). Auckland Plan 2050 Development Strategy Monitoring Report 2019ISBN 978-1-98-856420-3 (Print)ISBN 978-1-98-856421-0 (PDF)Please note that the Auckland Plan 2050 is a digital plan and may be updated from time to time. Please refer to theAuckland Plan website, www.aucklandplan.govt.nz for the most up to date version of the full plan and reporting.
DEVELOPMENT STRATEGY MONITORING REPORT
2

3

EXECUTIVE SUMMARYThis is the first monitoring report on the Auckland Plan 2050 Development Strategy. This report monitors building consents issued for residential dwellings across Auckland, as well as business floor space and covers the period 1 July 2018 to 30 June 2019.
As this is the first monitoring report, and the Development Strategy covers a 30-year timeframe, it is too early to definitively indicate if we are achieving our quality compact approach to growth and development.
The Development Strategy sets out how Auckland will grow and change over the next 30 years to become a place that Aucklanders love and are proud of. Auckland has taken a quality compact approach to growth and development. This approach means future development will be focused in the existing urban area and in future urban areas within Auckland’s urban footprint. Expansion into rural areas will be limited.
Much of growth in the existing urban area will be focused within Nodes and Development Areas.
The existing urban area is the area of Auckland with live urban zoning at 2017, including the rural towns (and excluding live zoned future urban areas).
Nodes are major growth areas critical to accommodating development across Auckland. These areas are based around a significant centre and service large catchments. They encompass surrounding employment and high-density residential areas.
Development Areas are urban areas where significant growth is expected in jobs and housing over the next 30 years. These areas were identified based on factors such as ability to accommodate growth and committed projects. Planning and investment will be targeted when growth at scale occurs.
The Remaining existing urban area includes the rest of the existing urban area not included in a Node or Development Area.
Auckland is changing: we’re now moving up instead of just out: The number and location of dwelling consents issued in 2018/2019 broadly follows the implementation of the quality compact approach, and the multi-nodal model, in the Development Strategy. The desire for a quality, compact future Auckland is becoming reality as illustrated by the record dwelling consents for more intensive housing including apartments, townhouses, flats and units.
4
DEVELOPMENT STRATEGY MONITORING REPORT

Some key findings from this monitoring report are:
• 66,839 dwellings were consented in Auckland between 2012/2013 and 2018/2019
• 14,032 new dwellings were consented in 2018/2019.
• 83 per cent were issued in the existing urban area
• 8 per cent were issued in Nodes in the 2018/2019 financial year (some Nodes include areas outside the existing urban area)
• 30 per cent were issued in Development Areas
• 46 per cent were issued in the remaining existing urban area
• 10 per cent were issued in the future urban area
• 7 per cent were issued in the rural area
• The number of consents issued for apartments and townhouses etc. are increasing at a faster rate than consents for standalone houses.
• Around 76 per cent of consents issued in Nodes, and 68 per cent in Development Areas, were for apartments or townhouses etc.
• Over 70 per cent of Code Compliance Certificates were issued for dwellings in the existing urban area. This means dwellings were ready to be occupied.
• Nearly 900,000 square metres (sqm) of business floor space was consented in 2018/2019.
• Business floor space consented in heavy industry, light industry and the City Centre zones made up 58 per cent of all floor space consented
• Business floor space consented in the City Centre and Manukau Nodes made up 84 per cent of all floor space consented in Nodes.
As this is the first monitoring report for the 30-year strategy, future monitoring and reporting will provide a more comprehensive understanding of ongoing trends and successful implementation of the Development Strategy.
5
EXECUTIVE SUMMARY

DEVELOPMENT STRATEGY PROGRESS
Consented dwellings The Development Strategy anticipates that up to 320,000 additional residential dwellings could be required over the next 30 years. This equates to over 10,000 dwellings a year. Dwelling consents represent an intention to build, not a completed dwelling.
In the first year of implementing the Development Strategy, 14,032 new residential dwellings were consented in Auckland. This is almost 1,700 more than the previous year and more than the 2012/2013 and 2013/14 years, combined. Around 61 per cent more dwelling consented were issued in 2018/2019 compared to 2012/2013.
New dwellings consented in the Auckland Region, by reporting year (1 July-30 June)
Reporting Year Dwellings Consented2012/2013 5,5012013/2014 7,0782014/2015 8,3652015/2016 9,3732016/2017 10,1212017/2018 12,3692018/2019 14,032Total 66,839
Quality Compact approachAuckland is taking a quality compact approach to growth and development. This means most growth will take place within the existing urban area; some growth will occur in identified future urban areas and limited growth will take place in rural areas.
In 2018/19, the number of dwelling consents issued across Auckland indicates that growth is following the quality compact approach. Most growth is taking place in the existing urban area, some growth is occurring in identified future urban areas, and growth in rural areas has been limited.
DEVELOPMENT STRATEGY MONITORING REPORT
6

Local Boards The highest number of dwelling consents issued were within the Papakura, Upper Harbour and Maungakiekie-Tāmaki local boards. The least number of dwelling consents were issued within the Great Barrier and Waiheke local boards.
With the exception of Waitemata, Hibiscus and Bays and Waiheke, all local boards had a higher number of dwelling consents issued in 2018/2019 than the average number of dwellings consented each year, over the last seven years.
Local Board Area Average no. of Dwellings Consented per annum (2012–2018)
Dwellings Consented 2018/2019
Papakura 567 1,368Upper Harbour 983 1,298Maungakiekie - Tāmaki 391 1,043Hibiscus and Bays 1082 986Henderson - Massey 396 846Rodney 749 839Albert - Eden 318 834Howick 573 783Franklin 590 774Waitematā 875 641Māngere - Ōtāhuhu 199 639Whau 316 635Manurewa 276 615Ōrākei 379 581Kaipātiki 247 454Devonport - Takapuna 189 439Ōtara - Papatoetoe 247 432Waitākere Ranges 150 410Puketāpapa 212 355Waiheke 58 54Great Barrier 5 6Total 14,032
7
HAVE YOUR SAY ON THE AUCKLAND PLAN
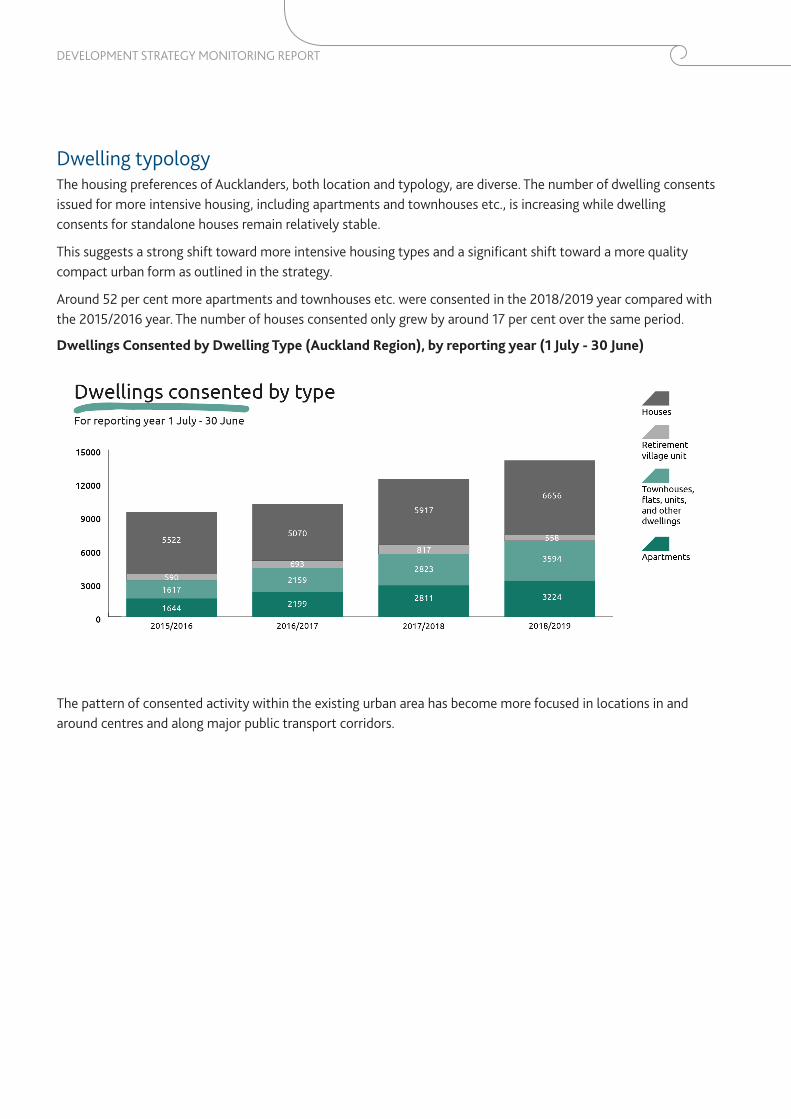
Dwelling typology The housing preferences of Aucklanders, both location and typology, are diverse. The number of dwelling consents issued for more intensive housing, including apartments and townhouses etc., is increasing while dwelling consents for standalone houses remain relatively stable.
This suggests a strong shift toward more intensive housing types and a significant shift toward a more quality compact urban form as outlined in the strategy.
Around 52 per cent more apartments and townhouses etc. were consented in the 2018/2019 year compared with the 2015/2016 year. The number of houses consented only grew by around 17 per cent over the same period.
Dwellings Consented by Dwelling Type (Auckland Region), by reporting year (1 July - 30 June)
The pattern of consented activity within the existing urban area has become more focused in locations in and around centres and along major public transport corridors.
´
Scale @ A41:275,000
Date Printed:17/09/2019
0 1,300 2,600 3,900
Meters
=
DISCLAIMER:This map/plan is illustrative only and all informationshould be independently verified on site before takingany action. Copyright Auckland Council. Land ParcelBoundary information from LINZ (Crown CopyrightReserved). Whilst due care has been taken, AucklandCouncil gives no warranty as to the accuracy and plancompleteness of any information on this map/plan andaccepts no liability for any error, omission or use of theinformation. Height datum: Auckland 1946.
Auckland Council Map
Document Path: \\aklc.govt.nz\Shared\CPO\ASR\Research Investigations and Monitoring\Land Use Research\Projects\Strategic Framework\3_Workspaces\APMonitoring_BCs_FY2018_2019_A4.mxd
Residential building consentsissued in FY 2018/2019
Pukekohe
Warkworth
´
BuildingconsentsissuedApartments
1-5
6-20
21-60
61-100
100+
Townhous...flats, units,and otherdwellings
1-5
6-20
21-60
61-100
100+
Houses1-5
6-20
21-60
61-100
100+
Retirementvillages
1-5
6-20
21-60
61-100
100+
Rural Urban Boundary (RUB)
Urban Area 2016
2010 Metropolitan Urban Limit
DEVELOPMENT STRATEGY MONITORING REPORT
8

Dwellings Consented by type and size of consent (number of dwellings), Auckland urban area, 1 July 2018 - 30 June 2019
´
Scale @ A41:275,000
Date Printed:17/09/2019
0 1,300 2,600 3,900
Meters
=
DISCLAIMER:This map/plan is illustrative only and all informationshould be independently verified on site before takingany action. Copyright Auckland Council. Land ParcelBoundary information from LINZ (Crown CopyrightReserved). Whilst due care has been taken, AucklandCouncil gives no warranty as to the accuracy and plancompleteness of any information on this map/plan andaccepts no liability for any error, omission or use of theinformation. Height datum: Auckland 1946.
Auckland Council Map
Document Path: \\aklc.govt.nz\Shared\CPO\ASR\Research Investigations and Monitoring\Land Use Research\Projects\Strategic Framework\3_Workspaces\APMonitoring_BCs_FY2018_2019_A4.mxd
Residential building consentsissued in FY 2018/2019
Pukekohe
Warkworth
´
BuildingconsentsissuedApartments
1-5
6-20
21-60
61-100
100+
Townhous...flats, units,and otherdwellings
1-5
6-20
21-60
61-100
100+
Houses1-5
6-20
21-60
61-100
100+
Retirementvillages
1-5
6-20
21-60
61-100
100+
Rural Urban Boundary (RUB)
Urban Area 2016
2010 Metropolitan Urban Limit
9
DWELLING TYPOLOGY

Local Boards The dwelling types being consented vary considerably across all local boards. Over 70 per cent of dwelling consents issued in Waitematā, Albert-Eden and Maungakiekie-Tāmaki local boards were for more intensive housing including apartments or townhouses etc. More than 80 per cent of dwelling consents issued in Howick, Franklin, Rodney, Waiheke and Great Barrier local boards were for houses.
Dwellings consented by dwelling type, by Local Board, 1 July 2018 - 30 June 2019
Residential supply (Code Compliance Certificates - CCCs)
What are CCCs?Dwelling consents represent an intention to build, not a completed dwelling, a code compliance certificate is issued for completed dwellings. The time between a building consent being issued and a code compliance certificate being issued will vary depending on scale and complexity of the building.
10
DEVELOPMENT STRATEGY MONITORING REPORT

A code compliance certificate is issued under section 95 of the Building Act 2004, that building work carried out under a building consent complies with that building consent. There is no mandatory requirement to obtain a CCC, however, insurers, mortgage lenders and other parties are becoming stricter on those undertaking building work to ensure they obtain a CCC. Buildings are deemed suitable to occupy once a CCC is issued.
In the first year of the Development Strategy, 10,080 dwellings were issued with a CCC. The vast majority were issued in the urban area. The proportion of dwellings issued with a CCC in the urban area and future urban areas supports the quality compact approach.
Dwellings completed by urban/future urban/rural, 1 July 2018 – 30 June 2019
Local Boards Upper Harbour and Hibiscus and Bays local boards had the highest number of CCCs issued in 2018/2019. The least number of CCCs were issued in Great Barrier and Waiheke local boards. Overall, the local boards on the fringe of the region had a higher number of CCCs issued relative to more central local boards. Some of these dwellings may have been consented prior to the adoption of the Development Strategy. Therefore, it is too soon to understand if the location of CCCs supports the implementation of the Development Strategy.
New dwellings completed by local board area, 1 July 2018 - 30 June 2019
11
COMPLETED DWELLINGS

Growth and development The Development Strategy identifies where significant growth and development is anticipated to occur over the next 30 years. The quality compact approach and multi-nodal model forms the foundation for growth across Auckland. Most growth is anticipated within the existing urban area, some growth occurs in future urban areas, and growth in rural areas is limited. The following sections report on the number of dwellings consented in the:
• Existing urban areas
o Nodes
o Development areas
o Remaining existing urban area
• Future urban areas
• Rural areas
• Business
12
DEVELOPMENT STRATEGY MONITORING REPORT

Existing urban area Incremental growth will happen across all of Auckland over the next 30 years with most growth focused in the existing urban area. However, some areas are likely to experience significantly more growth than other areas, specifically in Nodes and Development Areas.
Highlights in the existing urban area are:
• 11,587 dwelling consents were issued in the existing urban area in the 2018/2019 financial year.
• Papakura, Maungakiekie-Tamaki and Hibiscus and Bays local boards had the highest number of dwelling consents issued.
• Houses were the most common dwelling type consented however apartments and townhouses etc. collectively made up 54 per cent of consents issued.
Local Boards The number of dwellings consented in the existing urban area within each local board varied greatly across the region. The highest number of consents were issued in the Papakura local board followed by Maungakiekie-Tamaki, Hibiscus and Bays and Albert-Eden. Rodney and Franklin had the least amount of consents issued. This is not unexpected as both local boards are predominantly rural, and both contain future urban land. Waiheke and Great Barrier did not feature as they are not part of the existing urban area.
Total dwellings consents issued by local board can be found in the Development Strategy progress section.
Dwellings consented in the existing urban area, by local board, 1 July 2018 – 30 June 2019
Dwelling typologyCollectively more intensive housing such as townhouses etc. and apartments made up 54 per cent of consented dwellings in the existing urban area. This shows a slight preference for higher density development compared to historical, lower density development. This is contributing to the implementation of the quality compact approach in the Development Strategy.
13
EXISTING URBAN AREA

Nodes Nodes are Auckland’s major growth areas and include the City Centre, Manukau, Westgate and Albany. Together, they form the multi-nodal model Auckland is moving toward. Over time, nodes will offer a broad range of business and employment activity, civic services, efficient transport links and residential options. A description of each node can be found in the What will Auckland look like in the future? section in the Development Strategy.
Highlights in the nodes this year:
• 1,164 dwellings consents were issued in Nodes in the 2018/2019 financial year.
• the Albany and City Centre Nodes had the most dwelling consents issued.
• collectively, apartments and townhouses etc. made up 76 per cent of all dwelling consents issued in Nodes.
Dwelling typologyCollectively, more intensive housing such as apartments and townhouses etc. made up 76 per cent of dwelling consents issued in nodes compared to 24 per cent for houses. This shows a preference for higher density development in these locations, which follows the quality compact approach and is a key attribute of the multi-nodal model outlined in the Development Strategy.
Dwellings consented by type, Nodes, 1 July 2018 – 30 June 2019
14
DEVELOPMENT STRATEGY MONITORING REPORT

Development areas Development Areas are a comprehensive approach to servicing anticipated growth across the existing urban area. They are specific locations where a significant amount of housing and business growth is anticipated over the next 30 years and are sequenced based on when this growth is likely to occur. They are generally sequenced in either Years 1-3, Years 4-10 or Years 11-30 .
Detailed information on Development Areas can be found in the Change in the existing urban area section on the Development Strategy.
Highlights in the Development Areas are:
• 4,236 dwelling consents have been issued in Development Areas.
• Development Areas in Maungakiekie-Tamaki, Mangere-Otahuhu and Whau local boards were issued the highest number of consents.
• Dwelling consents have been issued in all Development Areas, across all three sequencing periods.
• 68 per cent of dwelling consents issued were for apartments or townhouses etc.
Development Areas breakdownDwelling consents were issued in all Development Areas, across all sequencing years. That is dwelling consents were issued in some Development Areas where growth of this scale was not yet anticipated. For example, some Development Areas sequenced in later periods were issued more consents than Development Areas sequenced in years 1-3. Some dwellings consented may be part of larger developments that were underway prior to the adoption of the Development Strategy.
The highest number of dwelling consents were issued in the Development Areas sequenced in Years 1-3. However, significant numbers are also being issued in areas sequenced in Years 4-10 and Years 11-30. This indicates that some Development Areas are experiencing development activity sooner than when the Development Strategy anticipated.
15
DEVELOPMENT AREAS

Development Area Development Strategy Sequencing Number of Dwellings Consented, 1 July 2018 – 30 June 2019Years 1-3 Years 4-10 Years 11-30
Otahuhu 316Glen Innes 276Onehunga 239Avondale 195Dominion Road 136New Lynn 124Panmure 100Takapuna 63Northcote 30Tāmaki 28Māngere 167Mt Roskill-Three Kings 292Glen Eden 255Papatoetoe 200Newton 198Manurewa 168Sylvia Park 127Māngere East 97Henderson 93Te Atatū Peninsula 92St Lukes 70Pakuranga 62Mt Albert 24Morningside 16Papakura 217Birkenhead 108Clendon 106Pakuranga Highway 89Fruitvale 80Sunnynook 60Highland Park 44Otara 41Glendene 33Greenlane 29Te Atatū South 29Ellerslie 16Sunnyvale 16Total 4236
16
DEVELOPMENT STRATEGY MONITORING REPORT

Dwelling typology Collectively, more intensive housing such as apartments and townhouses etc. made up 68 per cent of dwellings consented in Development Areas, compared to 30 per cent for houses. This shows a preference for higher density development which follows the Quality Compact approach in the Development Strategy.
Dwellings consented in Development Areas , by dwelling type, 1 July 2018 – 30 June 2019
17
DEVELOPMENT AREAS

Remaining existing urban area While much of Auckland’s growth will occur in the Nodes and Development Areas, some growth will take place in the remaining existing urban area. Specifically, Auckland’s network of centres and strategic transport corridors play an essential role in accommodating both population and employment growth.
The remaining existing urban area includes all areas in the existing urban area that are not included in a Node or Development Area.
More detailed information on the remaining existing urban area can be found in the Change in the existing urban area section of the Development Strategy.
Highlights in the remaining existing urban area are:
• 6,448 dwellings were consented in the remaining existing urban area over the past year.
• Papakura and Hibiscus and Bays local boards had the most dwelling consents issued.
• 53 per cent of dwellings consented in the remaining existing urban area were for houses.
Dwelling typologyCollectively, more intensive housing such as apartments and townhouses etc. only made up 41 per cent of dwelling consents issued compared to 53 per cent for houses. This is consistent with the Auckland Unitary Plan zoning in these areas which is predominantly zoned single house or mixed house suburban.
Dwellings consented in the remaining existing urban area, by dwelling type, 1 July 2018 – 30 June 2019
18
DEVELOPMENT STRATEGY MONITORING REPORT

Future urban areasThe Development Strategy and the Future Urban Land Supply Strategy provide a strategic approach, indicating when future urban areas will be development ready with live zoning and bulk infrastructure in place.
Highlights in the future urban areas are:
• 1,434 new dwellings have been consented in the future urban areas in 2018-19, approximately 10 per cent of all dwellings consented.
• Rodney, Upper Harbour and Franklin had the highest number of dwelling consents issued.
• 1,087 dwelling consents were issued in areas sequenced in years 1-3 of the strategy. This shows that some areas have progressed to a point where live zoning and bulk infrastructure are in place and homes are being delivered.
• 72 per cent of new dwellings consented in future urban areas were houses.
Sequencing Number of Dwellings Consented, 2018/2019Years 1 to 3 1087Years 4 to 10 13Years 11 to 30 13Other 321Total 1434
Dwelling TypologyOf dwellings consented in the future urban areas in 2018-19, 72 per cent were standalone houses. Collectively, more intensive housing such as apartments and townhouses etc. made up 23 per cent of dwelling consents issued, which shows a strong preference for houses in future urban locations.
As these areas grow and develop over time, it is anticipated that a mix of dwelling typologies will be delivered. This will be influenced and supported by networks of strong centres and neighbourhoods and integrated with good transport choices.
New dwellings consented in future urban areas, by type, 1 July 2018 – 30 June 2019
19
FUTURE URBAN AREAS
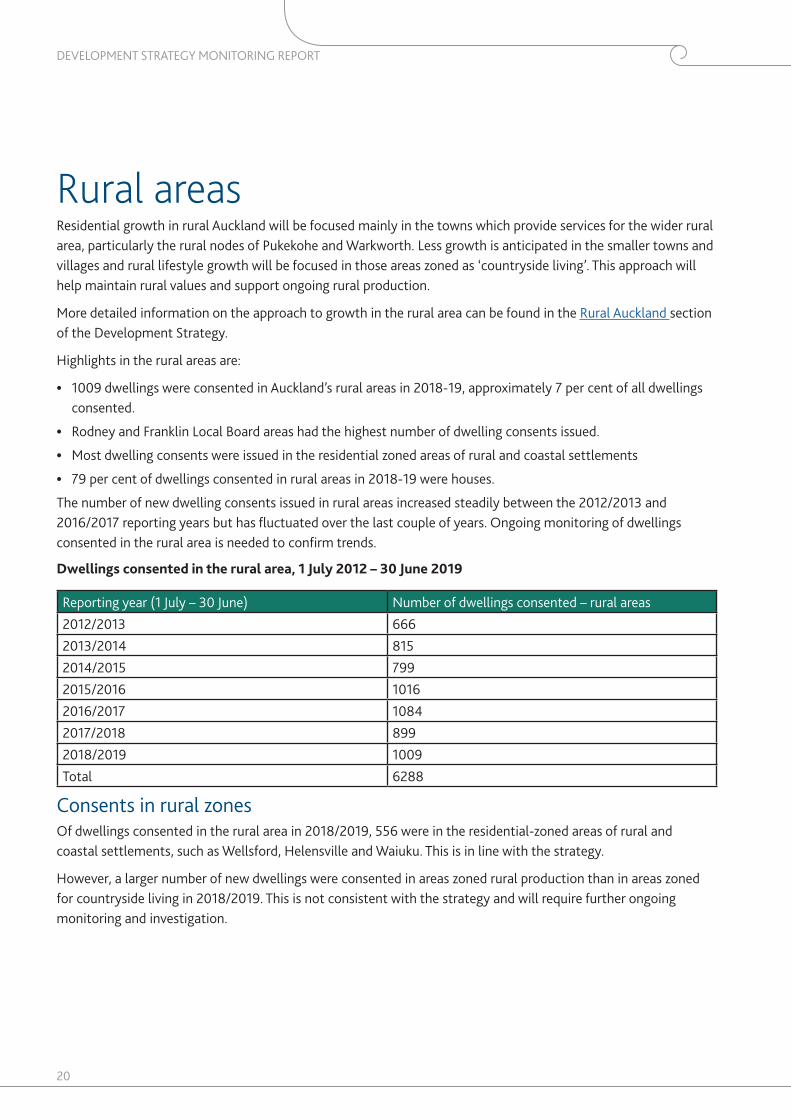
Rural areasResidential growth in rural Auckland will be focused mainly in the towns which provide services for the wider rural area, particularly the rural nodes of Pukekohe and Warkworth. Less growth is anticipated in the smaller towns and villages and rural lifestyle growth will be focused in those areas zoned as ‘countryside living’. This approach will help maintain rural values and support ongoing rural production.
More detailed information on the approach to growth in the rural area can be found in the Rural Auckland section of the Development Strategy.
Highlights in the rural areas are:
• 1009 dwellings were consented in Auckland’s rural areas in 2018-19, approximately 7 per cent of all dwellings consented.
• Rodney and Franklin Local Board areas had the highest number of dwelling consents issued.
• Most dwelling consents were issued in the residential zoned areas of rural and coastal settlements
• 79 per cent of dwellings consented in rural areas in 2018-19 were houses.
The number of new dwelling consents issued in rural areas increased steadily between the 2012/2013 and 2016/2017 reporting years but has fluctuated over the last couple of years. Ongoing monitoring of dwellings consented in the rural area is needed to confirm trends.
Dwellings consented in the rural area, 1 July 2012 – 30 June 2019
Reporting year (1 July – 30 June) Number of dwellings consented – rural areas2012/2013 6662013/2014 8152014/2015 7992015/2016 10162016/2017 10842017/2018 8992018/2019 1009Total 6288
Consents in rural zonesOf dwellings consented in the rural area in 2018/2019, 556 were in the residential-zoned areas of rural and coastal settlements, such as Wellsford, Helensville and Waiuku. This is in line with the strategy.
However, a larger number of new dwellings were consented in areas zoned rural production than in areas zoned for countryside living in 2018/2019. This is not consistent with the strategy and will require further ongoing monitoring and investigation.
20
DEVELOPMENT STRATEGY MONITORING REPORT

Dwellings consented in rural zones, 1 July 2018 – 30 June 2019
Auckland Unitary Plan Zone Dwellings Consented, 2018-19Hauraki Gulf Islands 60Residential Zones 556Rural - Countryside Living Zone 99Rural - Mixed Rural Zone 41Rural - Rural Coastal Zone 59Rural - Rural Production Zone 159Other Zones 35Total 1009
Dwelling Typology 79 per cent of dwellings consented in the rural area in 2018/2019 were houses. Townhouses etc., and a small amount of apartments, made up the remaining 21 per cent of dwelling consents issued. As most rural areas aren’t connected to a wider range of good transport choices, the limited mix of typologies seen is not unexpected.
New dwellings consented in rural areas, by type, 1 July 2018 – 30 June 2019
21
BUSINESS

Business As Auckland grows it must have capacity for business areas by making the best use of existing business land and identifying new business land in greenfield areas. Change in the make-up and distribution of Auckland’s economy will continue over the medium to long term. To accommodate these changes, the Development Strategy encourages creating flexible and adaptable business areas.
Further information on Business areas can be found in the Development Strategy.
Highlights in business land are:
• Nearly 900,000 square metres (sqm) of business floor space was consented in the Auckland region in 2018/2019.
• The light industry, heavy industry and city centre zones had the greatest amount of floor space consented in 2018/2019.
• Mangere-Otahuhu, Waitemata and Howick local boards had the greatest amount of business floor space consented.
• The majority of business floor space was consented in the City Centre and Manukau Nodes.
Around 54 per cent more business floor space was consented in 2018/2019 than in 2012/2013. The amount of business space consented has also increased significantly over the past three years.
Business floor space (sqm) consented, 1 July 2012 – 30 June 2019
Year Business Floor Space (sqm)2012/2013 414,0482013/2014 498,3472014/2015 443,7922015/2016 533,7092016/2017 392,1362017/2018 692,6122018/2019 897,679Total 3,872,323
Business floor space consented by Auckland Unitary Plan zoneNearly 900,000 square metres (sqm) of business floor space was consented in 2018/2019. Most of this was in heavy or light industry zoned areas as well as the City Centre. Business floor space consented in heavy or light industry zones are generally land extensive. This contributes to the considerable differences in business floor space consented compared to other business zones. Residential and rural zones had the least floor space consented. This is appropriate given the nature of these areas.
22
DEVELOPMENT STRATEGY MONITORING REPORT
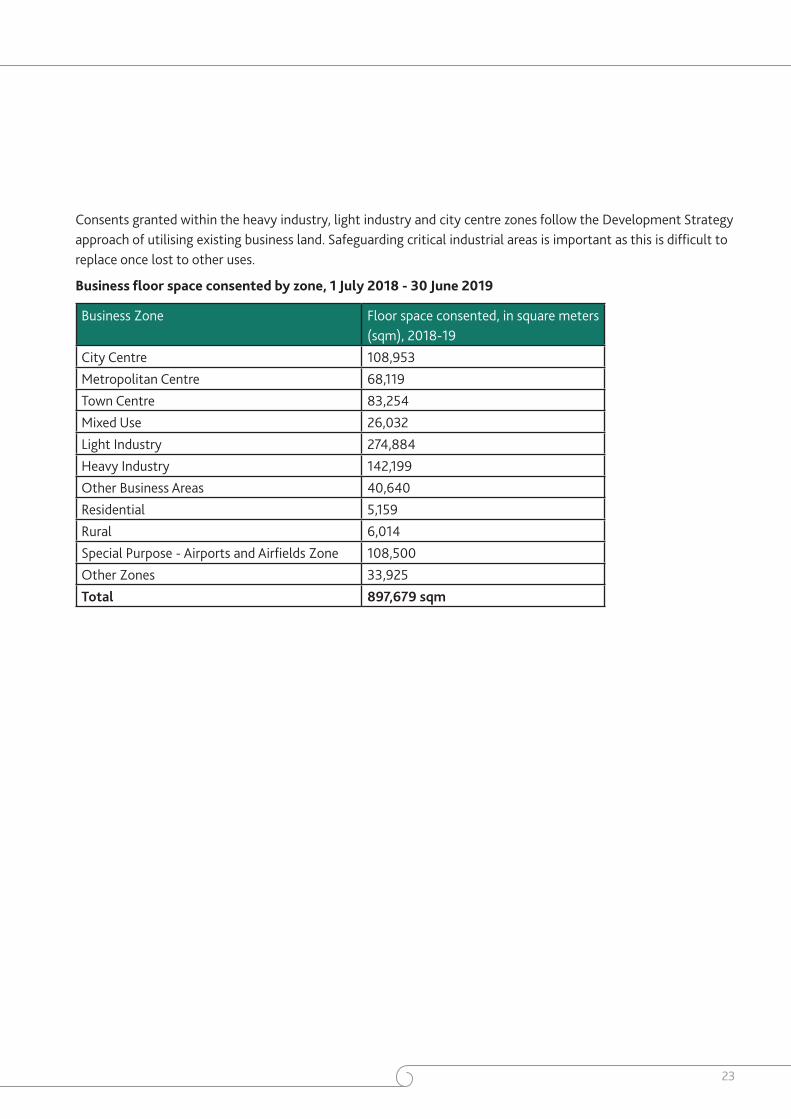
Consents granted within the heavy industry, light industry and city centre zones follow the Development Strategy approach of utilising existing business land. Safeguarding critical industrial areas is important as this is difficult to replace once lost to other uses.
Business floor space consented by zone, 1 July 2018 - 30 June 2019
Business Zone Floor space consented, in square meters (sqm), 2018-19
City Centre 108,953Metropolitan Centre 68,119Town Centre 83,254Mixed Use 26,032Light Industry 274,884Heavy Industry 142,199Other Business Areas 40,640Residential 5,159Rural 6,014Special Purpose - Airports and Airfields Zone 108,500Other Zones 33,925Total 897,679 sqm
23