Development of truck weight limits for concrete bridges ... › pdf › riem › v1n4 ›...
15
Volume 1, Number 4 (December, 2008) p. 421 - 450 • ISSN 1983-4195 Development of truck weight limits for concrete bridges using reliability theory Desenvolvimento de equações para a limitação do peso de veículos de carga em pontes de concreto através da teoria de confiabilidade L. M. FERREIRA a [email protected] A. S. NOWAK b [email protected] M. K. EL DEBS c [email protected] © 2008 IBRACON a Departamento de Engenharia de Estruturas, Escola de Engenharia de São Carlos, Universidade de São Paulo, [email protected], Rua Mateus Grou, 502 – Ap. 123, CEP 05415-040, São Paulo-SP, Brasil; b Department of Civil Engineering, College of Engineering, University of Nebraska-Lincoln, [email protected], W181 NH, Lincoln NE 68588-0531, USA; c Departamento de Engenharia de Estruturas, Escola de Engenharia de São Carlos, Universidade de São Paulo, [email protected], Av. Trabalhador Sãocarlense, 400, CEP 13566-590, São Carlos-SP, Brasil. Abstract Resumo The increase in gross weight limits allowed by Brazilian legislation and the soaring number of new truck configurations on national highways has called for greater attention regarding the structural safety of bridges when submitted to real traffic. This paper verifies the performance of bridges under Sao Paulo Department of Transportation jurisdiction using the reliability index β and obtains truck weight limits in order to guarantee struc- tural integrity. The superstructures of reinforced and prestressed concrete bridges, classes 36 and 45, are considered. The ultimate limit state is verified in cross sections subjected to positive and negative critical bending moments. In case of prestressed bridges, the cracking limit state in concrete is added. The real traffic is represented by a live load model based on weighting data collected from stations located on highways of the state of Sao Paulo and the statistical resistance parameters are determined using the Monte Carlo technique. The gross weight limits are presented in the form of equations known as bridge formulas which are applicable to any group of two or more consecutive axles. The observed results indicate restrictions to the traffic of some vehicles, especially the 740 kN and 19.80 meters length truck. Considering only the service- ability limit state, class 45 bridges are found to exhibit lower weight limits due to the load factors recommended by the code during design. Keywords: concrete bridges; reliability theory; live load model; bridge formula; truck weight regulations. O aumento nos limites de peso estabelecidos pela legislação brasileira e a proliferação das Combinações de Veículos de Carga nas rodovias nacionais motivam uma preocupação no que se refere à segurança estrutural das pontes quando submetidas ao tráfego real. Este trabalho verifica o desempenho das obras-de-arte especiais sob jurisdição do DER-SP através do índice de confiabilidade β e obtém equações para a limitação do peso de caminhões de modo a não comprometer sua integridade estrutural. São consideradas as superestruturas das pontes em concreto armado ou protendido, classes 36 e 45. Verifica-se o estado limite último nas seções transversais mais solicitadas por momento fletor positivo e negativo. No caso de pontes em concreto protendido, acrescenta-se a verificação do estado limite de formação de fissuras. O tráfego real é representado por um modelo de carregamento móvel baseado em pesagens de caminhões efetuadas em rodovias do estado de São Paulo e os parâmetros da resistência são determinados através da técnica de Monte Carlo. Apresenta-se os limites de peso em forma de equações, denomi - nadas ECPLs (Equações Comprimento-Peso Limite), aplicáveis a quaisquer grupo de eixos consecutivos dos veículos. Os resultados indicam restrições à circulação de algumas composições, especialmente ao rodotrem de 740 kN e 19,8 metros de comprimento. Considerando-se apenas o estado limite de serviço, as pontes classe 45 apresentam menores limites de peso devido à ponderação de ações durante o projeto. Palavras-chave: pontes de concreto; teoria da confiabilidade; carga móvel; combinações de veículos de carga.
Transcript of Development of truck weight limits for concrete bridges ... › pdf › riem › v1n4 ›...

Volume 1, Number 4 (December, 2008) p. 421 - 450 • ISSN 1983-4195
Development of truck weight limits for concrete bridges using reliability theory
Desenvolvimento de equações para a limitação do peso de veículos de carga em pontes de concreto através da teoria de confiabilidade
L. M. FERREIRA a
A. S. NOWAK b
M. K. EL DEBS c
© 2008 IBRACON
a Departamento de Engenharia de Estruturas, Escola de Engenharia de São Carlos, Universidade de São Paulo, [email protected], Rua Mateus Grou, 502 – Ap. 123, CEP 05415-040, São Paulo-SP, Brasil;b Department of Civil Engineering, College of Engineering, University of Nebraska-Lincoln, [email protected], W181 NH, Lincoln NE 68588-0531, USA;c Departamento de Engenharia de Estruturas, Escola de Engenharia de São Carlos, Universidade de São Paulo, [email protected], Av. Trabalhador Sãocarlense, 400, CEP 13566-590, São Carlos-SP, Brasil.
Abstract
Resumo
The increase in gross weight limits allowed by Brazilian legislation and the soaring number of new truck configurations on national highways has called for greater attention regarding the structural safety of bridges when submitted to real traffic. This paper verifies the performance of bridges under Sao Paulo Department of Transportation jurisdiction using the reliability index β and obtains truck weight limits in order to guarantee struc-tural integrity. The superstructures of reinforced and prestressed concrete bridges, classes 36 and 45, are considered. The ultimate limit state is verified in cross sections subjected to positive and negative critical bending moments. In case of prestressed bridges, the cracking limit state in concrete is added. The real traffic is represented by a live load model based on weighting data collected from stations located on highways of the state of Sao Paulo and the statistical resistance parameters are determined using the Monte Carlo technique. The gross weight limits are presented in the form of equations known as bridge formulas which are applicable to any group of two or more consecutive axles. The observed results indicate restrictions to the traffic of some vehicles, especially the 740 kN and 19.80 meters length truck. Considering only the service-ability limit state, class 45 bridges are found to exhibit lower weight limits due to the load factors recommended by the code during design.
Keywords: concrete bridges; reliability theory; live load model; bridge formula; truck weight regulations.
O aumento nos limites de peso estabelecidos pela legislação brasileira e a proliferação das Combinações de Veículos de Carga nas rodovias nacionais motivam uma preocupação no que se refere à segurança estrutural das pontes quando submetidas ao tráfego real. Este trabalho verifica o desempenho das obras-de-arte especiais sob jurisdição do DER-SP através do índice de confiabilidade β e obtém equações para a limitação do peso de caminhões de modo a não comprometer sua integridade estrutural. São consideradas as superestruturas das pontes em concreto armado ou protendido, classes 36 e 45. Verifica-se o estado limite último nas seções transversais mais solicitadas por momento fletor positivo e negativo. No caso de pontes em concreto protendido, acrescenta-se a verificação do estado limite de formação de fissuras. O tráfego real é representado por um modelo de carregamento móvel baseado em pesagens de caminhões efetuadas em rodovias do estado de São Paulo e os parâmetros da resistência são determinados através da técnica de Monte Carlo. Apresenta-se os limites de peso em forma de equações, denomi-nadas ECPLs (Equações Comprimento-Peso Limite), aplicáveis a quaisquer grupo de eixos consecutivos dos veículos. Os resultados indicam restrições à circulação de algumas composições, especialmente ao rodotrem de 740 kN e 19,8 metros de comprimento. Considerando-se apenas o estado limite de serviço, as pontes classe 45 apresentam menores limites de peso devido à ponderação de ações durante o projeto.
Palavras-chave: pontes de concreto; teoria da confiabilidade; carga móvel; combinações de veículos de carga.

422 IBRACON Structures and Materials Journal • 2008 • vol. 1 • nº 4
Development of truck weight limits for concrete bridges using reliability theory
1. Introduction
Efficiency in the transportation segment is certainly one of the re-quirements for the economical development of emerging countries. Particularly concerning to road transportation, it is interesting that a nation has a modern fleet of trucks capable of transporting great amounts of load without pressure on the cost of goods.In that context, Brazil has recently seen the growing use of Long Combination Vehicles (LCVs) in substitution to old unitary vehicles or vehicles with just a towed unit. There are no doubts on the ben-efits resulting from such an innovation in course. However, it is necessary that the existing legislation be adapted to suit the new reality and that rules be defined to be effectively accomplished. Besides government agencies, the subject also directly interests private administrators of public highways responsible for the ap-propriate maintenance of the segments under their responsibility.One of the aspects to be carefully analyzed is the eventual dam-ages that the existing structures may suffer due to the circulation of the new truck configurations. The lack of appropriate maintenance and the consequent state of deterioration of some bridges worsen that scenario. It is therefore necessary to evaluate the conse-quences of heavy vehicles traffic and to define efficient and reliable criteria that aid in the decision making as to which configurations of LCVs, especially short and heavy, are permitted to use certain segments of the Brazilian road mesh.The study of the effects of LCVs on the most common structural systems in highways of the state of Sao Paulo began at the De-partment of Structural Engineering of the Sao Carlos School of Engineering through El Debs et al. [1]. That report, based on the comparison between load effects due to LCVs and the norma-tive load indicated restrictions to the traffic of some vehicles and served as guide in the elaboration of rules for issuance of special permits from Sao Paulo Department of Transportation. Later, two other reports (El Debs et al. [2] and [3]) with similar objectives were published, thus evidencing the need of a procedure that can be applied in a more generic way without the structural analysis of several bridges for each individual truck.In October of 2005, the National Council of Traffic approved Reso-lution n° 184, that increased the maximum gross weight of LCVs
with two or more units (included the tractor unit) from 450 kN to 570 kN, avoiding the need of a special permit for those compo-sitions and ratifying decision already considered in Resolution n° 164 of September, 2004. It was also determined that LCVs with a total gross weight higher than 570 kN and lower or equal to 740 kN should have a length equal to or higher than 25 meters, but not longer than 30 meters. As from January 2007, the weight and dimensions limits were defined by Resolution n° 210 (that revoked Resolution n° 12) while the necessary requirements for the circula-tion of LCVs were determined by Resolution n° 211 (that revoked Resolutions n° 68, 164 and 184).It should be emphasized here that the consideration of only the gross weight turns out to be unable to supply indications on the safety of a bridge. The relationship between gross weight and applied load length is essential for the correct understanding of the problem.One of the alternatives to be followed comes from American legis-lation which, besides imposing maximum limits for isolated axles at 89 kN, axles in tandem at 151 kN and the total weight of vehicles at 356 kN, states that the weight of a group of two or more consecu-tive axles is restricted according to the so-called bridge formula or truck weight formula given by:
where W: overall gross weight in kN on any group of two or more con-secutive axles;B: length in meters of the axle group; N: number of axles in the axle group.Although considered excessively restrictive, equation [1], besides presenting a very convenient approach to determining the maxi-mum weight as a function of the distance between axles groups, it is also of easy application. Using that original idea and introducing probabilistic processes, the above equation can be improved thus indicating a realistic maximum load to which existing bridges can be safely subject (Ghosn [4]).

423IBRACON Structures and Materials Journal • 2008 • vol. 1 • nº 4
L. M. FERREIRA | A. S. NOWAK | M. K. EL DEBS
section used in the safety analysis. For the total number of structures analyzed, some are considered only in reinforced concrete, some only in prestressed concrete while some apply to both cases. In the case of simply supported bridges, except 2 girder bridges, for 10 m spans reinforced concrete was ad-opted, for 20 m spans, reinforced and prestressed concrete, and for spans longer than 30 m only prestressed concrete. In the case of continuous structures and for 2 girder bridges, only reinforced concrete was considered. A summary of the selected cases is given in Table 1.Due to changes in Brazilian codes along the years, several pe-riods are considered both for reinforced and prestressed con-crete. Each period corresponds to a specific safety coefficient and calculation assumptions.
2.2.1 Reinforced concrete
Considering the evolution of design methodology, five periods were determined, two being for class 36 and three for class 45. The load factors associated to each period may be seen in Table 2.The values adopted for the characteristic strength of concrete are given in Table 3. Although that strength is a variable pa-rameter according to each design, representative values were adopted for each period. It should be pointed out that the same characteristic strength is adopted for all bridge types.
2.2.2 Prestressed concrete
According to information obtained from experienced profes-sionals, limited prestressing is adopted in about 95% of pre-stressed concrete bridge projects while complete prestressing is adopted in only 5% of them. With the objective of covering
Using the reliability theory, the objective of the present paper is to quantify the safety of cross sections subjected to a real traffic rep-resentation and to propose truck weight limits in reinforced and pre-stressed concrete bridges of classes 36 and 45. The presented pro-cedure is based on Ferreira [5], where more details can be found.
2. Resistance of cross sections
The determination of the statistical parameters of cross section strength involves the selection of typical bridges, their modeling and analysis of internal effects, their design to bending moment, the calculation of the nominal bending moment resistance and the implementation of Monte Carlo’s technique. The procedure includes the analysis of the compres-sive strength of concretes with several design specifications.
2.1 Typical bridges
The bridges considered in this study were chosen based on the available material supplied by Sao Paulo Department of Transpor-tation, already used in El Debs et al. [1], in a total of 60 bridges. According to the structural system, they are:• slab: 8 bridges;• 2 girders: 23 bridges;• 5 girders with crossbeam: 11 bridges;• 5 girders without crossbeam: 8 bridges;• box section (1, 2, 3 ou 4 cells): 10 bridges;The structural analysis was carried out using the software STRAP (Structural Analysis Programs) - version 9.0 (SAE Informatica[6]).
2.2 Design
Once the bending moment is obtained, the determination of the areas of the longitudinal steel is carried out for each cross

424 IBRACON Structures and Materials Journal • 2008 • vol. 1 • nº 4
Development of truck weight limits for concrete bridges using reliability theory
a vast range of cases while reducing the number of analysis, prestressed concrete bridges are considered with limited pre-stressing in the present paper. Besides, the prestressed con-crete is considered with post-tension and subsequent bond. As usual for prestressed concrete, the design is based on the serviceability limit states (SLS) with the subsequent verification of the ultimate limit state (ULS). The periods and the respective load factors for the serviceability limit state are given in Table 4. The verification of the ultimate limit state uses the same load factors as for reinforced concrete bridges (Table 2). The characteristic strengths of concrete adopted for the pre-stressed structures, usually higher than that of reinforced concrete, are given in Table 5. To define the characteristic strength, it was assumed that the slab and box bridges are cast-in-place, while the 5 girder bridges are formed by precast beams fabricated at the construction site. In the last case, a lower strength of the concrete deck is considered.
2.3 Nominal bending moment resistance
The nominal strength is calculated using the characteristic values of the concrete and steel properties indicated by NBR 6118 (ABNT [7]). Firstly, the cross section is divided into a series of rectangular strips. Constant deformation and stress in each strip is considered. The position of the neutral axis is determined through iterations until the balance of forces is obtained. Among the 5 intervals of time set previously, just one of them
considered critical (lower bending moment resistance) for each class is considered in the calculations. It should be pointed out that, for the class 45 bridges, the period between 1984 and 1986 was excluded of the analysis because of its low probabil-ity of occurrence compared to others.
2.4 Implementation of the Monte Carlo’s technique
The strength of structural elements is considered a random variable due to uncertainties in the materials properties, di-mensions and methods of analysis. The evaluation of their statistical parameters, such as the mean value, coefficient of variation, probability density function and cumulative distribu-tion function, requires a great number of materials and test ele-ments, hence resulting in high costs. Alternatively, the behav-ior of the structural components may be determined through simulations. Particularly, this paper makes use of the Monte Carlo’s technique.
2.4.1 Statistical parameters of the materials properties and dimensions
The basic variables are the compressive strength of concrete, the properties of steel and the cross section dimensions. The statistical parameters to be used in the simulations, except for the concrete strength, were obtained from the available litera-ture (Ferreira [5]). For older bridges, those built up to 1986, the normal distribu-

425IBRACON Structures and Materials Journal • 2008 • vol. 1 • nº 4
L. M. FERREIRA | A. S. NOWAK | M. K. EL DEBS
tion prescribed by NB 1 (ABNT [8]) is used to represent the concrete strength:
where :dσ standard deviation of concrete, equal to 4 MPa for severe
control.With the objective of investigating the characteristics of the con-crete produced recently that may be applied to bridges con-structed starting from 2003 and as an approach to bridges of the previous period (1987 to 2002), a data collection on the compressive strength of concrete from cylindrical specimens was started. The obtained data refer to ready-mix concretes used at several sites and in a large number of constructions. The data are plotted on probability paper that aid in choosing the type of distribution and in determining the most important statistical parameters. The abscissa represents the basic vari-able (in this case, the compressive strength of concrete) while the ordinate represents the cumulative probability. The basic idea is to redefine the vertical scale in such a way that any series of data described by the same type of distribution on the paper is represented by a straight line. The slope of the resultant straight line and its intercept with the horizontal axis supply the mean value and the standard deviation. More de-tails can be found in Nowak and Collins [9]. Considering that the compressive strength of concrete usually follows a normal or lognormal distribution, the two probability papers were tested for each set of data. Figure 1 shows the data of concretes with characteristic strength equal to 20 MPa plotted on a normal probability paper. The relationship between the mean value and the nominal value (characteristic), called bias, and the coefficient of variation (CV) are obtained by ad-
justing a straight line to the lower tail of the distribution, since it is the most important region regarding the reliability aspect.The results obtained indicated that the lognormal distribution is more appropriate for concretes of characteristic strength equal to 15 MPa and 18 MPa while for concretes of characteristic strength of 20 MPa and above, the normal distribution is recommended (Ferreira [5]).A summary of the statistical parameters of materials and dimen-sions used in the this paper is presented in Table 6.
2.4.2 Mean bending moment resistance
From the idealized probability distributions for each basic variable, the statistical resistance parameters (mean value and coefficient of variation) of each cross section considered are obtained for 20,000 simulations of Monte Carlo’s technique.
3. Live load
A live load model is developed based on trucks weightings carried out by Centrovias Sistemas Rodoviários S/A. The data analyzed was that ranging from January 2001 to October 2002, totaling 184,603 weight-ings, 126.389 of which were during the first year and 58.214 in 2002.
3.1 Selected trucks
In developing the live load model, only those trucks that appear with larger weight and in a larger number on the spreadsheets of weight-ing from Centrovias were considered based on a procedure already adopted by other authors (Hwang and Koh [10]). Initially, the follow-ing vehicles were selected: 2S3e, 2S3, 3S3, 2S2 and 3S2B2. The nomenclature adopted is that suggested by Widmer [11].
3.2 Distance between axles
The weighting spreadsheets, in spite of informing the configuration of each truck, do not indicate the distance between axles. It is known

426 IBRACON Structures and Materials Journal • 2008 • vol. 1 • nº 4
Development of truck weight limits for concrete bridges using reliability theory
that even inside a certain classification, the distance between axles varies from vehicle to vehicle, sometimes significantly. There is no knowledge on data regarding the distribution of the dis-tance between axles obtained from field observations. Alternatively, this paper uses typical and representative distances determined from the virtual catalog of the company Randon S/A, from informa-tion supplied by Transervice Consultoria em Transportes S/C Ltda and also from pictures.The vehicles and the distances adopted between axles are shown in Figure 2.
3.3 Extrapolation of maximum gross weights
Considering the limited period during which the vehicles were
weighed, the maximum gross weights for each truck should be ex-trapolated according to the design life of the structures. Initially, the results of the weighting for each truck are plotted on a normal probability paper. Although the distributions do not fol-low a normal distribution strictly, this procedure is quite conve-nient because it permits a general view of the data and indicates tendencies for longer periods than those effectively measured. Besides, it is the method used by other researchers for the de-velopment of live load models, among them, Hwang and Koh [10] and Nowak [12].The next stage involves estimating the total number of trucks corre-sponding to the daily traffic in the area where the weightings were ob-tained and determining the design life of the structure, assumed in this study equal to be 50 years. From the percentage of each configuration,
427IBRACON Structures and Materials Journal • 2008 • vol. 1 • nº 4
L. M. FERREIRA | A. S. NOWAK | M. K. EL DEBS
the total number of occurrences from a certain vehicle in 50 years (n) is obtained. With )n/1(z 1−Φ= , where 1/n is the level of probability corresponding to n and 1−Φ is the inverse of the cumulative distribu-tion function of the standard normal variable, the value that the extrapo-lation should reach can be determined. The idea is that if all trucks were sampled during 50 years, the heaviest truck would be at the level z. The extrapolation is accomplished through a linear regression that includes the 100 heaviest trucks of each selected vehicle. Figure 3 presents an example for the configuration 3S3 of 13.50 m length. In Table 7, the maximum gross weights obtained from the adopted methodology are shown.
3.4 Critical load cases
The critical scenario for bridge safety analysis may result from the crossing of a single truck or the simultaneous presence of two or more vehicles.
3.4.1 Single truck
In this case, it is admitted that the presence of only one truck over the bridge with weight corresponding to a design life of 50 years is critical for the calculation of the bending moments under real traffic. The simulations carried out indicated that although the heaviest
truck is the 2S2 (see Table 7), the short configuration of the ve-hicle 3S3 (13.50 m length) is more critical regarding load effects. Because of this, the 3S3 vehicle was tested separately to obtain maximum effects in all selected structures.It was considered that the maximum gross weight during 50 years of design life is the mean value of a new distribution, according to Nowak [12].
3.4.2 Simultaneous presence of two trucks
The analysis of 2 trucks over the bridges requires the determina-tion of the relative position and the relation between their weights. Considering that the probability of 2 trucks passing over the bridge sufficiently close and in relative positions that cause a maximum bending moment situation is smaller than for an isolated truck (smaller number of occurrences), their gross weight is also ex-pected to be lower. Statistical data that supply the probabilities of simultaneous oc-currences on bridges are not available in Brazil. Therefore, based on Hwang and Koh [10] and Nowak [12] as references, the prob-abilities of simultaneous presence adopted for this study are given in Table 8. According to Table 8, the two cases to be analyzed are 2 trucks with probability of 1/500 (hypothesis 2) and 2 trucks with different prob-

428 IBRACON Structures and Materials Journal • 2008 • vol. 1 • nº 4
Development of truck weight limits for concrete bridges using reliability theory
abilities (hypothesis 1), one of them with probability varying between 1/75 and 1/50, and the other of mean weight. In the case of trucks on the same lane, several distances between them were verified, highlighting that the dynamic portion of the live load effect is not con-sidered for distances between trucks of below 15 meters.In the present study, the main truck is assumed to be a 3S3 of 13.50 m length. Assuming a simultaneous presence, it is consid-ered that the second truck is a 2S3 of 12.10 m length since the total number of 2S3 trucks represents approximately 30% of the total observed trucks.It is worth pointing out that the case of vehicles positioned side by side refers to trucks on adjacent lanes and in any relative positions such that the resulting bending moment observed is maximum.
3.4.3 Simultaneous presence of 3 or more trucks
The literature consulted does not provide any indications regarding the probability of 3 or more trucks on the bridge, which is consid-
ered low and of difficult investigation. Besides, the position of a third vehicle will match smaller values of the influence line. Not-withstanding, the 3-truck case is pertinent only in long bridges and/or bridges with several traffic lanes. In case of long bridges, the dead load prevails and the effect of live load becomes less im-portant while in short bridges and bridges with a smaller number of lanes, there is not even enough space for the positioning of 3 trucks. Thus, it is considered that the case of 3 or more trucks is not indispensable for the live load analysis and the safety of the bridges treated here may be reliably measured from the 1 or 2-truck analysis only.
3.5 Maximum bending moments
The proposed live load model was analyzed in all selected typical bridges. It was noticed that, generally, the case of 2 trucks po-sitioned side by side defines the critical condition for wide deck bridges while for narrow deck bridges, the 1 isolated vehicle or 2 trucks positioned side by side are most often the critical situation. The mean dynamic load used in the analyses is that suggested by Nowak [12]. In the case of 1 isolated truck, the dynamic portion of

429IBRACON Structures and Materials Journal • 2008 • vol. 1 • nº 4
L. M. FERREIRA | A. S. NOWAK | M. K. EL DEBS
the bending moment is considered equal to 15% of the static bend-ing moment and, in the case of 2 trucks, the recommended value is 10%. The coefficient of variation in both cases is 0.80.Taking into consideration all the cases studied, observation showed that for the class 36 bridges, the relationship between the mean value resulting from the proposed live load model and the value obtained with the normative load model varies between 0.69 and 1.80. In class 45, these values were shown to vary between 0.49 and 1.42. The large variability is justified by the diversity of structural systems, longi-tudinal arrangements, spans and deck widths. It must be pointed out that, due to the characteristics of the Brazilian code to bridge loads, this relationship tends to decrease with increase span length.
4. Reliability analysis
4.1 Introduction
According to Nowak and Collins [9], the reliability of a structure is its ability to meet design requirements during the design life or the prob-ability that the structure will not fail in carrying out its functions.Mathematically, the limit states are represented by a function called limit state function. Regarding the ultimate limit state, the limit state function associates to the concept of safety margin:
where:Z: safety margin;R: capacity or resistance;S: internal effects, demand or total load effect.In the case of bridges,
where:D: dead load effect;L: live load effect;E: environment load effect (wind, temperature, earthquake etc).The boundary between the desired and undesired performance is giv-en by 0Z = . Hence if 0Z > , the structure is said to be safe while for 0Z < the structure is said to be unsafe. Therefore, the probability of structural failure is given by the probability that the resistance R is smaller than the effect of the applied load S, as follows:
where:)z(fZ : probability density function of the variable Z;)0(F Z : value of the cumulative distribution function at 0Z = .
In terms of R and S, equation [5] may be also represented by:
where:)x(fS : probability density function of the variable S;)x(FR : cumulative distribution function of the variable R.
However, the large number of random variables that may be in-volved in many practical problems turns the integration of equation [6] almost always unfeasible. Alternatively, the structural safety is measured in terms of the reliability index β , defined as the short-est distance from the origin of the reduced variables space to the failure surface (Figure 4). In the case of only two variables, the failure surface is a line corresponding to 0)s,r(z = , where:

430 IBRACON Structures and Materials Journal • 2008 • vol. 1 • nº 4
Development of truck weight limits for concrete bridges using reliability theory
If R and S follow independent normal probability distributions, the reliability index links directly with the failure probability in the form:
and
where:Φ : cumulative distribution function of the standard normal vari-able;µ : mean value of the variables;σ : standard deviation of the variables.Figure 5 shows the failure probability, represented by the shaded area, and the reliability index β , that supplies the number of stan-dard deviations that the mean value of the safety margin is away from the limit state. If the involved variables do not follow a normal distribution, the relationship between β and the failure probability is only approximate. More details may be seen in Nowak and Collins [9].
4.2 Methodology
The developed reliability analysis has 2 functions:a) To determine the reliability indexes of the most critical cross sections submitted to positive and negative bending moments of each bridge when subjected to the proposed live load model;b) Once the target reliability index is fixed, to supply the bending moment due to live load so that the established safety level is not exceeded.In the reliability analysis, it is admitted that the total load effect
corresponding to the sum of the effects from several actions is a normal variable while the resistance corresponding to the product of random variables is considered a lognormal variable. Hence the Central Limit Theorem (Nowak and Collins [9]) is applied. This the-orem says that the sum of independent random variables tends to a normal distribution as the number of variables increases if none of them is dominant.Although in this study the number of actions is relatively small to satisfy the Central Limit Theorem, the methodology of Nowak [12] is maintained with the objective of comparing the results and fixing the target reliability index. The Rackwitz-Fiessler procedure is used (Nowak and Collins [9]) and the limit state function is SRZ −= , where R is the cross section resistance to bending and S is the total load effect (self-weight of the structure + self-weight of the asphaltic covering + live load, including the dynamic portion). The results of the reliability analysis presented in next paragraphs may be seen with more details in Ferreira [5].
4.3 Reinforced concrete
The observed results demonstrate that bridges of class 36 present lower reliability indexes when compared to bridges of class 45. That difference is more pronounced in shorter spans, because the dead load to live load relationship is smaller. It is worth pointing out that for a same structure, bridges of classes 36 and 45 were designed considering the same self-weight. In terms of positive bending moment, within a given class and structural system, shorter span bridges were shown to generally exhibit lower reliability indexes and therefore lower safety levels. This conclusion was also obtained by Ghosn [4]. The negative bending moments in cantilever parts present very low reliability indexes. The reliability indexes between similar bridges of narrow deck and wide deck depend on the structural system and on the span. In the case of 5 girder narrow deck bridges, the safety is found to be larger in bridges with crossbeams compared to bridges without crossbeams while in wide deck bridges, the reverse is true.
4.4 Prestressed concrete
4.4.1 Ultimate limit state
Usually, reliability indexes obtained for prestressed concrete bridg-es considering the ultimate limit state are found to be larger than

431IBRACON Structures and Materials Journal • 2008 • vol. 1 • nº 4
L. M. FERREIRA | A. S. NOWAK | M. K. EL DEBS
the values obtained for reinforced concrete structures. This fact is attributed to differences in the preliminary design, to the calculation procedure of cross sections and also to the lower variability of the statistical parameters of materials properties and dimensions.Bridges with wide deck tend to exhibit larger levels of safety com-pared to narrow deck bridges. In the case of 5 girder bridges, those ones with crossbeams were shown to present larger reliability in-dexes compared to structures without crossbeams. Besides, like in reinforced concrete bridges, the reliability indexes are shown to increase with the increase of the span. However, in slab bridges and in 5 girder bridges, the reliability indexes are observed to be larger for class 36 due to differences in the hypoth-eses considered when verifying the serviceability limit states.
4.4.2 Serviceability limit states
The cracking limit state presents lower reliability indexes than the ultimate limit state. It is also emphasized that class 36 bridges present larger reliability indexes compared to bridges of class 45 due to the different load factors for serviceability. Following the tendency that has already taken place in the case of reinforced concrete and for the ultimate limit state in the case of prestressed concrete, slab bridges present larger reliability in-dexes compared to similar bridges of other structural systems. Here also, the favorable effect of crossbeams in 5 girder bridges is again verified.
5. Bridge formula calculation
The basic efficiency requirements that the proposed equations should look for are:a) all vehicles (or groups of axles) that cause lower reliability indexes than the target safety level should have their weights restricted;b) the equation should not limit the weight of vehicles (or group of axles) beyond the limit imposed from the target reliability index;c) the equation must be simple and easy to use.
5.1 Calculation procedure
The steps necessary to obtain the bridge formulas and which will be applied to each bridge of the selected data base are the follow-ing ones:a) assume that a group of axles of weight W and length B satisfies the equation; b) adopt a distribution for the weight W along the length B so that the bending moments obtained for real trucks and for the assumed distribution are approximately the same. In this research, the real trucks are represented by 11 uniformly distributed axles of the same load;c) vary B between 2.5 and 30 meters;d) for each B, calculate the bending moment )M( r equivalent to a unit load uniformly distributed along its length, being attributed to each axle
11
B1⋅;
e) obtain the bending moment that corresponds to the target safety level )( tβ and subtract the effects of the dead load
(self-weight of the structure and self-weight of the asphaltic covering) and of the dynamic portion of the live load. Considering that the truck of the bridge formula may not be isolated when moving over the bridges, also subtract the bending moment corresponding to the accompanying truck (secondary vehicle). The resulted bending moment is called maxM and the adopted secondary vehicle is a 2S3 of 12.1 m length with probability of 1/500 (gross weight equal approximately to 560 kN); f) calculate the weight limit from: B
M
MW
r
max ⋅= ;
g) after carrying out the above stages for several values of B, obtain the curves W as a function of B. Repeating the procedure for all bridge types of the data base, it is obtained the envelope that the gross weights should satisfy so that a reliability index larger or equal to beta target is guaranteed;h) find an algebraic expression that represents, in a simple way, the envelope previously obtained.
5.2 Adoption of the target reliability index )( tβ
The determination of the target reliability index is based on the per-formance of existent bridges subjected to the proposed live load model and on recommendations in technical literatures. In agree-ment to Ghosn [4] and Nowak [12], only one value of β is used, independently of the structural system, class (36 or 45), length and number of lanes. Also, no differentiation is made between positive and negative bending moment. Only the concept of redundancy and the type of the state limit are taken into consideration when fixing tβ . For the ultimate limit state, the value of tβ used in the calcula-tion of the bridge formula for 2 girder bridges and 5 girder bridges without crossbeams considering its low load redistribution is 4. In other structural systems, beta target is assumed to be 3.5. The probabilities of failure associated to those reliability indexes are
and , respectively. Considering that for prestressed bridges, the failure to meet the state limit of cracking presents less severe consequences to the structures compared to the ultimate limit state, and assuming that the environment is not aggressive, a value of 0.5 is adopted for tβ (probability of failure corresponding to 0.31).
6. Proposed equations
Two equations are supplied for each bridge class, one equation being for the ultimate limit state and other for the serviceability limit state. While the first must be obeyed in a more rigorous way, the application of the second is attributed to an engineer’s decision.
6.1 Ultimate limit state (ULS)
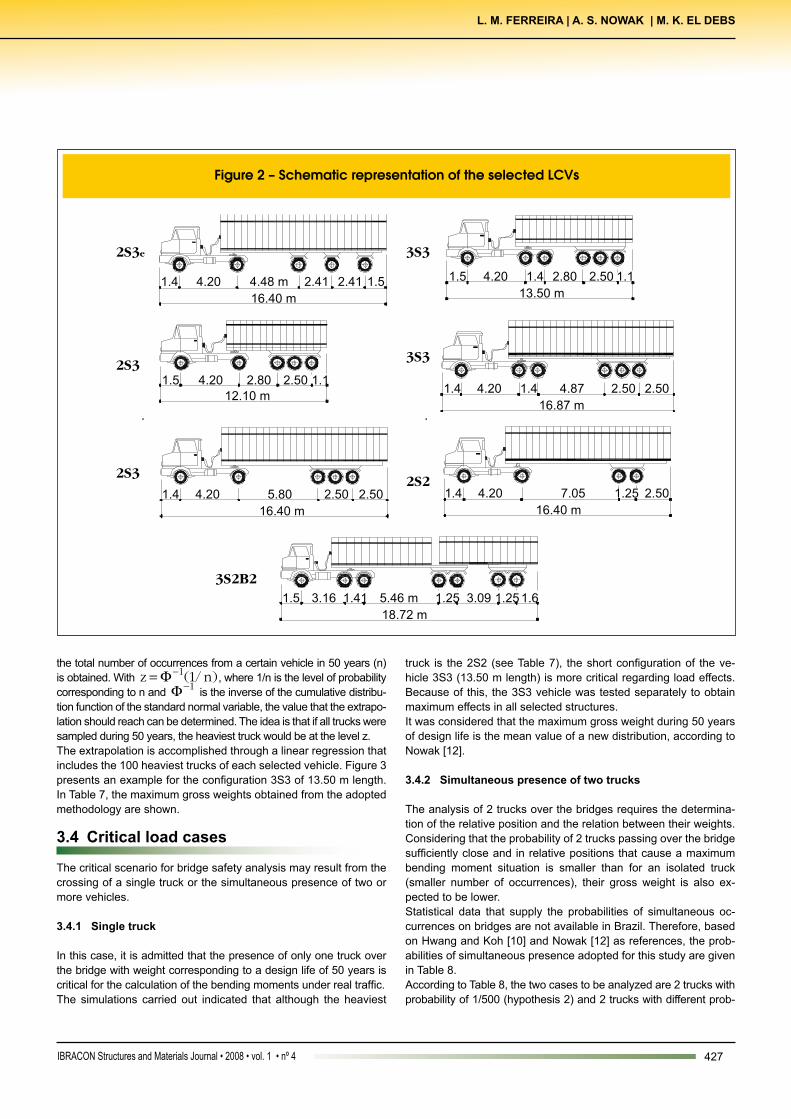
The proposed equations for the ultimate limit state are given in Figure 6 and the result of the equations in table form is shown in Table 9. The situation of some typical trucks regarding the ultimate limit state is verified in Table 10. Besides the distance between extreme axles (total gross weight of the vehicle), groups of intermediate axles are also tested in some cases. When the nominal weight is larger than that obtained with the corresponding bridge formula,
432 IBRACON Structures and Materials Journal • 2008 • vol. 1 • nº 4
Development of truck weight limits for concrete bridges using reliability theory
the group of axles does not respect the limits obtained in this study and therefore should have its weight restricted. The analysis of Table 10 indicates the following restrictions:a) 3S3: without restrictions as far as it respects the legislation;b) 3S2B2: does not satisfy the bridge formula for class 36, especially in relation to the 4 rear axles. However, the difference is not significant;c) 3S3B3: the 6 rear axles of the configuration used in the example do not respect the bridge formula for class 36. Regarding the total gross weight of the vehicle, the difference
is not significant;d) 3S2A2S2 of 19.80 meters length: does not satisfy the weight limits imposed for class 36. For class 45, the maximum total gross weight is not satisfied;e) 3S2A2S2 of 25 meters lenght: considering the total weight, it may be admitted that there are no restrictions. However, it presents a group of axles in the same conditions of the 3S2B2 vehicle that is slightly above the weight limits for class 36.
6.2 Serviceability limit state (SLS)
Figure 7 shows the weight limits considering the serviceability limit state (cracking) for prestressed concrete bridges. The same re-sults are shown in Table 11. The effect of the trucks treated in the ultimate limit state, but this time considering the serviceability limit state, is in Table 12. The results show that:a) class 36: the only restriction presented is in relation to truck 3S2A2S2 of 19.8 meters;b) class 45: presents restrictions for the circulation of all trucks, especially in what refers to the vehicle 3S3B3 and 3S2A2S2 of 19.8 meters length.It is pointed out that other configurations of the same trucks can make possible their use for the respective states limits.
7. Conclusionsandfinalconsiderations
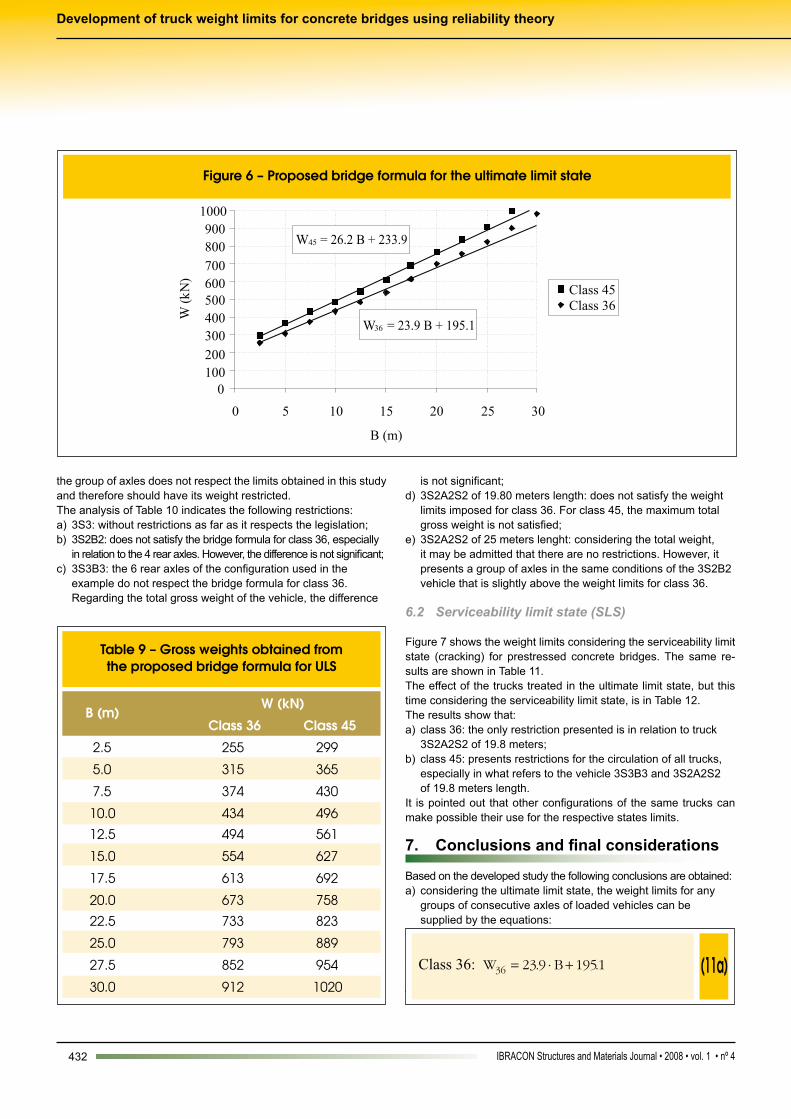
Based on the developed study the following conclusions are obtained:a) considering the ultimate limit state, the weight limits for any groups of consecutive axles of loaded vehicles can be supplied by the equations:Class 36: [11a]Class 45: [11b]where

433IBRACON Structures and Materials Journal • 2008 • vol. 1 • nº 4
L. M. FERREIRA | A. S. NOWAK | M. K. EL DEBS
W: maximum gross weight in kN on any group of two or more con-secutive axles;B: length of the axle group in meters.b) the use of the weight limits established above indicates restrictions to the circulation of some vehicles, especially in class 36 bridges. The results also show that, among the verified vehicles, the 3S2A2S2 truck of 19.8 meters length and 740 kN is the most incompatible to the studied Brazilian typical bridges;
c) the developed equations for the serviceability limit state are:
d) in this last case, the proposed equations for prestressed

434 IBRACON Structures and Materials Journal • 2008 • vol. 1 • nº 4
Development of truck weight limits for concrete bridges using reliability theory
structures result in low gross weights for bridges of class 45 indicating that the current load factors in service reduce the safety regarding the limit state of cracking compared to previous periods.It should be reminded that the study analyzed the most common structural systems found at Sao Paulo Department of Transporta-tion highways and also to attend to most usual design situations. Spans up to 40 meters were considered respecting the particulari-ties of each structural system.
Within the premises and hypotheses assumed in this work, it may be emphasized that: a) the bending moment in the superstructure of bridges classes 36 and 45 is considered; b) the bridges are as-sumed to be straight, with no skew and with even supports; c) the dead load and the vertical effect of the live load is verified; d) the study does not include fatigue analysis in concrete bridges; e) the proposed bridge formulas do not contemplate cantilever parts with less than 5 meters; f) the maximum gross weights were reduced in 5%, considering tolerance allowed by the Brazilian legislation; g) it is assumed that the bridges have been appropriately designed and executed and besides, that they do not present any patholo-gies that jeopardize their capacity and; h) the axles weight limits allowed by Brazilian legislation must be respected.
8. Acknowledgments
Our acknowledgements go to Centrovias Sistemas Rodoviarios S/A and to the engineer Luis Wilson Marques, from Transervice Consultoria em Transportes S/C Ltda. We also thank the Brazilian federal agency Capes for the research scholarships both in Brazil and in the United States during the doctoral period of engineer Luciano Maldonado Ferreira.
9. References
[01] EL DEBS, M.K. et al. Analysis of the consequences of LCVs (Long Combination Vehicles) traffic over bridges from Sao Paulo Department of Transportation road mesh (in Portuguese). Sao Carlos, University of Sao Paulo, 2001. Technical Report. [02] EL DEBS, M.K. et al. Technical study to evaluate the maximum gross weight of a LCV of nine axles and 19,80m length concerning the structural safety of bridges from Sao Paulo Department of Transportation road mesh (in Portuguese).

435IBRACON Structures and Materials Journal • 2008 • vol. 1 • nº 4
L. M. FERREIRA | A. S. NOWAK | M. K. EL DEBS
Sao Carlos, University of Sao Paulo, 2003. Technical Report. [03] EL DEBS, M.K. et al. Technical study to evaluate the consequences of the traffic of a 65,5t, eight axles, 20,43m length LCV over bridges from Parana road integration system (in Portuguese). Sao Carlos, University of Sao Paulo, 2003. Technical Report. [04] GHOSN, M. Development of truck weight regulations using bridge reliability model. Journal of Bridge Engineering, 2000, p.293-303, nov. [05] FERREIRA, L.M. Development of truck weight limits for concrete bridges using reliability theory (in Portuguese). São Carlos, 2006. Ph.D. Thesis – Sao Carlos School of Engineering, University of Sao Paulo. [06] SAE INFORMATICA. Structural Analysis System (in Portuguese). Available in: http://www.sae.eng.br. Accessed in: 10/23/2007. [07] ASSOCIAÇÃO BRASILEIRA DE NORMAS TÉCNICAS – ABNT (Brazilian Association of Technical Standards). NBR 6118 – Design of concrete structures (in Portuguese). Rio de Janeiro, 2003. [08] ASSOCIAÇÃO BRASILEIRA DE NORMAS TÉCNICAS – ABNT (Brazilian Association of Technical Standards). NB 1 – Design and construction of concrete structures (in Portuguese). Rio de Janeiro, 1978. [09] NOWAK, A.S.; COLLINS, K.R. Reliability of structures. Boston: McGraw-Hill, 2000. [10] HWANG, E-S.; KOH, H.M. Simulation of bridge live load effects. In: 16TH Congress of IABSE, 2000, Lucerne. [11] WIDMER, J.A. Proposed names for trucks, bus and LCVs – long combination vehicles (in Portuguese). Proceedings of the Research and Teaching Congress in Transportation, ANPET, 2004, Florianópolis, v.1, p.624-635. [12] NOWAK, A.S. Calibration of LRFD bridge design code. Washington, Transportation Research Board, 1999. NCHRP Report 368.