Development of Simplified Anaerobic Digestion Models...
50
Accepted Manuscript Title: Development of Simplified Anaerobic Digestion Models (SADM’s) for studying Anaerobic Biodegradability and Kinetics of Complex Biomass Author: Momoh O.L. Yusuf B.U. Anyata D.P. Saroj<ce:footnote id="fn0005"><ce:note-para id="npar0005">Tel.: +2347067538129.</ce:note-para></ce:footnote><ce:footnote id="fn0010"><ce:note-para id="npar0010">Tel.: +44 0 1483686634.</ce:note-para></ce:footnote> PII: S1369-703X(13)00200-3 DOI: http://dx.doi.org/doi:10.1016/j.bej.2013.06.018 Reference: BEJ 5760 To appear in: Biochemical Engineering Journal Received date: 20-3-2013 Revised date: 26-6-2013 Accepted date: 30-6-2013 Please cite this article as: M.O.L. Yusuf, B.U. Anyata, D.P. Saroj, Development of Simplified Anaerobic Digestion Models (SADM’s) for studying Anaerobic Biodegradability and Kinetics of Complex Biomass, Biochemical Engineering Journal (2013), http://dx.doi.org/10.1016/j.bej.2013.06.018 This is a PDF file of an unedited manuscript that has been accepted for publication. As a service to our customers we are providing this early version of the manuscript. The manuscript will undergo copyediting, typesetting, and review of the resulting proof before it is published in its final form. Please note that during the production process errors may be discovered which could affect the content, and all legal disclaimers that apply to the journal pertain.
Transcript of Development of Simplified Anaerobic Digestion Models...

Accepted Manuscript
Title: Development of Simplified Anaerobic Digestion Models(SADM’s) for studying Anaerobic Biodegradability andKinetics of Complex Biomass
Author: Momoh O.L. Yusuf B.U. Anyata D.P.Saroj<ce:footnote id="fn0005"><ce:note-paraid="npar0005">Tel.:+2347067538129.</ce:note-para></ce:footnote><ce:footnoteid="fn0010"><ce:note-para id="npar0010">Tel.: +44 01483686634.</ce:note-para></ce:footnote>
PII: S1369-703X(13)00200-3DOI: http://dx.doi.org/doi:10.1016/j.bej.2013.06.018Reference: BEJ 5760
To appear in: Biochemical Engineering Journal
Received date: 20-3-2013Revised date: 26-6-2013Accepted date: 30-6-2013
Please cite this article as: M.O.L. Yusuf, B.U. Anyata, D.P. Saroj, Developmentof Simplified Anaerobic Digestion Models (SADM’s) for studying AnaerobicBiodegradability and Kinetics of Complex Biomass, Biochemical Engineering Journal(2013), http://dx.doi.org/10.1016/j.bej.2013.06.018
This is a PDF file of an unedited manuscript that has been accepted for publication.As a service to our customers we are providing this early version of the manuscript.The manuscript will undergo copyediting, typesetting, and review of the resulting proofbefore it is published in its final form. Please note that during the production processerrors may be discovered which could affect the content, and all legal disclaimers thatapply to the journal pertain.

Page 1 of 49
Accep
ted
Man
uscr
ipt
1
Development of Simplified Anaerobic Digestion Models (SADM’s) for studying
Anaerobic Biodegradability and Kinetics of Complex Biomass
Momoh O.L Yusuf1, Anyata B.U2, Saroj D.P.3
1Department of Civil and Environmental Engineering, University of Port
Harcourt Choba, P.M.B 5323 Rivers State, Nigeria ([email protected])
Phone number: +2348035386779
2Department of Civil Engineering, University of Benin, P.M.B 1154, Benin City, Edo State,
Nigeria ([email protected])
Phone number: +2347067538129
3Department of Civil and Environmental Engineering, University of Surrey, Surrey GU2 7XH,
United Kingdom ([email protected])
Phone number: +44(0)1483686634

Page 2 of 49
Accep
ted
Man
uscr
ipt
2
ABSTRACT
The anaerobic co-digestion of cow manure and waste paper at ambient temperature condition was
observed to be optimized at a mix proportion of 75:25 respectively. The development and testing of a
set of simplified anaerobic digestion models (SADM’s) for this mixture revealed that the Hill’s based
biogas yield rate model was most appropriate in describing the kinetics of biogas production. Parameter
estimation using non-linear regression revealed that the half saturation constants expressed as acidified
substrate and volatile solids equivalents were 0.228g/L and 5.340g VS/L respectively, and the
maximum specific biogas yield rate and biodegradability were 2.2mL/g VS/day and 0.313 respectively.
The coefficients “n” and “m” indicative of acidogenic bacterial adaptation for degradation and
acetogenic/methanogenic bacterial cooperativity were estimated to be 1.360 and 2.738 respectively,
while hydrolysis/acidogenesis was considered the rate limiting step. The need of bacterial adaptation
may be an important factor to consider during anaerobic modeling of complex biomass.
Keywords: Anaerobic process; biodegradability; biogas; kinetic parameters; growth kinetics;
rate limiting

Page 3 of 49
Accep
ted
Man
uscr
ipt
3
Abbreviations
Af = rate limiting step coefficient for fast substrate utilization
As = rate limiting step coefficient for very slow substrate utilization
Af(s) = rate limiting step coefficient for fast or very slow substrate utilization
b =fraction of initial volatile solids remaining in effluent
ks = Monod’s half saturation constant for acidified substrate (g/L)
Ks = Monod’s half saturation constants in volatile solids equivalents (g/L)
kn = Hill’s half saturation constant for acidified substrate (g/L)
Kn = Hill’s half saturation constant in volatile solids equivalents (g/L)
ki = substrate inhibition constant for acidified substrate (g/L)
m = coefficient of acetogenic/methanogenic bacteria adaptation for cooperativity
n = coefficient of acidogenic bacteria adaptation for complex substrate degradation
Rf = recalcitrant fraction
Rmax = maximum specific biogas yield rate (mL/g VS/day)
R =specific biogas yield rate (mL/g VS /day)
So = initial volatile solids concentration (g/L)
S = volatile solids concentration remaining (g/L)
X (a) = acidogenic biomass concentration (mass/volume)
X (a/m) = acetogenic/methanogenic biomass concentration (mass/volume)
Sh = concentration of acidified substrate generated (g/L)
Sh (i) = concentration of acidified substrate remaining intracellularly
Sh (u) = concentration of utilized acidified substrate by the acetogenic/methanogenic biomass (g/L)
µ = bacteria growth rate (/day)

Page 4 of 49
Accep
ted
Man
uscr
ipt
4
µmax (a) = maximum acidogenic bacteria growth rate (/day)
µmax (a/m) = maximum acetogenic/methanogenic bacteria growth rate (/day)
Yx/s (a) = yield coefficient for acidogenic biomass production (g/L)/ (g VS/L)
Yx/s (a/m) = yield coefficient for acetogenic/methanogenic biomass production (g/L)/ (g VS/L)
Yy/s = yield coefficient for biogas production (mL/g VS)/(g VS/L))
KH(a) = maximum substrate utilization rate by acidogenic bacteria (g VS utilized/L/day)
KH (a/m) = maximum substrate utilization rate by acetogenic/methanogenic bacteria
(g acidified substrate utilized/L/day)
yt = biogas yield (mL/ g VS)
t= time (day)
1. Introduction
Anaerobic processes in waste management have been widely applied on account of their operational
simplicity and potential of energy recovery [1]. Anaerobic digestion is the breakdown of organic
material to produce biogas which is a mixture of methane and carbondioxide that is catalyzed by a
consortium of micro-organisms in a series of interlinked biochemical reactions. These biochemical
reactions comprise of hydrolysis, acidogenesis, acetogenesis and methanogenesis. Hydrolysis is the
breakdown of complex biomass into monomeric units; acidogenesis is the conversion of the monomers
into volatile fatty acids; acetogenesis is the conversion of the volatile fatty acids into acetic acid and
methanogenesis is the conversion of acetic acid into methane and carbondioxide [2, 3]. Anaerobic
digestion has been identified as not only a viable means of producing carbon neutral energy [4] but also
a means of mitigating the adverse effect of uncontrolled greenhouse gas emissions during decay of
organic matter in the environment [5].

Page 5 of 49
Accep
ted
Man
uscr
ipt
5
Organic substrate utilized for anaerobic digestion range from wastewater to complex organic feed stock
such as animal manure, agricultural and industrial waste [6]. However, more recently, the process of
co-digesting complex feedstock has been reported to result in improved biogas yield [7, 8]. Thus, for
proper utilization of raw material in anaerobic digestion, adequate understanding of anaerobic
biodegradation kinetics is imperative. Although, the anaerobic biodegradation kinetics of wastewater is
well established, it has been poorly developed for complex biomass due to various reasons.
Most of the models used for studying biodegradation kinetics are based on maximum specific growth
rate (μmax) which requires short retention time that is not feasible for the complex biomass. In addition,
the differentiation between bacteria volatile suspended solids and complex biomass volatile solids can
be very difficult [9, 10]. Also, most of the models currently in use are based on a soluble growth
limiting substrate whereas complex biomass exists in non-soluble form [11], in addition, the presence
of recalcitrant fractions in complex biomass can render some of the volatile solids unavailable for
bacteria, thus providing a false measure of the available substrate [11].
Most of the earlier available models used for anaerobic digestion did not account for the complex
nature of the natural feedstock material because the substrate was assumed to be homogenous and
biodegradable. However, in situations where models attempt to account for the nature of complex
feedstock, they were restricted to particular substrate such as liquid manure [12, 13], sewage sludge
[14] or biological waste [15].
Recently, the utilization of advance models which require extensive characterization of feedstock
utilized in anaerobic digestion has dominated literature. The anaerobic digestion model No. 1 (ADM 1)
[2] and the model developed by Angelidaki et al. [16] are examples of generalized models used for

Page 6 of 49
Accep
ted
Man
uscr
ipt
6
studying anaerobic digestion of complex and co-digested biomass respectively. These models are
rigorous and require large input parameters. Also, they are the most appropriate tool for studying the
operation and technology development of anaerobic process [1, 17].
For designing of anaerobic processes, simplified model are considered most appropriate [18, 1].
Although, the need for a two stage model comprising hydrolysis and uptake of hydrolyzed substrate has
been viewed by Batstone [1] as more appropriate for designing anaerobic processes, simplified
generalized models based on first order models involving single stage have predominantly been
employed in designing anaerobic system involving complex biomass. Recently, Linke [19] and Momoh
and Nwaogazie [2] applied a first order biogas yield model in sizing continuous stirred tank and batch
reactors respectively. In addition, the development of simplified kinetic models for more specific waste
such as, organic fraction of municipal solid waste (OFMSW) has been reported , however, these
simplified models were based on maximum specific bacteria growth rate (μmax) [20,21].
In this study, a set of simplified kinetic models has been formulated by applying the biogas yield
approach. This approach allows the estimation of various parameters such as recalcitrant fraction,
biodegradable fraction, biodegradability and maximum biogas production rate. The model predictions
have been assessed against the experimental biogas yield obtained by using representative samples of
complex biomass.

Page 7 of 49
Accep
ted
Man
uscr
ipt
7
2. Kinetic model development
The process of studying bacterial growth kinetics has been largely followed using the classical Monod
growth kinetic model [22]. Though, this model has been established to be more appropriate in
describing the growth process for pure culture utilizing homogenous substrates than for heterogeneous
culture utilizing heterogeneous substrate [11,23], significant amount of studies on the kinetics of
microbial growth and biodegradation involving mixed culture and complex substrates are still been
described using the Monod growth kinetic model [22].
The heterogeneous nature of bacterial and the complex nature of substrate utilized in this study
necessitated the consideration of other bacteria growth models such as the Moser’s growth model [22]
and its homologue, the Hill’s growth kinetic model as proposed by Liu [22] and other inhibition
models.
The model development involved the aggregation of hydrolysis/acidogenesis and acetogenesis/
methanogenesis processes, and the process of biogas production was assumed to comprise
(i)hydrolysis/acidogenesis by acidogenic bacteria to produce acidified substrate for the
acetogenic/methanogenic ; (ii) uptake of acidified substrate by acetogenic/methanogenic bacteria and
(iii) acidified substrate assimilation, growth and biogas production by the acetogenic /methanogenic
bacteria. In this modeling approach, the substrate utilization model of Grau’s [23] was used to describe
the kinetics of the first two steps, while the process of substrate assimilation and growth of the
acetogenic/methanogenic bacteria was studied by testing the Monod, Moser, Hill and Haldane’s growth
models.

Page 8 of 49
Accep
ted
Man
uscr
ipt
8
2.1 Modeling hydrolysis/acidogenesis and growth of the acidogenic bacteria
The process of modeling the hydrolysis step using the first order kinetic model as reported by Eastman
and Ferguson [24] has been described to be unsuitable for studying the digestion of complex biomass
of co-digested substrate or more complex biomass [25,26,27]. In order to provide an appropriate
description of the kinetics of hydrolysis, several researchers have modified the first order kinetic model
as developed by Eastman and Ferguson [24].
Sanders et al. [28] developed a surface based kinetic model to describe the disintegration of complex
substrate, however, this model failed to account for the recalcitrant fractions because it assumed the
entire substrate to be biodegradable. Modification of the Sander’s disintegration model was conducted
by Esposito et al. [26] to describe the disintegration of organic fraction of municipal solid waste co-
digested with sewage sludge. However, extensive characterization of complex biomass in terms of
various characteristics, such as particle size distribution, carbonhydrates, proteins, lipids and inert was
required for modeling the anaerobic process.
In this study, a simple substrate characterization model development was conducted that could provide
an estimate of the recalcitrant fraction of complex biomass. Hydrolysis and acidogenesis were lumped
together and they were assumed to be catalyzed by acidogenic bacteria releasing extracellular enzymes
that are adsorbed on the surface of the complex biomass. The model of Grau [22, 23, 29] represented
by Eq. (1a) which was subsequently modified as represented by Eq. (2) was adopted for modeling
hydrolysis/acidogenesis.
n
oasx
aa
S
S
Y
X
dt
dS!!!
!!!!
!!!!
!!!!
!!!
)(/
)()max(!
(1a)

Page 9 of 49
Accep
ted
Man
uscr
ipt
9
Where -dt
dS represents the rate of change of complex substrate, and S represent the concentration of
complex biomass volatile solids concentration remaining in effluent. So represents the initial complex
biomass volatile solid concentration, µmax (a) represents the maximum growth rate of acidogenic
bacteria, Xa represents the acidogenic bacteria concentration, while Yx/s (a) represents the acidogenic
bacteria biomass yield coefficient. However, in this study (X (a)) was assumed to be constant such that
Eq. (1a) could be re-written as
n
oaH S
SK
dt
dS!!!
!!!!
!!! )( Eq. (1b)
Where KH (a) is the maximum substrate utilization rate (g VSutilized/L/day) for the acidogenic bacteria
and “n” is the coefficient or degree of acidogenic bacteria adaptation for complex substrate
degradation. Vavilin et al. [25] emphasized the importance of considering the recalcitrant fraction of
complex biomass (Rf ) when modeling hydrolysis of complex biomass thus, upon considering the
recalcitrant fraction of complex biomass, Eq. (2) can be expressed as follows
n
o
foaH S
RSSK
dt
dS!!!
!!!!
! !!! )(
(2)
The term KH (a) is a measure of the maximum rate of volatile solids utilization by the acidogenic
bacteria to produce acidified substrate while, the term “n”, could be viewed as a measure of the degree
of volatile solids degradation by the acidogenic bacteria which, is largely dependent on the degree of
bacteria adaptation. When “n” equals unity, the bacteria enzyme concentration is assumed to be in
excess and the need for bacteria to adapt is not a pre-requisite for degradation. However, when “n” is
greater than unity, enzyme concentration is assumed to be low such that, adaptation of the
hydrolytic/acidogenic bacteria is a necessary pre-requisite for complex biomass degradation. The value

Page 10 of 49
Accep
ted
Man
uscr
ipt
10
of “n” less than unity implies a poorly adapted acidogenic bacteria population and as the value of “n”
approaches zero the reaction rate becomes independent of substrate concentration.
However, Eq. (2) can be expressed in terms of acidified substrate produced from the complex biomass
as follows
!!
!
!
!!
!
!!!!
!
!!!!
! !!
o
h
n
o
foaH
h
S
S
S
RSSK
dt
dS)(
(3)
Where hS represents the concentration of acidified substrate solubilized from the complex biomass. It is
worthy to note, that Eq. (3) is a modified form of the hydrolytic step as utilized by Barthakur et al. [11];
Faisal and Unno [30]; and Zinatizadeh et al. [31].
2.2 Uptake of acidified substrate by acetogenic/methanogenic bacteria
The uptake or utilization of the acidified substrate into acetogenic/methanogenic biomass was modeled
using the first order Grau’s substrate utilization model. In this modeling approach, uptake or utilization
rate was considered to be inversely proportional to the initial volatile solids concentration; and directly
proportional to the concentration of the active acetogenic/methanogenic biomass which was assumed
to be constant (X (a/m), g/L)[23]; and also directly proportional to the difference in concentration of the
acidified substrate generated by the acidogenic bacteria (Sh) and that remaining inside the cell of the
acetogenic/methanogenic bacteria biomass (Sh (i)), such that, the substrate utilization rate of the
acidified substrate by the acetogenic/methanogenic bacteria biomass can be represented by Eq. (4b –
4e).
dt
dS
dt
dS
dt
dS ihuhh )()( !! (4a)
Page 11 of 49
Accep
ted
Man
uscr
ipt
11
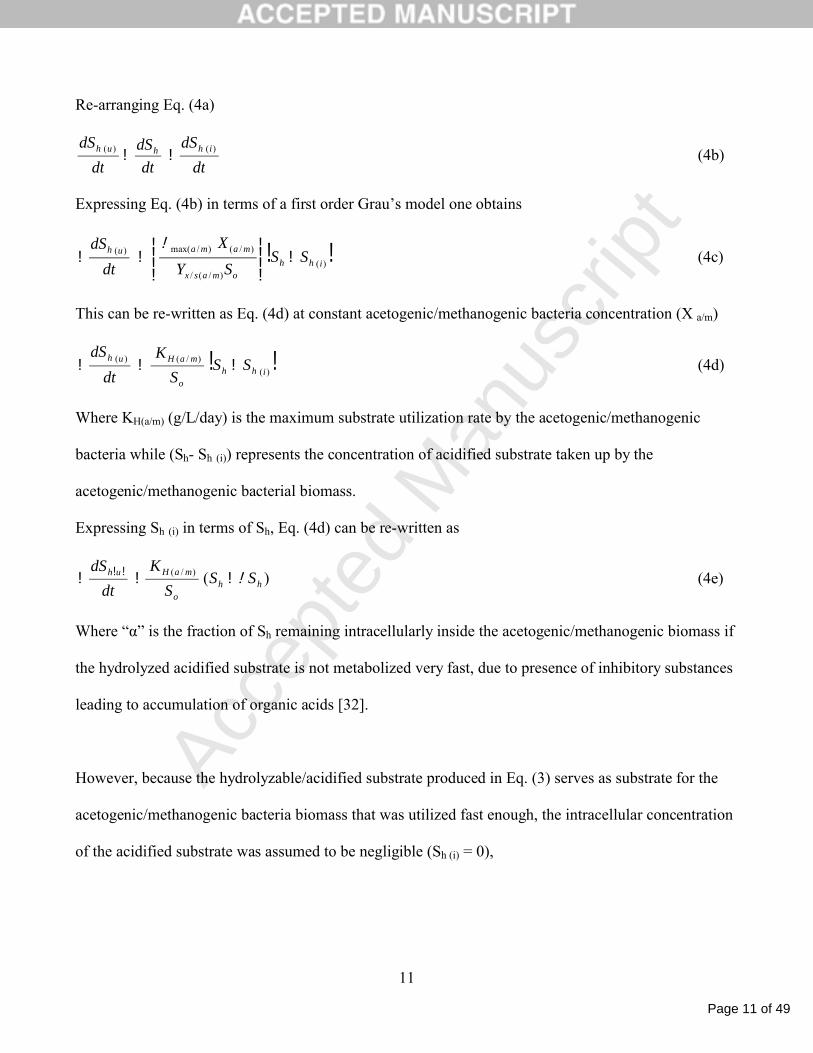
Re-arranging Eq. (4a)
dt
dS
dt
dS
dt
dS ihhuh )()( !! (4b)
Expressing Eq. (4b) in terms of a first order Grau’s model one obtains
! !)()/(/
)/()/max()(
ihhomasx
mamauhSS
SY
X
dt
dS!!
!!
!!!!
!!!
!(4c)
This can be re-written as Eq. (4d) at constant acetogenic/methanogenic bacteria concentration (X a/m)
! !)(
)/()(
ihho
maHuhSS
S
K
dt
dS!!! (4d)
Where KH(a/m) (g/L/day) is the maximum substrate utilization rate by the acetogenic/methanogenic
bacteria while (Sh- Sh (i)) represents the concentration of acidified substrate taken up by the
acetogenic/methanogenic bacterial biomass.
Expressing Sh (i) in terms of Sh, Eq. (4d) can be re-written as
! ! )()/(hh
o
maHuh SSS
K
dt
dS!!!! (4e)
Where “α” is the fraction of Sh remaining intracellularly inside the acetogenic/methanogenic biomass if
the hydrolyzed acidified substrate is not metabolized very fast, due to presence of inhibitory substances
leading to accumulation of organic acids [32].
However, because the hydrolyzable/acidified substrate produced in Eq. (3) serves as substrate for the
acetogenic/methanogenic bacteria biomass that was utilized fast enough, the intracellular concentration
of the acidified substrate was assumed to be negligible (Sh (i) = 0),

Page 12 of 49
Accep
ted
Man
uscr
ipt
12
Such that Eq. (4a) can be re-written as,
ho
maH
o
h
n
o
foaH S
S
K
S
S
S
RSSK )/(
)( !!!
!
!
!!
!
!!!!
!
!!!!
! ! (5)
Hence,
n
o
f
aHmaH
aHoh S
SRS
KK
KSS !!
!
!!!!
! !!!!
!!!!
!
!! 0
)()/(
)( (6a)
Expressing S as a function of the initial influent volatile solids concentration Eq. (6a) can be re-written
as
! !nf
aHmaH
aHoh Rb
KK
KSS !!
!!
!!!!
!
!!
)()/(
)(
(6b)
Where, b is the fraction of the initial substrate volatile solids concentration remaining in the effluent,
(that is, S = bSo)
Assuming faHmaH
aH AKK
K!
! )()/(
)(
(7)
Where Af, represents the rate limiting step coefficient or solubilization fractional efficiency for the
anaerobic process in which, the acidified substrate are metabolized very fast by the
acetogenic/methanogenic bacteria such that, uptake by the acetogenic/methanogenic bacteria is not
considered the rate limiting step. The rate limiting coefficient or solubilization fractional efficiency (Af)
can be viewed as a ratio between the maximum substrate utilization rate for production of acidified
substrate by the acidogenic bacteria to the sum of the maximum substrate utilization rate for both the
acidogenic and acetogenic/methanogenic bacteria population, such that, (Af) may be expected to range
from 0 -1.

Page 13 of 49
Accep
ted
Man
uscr
ipt
13
Thus, Eq. (6b) may be re-written as
! !nffoh RbASS !! (8)
The term (S – RfSo) represents the biodegradable substrate present in the volatile solids, however not
all of these fractions are hydrolysable for uptake by the acetogenic/methanogenic bacteria cells due to
environmental factors. Hence, (Sh) represent the actual amount of the substrate that was acidified and
utilized by the acetogenic/methanogenic bacteria.
However, conditions may exist where the substrate utilization rate by the acetogenic/methanogenic
bacteria become very slow such that the maximum substrate utilization rate by the acidogenic bacteria
for production of acidified substrate becomes higher than the maximum substrate utilization rate for
utilization of the acidified substrate by the acetogenic/methanogenic bacteria. For example, the acidic
nature of the acidified substrate produce in excess can lead to decrease in pH, because high production
of acidified intermediates can dissociate to produce protons which can compromise the neutral pH
conditions required by the methanogenic bacteria for optimum performance [33], such that, Sh (i) ≠ 0.
Thus, Eq. (8) can be expressed as Eq. (9) for very slow utilization of hydrolyzed acidified substrate by
the acetogenic/methanogenic bacteria.
! !! !n
faHmaH
aHoh Rb
KK
KSS !!
!!
!!!!
!
!!!
)()/(
)(
1 !(9)
Hence, the rate limiting coefficient for very slow substrate utilization of acidified substrate by the
acetogenic/methanogenic bacteria can be written as
! ! saHmaH
aH AKK
K!!
!!
!!!!
!
!! )()/(
)(
1 !(10)

Page 14 of 49
Accep
ted
Man
uscr
ipt
14
Where As is the rate limiting coefficient for very slow substrate utilization by the
acetogenic/methanogenic bacteria elicited by presence of inhibitors which could be the acidified
substrate in excess or other substances present in the acidified substrate.
It is worthy of note that, when the maximum substrate utilization rate for the acidogenic bacteria (KH(a))
is less than that of the maximum substrate utilization rate for the acetogenic/methanogenic bacteria
(KH(a/m)), the rate limiting coefficient becomes less than 0.5 thus, implying hydrolysis/acidification as
the rate limiting step. However, if the maximum substrate utilization rate for the acidogenic bacteria
(KH (a)) is greater than that of the maximum substrate utilization rate for the acetogenic/methanogenic
bacteria (KH(a/m)), the rate limiting coefficient becomes greater than 0.5, such that,
acetogenesis/methanogenesis is considered the rate limiting step. In addition, if the maximum substrate
utilization rate for the acidogenic bacteria (KH (a)) is equal to that of the maximum substrate utilization
rate for the acetogenic/methanogenic bacteria (KH(a/m)), the rate limiting coefficient becomes equal to
0.5.
2.3 Assimilation and growth of acetogenic/methanogenic bacteria
In modeling the assimilation and growth process of the acetogenic/methanogenic step, the growth
models of Monod, Moser, Hill, and Haldane were considered. Although, the growth model of Monod
has predominantly been used to describe growth processes for low substrate concentration, the
possibility of a Moser’s and more recently, the Hill’s growth model as proposed by Liu [22] to describe
growth kinetic at low substrate concentration had to be considered because of the complex nature of the
substrate and mixed culture of micro-organism. For growth processes affected by acidity of the
acidified substrate, the growth model of Haldane (Andrews) was employed [34]. Also for growth
process affected by the allosteric effectors present in the acidified substrate, the Haldane (Non-
competitive) model as described by Noykova et al. [35] was utilized to describe the growth process.

Page 15 of 49
Accep
ted
Man
uscr
ipt
15
The acetogenic/methanogenic bacteria have been reported to have a minimum doubling time of about
1-4 days [36], however, for the sake of simplicity, these bacteria were lumped together. The process
following assimilation of acidified substrate led to cell growth of acetogenic/methanogenic bacteria and
production of biogas (methane and carbondioxide). Similar process of lumping
acetogenic/methanogenic bacteria was reported by Vavilin et al. [37] and Vavilin and Angelidaki [38]
for modeling anaerobic digestion of solid waste.
The yield coefficient for biogas yield has been represented as
dS
dyY t
sy !/(11)
And, the yield coefficient for biomass production was represented as
dS
dXY ma
masx)/(
)/(/ !(12)
The Monod growth model for the acetogenic/methanogenic bacteria can be represented by
hS
hma
Sk
S
!! )/max(!
! (13)
But acetogenic/methanogenic bacteria growth rate can be represented as
)/( maXdt
dX!! (14)
However, the yield coefficient for acetogenic/methanogenic bacteria growth can be expressed as
)/(/ masxY
dt
dSdt
dX
!!!!
!!! !
!!!
!!!
(15)
Thus, substrate utilization rate can be represented as

Page 16 of 49
Accep
ted
Man
uscr
ipt
16
!!
!!!
!!!dt
dX
Ydt
dS
masx )/(/
1(16)
Hence, Eq. (16) can be re-written as
hS
hmama
masx Sk
SX
Ydt
dS
!!! )/max()/(
)/(/
1 !
(17)
Similarly, the yield coefficient for biogas yield by the acetogenic/methanogenic bacteria can be
represented as
sy
t
Y
dt
dSdt
dy
/!!!!
!!! !
!!!
!!!
(18)
Such that, the biogas yield rate can be represented as
dt
dSY
dt
dysy
t !!! /(19)
Substituting Eq. (17) into Eq. (19) one obtains
hS
hmama
masx
syt
Sk
SX
Y
Y
dt
dy
!! )/max()/(
)/(/
/ !(20)
It is important to note that the growth rate of the acetogenic/methanogenic bacteria was assumed to be
very slow or relatively constant such that )/(/
)/()/max(
masx
mama
Y
X! was replaced with the term KH (a/m), (g VS
utilized/L/day) which represent the maximum substrate utilization rate by the acetogenic/methanogenic
bacteria. Additionally, the death rate of the acetogenic/methanogenic bacteria ( kd, /day) was assumed
to be negligible due to the slow growth rate of these micro-organisms. Furthermore, the multiplication
of Yy/s ((mLbiogas/g VS)/(g VSutilized/L)) and KH (a/m) resulted in the maximum specific biogas yield rate

Page 17 of 49
Accep
ted
Man
uscr
ipt
17
(Rmax,) (mLbiogas/g VS/ day), while dt
dyt (mLbiogas/g VS/ day) can be described as the specific biogas
yield rate (R) at the end of biogas production.
Thus, Eq. (20) can be re-written as
hs
hmaHsy
Sk
SKYR
!! )/(/ (21)
Hence, by substituting Eq. (8) into Eq. (21) one obtains
! !! !n
ofs
nof
RbSAk
RbSARR
!!
!! max (22)
Eq. (22) can be use to describe the biogas yield rate from complex biomass considering acidified
substrate as limiting. However, Eq. (22) can be re-arranged so that the volatile solids apparently appear
to be the limiting substrate as represented by Eq. (23)
! ! onff
S
o
SRbA
kSR
R!
!
! max (23)
The term ks represent the Monod half saturation constant for the acidified substrate while ! !nff
s
RbA
k
!
represents the Monod half saturation constant in volatile solids equivalent which can be represented as
Ks.
Similar process was applied to develop the Moser’s based biogas yield rate model by assuming that the
growth process of the acetogenic/methanogenic bacteria can be described using the Moser’s growth
model represented by Eq. (24).

Page 18 of 49
Accep
ted
Man
uscr
ipt
18
mhS
mhma
Sk
S
!! /max!
! (24)
Thus, the Moser’s based biogas yield rate model becomes
(25)
Where, “m” represents the degree of acetogenic/methanogenic bacterial adaptation for cooperativity,
which should always be greater than unity (m >1) as described by Moser [22]. Again, the Moser’s
growth kinetic model can be re-arranged to appear as a Hill’s function as proposed by Liu [22]
represented by Eq. (26),
mh
mn
mhma
Sk
S
!! )/(max!
! (26)
The Hill’s based biogas yield rate model was developed as represented by Eq. (27) by following
similar derivation as conducted for the Monod based biogas yield rate
model.
! !m
onmf
mf
mn
mo
SRbA
k
SRR
!!
! max (27)
It is important to note that kn represents the Hill’s half saturation constant and ! !nff
n
RbA
k
! represents
the Hill’s half saturation constant in volatile solids equivalent which can be represented as Kn.
In cases where the acidic nature affects the utilization of acidified substrate, the Haldane’s (Andrews)
growth model [34, 39] represented by Eq. (27) was employed to describe bacteria growth.
! !m
onmf
mf
S
mo
SRbA
kSR
R!
!
! max

Page 19 of 49
Accep
ted
Man
uscr
ipt
19
i
hSh
hma
k
SkS
S2
)/max(
!!!
!! (27)
In this growth process, the acidic nature of acidified substrate may affect its metabolism such that
substrate utilization is slow but not necessarily the rate limiting step (Af) or very slow to become the
rate limiting step (As) .Thus, the Haldane’s (Andrews) based biogas yield rate model can be
represented by the Eq. (28).
! ! ! !! ! ! ! ! !! !
!!
!
!
!!
!
! !!
!!
!
i
nfsf
nfsf
So k
RbAS
RbA
kS
SRR
20
0max (28)
The Haldane (non-competitive) growth rate model assumes that the acidified substrate may non-
competitively affect growth process through allosteric mechanisms. Haldane (non-competitive) growth
rate model can be described by Eq. (29) [35, 40].
! ! !!!
!!!!
!!!
!
i
hSh
hma
k
SkS
S
1
)/max(!! (29)
In this form, the allosteric nature of the acidified substrate may affect its metabolism such that substrate
utilization is slow but not necessarily the rate limiting (Af) or very slow to become the rate limiting step
(As). Here, the affinity for the acidified substrate is not affected but its utilization is hindered
[41].Thus, the non-competitive Haldane based biogas yield rate model can be represented as
! ! ! !
! ! ! !! ! ! ! ! !!!
!
!
!!
!
! !!!!
!!
i
nfsfon
fsfoS
nfsfo
k
RbASRbASk
RbASRR
1
max (30)
The various model parameters were evaluated using the solver function of the Microsoft Excel tool Pak
and the most appropriate models were selected based as their high correlation coefficient and low root

Page 20 of 49
Accep
ted
Man
uscr
ipt
20
mean square error (RMSE). In situations where more than one model share similar correlation
coefficient and RMSE, the second-order Akaike’s information criterion (AICc) was employed to
compared these models [39, 42].
! !1
12log2
***
!!!
!!!!
!!!!
!!!
Kn
KK
n
SSnKAIC reg
C
(31)
Where regSS is the residual sum of square represented by ! !! ! 2)(xfdi and di is the experimental
data while )(xf is the estimated data of the fitted model [39]. The number of available points was
represented by *n , while, K represented the number of parameter to be estimated. When the difference
in AICc between two models is less the 2, no difference is believed to exist between the models thus,
both models could be used to represent the given data points [39].
3. Materials and methods
3.1 Substrate collection
The raw material utilized in this study comprised cow manure and waste paper. Cow manure was
obtained from abattoir situated at Choba Community, Rivers State (Nigeria) and waste paper was
obtained from dumpsites situated at the University of Port Harcourt, Rivers State Nigeria. About 500g
of cow manure was collected and sun dried at ambient temperature for a period of 20 days; it was
subsequently crushed using a mortar and pestle and about 500g of waste paper was sun dried which
was afterwards ground to fine particles using a grinding mill. The volatile solids content and carbon to
nitrogen ratio were determined according to APHA [43]. Volatile solids for cow manure and waste
paper were determined to be 66.1% and 85.7% respectively using a muffle furnace, Carbolite model
LMF 4 manufactured in England, and carbon to nitrogen ratio was determined to be 22:1 and 150:1
respectively.
Page 21 of 49
Accep
ted
Man
uscr
ipt
21
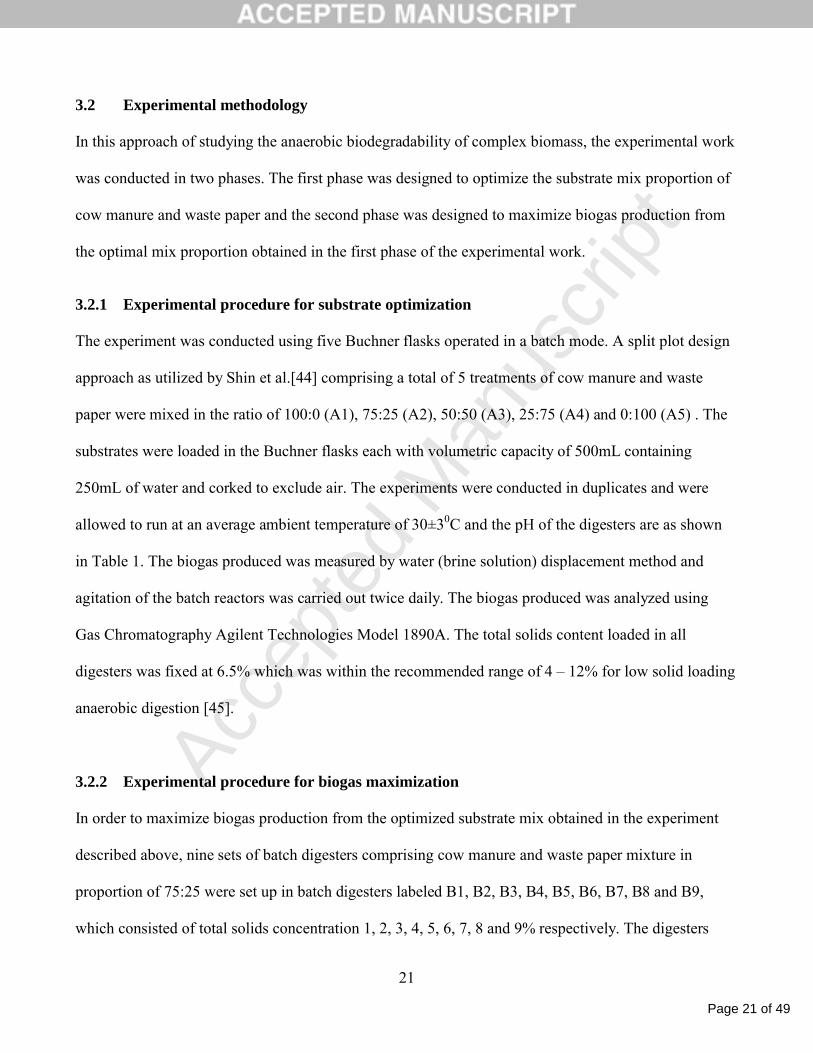
3.2 Experimental methodology
In this approach of studying the anaerobic biodegradability of complex biomass, the experimental work
was conducted in two phases. The first phase was designed to optimize the substrate mix proportion of
cow manure and waste paper and the second phase was designed to maximize biogas production from
the optimal mix proportion obtained in the first phase of the experimental work.
3.2.1 Experimental procedure for substrate optimization
The experiment was conducted using five Buchner flasks operated in a batch mode. A split plot design
approach as utilized by Shin et al.[44] comprising a total of 5 treatments of cow manure and waste
paper were mixed in the ratio of 100:0 (A1), 75:25 (A2), 50:50 (A3), 25:75 (A4) and 0:100 (A5) . The
substrates were loaded in the Buchner flasks each with volumetric capacity of 500mL containing
250mL of water and corked to exclude air. The experiments were conducted in duplicates and were
allowed to run at an average ambient temperature of 30±30C and the pH of the digesters are as shown
in Table 1. The biogas produced was measured by water (brine solution) displacement method and
agitation of the batch reactors was carried out twice daily. The biogas produced was analyzed using
Gas Chromatography Agilent Technologies Model 1890A. The total solids content loaded in all
digesters was fixed at 6.5% which was within the recommended range of 4 – 12% for low solid loading
anaerobic digestion [45].
3.2.2 Experimental procedure for biogas maximization
In order to maximize biogas production from the optimized substrate mix obtained in the experiment
described above, nine sets of batch digesters comprising cow manure and waste paper mixture in
proportion of 75:25 were set up in batch digesters labeled B1, B2, B3, B4, B5, B6, B7, B8 and B9,
which consisted of total solids concentration 1, 2, 3, 4, 5, 6, 7, 8 and 9% respectively. The digesters

Page 22 of 49
Accep
ted
Man
uscr
ipt
22
were setup as described by Momoh and Nwaogazie [3] and were also conducted in duplicates and
allowed to run at average ambient temperature of 28 C04! .
4. Results and Discussion
In the first phase, a retention time of about 40days was maintained in almost all the digesters studied,
and the mixture of cow manure and waste paper combined in the proportion of 75:25 (A2) produced
the highest quantity of biogas (921 12! mL) and the methane content was determined to be 58 3! % or
534.15±12mL of methane (Table 1). The batch digester comprising of cow manure alone (A1)
produced 421 10! mL of biogas with methane content of 52 2! % or 218.92±10mL of methane. The
digesters A3, A4, and A5 had insignificant quantity of methane in the biogas produced. The low
methane content in these digesters could be attributed to shock or instability due to high volatile acid
formation following the hydrolysis of waste paper. The high performance of digester A2 strongly
underscores the benefits of co-digestion in this study which may include reduced toxicity, nutrient
balance and microbial synergism [8].
Table 1: Digester Characteristics and Biogas Composition
In the second phase of the experiment, the process of maximizing biogas yield from this optimal mix of
cow manure and waste paper (75:25) determined in this study was conducted in nine (9) digesters that
comprised total solids ranging from 1 – 9%. After 80 days retention time, the biogas yield and specific
biogas yield rate were observed to increase as substrate concentration increased from 1-4%, but
remained almost steady for substrate concentration from 5 -9% (Fig. 1). However, digester B3
exhibited difficulty in producing significant amount of biogas and hence it was eliminated from the

Page 23 of 49
Accep
ted
Man
uscr
ipt
23
study. The longer retention time experienced in the second phase may be attributed to a reduced
average ambient temperature of 28 C04! .
Fig.1 – Biogas yield and specific biogas yield against total solids concentration.
4.1 Kinetics and biodegradability parameter estimation and model validation
The process of characterizing the optimal mix proportion of cow manure and waste paper (75:25)
involved the application the biogas yield rate models of Monod, Moser, Hill and Haldane’s models as
illustrated in this study. The kinetic and biodegradability parameters estimated in this study include;
(a) Monod half saturation constant for the acidified substrate (ks) (g/L).
(b) Monod half saturation constant in volatile solids equivalent (Ks) (g/L).
(c) Hill’s half saturation constant for the acidified substrate (kn) (g/L).
(d) Hill’s half saturation constant in volatile solids equivalents (Kn) (g/L).
(e) Maximum specific biogas yield rate (Rmax) (mL/g VS/day)
(f) The coefficient “m”
(g) The coefficient “n”
(h) Fraction of volatile solid remaining in effluent (b)
(i) The recalcitrant fraction (Rf).
(j) Fraction of biodegradable volatile solids (1-Rf)
(k) Fraction of biodegradable volatile solids remaining in effluent (b-Rf)
(l) Biodegradability (1-b)
(m) Rate limiting coefficient for fast or very slow uptake of acidified substrate (Af(s))

Page 24 of 49
Accep
ted
Man
uscr
ipt
24
The results of parameter estimation using non-linear regression are presented in Table (2). It was
observed that the five models tested in this study can be utilized to characterize anaerobic
biodegradation kinetics because each provided a high correlation coefficient (r) of 0.99. However, the
process of selecting the most appropriate model resided in the observance of the root mean square error
(RMSE). Models with the lowest root mean square error (RMSE) are normally considered more
appropriate to describe a given data set if they share similar correlation coefficient.
The five models tested in this study produced correlation coefficient (r) of 0.99 each, however, the
Moser and Hill’s based biogas yield rate models provided the lowest root mean square error (RMSE) of
5.87-E-03 each, while the Monod, Haldane (Andrews), Haldane (non-competitive) based biogas yield
rate models provided higher RMSE of 0.0428, 0.0256 and 0.0256 respectively. Thus, only the Moser
and Hill’s based biogas yield rate models were considered most appropriate in describing the specific
biogas yield rate from this biomass mixture because they provided the least RMSE.
However, because these selected models produced similar correlation coefficient (r) and RMSE, a
second-order Akaike’s information criterion (AICc) [42] was employed to assess model superiority.
Upon computation, the second-order Akaike’s information criterion analysis produced again, similar
AICc value of 97.33 each, for both models (Table 3) implying that, both models have the potential to be
utilized in studying the anaerobic biodegradation kinetics of this biomass mixture. Hence, subsequent
discussions were limited to the biogas yield rate models of Moser and Hill’s.
It is interesting to note that the Moser and Hill’s growth rate models which formed the basis for these
selected models could be described as homologues in which, the characteristic coefficient ‘m’(which is

Page 25 of 49
Accep
ted
Man
uscr
ipt
25
always greater than unity) differentiates them from the Monod growth models where “m” is equal to
unity. Moser considered this coefficient ‘m’ to be related more to adaptation of microbial population to
environmental condition through process of mutation [40] while Liu [22] proposed that the coefficient
may well be related to cooperativity among microbial species – substrate pairs. However, because
bacteria grown under substrate limiting conditions may tend to adapt through process of mutation by
modification at the phenotypic and genetic levels that may lead to improve transport for growth
limiting substrate and/or improve cooperativity among adapted microbial species [23] the views held
by these researchers may not be farfetched.
Table 2- Parameter estimate for developed biogas yield rate models
In essence, by choosing the Moser’s biogas yield rate model, the Monod half saturation constants for
the acidified substrate (ks) and the Monod half saturation constant in volatile solid equivalent (Ks) were
estimated to be 0.1558 and 1.637g/L respectively. This estimated Monod half saturation constant for
the acidified substrate (ks) compares reasonably with values of 0.143-0.207g/L reported byBarthakur et
al. [11] for half saturation constant for acetate by the methanogenic bacteria population. Also, the
estimated ks, lies within the range of 0.1- 0.41g/L reported by Pavlostathis and Giraldo‐Gomez [ 41] as
half saturation constant displayed by acetoclastic methanogens. Furthermore, the biodegradability
parameters estimated using this model revealed that the recalcitrant fraction in this biomass mixture
was 0.267 of the initial volatile solids fed, and the biodegradable fraction (1-Rf) was 0.733 of the initial

Page 26 of 49
Accep
ted
Man
uscr
ipt
26
volatile solids fed. The biodegradability (1-b) was 0.1925 while the biodegradable fraction remaining
(b-Rf) was 0.540 of the initial volatile solids fed at ambient temperature conditions. It is interesting to
note that the sum of the biodegradable fraction remaining at the end of experiment (b-Rf) and
biodegradability potential (1-b) must be equal to the biodegradable fraction of the feedstock volatile
solids (1-Rf).
However, by choosing the Hill’s based biogas yield rate model, the Hill’s half saturation constant for
the acidified substrate (kn) was estimated to be 0.2288. Although, no study exist in literature that has
applied the Hill’s growth model in studying the kinetics of bacteria growth after it was proposed by Liu
[22], the possibility of this type of kinetics cannot be overruled because the estimated Hill’s half
saturation constant (kn) seems to bear some semblance with the Monod half saturation constant (ks). In
addition, the Hill’s half saturation constant in volatile solid equivalents of 5.34gVS/L obtained in this
study compares reasonably to the value of 5g VS/L reported by Angelidaki et al. [46] for household
solid waste using the Monod growth model for the acetoclastic methanogens.
Moreover, the recalcitrant fraction (Rf) was estimated to be 0.371 which is close to 0.400 reported by
Barthakur et al. [11] and Hashimoto [47] for cow manure alone. In addition, the biodegradable fraction
(1-Rf) was calculated to be 0.628 of the initial volatile solids fed while the biodegradability (1-b) was
calculated to be 0.3136, and the biodegradable fraction remaining in the effluent (b-Rf) was calculated
to be 0.3154 of the initial volatile solids concentration.
Furthermore, both models seem to indicate certain degree of bacterial adaptation for substrate
degradation and cooperativity among the acidogenic and acetogenic/ methanogenic bacterial population
because “n” and “m” were greater than unity. The coefficients of adaptation for degradation by

Page 27 of 49
Accep
ted
Man
uscr
ipt
27
acidogenic bacteria (n) considering the Moser and Hill’s based biogas yield rate models were 1.732 and
1.360 respectively, while the coefficient of adaptation for cooperativity by the
acetogenic/methanogenic bacterial (m) was estimated to be 2.738 each for both the Moser and Hill’s
based biogas yield rate models. Because these coefficients were higher than unity, some degree of
bacterial adaptation and/or cooperativity was implied. Adaptation is a necessary biological process
associated with micro-organisms when grown under substrate limiting conditions [23].
In this study, the importance of the terms” n and m” cannot be overemphasized. The term “m” may be
defined as coefficient of adaptation for cooperativity by the acetogenic/methanogenic bacteria, while,
the coefficient “n” can be described as the degree of adaptation for complex biomass degradation by
the hydrolytic/acidogenic bacteria. Thus, consideration of bacteria adaptation for cooperativity “m”
amongst the acetogenic/methanogenic species and bacteria adaptation for complex substrate
degradation “n” amongst the hydrolytic/acidogenic bacteria species may contribute significantly in the
entire process of modeling biogas yield production rate from complex biomass.
In addition to the AICc for model selection , further improvement in model selection was conducted by
comparing the percent error between the graphically observed half saturation constant and the half
saturation constants in volatile solids equivalents estimated through the modeling approach. The half
saturation constant in volatile solids equivalent is described as the substrate volatile solids
concentration corresponding to 0.5Rmax.The corresponding saturation constants in volatile solids
equivalent are shown in Table 3 while, the combined curve fitting for the tested models is shown in
Fig. 2.
Fig.2- Combined graphs of specific biogas yield rate against volatile solids concentration
Table 3- Model selection technique showing AICc and Percent error for selected Models

Page 28 of 49
Accep
ted
Man
uscr
ipt
28
Upon comparison of the percent errors, it was observed that the Hill’s based biogas yield rate model
provided a lower percent error of 2.91% when compared to the 72.71% obtained from the Moser’s
based biogas yield rate model (Table 3). Thus, the Hill’s based biogas yield rate model may provide a
reasonable description of the half saturation constant in volatile solids equivalent (Kn) better than the
Moser’s based biogas yield rate model.
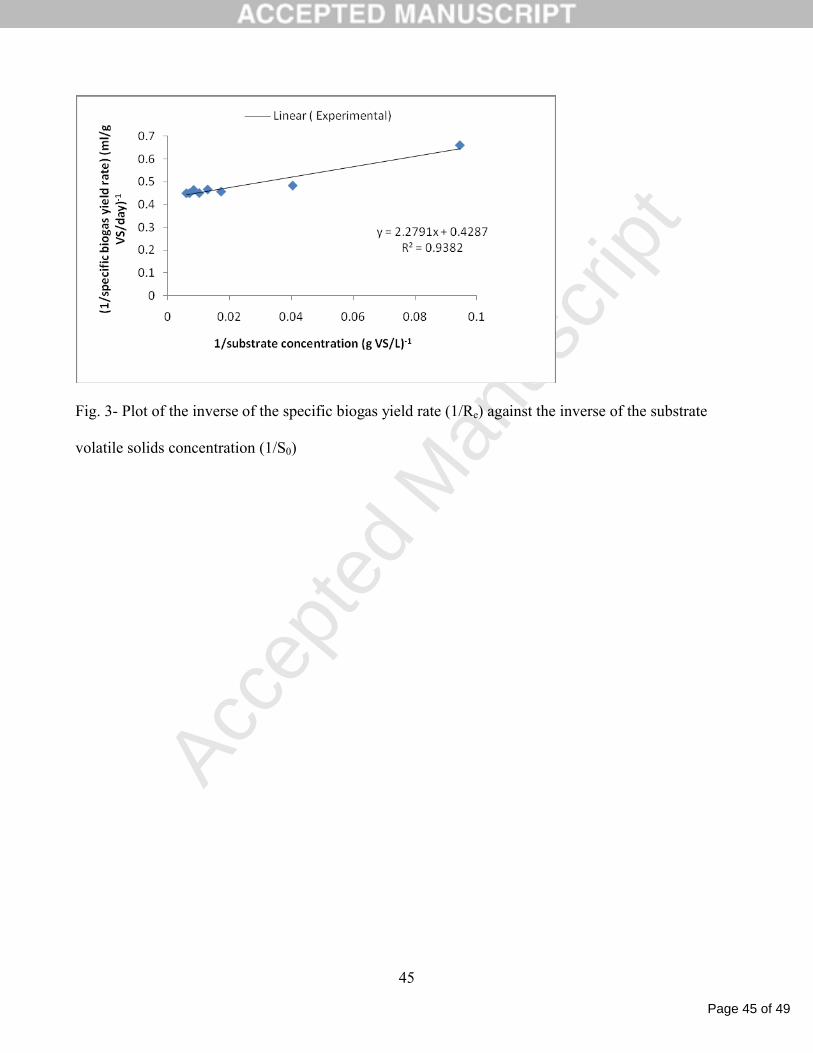
Moreover, the utilization of the linear plot similar to the so called “Lineweaver-Burks” encountered in
enzymology revealed that, the plot of the inverse of the specific biogas yield rate obtained at the end of
the experiment (1/Re) against the inverse of the initial substrate volatile solids concentration (1/S0)
yielded a linear curve fitting (Fig.3) with slope equal to (Kn/Rmax) and intercept equal to (1/Rmax). The
solutions for the maximum specific biogas yield rate (Rmax) and half saturation constant (Kn) were
2.3ml/ g VS/day and 5.2g VS/L respectively, which compare reasonably to that estimated by the Hill’s
based biogas yield rate model than for the Moser’s biogas yield rate model.
Fig. 3- Plot of the inverse of the specific biogas yield rate (1/Re) against the inverse of the substrate
volatile solids concentration (1/S0)
In essence, the Hill’s based biogas yield rate model may be viewed as most appropriate in studying
biogas production from this biomass mixture. By utilizing this model, the maximum specific biogas
yield rate estimated as 2.2 mL/g VS/day seem to compare reasonably with the value of 1.75mL/g
VS/day obtained by Budiyono et al. [48] from the digestion of cow manure alone at ambient
temperature while, the substrate concentration corresponding to this maximum biogas yield was

Page 29 of 49
Accep
ted
Man
uscr
ipt
29
observed at 70g VS/L. The high rate of biogas production from this mixture may be attributed to the
benefits associated with co-digestion which include the provision of effective buffering system,
nutrient balance, microbial synergism and reduction in toxicity linked with anaerobic digestion [8]. In
addition, the ability for the bacteria to adapt and cooperate in utilization of substrate may have strongly
influenced the rate of biogas production as highlighted in this study.
In general, it is important to note that the Contois and two phase kinetic models which can also be used
to model hydrolysis [24] were inapplicable in this study because these models are directly dependent
on bacteria biomass concentration which was not feasible to evaluate in the study due to the difficulty
involved in differentiating between bacteria biomass and complex biomass volatile solids. The
utilization of an nth-order model of Grau [22, 23, 29] as applied in this study enabled for the integration
of bacteria behavior into the nth power. Also, assimilation of acidified substrate and growth of
acetogenic/methanogenic bacteria was observed to be most appropriately described by the Hill’s
growth model as against the Monod’s growth model that was original developed for pure culture
utilizing homogenous substrate [23]. Thus, there may be need to consider the Hill’s growth model
during anaerobic degradation of complex biomass especially for co-digested complex substrates
especially where improved biogas yield has been reported [8].
4.2 Application of kinetic models
4.2.1 Appropriate replacement for first order models
The approach to modeling anaerobic digestion has been grouped into three broad categories by Tomei
et al. [17]. This includes simple substrate characterization models; intermediate substrate
characterization models and advance substrate characterization models. The simple substrate
characterization models do not distinguish between different components of the substrate into protein

Page 30 of 49
Accep
ted
Man
uscr
ipt
30
carbonhydrates, lipid etc., and they are the rate limiting type models. However, the advance substrate
characterization models require the substrate be characterized into carbonhydrates, proteins, lipids, etc.
before they can be utilized. In addition, the input parameters needed to implement these type of models
are usually numerous. Example of advanced type models include the models developed by Angelidaki
et al. [16] and Anaerobic Digestion Model No. 1 [2].
In this study, it is evident that a simple substrate characterization model has been developed that
describes biogas production from complex biomass. This modeling approach has the advantage of
providing sufficient information about the anaerobic digestion kinetics and the nature of substrate
undergoing anaerobic decomposition from very little input data. In addition, this approach eliminates
the need to quantify the viable bacteria biomass volatile suspended solids which is usually very
difficult to estimate for complex biomass [9] and a necessary requirement when utilizing the Contois
and the two phase base models [22].
Traditionally, the first order models which are examples of simple substrate characterization models
have largely been employed in the well known “biochemical methane potential” assay (BMP) and also
in the design of anaerobic systems to evaluate anaerobic biodegradability and plant design. Though,
first order models are easy to handle, they fail to provide any information about substrate concentration
required for maximum biogas production. However, with the modeling approach developed in this
study, the biochemical methane potential assay can be evaluated in a more holistic manner. In addition,
the substrate concentration corresponding to maximum biogas yield can easily be estimated thus,
contributing to the design and optimization of anaerobic process.

Page 31 of 49
Accep
ted
Man
uscr
ipt
31
4.2.2 Determination of carbon flux and the rate limiting coefficient (Af(s))
In a multi-step process, the step which limits or controls the rate of the overall process is called the rate
limiting step [41]. In anaerobic digestion with its multi- step processes, the hydrolysis is usually
assumed to be the rate limiting step in the anaerobic digestion of particulate or complex biomass [24],
and the methanogenesis step is considered to be the rate limiting step for the anaerobic digestion of
soluble substrates [40].
In this study, it was possible to utilize numeric values to approximate the rate limiting step such that the
identification of hydrolysis/acidogenesis step was less tedious as value of (Af) less than 0.5 confirmed
hydrolysis/acidogenesis as rate limiting step in the anaerobic digestion of the biomass mixture.
The Fig. 4 shows the effect of carbon flux on biogas yield rate, in which the fractional proportion of the
maximum biogas yield rate (R/Rmax) was plotted against the initial volatile solids concentration utilized
in this study (So).
.
Fig.4-Fractional proportion of the maximum biogas yield rate against the volatile solids
concentration for the Hill’s based biogas yield rate model.
It was observed that the volatile solids concentration within 30 – 70g VS/L may be appropriate for
maximizing biogas production while concentration below this range was observed to reduce biogas
production from this biomass mixture at ambient temperature. Furthermore, it can be observe that
conditions which tend to restrict hydrolysis that is, reduce the value of the rate limiting coefficient or
solubilization fractional efficiency (Af) ( such as, during the digestion of recalcitrant substrate) can
reduce fractional biogas production rates at low volatile solid concentration below 30g VS/L. On the

Page 32 of 49
Accep
ted
Man
uscr
ipt
32
other hand, conditions that tend to improve hydrolysis that is, increase the value of the rate limiting
coefficient (Af),( such as, during the digestion easy hydrolysable substrates or physiochemical pre-
treatment of complex biomass) can lead to an increased fractional biogas production rates at low
volatile solids concentration below 30g VS/L. These findings clearly explain why mechanical treatment
of complex biomass may tend to enhance biogas production [49, 50].
In general, the restriction or ease of carbon flow through the interlinked biochemical reactions may
play a crucial role in the determination of the rate limiting step and also, biogas production rate during
the anaerobic digestion of complex biomass. These findings tend to give credence to the works of
Pavlosthatis et al. [41] who reported that the rate limiting step may change depending on the nature of
substrate and other factors.
5. Conclusions
In this study, the co-digestion of cow manure and waste paper (75:25) was observed to result in an
increase in biogas production when compared to the digestion of these substrates alone. The process of
studying the kinetics and biodegradability of this optimal mixture revealed that the Hill’s based biogas
yield rate model was most appropriate in describing the biogas production from this mixture of
complex biomass. The developed Hill’s based biogas yield rate model was able to account for
adaptation by the acidogenic bacteria to degrade complex biomass (n) and also the adaptation for
cooperativity by the acetogenic/methanogenic species (m) to assimilate acidified substrate. The half
saturation constants obtained using this model showed comparable values to that obtained when acetate
was considered growth limiting. The biodegradability, biodegradable fraction and recalcitrant fraction

Page 33 of 49
Accep
ted
Man
uscr
ipt
33
were estimated to 0.3136, 0.628 and 0.371 respectively while, the rate limiting coefficient was
estimated to be 0.205 implying that, hydrolysis was rate the limiting step.
In general, this modeling approach seems to breach the gap between the simplified first order models
and the advance substrate characterization models, and it may provide more benefits in designing of
anaerobic systems as compared to the first order modeling approach. Additionally, the application of
the modeling approach in the biochemical methane potential assay may provide advanced information
about the biodegradability of biomass utilized in anaerobic digestion.
Acknowledgment
This research was support by the Petroleum Technology Development Fund Local Scholarship Scheme
(Grant Number PTDF/TR/LS/MOLY/215/54) Nigeria.
REFERENCES
[1] J.D. Batstone. Mathematical modelling of anaerobic reactor treating domestic wastewater:
Rational criteria for model use. Rev. Env.Sci. Bio/Tech. 5, (2006) 57-71
[2] J.D. Batstone, J. Keller, I. Angelidaki, S.V. Kalyuzhnyi, S.G. Pavlostathis, A. Rozzi, W.
T.M. Sanders, H. Siegrist, V.A. Vavilin. The IWA Anaerobic Digestion model No 1 (ADM1),
Water Sci. Technol. 45, 10 (2002) 65-73.

Page 34 of 49
Accep
ted
Man
uscr
ipt
34
[3] O.L.Y. Momoh, I.L. Nwaogazie, The effect of waste paper on the kinetics of biogas yield
from the co-digestion of cow manure and water hyacinth, Biomass Bioenergy, 35 (2011) 1345-
1351.
[4] H.B Moller, S.G. Sommer, B.K, Ahring, Methane productivity of manure, straw and solid
fractions of manure, Biomass Bioenergy 26 (2004) 485–495.
[5] D. P. M. Zaks, N Winchester, C. J. Kucharik, C.C. Bardford, S. Paltser, J. M. Reily
Contribution of Anaerobic Digesters of Emissions Mitigation and Electricity Generation under
U.S. Climate Policy. Environ Sci Technol, 45 (2010) 16, 6735-42
[6] R. Steffen, O. Szolar, R. Braun, Feed Stock for Anaerobic Digestion, Ad Nett Report
Anaerobic Digestion, Making Energy and Solving Modern Waste Problem. 2000
[7] J. A. Alvarez, L Otero, J. M. Lema A Method of Optimizing Feed Composition for
Anaerobic Co-digestion of Agro-Industrial Waste, Bioresource Technol. 101 (2010) 1153 –
1158.
[8] A. Cesaro, V. Naddeo, V. Amodio, V. Belgiorno, Enhanced biogas production from
anaerobic co-digestion of solid waste by sonolysis, Ultrason. Sonochem. 19, 3 (2012) 596-600.
[9] P. Shanmugam, N.J. Horan, Simple and rapid methods to evaluate methane potential and
biomass yield for a range of mixed solid wastes. Journal of Bioresource Technol. 100 (2008),
471-474.

Page 35 of 49
Accep
ted
Man
uscr
ipt
35
[10] P. Mahnert, B. Linke, Kinetic study of biogas production from energy crops and animals
waste slurry: effect of organic loading rate and reactor size, Environ. Technol. 30 (2009) 1, 93-
99
[11] A. Barthakur, M. Bora, H.D Singh, Kinetic model for substrate utilization and methane
production, in the anaerobic digestion of organic feeds. Biotechnol. Prog. 7 (1991) 369-376.
[12] D.T. Hill, .Simplified Monod kinetics of Methane fermentation of Animal wastes
Agricultural waste 5 (1983) 1-16.
[13] I. Angelidaki, L. Ellegaard, B.K. Ahring, A mathematical model for dynamic simulation of
anaerobic digestion of complex substrate: focusing on ammonia inhibition, Biotechol. Bioeng.
42 (1993) 159-166.
[14] H. Siegrist, D. Rengli, W. Gujer, Mathematical modeling of anaerobic mesophilic sewage
sludge treatment, Water Sci. technol. 27 (1993) 25-36.
[15] V.A. Vavilin, S.V. Rytov, L.Y Lokshina, S.G. Povalostathis, M.A. Barlaz, Distributed
models of solid waste anaerobic digestion: effects of leachate recirculation and pH adjustment,
Biotechnol. Bioeng. 81, (2002) 1, 66-73.
[16] I. Angelidaki, L. Ellegard, B.K. Ahring, A comprehensive model of anaerobic
bioconversion of complex substrates to biogas, Biotechnol. Bioeng. 63, (1999) 363-372.

Page 36 of 49
Accep
ted
Man
uscr
ipt
36
[17] M.C. Tomei, M.C. Braguglia, G.Cento, G, Mininni, Modeling of anaerobic digestion of
sludge. Critical Rev. Env. Sci. Technol. 39, (2009)1003-1051.
[18] W. T. M. Sanders, A. H. M. Veeken, G. Zeeman, J. B. Van Lier, Analysis and optimization
of the anaerobic digestion of the organic fraction of municipal solid waste. In: Mata Alvarez, J.
(ed.) Bio-methanization of the organic fraction of municipal solid wastes. London: IWA
Publishing (2003).
[19] B. Linke, Kinetic study of thermophilic anaerobic digestion of solid wastes from potato
processing, Biomass Bioenergy 30 (2006) 892-896.
[20] L.A. Fdez-Güelfo, C. Álvarez-Gallego, D. Sales, L.I. Romero García, Dry-thermophilic
anaerobic digestion of organic fraction of municipal solid waste: Methane production modeling,
Waste Management 32, (2012) 382-388.
[21] L.A. Fdez.-Güelfo, C. Álvarez-Gallego, D. Sales Márquez, L.I. Romero García, The effect
of different pretreatments on biomethanation kinetics of industrial Organic Fraction of
Municipal Solid Wastes (OFMSW) , Chemical Eng. Journal 171, (2011) 411-417.
[22] Y. Liu, A simple thermodynamic approach for derivation of a general Monod equation for
microbial growth, Biochem. Eng. Journal 31(2006) 102-105.

Page 37 of 49
Accep
ted
Man
uscr
ipt
37
[23] K . Kavarova-Kovar, T. Egli, Growth kinetics of suspended microbial cells from single-
substrate-controlled growth of mixed-substrate kinetics, Microbiol. Molecular Biol. Rev, 62
(1998) 3, 646-666.
[24] J.A Eastman, J. F Ferguson, Solubilization of Particulate Organic Carbon during the Acid
Phase of Anaerobic Digestion. Journal of Water Pollution Control Federation, 53 (1981) 352-
366.
[25]V.A. Vavilin , B. Fernandez , J. Palatsi , X. Flotats, Hydrolysis kinetics in anaerobic
degradation of particulate organic material: An Overview Waste Management 28 (2008) 939–
951
[26] G. Esposito, L .Frunzo, A .Panico, G. d'Antonio, Mathematical modeling of disintegration-
limited co-digestion of OFMSW and sewage sludge. Water Sci. Technol. 58, 7, (2008)1513-
1519.
[27] G. Esposito, L.Frunzo, A, Panico, F. Pirozzi, Modelling the effect of the OLR and
OFMSW particle size on the performances of an anaerobic co-digestion reactor, Process
Biochemestry, 46, (2011) 557-565.
[28] W.T.M.Sanders, M.Geerink, G. Zeeman, G. Lettinga, Anaerobic hydrolysis kinetics of
particulate substrates, Water Sci. Technol. 41,( 2000) 17-24.

Page 38 of 49
Accep
ted
Man
uscr
ipt
38
[29] J.K. Kim, B.R Oh, Y.N. Chun, S.W. Kim, Effect of temperature and hydraulic retention
time on anaerobic digestion of food waste, Journal of Biosci. Bioeng. 102, 4, (2006) 328-332.
[30] M. Faisal, H. Unno, Kinetic analysis of palm oil mill wastewater treatment by a modified
anaerobic baffled reactor, Biochem. Eng. 9 (2001) 25-31.
[31] A. A. L. Zinatizadeh, A. R Mahamed, G. D., Najafpour, M. Isa-Hasnain, H.
Nasrollahzadeh, Kinetic evaluation of palm oil mill effluent digestion in a high rate up flow
anaerobic sludge fixed film bioreactor. Process Biochemistry, 41 (2006) 1038-1046.
[32] Y. Chen, J. J. Cheng , K.S. Creamer, Inhibition of anaerobic digestion process: A review,
Bioresource Tech. 99, (2008), 4044-4064.
[33] L.R Droste, Theory and practice of waste water treatment John Wiley and Sons Inc.
USA(1997).
[34] B.Marrot A. Barrios-Marrtinez , P. Moulin N. Roche, Biodegradation of high phenol
concentration by activated sludge in an immersed membrane bioreactor, Biochem. Eng. Journal
(2006), 30, 174-183.
[35] N. Noykova, T.G. Muller, M. Gyllenberg, J. Timmer, Quantitative analyses of anaerobic
wastewater treatment processes: identifiability and parameter estimation. Biotechnol. Bioeng.
78, 1, (2001) 89–103.

Page 39 of 49
Accep
ted
Man
uscr
ipt
39
[36] D.Deublein, A.Steinhauser, Biogas from waste and renewable sources. 2nd. Ed. Weinhein:
Wiley –VCH Verlag GmbH & Co (2011).
[37] V. A. Vavilin, S.V. Rytov, L.Y. Lokshina, S.G. Pavlostathis, M. A. Barlaz Distributed
Model of Solid Waste Anaerobic Digestion, Effects of Leachate Recirculation and pH
adjustment, Biotech. Bioeng. 81, (2003), 1, 66-73.
[38] V. A.Vavilin, I.Angelidaki, Anaerobic degradation of solid material: importance of
initiation centers for methanogenesis, mixing intensity, and 2D distributed model.
Biotechnol.Bioeng. 89,(1), (2005), 113–122.
[39] A. Dotsch, J. Severin, W. Alt, E.A. Galinski, J.U. Kreft, A mathematical model for growth
and osmoregulation in halophilic bacteria, Microbiology, 154 (2008) 2956-69.
[40] M. Gerber, R. Span, An analysis of available mathematical models for anaerobic digestion
of organic substances for production of biogas, International Gas union Research Conference,
Paris (2008).
[41] S. G. Pavlostathis, E. Giraldo‐Gomez, Kinetics of anaerobic treatment: A critical review,
Critical Rev. Env. Control, 21, 5-6, (1991) 411-490.

Page 40 of 49
Accep
ted
Man
uscr
ipt
40
[42] K. P. Burnham, D. R. Anderson, Model selection and multimodel inference: a practical
information-theoretic approach, 2nd edn, New York: Springer-Verlag (2002).
[43] APHA, AWWA, WPCE, Standard Methods for the Examination of Water and Wastewater,
16th Ed. APHA, Washington D.C (1985).
[44] J.Shin, S. Han, K. Eom, S.Jung, S. Park, H. Kim, Predicting methane production potential
of anaerobic co-digestion of swine manure and food waste, Environ. Eng. Res.13 (2008) 2, 93-
97.
[45] G. Tchobanoglous, H.Theisen, S. Vigil, Integrated Solid Waste Management Engineering
Principle and Management Issues Mcgraw-Hill U.S (1993).
[46] I. Angelidaki, X. Chen, J. Cui, P. Kaparaju, L. Ellegaard, Thermophylic anaerobic
digestion of source-sorted organic fraction of household municipal solid waste; start up
procedure for continuously stirred tank reactor, Water Res. 40 (2006) 14, 2621–2628.
[47] A.G.Hashimoto, Methane from cattle waste: Effects of temperature, hydraulic retention
time, and influent substrate concentration on kinetic parameter (k), Biotechnol. Bioeng. 24, 9,
(1982) 2039-52
[48] I .N. Budiyono, S. Widiasa., Johari, Sunarso, The Kinetics of Biogas Production Rate from
Cattle Manure in Batch Mode. Inter. J. Chem. Biomol. Eng. 3 (2010) 1, 39-44.

Page 41 of 49
Accep
ted
Man
uscr
ipt
41
[49] L. Palmowski, J. Muller, Anaerobic degradation of organic materials-significance of the
substrate surface area, Water sci. and Technol. 47 (2003) 12, 231-238.
[50] J.P Delgenes, V. Penaud, R. Moletta, Pre-treatment for the enhancement of anaerobic
digestion of solid wastes. In: Mata-Alvarez, J. (Ed.), Biomethanization of the organic fraction of
municipal solid waste, IWA Publishing (2003).

Page 42 of 49
Accep
ted
Man
uscr
ipt
42
Fig.1 – Biogas yield and specific biogas yield against total solids concentration.

Page 43 of 49
Accep
ted
Man
uscr
ipt
43
Fig.4-Fractional proportion of the maximum biogas yield rate against the volatile solids
concentration for the Hill’s based biogas yield rate model.

Page 44 of 49
Accep
ted
Man
uscr
ipt
44
Fig.2- Combined graphs of specific biogas yield rate against volatile solids concentration
Page 45 of 49
Accep
ted
Man
uscr
ipt
45
Fig. 3- Plot of the inverse of the specific biogas yield rate (1/Re) against the inverse of the substrate
volatile solids concentration (1/S0)

Page 46 of 49
Accep
ted
Man
uscr
ipt
46
Table 1: Digester Characteristics and Biogas Composition
Digester Mix proportion
Weight of cow manure (g)
Weight of waste paper (g)
Conc. Volatile solids(g/L)
pH Cumulative biogas(mL)
CH4
(%)CO2
(%)
A1 100:0 17.40 0.00 46.00 7.3 04.0! 421 10! 52 2! 48±2
A2 75:25 13.05 4.35 49.36 7.3 02.0! 921 12! 58 3! 42±3
A3 50:50 8.70 8.70 52.80 7.2 03.0! 164 22! 10 3! 90±3
A4 25:75 4.35 13.05 56.20 7.2 04.0! 152 23! 9.0 3! 91±3
A5 0:100 0.00 17.4 59.64 7.1 03.0! 260 34! 12 3! 88±3

Page 47 of 49
Accep
ted
Man
uscr
ipt
47
Table 2- Parameter estimate for developed biogas yield rate models
Biogas yield rate models R
max
mL
/gV
S/da
y ks
g/Lkn
(g/L)ki
(g/L) ! !(g/L)
nff
SS
RbA
kK
!!
! !(g/L)
nff
nn
RbA
kK
!!
m n Rf b Af(s) RMSE
Monod based
2.358 0.127 - - 3.260 - - 1.484 0.266 0.649 0.161 4.28E-02
Moser’s based
2.200 0.155 - - 1.637 - 2.738 1.732 0.267 0.807 0.2762 5.87E-03
Hill’s based
2.200 - 0.228 - - 5.34 2.738 1.360 0.371 0.6864 0.205 5.87E-03
Haldane (Andrew)
based
2.732 0.268 - 20.230 5.123 - - 1.158 0.326 0.787 0.128 2.56E-02
Non-competitive
Haldane based
2.769 0.209 - 15.317 5.200 - - 1.718 0.282 0.775 0.1351 2.56E-02

Page 48 of 49
Accep
ted
Man
uscr
ipt
48
Table 3- Model selection technique showing AICc and Percent error for selected Models
Biogas yield rate
model
Equations Number of parameters
Observed (graphical)
Ks or Kn
(g/L)
EstimatedKs or Kn
(g/L)
AICC Percent error (%)
Monod’s based
! ! onff
S
o
SRbA
kSR
R!
!
! max6 3.500 3.200 - -
Moser’s based
! !m
onmf
mf
S
mo
SRbA
kSR
R!
!
! max7 6.000 1.637 97.33 72.71
Hill’s based
! !m
onmf
mf
ms
mo
SRbA
k
SRR
!!
! max7 5.500 5.340 97.33 2.91
Haldane (Andrews)
based
! ! ! !! ! ! ! ! !! !
!!!
!!!!
! !!
!!
!
i
nfsf
nfsf
So k
RbAS
RbA
kS
SRR
20
0max7 4.000 5.123 - -
Non-competitive (Haldane)
! ! ! !
! ! ! !! ! ! ! ! !!!!
!!!!
! !!!!
!!
i
nfsfon
fsfoS
nfsfo
k
RbASRbASk
RbASRR
1
max7 4.000 5.200 - -

Page 49 of 49
Accep
ted
Man
uscr
ipt
49
Highlights! ! Co-digesting cow manure and waste paper (75:25) optimized biogas.! ! Hill’s based biogas yield rate model described experimental data.! ! Half saturation constant was estimated as 0.228g/L.! ! Biodegradable and recalcitrant fractions were 0.628 and 0.371 respectively.