Development of a precast concrete barrier wall system for ... Journal/2014/Winter... · Shah et...
20
83 PCI Journal | Winter 2014 T he use of prefabricated elements and systems in bridge construction has gained interest among transportation authorities. Through mass production of the materials, repeated use of forms, and reduction of on-site construction time and labor, significant economic benefits can be achieved. Aging bridges may require repair, rehabilitation, or replacement, which in most situations is time consuming and costly. Work zone safety and traffic disruptions are also major concerns. A full-lane closure is costly on large, busy urban highways because of the dis- ruption to commercial and industrial activities. As a result, precast concrete is a potential solution. Precast concrete elements and systems can be quickly assembled, reduce the effects on the environment in the vicinity of the site, and minimize delays and inconvenience to the traveling public, saving time and taxpayers’ money. Even at a higher initial cost, the use of prefabricated systems on bridges subjected to high volumes of traffic may be justified be- cause excessive lane closure times can be avoided and the marginal cost of fixed-shape formwork diminishes over the long term. Shah et al. 1,2 proposed the use of a prefabricated bridge system made of deck bulb-tee girders for bridge replace- ment in Ontario. In this system, the concrete deck slab is cast integrally with the prestressed concrete I-girder in a controlled environment at the fabrication facility and then ■ This paper presents a connection detail for precast concrete barrier walls to expedite construction and minimize traffic dis- ruption; improve work-zone safety, quality, and constructability; and reduce life-cycle cost. ■ The proposed precast concrete barrier is connected to the deck slab using pretensioned threaded steel rods. Vertical joints between adjacent precast concrete barriers maintain barrier continuity under vehicle impact. ■ Five full-scale barrier models were fabricated and tested to col- lapse to examine their ultimate capacities and crack patterns. ■ The results show that the proposed precast concrete barrier system is as good as the cast-in-place concrete barrier with respect to ultimate load-carrying capacity at the deck slab–bar- rier connection. Development of a precast concrete barrier wall system for bridge decks Gaurang Patel, Khaled Sennah, Hossein Azimi, Clifford Lam, and Reza Kianoush
Transcript of Development of a precast concrete barrier wall system for ... Journal/2014/Winter... · Shah et...
83PCI Journal | Winter 2014
The use of prefabricated elements and systems in bridge construction has gained interest among transportation authorities. Through mass production
of the materials, repeated use of forms, and reduction of on-site construction time and labor, significant economic benefits can be achieved. Aging bridges may require repair, rehabilitation, or replacement, which in most situations is time consuming and costly. Work zone safety and traffic disruptions are also major concerns. A full-lane closure is costly on large, busy urban highways because of the dis-ruption to commercial and industrial activities. As a result, precast concrete is a potential solution. Precast concrete elements and systems can be quickly assembled, reduce the effects on the environment in the vicinity of the site, and minimize delays and inconvenience to the traveling public, saving time and taxpayers’ money. Even at a higher initial cost, the use of prefabricated systems on bridges subjected to high volumes of traffic may be justified be-cause excessive lane closure times can be avoided and the marginal cost of fixed-shape formwork diminishes over the long term.
Shah et al.1,2 proposed the use of a prefabricated bridge system made of deck bulb-tee girders for bridge replace-ment in Ontario. In this system, the concrete deck slab is cast integrally with the prestressed concrete I-girder in a controlled environment at the fabrication facility and then
■ This paper presents a connection detail for precast concrete barrier walls to expedite construction and minimize traffic dis-ruption; improve work-zone safety, quality, and constructability; and reduce life-cycle cost.
■ The proposed precast concrete barrier is connected to the deck slab using pretensioned threaded steel rods. Vertical joints between adjacent precast concrete barriers maintain barrier continuity under vehicle impact.
■ Five full-scale barrier models were fabricated and tested to col-lapse to examine their ultimate capacities and crack patterns.
■ The results show that the proposed precast concrete barrier system is as good as the cast-in-place concrete barrier with respect to ultimate load-carrying capacity at the deck slab–bar-rier connection.
Development of a precast concrete barrier wall system for bridge decks
Gaurang Patel, Khaled Sennah, Hossein Azimi, Clifford Lam, and Reza Kianoush

Winter 2014 | PCI Journal84
• It may be installed at any time of the year subject only to restrictions on precipitation and temperature limita-tions for the cement grout to harden.
• Because the barrier is factory made, labor-intensive installation of reinforcement in the field is eliminated.
• No expensive barrier forms are needed.
• The precast concrete barrier wall can be connected with the existing deck slab by drilling through the deck slab to anchor the threaded rods to the deck using end plates, washers, and nuts.
• The joint between barrier and deck slab should not leak water on traffic under the bridge, which can be prevented by imposing bearing pressure at their inter-face using anchor posttensioning.
• Prestressed connecting rods through the joint limit the ingress of salt and water to anchor rods, bottom plates, and nuts.
This investigation resulted in a barrier wall system (Fig. 1 and 2) in which barrier walls of 3 m (10 ft) segments were fabricated in the precast concrete plant and shipped to the bridge site. The proposed barrier wall was intended to meet the criteria for Canadian Highway Bridge Design Code (CHBDC)4 performance level 3 (PL-3), representing the majority of bridge barriers in Ontario highways. The ge-ometry of the proposed PL-3 precast concrete barrier wall was similar to the cast-in-place concrete barrier specified
shipped to the bridge site. This system requires a closure strip to be placed on-site between the precast concrete gird-ers to make it continuous for live load distribution. Shah et al. developed and tested to collapse a number of connection details between the flanges of the precast concrete deck bulb-tee girders. In continuation of these efforts to acceler-ate the construction of new bridges and the replacement of deteriorated bridges, a precast concrete barrier wall system was developed and tested to collapse.3 This paper presents a summary of the structural details of the proposed precast concrete barrier system, fabrication process, and results of static load tests to collapse on five barrier configurations. A comprehensive literature review of previous work on barrier wall joints and barrier-to-deck joints is presented elsewhere.3
Description of the proposed precast concrete barrier wall system
The proposed barrier wall system is expected to have the following advantages:
• Precast concrete barriers are certain to have better appearance and quality than cast-in-place concrete barriers.
• Bridge barrier walls can be installed in as little as one day.
• No protruding reinforcing cages or shear keys interfere with the finished bridge deck surface.
Figure 1. Proposed precast concrete barrier wall. Note: HSS = hollow structural section. 1 mm = 0.0394 in.
85PCI Journal | Winter 2014
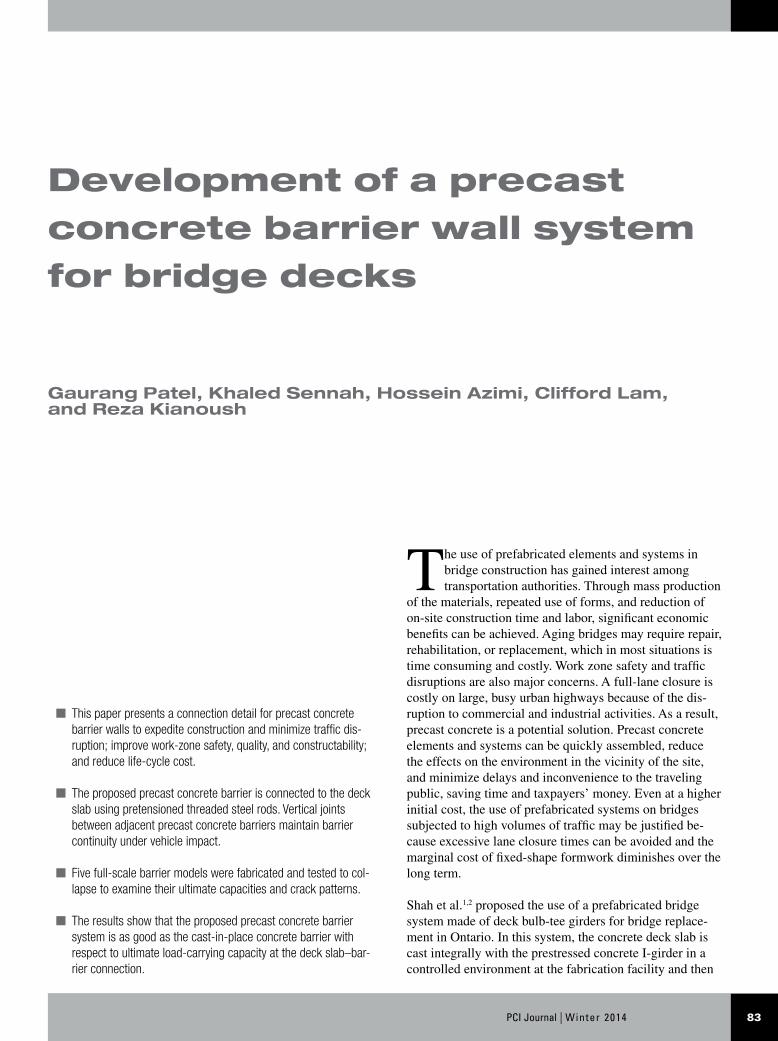
to fill the gap between the threaded rod and the sleeve. Finally, the concrete recesses at the top of the precast con-crete barrier wall (Fig. 1) were grouted.
Figure 2 shows the proposed vertical joint between precast concrete barrier wall segments. In this case, a hollow struc-tural shape (HSS) 102 × 102 × 9.5 mm (4 × 4 × 3⁄8 in.) tube was embedded at one end of the barrier wall segment, with four shear studs welded to it to provide anchorage resistance with concrete. On the adjacent precast concrete barrier wall segment, an S75 × 11 (S3 × 7.5) steel member was embedded halfway into the con-crete with a similar arrangement of shear studs to that of the HSS. To activate the joint resistance, one barrier wall segment was laid over the deck slab. Then the adjacent barrier wall with the S-shaped steel beam was laid over the deck slab vertically so that the projecting portion of the S-shaped member slides through a vertical slot in the HSS skin embedded in the other barrier wall edge (section b-b in Fig. 2). The HSS was then filled with concrete grout to fix it in place, enhancing the rigidity and continuity of the barrier-to-barrier vertical joint to resist vehicle impact.
Background of barrier design
The design of traffic and bridge barrier walls specified in the CHBDC is based on the American Association of State High-way and Transportation Officials’ AASHTO Guide Specifica-tion for Bridge Railings6 and the AASHTO Guide for Select-ing, Locating and Designing Traffic Barriers.7 The CHBDC specifies that barriers should be crash tested to comply with the requirements of a specific performance level. However, barrier-deck systems are subject to static load testing to collapse to qualify the barrier-deck anchorage in lieu of crash testing.
in the Ontario Ministry of Transportation Structural Man-ual.5 However, the surface between the barrier wall and the deck slab was flat and horizontal. The depth of the barrier wall from the top of the wall to the top of the concrete deck slab was 1140 mm (45 in.), including 1050 mm (41 in.) net depth over the 90 mm (3.6 in.) thick asphalt layer. The bot-tom and top widths of the barrier wall were 475 and 225 mm (18.7 and 8.86 in.), respectively. A corrugated steel sleeve was embedded in the precast concrete slab at an angle equal to the slope of the top inclined portion of the inner face of the barrier (Fig. 2). A similar corrugated steel sleeve was embedded in the concrete deck slab, aligned with the sleeve embedded in the barrier. A spacing of 600 mm (24 in.) between sleeves was proposed.
After hardening of the deck slab, an overlay of 25 mm (1 in.) concrete grout was introduced over the concrete deck slab edge with a width equal to the barrier width. Barrier segments were then laid over the deck slab edges, with the centerlines of the sleeves aligned so that 25 mm diameter threaded steel rods could be inserted. The threaded rods were then bolted from the top of the barrier wall and at the bottom of the deck. A torque was applied to the top nuts to provide an initial ten-sion in the threaded rod and compressive stress at the contact surface between the barrier wall and the slab. This limits water leakage onto traffic under the bridge.
To increase shear resistance, the top surface of the concrete deck slab was scratched parallel to the direction of traffic. For a similar surface on the bottom of the precast concrete barrier wall, timber strips can be nailed inside the form (Fig. 2). After tensioning the threaded rods to the desired level, concrete grout was inserted from a hole in the top steel plate on the side of the top nut (detail A in Fig. 2)
Figure 2. Structural details of proposed precast concrete barrier wall connections. Note: Dimensions are in millimeters unless otherwise noted. HSS = hollow struc-tural section. 1 mm = 0.0394 in.
50
9025
080
0
225
80170
104150
150 x 150 x 19 mm steel bearing plate (Detail A)
75-mm-internal-diameter corrugated sleeve
25-mm-diameter through posttensioned threaded rod
25-mm-thick cement grout
150 x 150 x 19 mm square steel bearing plate
225
75 34.5
75150
150(Detail A)
25 mm hole
600
225
25
990
150
Deck slab
Right barrierLeft
barrier
bb
a a
HSS 102 x 102 x 9.5S 75 x 11
Steel studs
Section b-b
Section a-a
Barrier-to-deck slab connection Barrier-to-barrier wall connections

Winter 2014 | PCI Journal86
considered in design:
• one-way flexural failure of the barrier wall at the bar-rier wall–deck slab joint
• punching shear or pull-out failure of the anchor rods embedded in the deck slab
• fracture of the tensioned rod
• two-way slab failure similar to AASHTO LRFD speci-fications’ yield-line failure patterns
Accordingly, models M1 to M5 (Fig. 3) were erected. Model M1 was intended to examine the flexural ca-pacity of the connection between the precast concrete barrier wall and the concrete deck slab as well as the punching shear capacity of the threaded rod–steel plate connection embedded in the concrete deck slab. Also, this model would examine the flexural capacity of the one-way action of the joint between the two inclined surfaces of the inner face of the barrier wall. Figure 4 presents a cross section of the proposed barrier wall sys-tem and shows the arrangement of the reinforcing steel in the barrier wall. The barrier was 1200 mm (47 in.) long to accommodate two threaded rods with 600 mm (24 in.) spacing.
Model M2 was a control specimen representing the monolithic cast-in-place reinforced concrete barrier wall used in Ontario bridges for performance level 3 (PL-3). The amount of wall reinforcement, both vertically and horizontally, was identical to that used in model M1. However, the vertical reinforcement in model M2 was extended into the deck slab to provide concrete anchor-age. Figure 5 presents the details of the reinforcement in the barrier wall and deck slab for model M2. Both models M1 and M2 were loaded laterally at 990 mm (39 in.) above the top surface of the deck slab using a line load length of 1200 mm (47 in.) (Fig. 3).
Model M3 was intended to examine the overall perfor-mance of the barrier wall segment when connected to the cantilever part of the concrete deck slab, simulat-ing the case of slab-on-girder bridges. Figure 6 shows model M3 with 900 mm (35 in.) projecting deck slab cantilever length. It also shows the layout of the rein-forcing bars and the threaded rods over the 3000 mm (118 in.) long barrier segment. This barrier model was loaded over a 200 mm (8 in.) square area centered at the midlength of the barrier and 990 mm (39 in.) above the top surface of the deck slab (Fig. 3).
Model M4 was identical to model M3, but without the cantilever slab. Model M4 was intended to examine the overall performance of the barrier wall segment with respect to yield-line pattern when the barrier wall
The initial design of the proposed PL-3 precast concrete bridge barrier met the CHBDC design criteria for static loading. CHBDC specifies transverse, longitudinal, and vertical loads of 210, 70, and 90 kN (47, 16, and 20 kip), respectively, that can be applied simultaneously over a certain barrier length. The transverse load is applied per CHBDC over a length of 2400 mm (94 in.) for PL-3 barri-ers. Because the transverse loading per meter length of the barrier is the critical design load case, neither longitudinal nor vertical load was considered in the design of the barrier wall reinforcement and anchorages between the deck slab and the barrier wall.
The punching shear capacity of the threaded rod embed-ded in the concrete deck slab was calculated using different North American codes and as reported in the literature.4,8–10 The three possible failure criteria of the threaded rod embedded into the concrete deck slab specified in appendix D of CSA-A23.3-049 were also considered in the design: tensile capacity of the steel rod, concrete breakout of the embedment, and concrete pryout capacity. For durabil-ity, the threaded rods were tensioned to provide sufficient precompressive stress (bearing pressure) at the precast concrete barrier–deck slab interface to prevent water leak-age. This was achieved by limiting the actual tensile stress at the barrier front face at barrier-deck interface to the allowable tensile stress limit specified in CHBDC at the serviceability limit state.
Yield-line analysis was conducted to determine the ultimate flexural capacity of the concrete components as specified in the AASHTO LRFD Bridge Design Specifica-tions.8 In the analysis, it was assumed that the yield-line failure pattern occurs within the barrier wall and does not extend into the deck slab. This means that the deck slab must have sufficient resistance to force the yield-line fail-ure pattern to remain within the barrier wall. AASHTO LRFD specifications’ yield-line analysis is also based on the assumption that the barrier wall is long enough to result in the desired yield-line failure pattern. For short barrier walls, a single yield line may form along the bar-rier wall–deck slab joint. Sennah et al.3 present detailed calculations for the design of the proposed precast con-crete barrier system.
Experimental program
Based on the information obtained from the literature, a precast concrete bridge barrier wall system with preten-sioned rods was developed. To verify and substantiate the design procedure, five full-scale barrier wall models were fabricated and tested to collapse.
Barrier models
The rationale for the selection of these bridge model configurations was based on the possible failure modes

87PCI Journal | Winter 2014
was loaded at midlength. In this case, the slab was laid over the laboratory floor to prevent vertical deflection, simulating a barrier wall connected to a thick slab or voided-slab bridge superstructure. However, model M3 was intended to simulate the flexibility effect of the slab cantilever on the structural performance of the barrier wall. Figure 6 shows the side view of the reinforcement and load location for model M3, which was also the same for model M4. However, the barrier-deck cross section for model M4 was similar to that for barrier model M1 (Fig. 4). Barrier model M4 was loaded at midlength similar to model M3.
Model M5 was identical to model M4, except that the lat-eral load was applied at the end of the barrier wall (Fig. 7). The purpose of this barrier model was to examine the flex-ural capacity and the yield-line pattern under edge loading. For all models except model M3, the barrier wall was con-nected to a 225 mm thick (9 in.) concrete deck slab resting directly on the laboratory floor with its end tied to the laboratory floor to prevent uplift during testing. For model M3, the cantilever portion of the slab had a 225 mm thick-ness and a 900 mm (35 in.) net length, with a slab portion that was 375 mm (15 in.) thick and 600 mm (24 in.) wide resting on and tied to the laboratory floor (Fig. 8).
Model M5 (end loading)
Barrier length: 3.0 m.Load type: patch loadConnection to deck: pretensioned rodsDeck slab: flat
Model M3 (central loading)Barrier length: 3.0 mLoad type: patch loadConnection to deck: pretensioned rodsDeck slab: cantilever portion
Model M3Barrier length: 1.2 mLoad type: horizontal line loadConnection to deck: pretensioned rodsDeck slab: flat
Model M2Barrier length: 1.2 mLoad type:horizontal line loadConnection to deck: As for cast-in-place barrierDeck slab: flat
Model M4 (central loading)Barrier length: 3.0 mLoad type:patch loadConnection to deck: pretensioned rodsDeck slab: flat
Figure 3. Schematic of tested barrier models with applied load locations. Note: 1 m = 3.28 ft.

Winter 2014 | PCI Journal88
Material properties
The design of the barrier walls dictated using 15M (no. 5) reinforcing steel as the main vertical reinforcement spaced at 165 mm (6.5 in.) center to center and as distri-bution (longitudinal) reinforcement spaced at 240 mm (9.5 in.) center to center in a staggered manner. The deck slab was reinforced with top transverse bars of 20M (no. 6) spaced at 100 mm (4 in.) center to center, while the bottom transverse bars and all distribution (longitudinal) rein-forcement was 15M bars spaced at 250 mm (10 in.) center
to center. The 165 mm spacing between vertical bars could not be maintained with the 75 mm (3 in.) diameter sleeves at 600 mm (24 in.) spacing in the precast concrete barrier wall. The 135 mm (5.3 in) spacing was used only for reinforcement between sleeves to maintain the amount of reinforcement required for wall strength. Figures 4 to 6 show these details. The mild reinforcing steel bars had a specified yield strength of 400 MPa (58 ksi). The galva-nized corrugated metal sleeve had an internal diameter of 75 mm and was embedded in the concrete deck slab and the barrier wall segments at 600 mm spacing to provide holes
Figure 4. Details of barrier model M1. Note: Dimensions are in millimeters unless otherwise noted. 15M = no. 5; 20M = no. 6; 1 mm = 0.0394 in.
322
560
15M at 165 mm center to center
15M at 240 mm center to center
20M at 100 mm center to center
300 600 300
135
11401140
15M at 250 mm center to center
Line load strike
Section between rod locations Section at rod location Side view of barrier reinforcement
Figure 5. Details of barrier model M2. Note: Dimensions are in millimeters unless otherwise noted. 15M = no. 5; 1 mm = 0.0394 in.
475
1200
225 1200
15M at 165 mm center to center
15M at 240 mm center to center both sides
1140
225
Line load strike
20M at 100 mm center to center
15M at 250 mm center to center
Barrier cross section Side view of barrier reinforcement

89PCI Journal | Winter 2014
and M5, respectively. Concrete cylinders were tested in accordance with ASTM C39.11 A ready-mixed cement grout with a specified strength of 35 MPa (5100 psi) was used to fill the sleeves after tensioning the threaded rods. Three 50 mm (2 in.) cubes were cast during grouting and then tested after hardening. Results of average cube compressive strength at the date of the testing were 50,
for the threaded rods to go through the entire depth of the barrier wall system. Figure 9 shows these galvanized sleeves.
The compressive strengths of the concrete at the date of testing were 35, 32, 32, 32, and 28 MPa (5100, 4600, 4600, 4600, and 4100 psi) for models M1, M2, M3, M4
Figure 6. Details of barrier model M3. Note: PVC = polyvinyl chloride. Dimensions are in millimeters unless otherwise noted. 15M = no. 5; 20M = no. 6; 1 mm = 0.0394 in.
15M at 100 mm center to center
Embedded PVC pipe, 50-mm-outside-diameter at 600 mm center to center
50
225
150
9006001500
375
20M at 100 mm center to center
150
600 600 293
442
150
150
600600293
442
150
2985
200
200
990
150 Load strike
Section at rod location Section between rod locations
Side view of barrier reinforcement
Winter 2014 | PCI Journal90
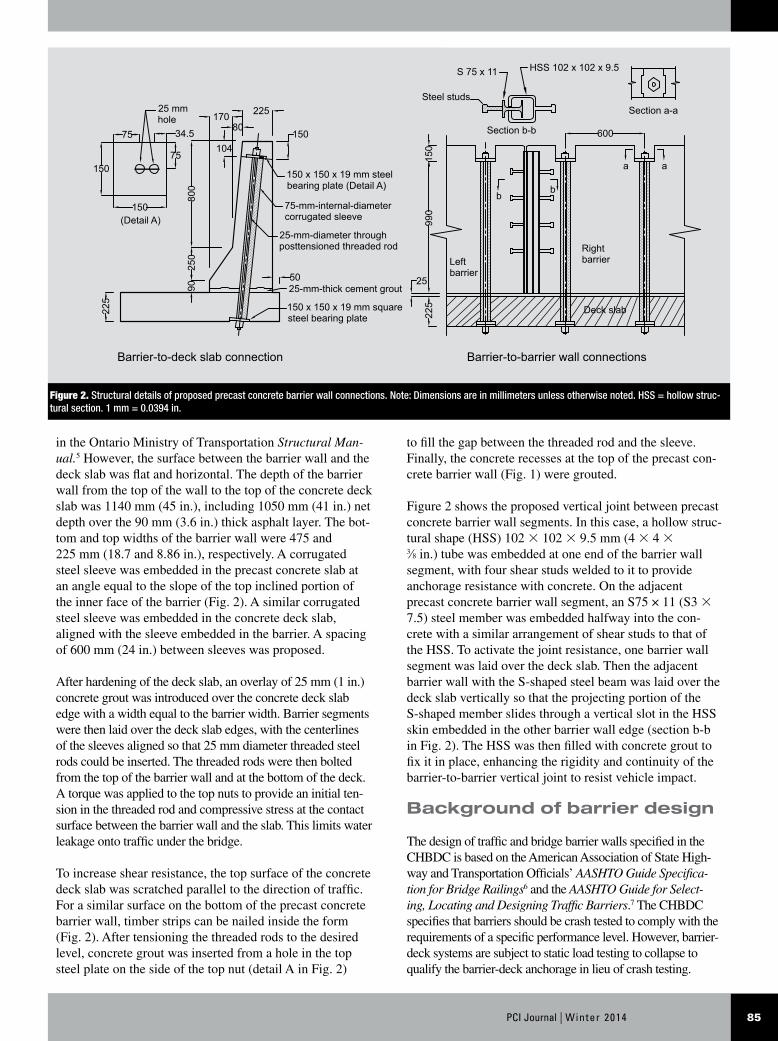
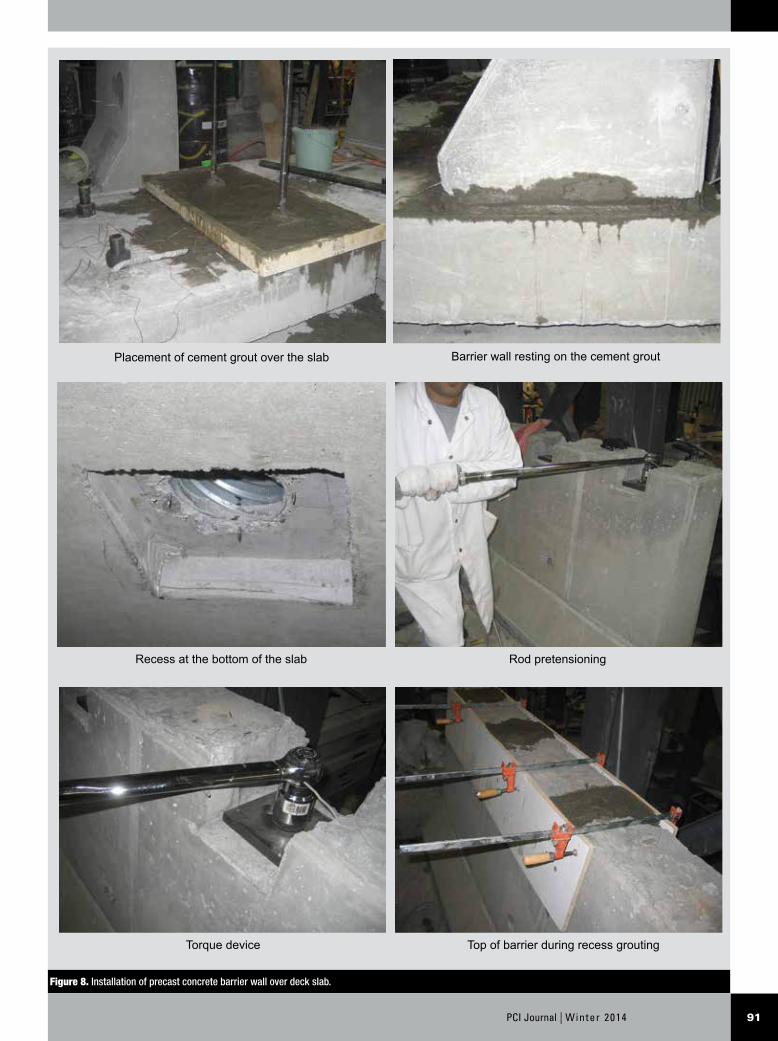
the dike. During placement, all the corrugated ducts embedded in the deck slab were plugged. At the speci-fied initial setting time for the cement grout, the barrier segment was placed over the grout. Figure 7 shows the barrier-slab joint after removing the dike. Three days after grouting, threaded rods were placed inside each duct and aligned using the top bearing plates, nuts, and washers in the top recess in Fig. 2, followed by snug-tightening the rods from the bottom of the deck. A de-sign torque of 525 lb-ft (720 N-m) was applied to each rod, equivalent to a 79 kN (18 kip) tensile force. From the torque catalogue, the applied torque was determined based on the desired pretensioning force of 17% of the nominal ultimate tensile strength. After tensioning all rods, grout was injected into the duct through a hole drilled in the top bearing plate (Fig. 2). The duct was left for 24 hours to let the grout settle and then filled again with grout if it was not completely filled. Finally, each recess or trapezoidal pocket was clamped using laminated plywood from the inner and outer side of the barrier wall and then filled with concrete grout. Figure 10 summarizes the sequence of barrier installation.
Instrumentation
Strain gauges were mounted on the vertical and hori-zontal bars at the load location and on the threaded rods at the interface between deck slab and barrier wall. Strain gauges were also attached to the concrete surface at the lowest part of the outer face of the precast con-crete barrier wall. Linear variable displacement trans-ducers (LVDTs) were installed horizontally on the rear of the barrier wall at the load level. Any lateral move-ment and uplift of the deck slab were recorded using two LVDTs (Fig. 8) to examine the degree of restraint provided by the tie-down system and locking round plates.
55, 58, 65, and 62 MPa (7300, 8000, 8400, 9400, and 9000 psi) for grouts used in models M1, M2, M3, M4, and M5, respectively. Grout cubes were tested in accor-dance with ASTM C109.12 Nonshrink cement grout was chosen because it expands during hardening, providing better grip with the threaded rods and the corrugated sleeves. Before placing the precast concrete barrier wall on top of the deck slab, a 25 mm (1 in.) thick layer of cement grout was laid over the deck slab with a width and length equal to the bottom face of the barrier wall. Pretensioned 25 mm diameter threaded steel rods were used in the current study. The rod commercial specifieds yield strength and ultimate strength provided by the manufacturer were 827 and 1034 MPa (120 and 150 ksi), respectively. The high-strength nuts had a 25 mm internal diameter and were 50 mm (2 in.) thick.
Construction of the models
Wood forms were constructed for the barrier wall and deck slabs (Fig. 9). At the top of the barrier form, trapezoidal cutouts were made to provide for a recess at the top of the wall every 600 mm (24 in.). Under each recess, galvanized sleeves were connected to the recess wood block and to the bottom sheet of the wood form at a specified angle (Fig. 2). A shear lock system was furnished on the two opposite sides of the recess to pro-tect the grouted trapezoidal pocket against pry-out when applying load. Figures 1 and 2 show details of this shear. The reinforcement was installed inside the formwork. Twenty-four hours after casting, the formwork was re-moved. The specimens were covered with jute and sprin-kled with water to keep them moist during curing. To connect the barrier wall to the deck slab, a wooden dike 25 mm (1 in.) deep was formed on top of the deck slab around the footprint of the barrier wall (Fig. 10). Ready-mixed nonshrink cement grout was then placed inside
Figure 7. Reinforcement and embedded sleeves for barrier model M3.
Deck slab reinforcementBarrier wall reinforcement
91PCI Journal | Winter 2014
Figure 8. Installation of precast concrete barrier wall over deck slab.
Placement of cement grout over the slab
Torque device
Barrier wall resting on the cement grout
Recess at the bottom of the slab Rod pretensioning
Top of barrier during recess grouting

Winter 2014 | PCI Journal92
experimental results, including water leakage testing, can be found elsewhere.3
Crack pattern and failure modes
Barrier model M1 emulated the precast concrete barrier wall with its pretensioned connection with the deck slab to study the resistance of the joint between the barrier and the deck slab. At a load of 60 kN (13 kip), the first crack was observed at the front of the barrier wall between the bottom surface of the barrier and top surface of the cement grout (Fig. 11). The front of the barrier was the side with tapered faces. With increasing load, a major horizontal crack developed approximately at the middepth of the deck slab on the left side of the barrier wall (Fig. 11), leading to an anchorage failure under the barrier wall. This anchorage failure was also exhibited on the right side of the barrier wall (Fig. 11) but associated with a combined flexure-shear-bond crack pattern. The anchorage crack extended into the slab away from the front side of the barrier wall in a combined flexure-shear-bond crack pattern. The speci-men failed mainly due to anchorage failure in the deck slab at 174.61 kN (39.256 kip). The test was terminated when the specimen could not absorb additional load.
Barrier model M2 had similar geometry to model M1 but was considered a control specimen because it represented the monolithic cast-in-place concrete barrier wall system. At a load of 70 kN (16 kip), the first concrete crack was
Test setup and test procedure
Figure 8 shows a schematic diagram of the test setup. Each barrier specimen was supported directly on the laboratory floor and tied to the floor using 50 mm (2 in.) diameter threaded rods spaced at 600 mm (24 in.) center to center. The rods were tightened by applying a torque to control slab uplift during testing. A 900 kN (200 kip) hydraulic jack was used to apply a horizontal load to the barrier wall. A universal flat load cell of 900 kN capacity measured the applied loads. The data acquisition unit recorded one reading per second from each sensor. Each specimen was monotonically loaded to collapse. Figure 7 shows the bar-rier models and loading system before test. During the test, a jacking load was applied in increments of 10 kN (2 kip). The load was maintained for about 5 minutes at each incre-ment to observe crack initiation and propagation as well as changes in barrier geometry as depicted from LVDT read-ings. Failure was reached when the displacement readings from sensors increased without further load increase.
Test results
The experimental program was intended to study the structural behavior and ultimate load-carrying capacity of the precast concrete barrier wall system under static load-ing. This includes load-deflection and load-strain histories, crack patterns, and failure modes. The results are briefly summarized in the following section. Further details of the
Figure 9. Schematic of test setup. Note: HSS = hollow structural section; LVDT = linear variable displacement transducer; PVC = polyvinyl chloride. 1 mm = 0.0394 in.; 1 m = 3.28 ft.
19-mm-thick plate to hold rod tensioning load25.4 mm stainless all threaded bar
HSS 305 X 305 X 9.5 mm length = 2.4 m
19-mm-thick steel plate
Laboratory's rigid floor
LVDT
990
mm
LVDT100-mm-diameter solid round bar
Jack
Load cellAnchor rod of 32-mm-diameter
at 600 mm center to center
50 mm PVC sleeve at 600 mm center to center embedded in the deck slab
LVDT
Locking round plate
Rigid wall
225

93PCI Journal | Winter 2014
Figure 10. Tested barrier models.
Barrier model M1
Barrier model M3
Barrier model M2
Barrier model M4
Barrier model M5

Winter 2014 | PCI Journal94
wall might eventually have led to a diagonal yield-line failure resembling the AASHTO LRFD specifications’ yield-line failure pattern, premature local failure occurred due to punching shear at the load location.
Strain and LVDT readings
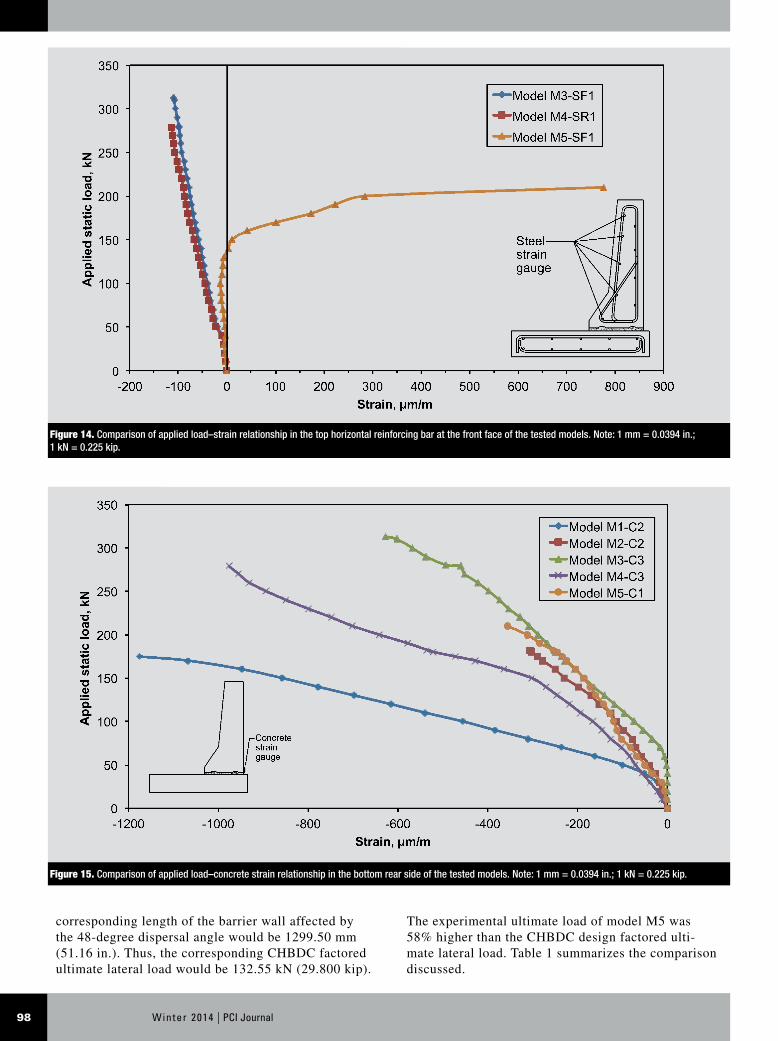
Readings from sensors were recorded at a rate of one per sec-ond. A set of strain gauges was installed in the horizontal bars at the applied load location. Figure 12 depicts the strain history on the horizontal reinforcing bar along the depth of the barrier wall on the rear face of model M3. Figures 13 and 14 show the strain history for the top horizontal bar at the rear and front faces of the barrier wall, respectively. At a certain load incre-ment, horizontal tensile strains in the reinforcement in model M3 increased toward the top of the barrier wall. However, strains in the horizontal bar on the front face of the barrier wall were all in compression (Fig. 14), as expected. Similar behavior was observed for model M4 (Fig. 13 and 14) for the barrier rear and front faces, respectively. For model M5, horizontal bars at the rear face exhibited increasing tensile strains. However, horizontal bars at the front face started to carry tensile strains at a load of about 140 kN (31 kip) (57% of the peak load) as a result of the premature local punching shear at the load loca-tion. Figure 15 depicts the load-concrete strain relationship at the bottom rear side of the barrier wall.
The strain gauge was located at the barrier midlength for models M1, M2, M3, and M4 and at the barrier end for model M5 as suggested to be the location of the maximum strain along the barrier length. The peak concrete strain was 1175 and 305 με for models M1 and M2, respec-tively. The maximum strain at peak load was 628, 976, and 357 με for models M3, M4, and M5, respectively. No sign of concrete crushing was observed at the concrete strain gauge location in all models. Results presented elsewhere3 showed that concrete cracked at the cantilever end with the deck slab at a load of about 50 kN (11 kip), leading to greater flexibility of the deck slab that assisted in increas-ing the load capacity of the barrier wall as explained later in this paper. Figure 16 shows a typical strain history for the threaded rods at the barrier–deck slab junction for model M3. The peak strain in these rods was observed to be 2625 με. This peak strain was 2635 and 2068 με for models M4 and M5, respectively. All three values are far below the yield strain of 4135 με.
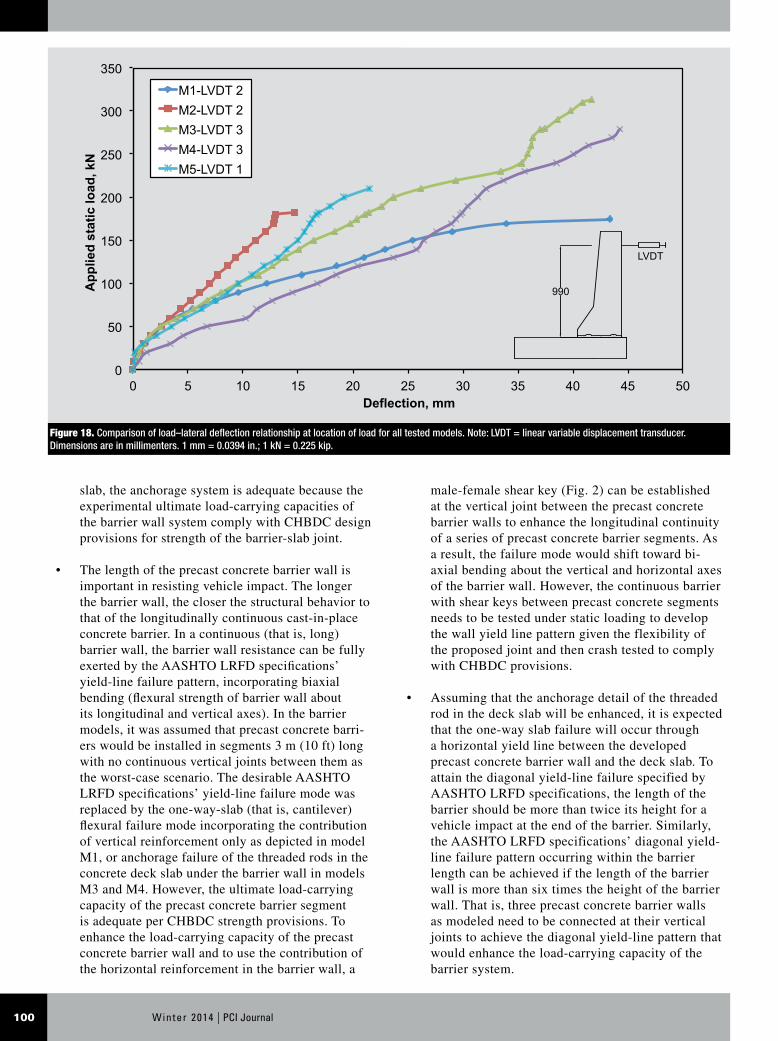
Barrier lateral deflections at each load were recorded along the barrier width. As an example, Fig. 17 depicts the lateral deflection history of model M5 with end loading. Lateral deflection increases toward the load location, as expected. Figure 18 shows the lateral deflection history of the barrier wall at the load location for all specimens. The maximum recorded deflection was 43.39 and 14.63 mm (1.708 and 0.576 in.) at peak load for models M1 and M2, respective-ly. This means that the precast concrete barrier wall system is more flexible than the cast-in-place concrete barrier wall
observed at the front of the barrier wall between the bottom surface of the barrier and the deck slab (Fig. 11). A com-bined flexure-shear-bond crack appeared on the sides of the deck slab at 170 kN (38 kip), leading to failure in the same pattern as model M1. Failure of model M2 was due to combined flexural, shear, and bond cracks in the deck slab at the front side of the barrier-deck junction. The speci-men failed at a load of 182 kN (40.9 kip) when it could not withstand additional load. No cracks were observed in the barrier walls for models M1 and M2.
Model M3 represented a 3 m (10 ft) long precast concrete barrier wall segment connected to the cantilever portion of the deck slab using pretensioned rods. Testing to collapse was performed in this barrier model by applying a hori-zontal load over a 200 × 200 mm (8 × 8 in.) patch area at midlength on the barrier wall and at 990 mm (39 in.) above the top of the deck slab. At a load of 50 kN (11 kip), a flexural crack appeared at the top surface of concrete at the fixed end of the cantilever portion of the deck slab (Fig. 11). Also, at a load of 150 kN (33 kip), a horizontal crack was observed between the bottom front of the precast concrete barrier wall and the top surface of the cement grout (Fig. 11). With the increase in applied load, a major anchorage crack appeared on the deck slab under the bar-rier wall on the right and left sides of the specimen (Fig. 11), leading to failure at a load of 313 kN (70.4 kip).
Model M4 was identical to model M3, but without the cantilever portion of the deck slab. When the load reached 130 kN (19.2 kip), a flexural crack was observed along the cement grout at the barrier-to-slab joint (Fig. 11). With an increase in applied load, a single vertical flexural crack appeared on the rear of the precast concrete barrier wall at the location of the applied load (Fig. 11). With additional load, a major anchorage crack was observed in the deck slab under the barrier wall (Fig. 11), leading to failure at a load of 279 kN (62.7 kip). After failure, the flexural crack in the cement grout between the barrier wall and deck slab was wider at the midlength of the barrier wall and narrower toward the barrier wall ends.
Model M5 was identical to model M4 except that the load was applied at the end, simulating vehicle impact at this location. As the load approached 150 kN (33 kip), a few di-agonal cracks were observed on the front face of the barrier wall (Fig. 11). The farthest crack was 1500 and 800 mm (59 and 31 in.) from the barrier end at the top and bottom of the wall, respectively. With an increase in applied load, signs of local punching shear cracks appeared around the loaded area at about 190 kN (42 kip). This punching shear crack pattern was observed on the front face (Fig. 11) and on the rear and top of the barrier wall (Fig. 11). The crack extended vertically on the rear of the barrier wall about 600 mm (24 in.) from the barrier (Fig. 11). The specimen absorbed additional load to 210 kN (47 kip). Although diagonal cracks appearing on the front face of the barrier

95PCI Journal | Winter 2014
ing crash testing. Table 1 shows that the experimental ultimate jacking load was 313.00 kN (70.369 kip) for the precast concrete barrier model M3 with the cantilever slab and 279.00 kN (62.725 kip) for barrier model M4 with nondeformable deck slab. This means that the flexibility in the cantilever slab increased the ultimate load-carrying capacity of the barrier fixed to a nondeformable slab by 12%. Previous studies on barrier behavior3 considered the barrier wall to be rigidly connected to nondeformable deck slab so that the failure is forced to occur in the barrier wall. Also, the AASHTO LRFD specifications’ yield-line equa-tions assume a rigid connection between the barrier wall and a nondeformable deck slab.
For PL-3 barriers, the CHBDC commentary13 speci-fies a lateral service load of 210 kN (47 kip) to be applied over a length of 2.4 m (7.9 ft) with a 42-de-gree dispersal angle of the load from 990 mm (39 in.) high to the top of the deck slab. Considering a live load factor of 1.7, the factored ultimate lateral load would be 85.35 kN/m (5.849 kip/ft) length of the barrier at the barrier–deck slab junction. For models M1 and M2 of 1200 mm (47 in.) barrier length, the design factored ultimate horizontal load was 102.42 kN (22.026 kip).
The experimental ultimate loads of models M1 and M2 were 70% and 78% higher than the CHBDC design factored ultimate lateral load. In a similar sense, the CHBDC factored ultimate lateral load at the barrier-deck slab junction for models M3 and M4 would be 173.5 kN (39.01 kip), considering a loaded barrier length of 200 mm (8 in.) as conducted experimentally. The experimental ultimate loads for models M3 and M4 were 80% and 61% higher than the CHBDC factored ultimate lateral load. In case of vehicle impact to the end portion of the barrier wall (model M5), CHBDC commentary specifies a lateral load of 210 kN (47 kip) to be applied over a length of 2400 mm (94 in.) with a 48-degree dispersal angle of
system represented by model M2. Figure 18 also shows that model M5 with end loading exhibited 21.53 mm (0.848 in.) peak deflection, which is 51% less than that for model M4 with central loading. For models M3 and M4, the maximum recorded deflection was 41.67 and 44.28 mm (1.641 and 1.743 in.) at peak load, respectively. Model M3 exhibited less lateral deflection at the top of the barrier wall than model M4 exhibited at all loads. However, the change of deflection values of about 6% at peak load does not in-dicate the significance of the presence of the cantilever slab to support the barrier wall.
Correlation between experimental ultimate loads and CHBDC design loads
Table 1 summarizes the experimental ultimate load for each model as well as the corresponding CHBDC design loads based on the failure mode obtained experimentally. The experimental ultimate jacking load was observed to be 174.61 kN (39.256 kip) for the precast concrete barrier model M1 and 182.00 kN (40.917 kip) for the cast-in-place concrete barrier model M2. To qualify the precast concrete barrier wall system, it can be evaluated as being as good as the cast-in-place reinforced concrete barrier wall that is used in Ontario highway bridges. In this sense, the ultimate load-carrying capacity of model M1 was 4% less than for model M2. However, the lateral maximum deflection at peak load for model M1 was almost 1.96 times that for model M2.
One may qualify the precast concrete barrier wall for strength and for the favorable increase in lateral deflection over model M2. An increase in lateral deflection allows the precast concrete barrier to ab-sorb more energy from vehicle impact. Nevertheless, the comparison for serviceability limit state (that is, deflection values) may be waived because CHBDC4 does not specify design provisions for serviceability limit state design of barrier walls other than conduct-
Table 1. Summary of experimental findings and Canadian Highway Bridge Design Code factored ultimate lateral load for the tested barrier models
Model Load typeExperimental ultimate
load, kNCHBDC factored ultimate
lateral load, kN
Experimental/CHBDC factored ultimate load
ratio
Maximum lateral deflection at peak load,
mm
M1 Line load 174.61 102.42 1.70 42.83
M2 Line load 182.00 102.42 1.78 14.03
M3 Patch load 313.00 173.50 1.80 41.67
M4 Patch load 279.00 173.50 1.61 44.28
M5 Patch load 210.00 132.55 1.58 21.53
Note: 1 mm = 0.0394 in.; 1 kN = 0.225 kip.

Winter 2014 | PCI Journal96
Figure 11. Failure patterns of the tested barrier models.
Model M1 slab horizontal tension crack on left side of barrier Model M2 combined flexural, shear, and bond cracks on left side of barrier
Model M3 anchorage failure in the cantilever slab
Model M4 anchorage failure on left side of barrier
Model M4 vertical flexural crack on rear side at midlength of barrier
Model M5 flexural crack pattern at failure on front side of barrier wall
Model M5 crack pattern on two sides of barrier wall

97PCI Journal | Winter 2014
the load from 990 mm (39 in.) height to the top of the deck slab. Considering a live load factor of 1.7, the factored ultimate lateral load of the barrier at the
barrier–deck slab junction would be 102.00 kN/m (6.99 kip/ft). Because the applied lateral load in model M5 was over a 200 mm (8 in.) length, the
Figure 12. Load-strain relationship in horizontal reinforcing bar at the rear face of barrier wall for model M3. Note: 1 mm = 0.0394 in.; 1 kN = 0.225 kip.
Steel strain gauge
SR1
SR2
SR3
SR4
0
50
100
150
200
250
300
350
0 200 400 600 800 1000 1200 1400
App
lied
stat
ic lo
ad, k
N
Strain, m/m
Steel strain SR1 Steel strain SR2 Steel strain SR3 Steel strain SR3
Figure 13. Comparison of applied load–strain relationship in the top horizontal reinforcing bar at the rear face of the tested models. Note: 1 mm = 0.0394 in.; 1 kN = 0.225 kip.
0
50
100
150
200
250
300
350
0 300 600 900 1200 1500
App
lied
stat
ic lo
ad, k
N
Strain, m/m
Model M3-SR1 Model M4-SR1 Model M5-SR1
Steel strain gauge
Winter 2014 | PCI Journal98
corresponding length of the barrier wall affected by the 48-degree dispersal angle would be 1299.50 mm (51.16 in.). Thus, the corresponding CHBDC factored ultimate lateral load would be 132.55 kN (29.800 kip).
The experimental ultimate load of model M5 was 58% higher than the CHBDC design factored ulti-mate lateral load. Table 1 summarizes the comparison discussed.
Figure 14. Comparison of applied load–strain relationship in the top horizontal reinforcing bar at the front face of the tested models. Note: 1 mm = 0.0394 in.; 1 kN = 0.225 kip.
0
50
100
150
200
250
300
350
-200 -100 0 100 200 300 400 500 600 700 800 900
App
lied
stat
ic lo
ad, k
N
Strain, m/m
Model M3-SF1 Model M4-SR1 Model M5-SF1
Steel strain gauge
Figure 15. Comparison of applied load–concrete strain relationship in the bottom rear side of the tested models. Note: 1 mm = 0.0394 in.; 1 kN = 0.225 kip.
0
50
100
150
200
250
300
350
-1200 -1000 -800 -600 -400 -200 0
App
lied
stat
ic lo
ad, k
N
Strain, m/m
Model M1-C2 Model M2-C2 Model M3-C3 Model M4-C3 Model M5-C1
Concrete strain gauge

99PCI Journal | Winter 2014
testing of these bridge barrier models can be applied with con-fidence in bridge design given the following considerations:
• Although models M1, M3, and M4 failed primarily due to a threaded rod anchorage problem in the deck
Precast concrete barrier wall system design consideration
The barrier models represent a full-scale segment of the bar-rier wall in a typical bridge. The results from experimental
Figure 17. Load–lateral deflection relationship at top of the barrier wall for model M5. Note: LVDT = linear variable displacement transducer. Dimensions are in millimeters. 1 mm = 0.0394 in.; 1 kN = 0.225 kip.
0
50
100
150
200
250
0 5 10 15 20 25 30 35 40 45 50
App
lied
stat
ic lo
ad, k
N
Deflection, mm
LVDT 1 LVDT 2 LVDT 3 LVDT 4 LVDT 5
990600
LVDT 1 LVDT 2 LVDT 3 LVDT 4 LVDT 5
Top view
LVDT vertical
LVDT horizontal
Side view
Figure 16. Load-strain relationship in pretensioned threaded rod for model M3. Note: 1 mm = 0.0394 in.; 1 kN = 0.225 kip.
Load strike
Steel strain gauge
SB5 SB4 SB3 SB2 SB1
0
50
100
150
200
250
300
350
0 500 1000 1500 2000 2500 3000
App
lied
stat
ic lo
ad, k
N
Strain, m/m
Rod strain SB1 Rod strain SB2 Rod strain SB3 Rod strain SB4 Rod strain SB5
Winter 2014 | PCI Journal100
male-female shear key (Fig. 2) can be established at the vertical joint between the precast concrete barrier walls to enhance the longitudinal continuity of a series of precast concrete barrier segments. As a result, the failure mode would shift toward bi-axial bending about the vertical and horizontal axes of the barrier wall. However, the continuous barrier with shear keys between precast concrete segments needs to be tested under static loading to develop the wall yield line pattern given the flexibility of the proposed joint and then crash tested to comply with CHBDC provisions.
• Assuming that the anchorage detail of the threaded rod in the deck slab will be enhanced, it is expected that the one-way slab failure will occur through a horizontal yield line between the developed precast concrete barrier wall and the deck slab. To attain the diagonal yield-line failure specified by AASHTO LRFD specifications, the length of the barrier should be more than twice its height for a vehicle impact at the end of the barrier. Similarly, the AASHTO LRFD specifications’ diagonal yield-line failure pattern occurring within the barrier length can be achieved if the length of the barrier wall is more than six times the height of the barrier wall. That is, three precast concrete barrier walls as modeled need to be connected at their vertical joints to achieve the diagonal yield-line pattern that would enhance the load-carrying capacity of the barrier system.
slab, the anchorage system is adequate because the experimental ultimate load-carrying capacities of the barrier wall system comply with CHBDC design provisions for strength of the barrier-slab joint.
• The length of the precast concrete barrier wall is important in resisting vehicle impact. The longer the barrier wall, the closer the structural behavior to that of the longitudinally continuous cast-in-place concrete barrier. In a continuous (that is, long) barrier wall, the barrier wall resistance can be fully exerted by the AASHTO LRFD specifications’ yield-line failure pattern, incorporating biaxial bending (flexural strength of barrier wall about its longitudinal and vertical axes). In the barrier models, it was assumed that precast concrete barri-ers would be installed in segments 3 m (10 ft) long with no continuous vertical joints between them as the worst-case scenario. The desirable AASHTO LRFD specifications’ yield-line failure mode was replaced by the one-way-slab (that is, cantilever) flexural failure mode incorporating the contribution of vertical reinforcement only as depicted in model M1, or anchorage failure of the threaded rods in the concrete deck slab under the barrier wall in models M3 and M4. However, the ultimate load-carrying capacity of the precast concrete barrier segment is adequate per CHBDC strength provisions. To enhance the load-carrying capacity of the precast concrete barrier wall and to use the contribution of the horizontal reinforcement in the barrier wall, a
Figure 18. Comparison of load–lateral deflection relationship at location of load for all tested models. Note: LVDT = linear variable displacement transducer. Dimensions are in millimenters. 1 mm = 0.0394 in.; 1 kN = 0.225 kip.
0
50
100
150
200
250
300
350
0 5 10 15 20 25 30 35 40 45 50
App
lied
stat
ic lo
ad, k
N
Deflection, mm
M1-LVDT 2 M2-LVDT 2 M3-LVDT 3 M4-LVDT 3 M5-LVDT 1
990
LVDT

101PCI Journal | Winter 2014
Precast Concrete Deck Bulb-Tee Bridge Girders.” PCI Journal 51 (6): 86–107.
3. Sennah, K., G. Patel, and R. Kianoush. 2008. Devel-opment of Precast Barrier Wall System for Bridge Decks. Report submitted to MTO (Ministry of Trans-portation of Ontario) Highway Infrastructure Innova-tion Funding Program. St. Catharines, ON, Canada: MTO.
4. CSA (Canadian Standards Association). 2006. Cana-dian Highway Bridge Design Code. CAN/CSA-S6-06. Toronto, ON, Canada: CSA.
5. MTO (Ministry of Transportation of Ontario). 2003. MTO Structural Manual. St. Catharines, ON, Canada: MTO.
6. AASHTO (American Association of State Highway and Transportation Officials). 1989. AASHTO Guide Specifications for Bridge Railings. Washington, DC: AASHTO.
7. AASHTO. 1977. AASHTO Guide for Selecting, Locat-ing, and Designing Traffic Barriers. Washington, DC: AASHTO.
8. AASHTO. 2004. AASHTO LRFD Bridge Design Specifications. 3rd ed. Washington, DC: AASHTO.
9. CSA. 2004. Design of Concrete Structures. CSA A23.3. Mississauga, ON, Canada: CSA.
10. ACI (American Concrete Institute) Committee 318. 2005. Building Code Requirements for Structural Concrete (ACI 318-05) and Commentary (ACI 318R-05). Farmington Hills, MI: ACI.
11. ASTM C39/C39M-12a. 2012. Standard Test Method for Compressive Strength of Cylindrical Concrete Specimens. West Conshohocken, PA: ASTM Interna-tional.
12. ASTM C109/C109M-12. 2012. Standard Test Method for Compressive Strength of Hydraulic Cement Mor-tars (Using 2-in. or [50-mm] Cube Specimens). West Conshohocken, PA: ASTM International.
13. CSA. 2006. Commentary on CAN/CSA-S6-06, Ca-nadian Highway Bridge Design Code. Toronto, ON, Canada: CSA.
Conclusion
Based on the data generated from experimental tests, the following conclusions can be drawn:
• Models M1, M3, and M4 of the precast concrete barri-er system failed due to threaded rod anchorage failure in the deck slab under the barrier wall associated with secondary combined flexure-shear-bond crack patterns appearing in the deck slab in some of these models.
• Model M1 of the precast concrete barrier wall system proved to be as good as the cast-in-place concrete bar-rier system represented by model M2 with respect to strength at the barrier-slab joint.
• Models M3, M4, and M5 of the barrier wall system proved adequate for strength at the barrier-slab joint based on CHDBC design loads.
• Model M5 of the precast concrete barrier wall system that was loaded at its end failed primarily due to local punching shear around the loaded area associated with diagonal flexural cracks exhibited over considerable length of the barrier wall. However, the experimental ultimate load capacity of model M5 is still greater than the CHBDC design ultimate lateral load.
• Comparing results of models M3 and M4 of the developed precast concrete barrier wall system, it can be concluded that the presence of a cantilever portion of the deck slab to support the precast concrete barrier wall in slab-on-girder bridges increased the load-carrying capacity of the system by 12% for the given cantilever length compared with that for thick slab or voided slab bridge decks.
Acknowledgments
This research was supported by the Ministry of Trans-portation of Ontario’s Highway Infrastructure Innovation Funding Program. This support is gratefully acknowledged. Opinions expressed in this paper are those of the authors and do not necessarily reflect the views and policies of the ministry.
References
1. Shah, B., K. Sennah, R. Kianoush, S. Tu, and C. Lam. 2007. “Experimental Study on Prefabricated Concrete Bridge Girder-to-Girder Intermittent-Bolted Connec-tion Systems.” ASCE Journal of Bridge Engineering 12 (5): 570–584.
2. Shah, B., K. Sennah, R. Kianoush, S. Tu, and C. Lam. 2006. “Flange-to-Flange Moment Connections for

Winter 2014 | PCI Journal102
About the authors
Gaurang Patel is a former MASc student in the Civil Engineering Department at Ryerson University in Toronto, ON, Canada. He is currently a project engineer at Hydro One Networks, Inc., in Toronto.
Khaled Sennah is a professor in the Civil Engineering Department at Ryerson University in Toronto and a member of PCI and the American Society of Civil Engineers (ASCE).
Hossein Azimi is a post-doctoral fellow in the Civil Engineering Department at Ryerson University and an associate member of ASCE.
Clifford Lam is former head of Bridge Research at the Bridge Office of the Ontario Ministry of Transportation in St. Catharines, ON, Canada. He is a senior bridge engineer at McIntosh Perry in Burlington, ON, Canada.
Reza Kianoush is a professor in the Civil Engineering Department at Ryerson University.
Abstract
This paper presents a PL-3 precast concrete barrier wall system to accelerate the replacement of deteriorat-ed bridges. The proposed connection detail is intended to expedite construction; minimize traffic disruption; improve work-zone safety, quality, and constructabil-ity; and reduce life-cycle cost. The proposed precast concrete barrier is connected to the deck slab using pretensioned threaded steel rods. The proposed male-female vertical joint between adjacent precast concrete barriers would maintain barrier continuity to spread the reaction of vehicle impact. Five full-scale barrier mod-els were fabricated and tested to collapse to examine their ultimate capacities and crack patterns. A control model represented the cast-in-place concrete barrier. Two models represented the proposed precast concrete barrier system. Both models were loaded to induce failure at the barrier–deck slab junction. Two precast concrete barrier models were loaded at midlength and edge, respectively. One of these included the cantile-ver portion of the deck slab. The results show that the proposed precast concrete barrier system is as good as the cast-in-place concrete barrier with respect to ultimate load-carrying capacity at the deck slab–barrier connection.
Keywords
Anchorage, barrier, bridge, code, load, posttensioning.
Review policy
This paper was reviewed in accordance with the Precast/Prestressed Concrete Institute’s peer-review process.
Reader comments
Please address and reader comments to journal@pci .org or Precast/Prestressed Concrete Institute, c/o PCI Journal, 200 W. Adams St., Suite 2100, Chicago, IL 60606. J


![[PPT]PREFABRICATED BUILDING - Wikispacescarlavl.wikispaces.com/file/view/PREFABRICATED+BUILDING.ppt · Web viewPREFABRICATED BUILDING Vargas, Valentina Vásquez, Carla CONTENT: Prefabricated](https://static.fdocuments.in/doc/165x107/5ada5d397f8b9a6d7e8ca107/pptprefabricated-building-buildingpptweb-viewprefabricated-building-vargas.jpg)