![arXiv:1712.01887v2 [cs.CV] 5 Feb 2018arXiv:1712.01887v2 [cs.CV] 5 Feb 2018 Published as a conference paper at ICLR 2018 Data Data Data Data Data Data Y Data Data Data Data Y ¢ ¢](https://static.fdocuments.in/doc/165x107/5edca87aad6a402d66676b01/arxiv171201887v2-cscv-5-feb-2018-arxiv171201887v2-cscv-5-feb-2018-published.jpg)
Development of a Performance Monitoring Data...
28
Development of a Performance Monitoring Data Hub: An Open-Source Open-Data Scheme Approach for Improving the Effectiveness of Integrated Modeling Applications Xuesong Zhou (Arizona State University) Jeff Taylor (Univ. of Utah) Brandon Nevers (KAI) Prepared for ITS Arizona 2013
-
Upload
truongmien -
Category
Documents
-
view
221 -
download
0
Transcript of Development of a Performance Monitoring Data...

Development of a Performance Monitoring Data Hub: An Open-Source Open-Data Scheme Approach for Improving the Effectiveness of Integrated Modeling Applications
Xuesong Zhou (Arizona State University) Jeff Taylor (Univ. of Utah) Brandon Nevers (KAI) Prepared for ITS Arizona 2013

Problem Statement and Need
• Transportation decision making is complex; requires consideration of multiple levels of analysis or domains
• Improved suite of tools is critical to support USDOT initiatives:
– Integrated Corridor Management – Active Transportation Demand Management
• Many integrated modeling practices are still ad-hoc • Using sensor data to measure corridor-level performance is
difficult
3

Multiple Data Sources to be Mapped to Transportation Network
4
Automatic Vehicle Identification (Bluetooth readers)
Automatic Vehicle Location (GPS data logger, Real-time GPS data tracker; Unlocked
smart phone)
Loop Detector (Freeway
Performance Measurement
System PeMS)
Video Image Processing (Charge-Coupled Device Camera;
Image Grabbing Card)

Data Hub
Field Data
Safety
Emissions
Micro-simulation
& HCM Analysis
Dynamic Traffic
Assignment
Travel Demand
Forecasting
Integrated Modeling Practices
Current Practice Ad Hoc
5

6
Data Hub
Field Data
Land Use, Safety &
Emissions Models
HCM & Signal Timing Models
Micro-simulation
Models
Dynamic Traffic
Assignment Models
Travel Demand
Forecasting Models
AMS Data Hub
Field Data
Land Use, Safety &
Emissions Models
HCM & Signal Timing Models
Micro-simulation
Models
Dynamic Traffic
Assignment Models
Travel Demand
Forecasting Models
Our Vision
Current Practice Ad Hoc
With AMS Data Hub Systematic

FHWA Research Project
• Project title: Effective Integration of Analysis and Modeling Simulation (AMS) Tools – April 2011 to January 2013
• Objectives: – Define a concept of operations – Allow for the effective integration of AMS tools
across various domains and scale, – Perform multi-resolution simulation for multiple
scenarios
7

Development Goal 1: Unifying Data Scheme
8

Development Goal 2: Support Cross Resolution Modeling (Offline -> Online)
Regional planning model
Mesoscopic simulation
Microscopic simulation
Height (Z-axis) represents zone-specific population Color range represents predicted accessibility
9

Development Goal 3: Facilitate Data Exchanges between Modeling/Simulation Software Packages
Traffic assignment:
10
Signal Optimization: Synchro
Microsimulation: Vissim
Google Maps Output

Development Goal 3: Facilitate Data Exchanges between Modeling/Simulation Software Packages
Traffic assignment:
11
Signal Optimization: Synchro
Microsimulation: Vissim
Google Maps Output

AMS Data Hub Software Prototype: NeXTA
• Version 3: Open Source: Available at Google Code: https://code.google.com/p/nexta/ • Windows based applications but with connections to on-line storage (Google Fusion
Tables) • Start with GIS with multiple transportation layers
– Network, demand, vehicle trajectory, Link MOE, …. • Focus on data processing and visualization
12
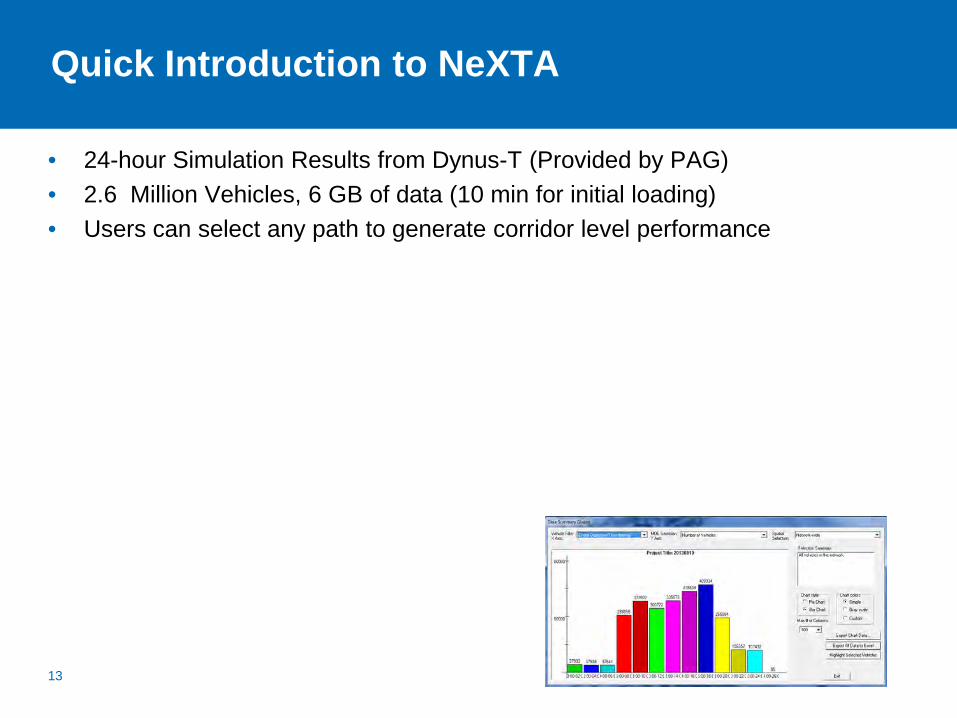
Quick Introduction to NeXTA
• 24-hour Simulation Results from Dynus-T (Provided by PAG) • 2.6 Million Vehicles, 6 GB of data (10 min for initial loading) • Users can select any path to generate corridor level performance
13

Connection 1: Network
AMS Data Hub
Field Data
Land Use, Safety &
Emissions Models
HCM & Signal Timing Models
Micro-simulation
Models
Dynamic Traffic
Assignment Models
Travel Demand
Forecasting Models
•Regional planning models •TransCAD •CUBE •VISUM •GIS shape files
•Multiple demand formats •CSV, Matrix
•Automatic identification of signal locations
•Subarea cut utility
•Export network to Google Maps
14

Network Data Importing
– Import GIS node/link/zone shape files – Utilize Open-source Geospatial Data Abstraction Library
(GDAL) library – Script for mapping planning data set to NEXTA data hub
15
Cube/TransCAD/VISUM Open-Source Q-GIS

Inrix TMC Data, Synchro Data and Planning Network
16

Different Coordinate Systems? ->Synchronized Display for the Same Area
17

Connection 2: Sensor Data
AMS Data Hub
Field Data
Land Use, Safety &
Emissions Models
HCM & Signal Timing Models
Micro-simulation
Models
Dynamic Traffic
Assignment Models
Travel Demand
Forecasting Models
•Inrix Sensor data •15-min speed count
•GPS data sets
•Tomtom dataset from New York
•NGSIM data set •Incident data (crash locations)
•Google Transit Feed
•Extension: Dynamic OD demand calibration tools
18
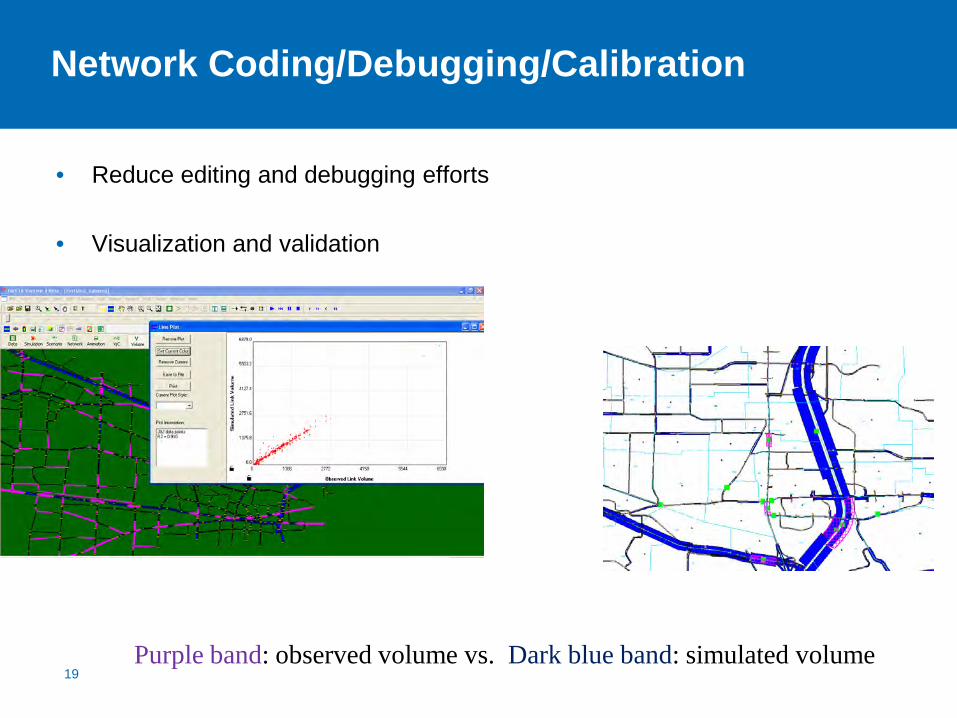
Network Coding/Debugging/Calibration
• Reduce editing and debugging efforts
• Visualization and validation
19 Purple band: observed volume vs. Dark blue band: simulated volume

TMC-based Data Cannot Be Mapped to Planning Network? Path-based Comparison
20
Planning Network
Inrix TMC Network

Path-Level Comparison for Multiple Paths
21

Connection 3: Trajectory Data
AMS Data Hub
Field Data
Land Use, Safety &
Emissions Models
HCM & Signal Timing Models
Micro-simulation
Models
Dynamic Traffic
Assignment Models
Travel Demand
Forecasting Models
•Import DYNASMART/Dynust data set
•Network •Signal Control •Vehicle trajectory
•Import Aimsun vehicle trajectory file
•GPS based data
22

Connection 4: Microsimulation Data/Signal Data
AMS Data Hub
Field Data
Land Use, Safety &
Emissions Models
HCM & Signal Timing Models
Micro-simulation
Models
Dynamic Traffic
Assignment Models
Travel Demand
Forecasting Models
•Import/Export synchro data format
•Export VISSIM network data format (*.anm)
•Extensions:
•TRANSIMS •Open-source CORSIM
23
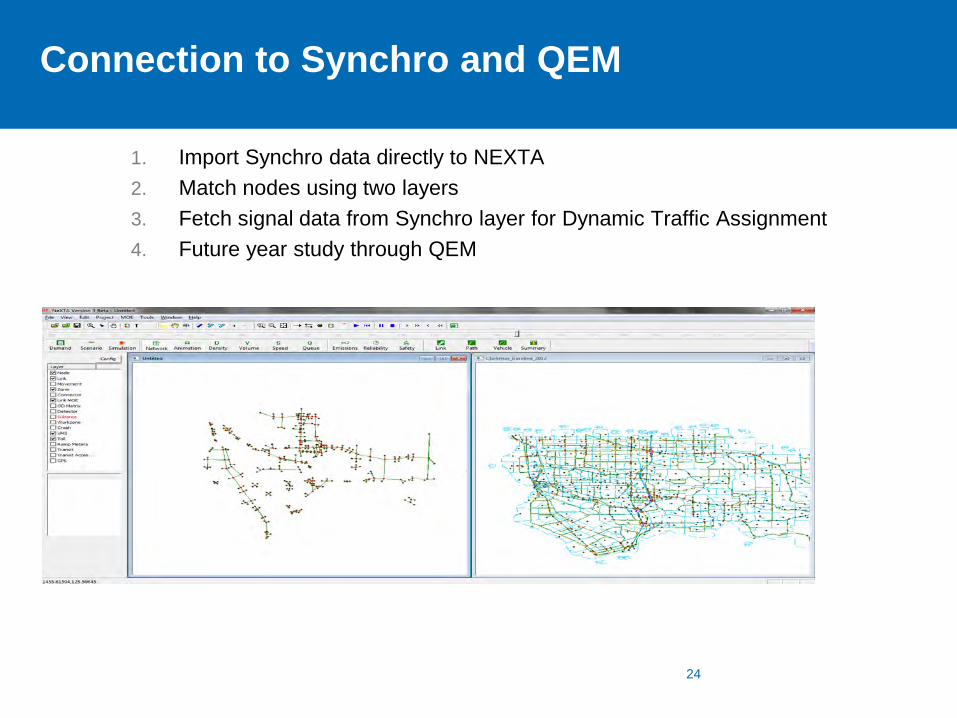
Connection to Synchro and QEM
1. Import Synchro data directly to NEXTA 2. Match nodes using two layers 3. Fetch signal data from Synchro layer for Dynamic Traffic Assignment 4. Future year study through QEM
24

Integrated MOVES Lite and DTALite Packages for Emission Analysis
MOVES Lite
Emission Estimates
DTALite
Large-scale Dynamic Traffic Assignment & Simulator
Simplified Emission Estimation Method
Project level Network level
Microscopic Vehicle Trajectory Reconstruction Emission Result Aggregation
29

Test Applications
• Two test networks selected: – NW 185th Avenue in Portland, Oregon – I-10 in Tucson, Arizona
• Primary objective: demonstrate linkages among AMS tools and field data
• Model and field data already available to team
• Familiar networks • Interested modeling agencies
– Portland Metro – Pima Association of Governments
30

Estimated Time Saving from AMS Data Hub
40
Component Without AMS Data Hub
With AMS Data Hub
Network Import • Export, edit, and import network
8-10 hours 1-2 hours
Intersection Control Inference • Editing control type for all nodes
6-8 hours 4-6 hours
Subarea OD Tables • Aggregate path flows at boundary
8-16 hours < 0.5 hours
Convert Connectors to Side Streets • Add new nodes, delete links, etc.
1-2 hours < 0.5 hours
Signal Timing with QEM • Initial timings for intersections
6-8 hours < 0.5 hours
ODME • Preparing field data, running
ODME
6-8 hours 2-3 hours
TOTAL 35-52 hours 7-11 hours
80% Savings

Challenges
1. Network coding Different applications require different levels of details
2. Signal data representation
Capacity Turning movement and effective green time Dual ring signal timing Software/hardware in the loop
3. Software vendor buy-in
Existing multi-resolution integration using their own proprietary format
4. Community support 41

Next Steps
1. Obtain critical feedback from software development and model user communities
2. Continue model development and testing – Refine and expand connections with signal timing data – Linkage with Activity-Based Model – Expand number of AMS tool interfaces – Provide connection with real-time detector data
3. Conduct additional applications
42