Development of a Multi-Material, Multi-Technology FDM ...
111
University of Texas at El Paso DigitalCommons@UTEP Open Access eses & Dissertations 2012-01-01 Development of a Multi-Material, Multi- Technology FDM System For Process Improvement Experimentation David Espalin University of Texas at El Paso, [email protected] Follow this and additional works at: hps://digitalcommons.utep.edu/open_etd Part of the Materials Science and Engineering Commons , Mechanical Engineering Commons , and the Mechanics of Materials Commons is is brought to you for free and open access by DigitalCommons@UTEP. It has been accepted for inclusion in Open Access eses & Dissertations by an authorized administrator of DigitalCommons@UTEP. For more information, please contact [email protected]. Recommended Citation Espalin, David, "Development of a Multi-Material, Multi-Technology FDM System For Process Improvement Experimentation" (2012). Open Access eses & Dissertations. 2079. hps://digitalcommons.utep.edu/open_etd/2079
Transcript of Development of a Multi-Material, Multi-Technology FDM ...
University of Texas at El PasoDigitalCommons@UTEP
Open Access Theses & Dissertations
2012-01-01
Development of a Multi-Material, Multi-Technology FDM System For ProcessImprovement ExperimentationDavid EspalinUniversity of Texas at El Paso, [email protected]
Follow this and additional works at: https://digitalcommons.utep.edu/open_etdPart of the Materials Science and Engineering Commons, Mechanical Engineering Commons,
and the Mechanics of Materials Commons
This is brought to you for free and open access by DigitalCommons@UTEP. It has been accepted for inclusion in Open Access Theses & Dissertationsby an authorized administrator of DigitalCommons@UTEP. For more information, please contact [email protected].
Recommended CitationEspalin, David, "Development of a Multi-Material, Multi-Technology FDM System For Process Improvement Experimentation"(2012). Open Access Theses & Dissertations. 2079.https://digitalcommons.utep.edu/open_etd/2079

DEVELOPMENT OF A MULTI-MATERIAL, MULTI-TECHNOLOGY FDM
SYSTEM FOR PROCESS IMPROVEMENT EXPERIMENTATION
DAVID ESPALIN, JR.
Department of Mechanical Engineering
APPROVED:
Ryan Wicker, Ph.D., Chair
Norman Love, Ph.D.
Eric MacDonald, Ph.D.
Benjamin C. Flores, Ph.D. Dean of the Graduate School
Copyright ©
by
David Espalin, Jr.
2012

This Thesis is Dedicated To My Wife, Elissa Espalin, and Family Who Have Encouraged and
Supported My Continued Education and Made Possible My Success.

DEVELOPMENT OF A MULTI-MATERIAL, MULTI-TECHNOLOGY FDM
SYSTEM FOR PROCESS IMPROVEMENT EXPERIMENTATION
by
David Espalin, Jr., B.S.M.E.
THESIS
Presented to the Faculty of the Graduate School of
The University of Texas at El Paso
in Partial Fulfillment
of the Requirements
for the Degree of
MASTER OF SCIENCE
Department of Mechanical Engineering
THE UNIVERSITY OF TEXAS AT EL PASO
December 2012

v
Acknowledgements
I am immensely grateful to my advisor and mentor Dr. Ryan Wicker, director of the
W.M. Keck Center for 3D Innovation (Keck Center), for his valuable guidance as well as his
critical and constructive comments throughout my research as an undergraduate and graduate
student. Mr. Frank Medina, manager of the Keck Center, has also served as a mentor to me and
contributed a bounty of stimulating ideas and highly encouraged me. For that I am indebted to
him. Additionally, this research would not have been possible if not for the impressive facility
that Dr. Ryan Wicker and Frank Medina have constructed.
Various other people within the Keck Center deserve recognition. I would like to thank
Dr. Karina Arcaute for helping in my technical writing development, Mr. David Rodriguez for
aiding in the construction and machining of several components, Mr. Alfonso Fernandez for
helping with the ultraviolet ozone surface treatments, and Mr. Jorge Ramirez for constructing
some of the demonstration pieces included in this thesis. Additionally, I would like to thank Dr.
Benjamin Flores, Mrs. Ariana Arciero, and Mrs. Sara Rodriguez of the University of Texas
System Louis Stokes Alliance for Minority Participation (LSAMP) program for supporting me
via the National Science Foundation Bridge to the Doctorate Fellowship (NSF grant number
HRD-1139929). A special thank you is also owed to Bob Zinniel and Terry Hoppe of Stratasys,
Inc. for providing support via materials, equipment, and advice regarding the development of the
multi-material, multi-technology FDM system.
Finally, I would like to thank my wife, Elissa Espalin, and family for supporting and
encouraging my continued education. In particular, I would like to acknowledge the memory of
my brother “Luisito” which has inspired me to continually better myself and those around me.

vi
Abstract
Over the last three decades, developments within the area of Additive Manufacturing
(AM) have resulted in novel technologies capable of producing highly customized, complex part
geometries in a fraction of the lead time required by traditional manufacturing methods (e.g.,
injection molding, metal casting). In particular, fused deposition modeling (FDM), a material
extrusion AM process, can produce parts using production-grade thermoplastics like acrylonitrile
butadiene styrene, polycarbonate, and polyetherimide. Additionally, non-commercial materials
(e.g., polycaprolactone, ceramic loaded polymers, carbon nanotube loaded polymers) have been
processed using FDM in part to demonstrate the potential diversity in material selection.
Recently, a myriad of personal 3D Printers using material extrusion processes have
received much attention because they resemble the initial steps towards transforming AM
technologies into a home consumer item. These steps were also taken during the 1980s by inkjet
printing technologies when they were first entering the home consumer market. However,
before inkjet printers became a home consumer item, challenges related to the controlled flow of
inks and the clogging of print heads needed to be resolved. Synonymously, FDM technologies
need to resolve issues related to part accuracy, surface roughness, build time, and mechanical
properties before they can be fully adopted by industry and home consumers.
A multi-material, multi-technology (MMMT) FDM system was developed to enable
experimental methods related to the FDM attributes in need of improvement. The MMMT FDM
system consists of two legacy FDM systems, a pneumatic slide, and an overall control system.
The FDM systems were modified so that they mimic a gantry system enabling a work piece to be
transported between each FDM system. A build platform was attached to the pneumatic slide to
enable the transportation of the workpiece. A software program named FDMotion was
developed to control each FDM system and the pneumatic slide via a graphic user interface as
well as provide in-process instructions to the user. The functional MMMT FDM system was
used to explore build process variations, the effect of ultraviolet ozone surface treatments at

vii
every layer on mechanical properties, and the development of a novel heat treatment for multi-
material parts produced via FDM. Additionally, the system was employed to demonstrate the
fabrication of multi-colored parts as well as multi-material parts made from discrete similar and
dissimilar thermoplastics.
The build process variation consisted of depositing fine contours to promote dimensional
accuracy and reduce surface roughness while depositing larger internal fill rasters to decrease
build time. The internal roads were four times thicker and five times wider than the outer roads.
A 55% improvement in surface roughness was measured on a plane that was inclined 10° from
vertical and a 35% reduction in build time was observed when fabricating a simple square prism
(50.8mm by 50.8mm and 25.4mm tall). Additionally, a student’s t-test confirmed that the tensile
properties of tensile specimens were not significantly altered by the build process variation
Multi-material fabrication was demonstrated with the MMMT FDM system by depositing
different materials (similar and dissimilar) into different layers and different regions within a
layer. This fabrication method was performed to construct simple geometries requiring little to
no support material as well as complex geometries that required support material for a majority
of the layers.
An interlayer bond improvement strategy was explored in which an ultraviolet ozone
(UV/O3) surface treatment was implemented before the deposition of a new layer. The UV/O3
treatment was intended to increase surface energy and reduce the local glass transition
temperature, which in turn was expected to increase interlayer bonding. A design of experiments
(DOE) and analysis of variance (ANOVA) was conducted using six UV/O3 exposure times (0,
0.5, 1.0, 1.5, 2.0, or 3.0 minutes) to determine their effect on surface energy and mechanical
properties (ultimate tensile stress (UTS), strain at UTS, and modulus of elasticity). While the
surface energy increased by 26% when exposing ABS P400 for 1 minute, the mechanical
properties remained unchanged. The UV/O3 surface treatment, however, can be used to increase
the surface energy and wettability of FDM-fabricated parts for adhesive bonding processes
requiring clean and chemically active surfaces.

viii
To improve the tensile properties of FDM-fabricated specimens, a novel multi-material
fabrication method and heat treatment were developed; the result being an increase of 25% in
ultimate tensile strength with minor dimensional changes. A shell-and-core configuration was
used wherein the shell material (PC) exhibited a higher glass transition temperature (Tg) than that
of the core (ABS). The specimens were heat-treated at a temperature above the Tg of the core
material but below the Tg of the shell material. This heat treatment removed the interstices
between roads of the core material while limiting dimensional changes of the shell material.

ix
Table of Contents
Acknowledgements ..........................................................................................................................v
Abstract .......................................................................................................................................... vi
Table of Contents ........................................................................................................................... ix
List of Tables ................................................................................................................................. xi
List of Figures ............................................................................................................................... xii
Chapter 1 Introduction ....................................................................................................................1
1.1 Background .............................................................................................................................1
1.2 Motivation ...............................................................................................................................2
1.3 Thesis Objectives ....................................................................................................................3
1.4 Thesis Outline .........................................................................................................................3
Chapter 2 Literature Review ...........................................................................................................5
2.1 Introduction .............................................................................................................................5
2.2 Fused Deposition Modeling (FDM)........................................................................................6
2.3 Anisotropic mechanical properties of FDM-manufactured parts ...........................................9
2.4 Previous interlayer bonding improvement strategies ............................................................11
2.5 Amorphous Polymers............................................................................................................12
2.6 Glass Transition Temperature ...............................................................................................14
2.7 Alternative interlayer bonding improvement strategies ........................................................15
2.8 FDM build strategies.............................................................................................................19
2.9 Additive Manufacturing and multiple materials ...................................................................21
Chapter 3 Novel Multi-Material, Multi-Technology FDM System..............................................24
3.1 Concept .................................................................................................................................24
3.2 Hardware ...............................................................................................................................25
3.3 Control Software: FDMotion ...............................................................................................26

x
3.3.1 FDMotion control and graphic user interface ..............................................................26
3.3.2 Modifying SML files and sending ACL commands to the legacy FDM systems .......27
3.3.3 Placing the extrusion tips at the start location and initiating build sequences .............29
Chapter 4 Experimental Methodology ..........................................................................................31
4.1 Surface Roughness, mechanical properties and build time of build process variation .........31
4.2 Ultraviolet ozone surface treatment for interlayer bond improvements ...............................32
4.2.1 Design of Experiments .................................................................................................32
4.2.2 Statistical Analysis .......................................................................................................37
4.3 Mechanical properties of PC – ABS heat-treated specimens ...............................................40
4.3.1 Fabrication of tensile specimens ..................................................................................40
4.3.2 Mechanical testing .......................................................................................................42
4.3.3 Statistical Analysis .......................................................................................................42
Chapter 5 Results and Discussion ................................................................................................43
5.1 Demonstration: FDM using multi-colors and a build process variation ..............................43
5.2 Demonstration: FDM using discrete multi-materials ...........................................................44
5.3 Properties of parts produced using the build process variation .............................................45
5.4 Contact angle and surface energy of ABS P400 treated with ultraviolet ozone ...................47
5.5 Mechanical properties of ABS P400 specimens manufactured using FDM and ultraviolet ozone....................................................................................................................49
5.6 Mechanical properties of heat-treated multi-material specimens .........................................51
5.7 Dimensional Accuracy of heat-treated multi-material specimens ........................................54
Chapter 6 ........................................................................................................................................55
Conclusion and Recommendations ................................................................................................55
6.1 Conclusions ...........................................................................................................................55
6.2 Recommendations for Future Work......................................................................................57
References ......................................................................................................................................58
Appendix .......................................................................................................................................64
Vita ..............................................................................................................................................97

xi
List of Tables
Table 2.1. Select properties for commercial FDM materials .......................................................8
Table 2.2. Bond energy of typical bonds in thermoplastics .......................................................17
Table 3.1. Select properties for commercial FDM materials .....................................................27
Table 4.1. Levels and responses for determining the effects of UV ozone treatment
on contact angle and surface energy.........................................................................33
Table 4.2. Surface tension of water and ethylene glycol ...........................................................33
Table 4.3. Default processing parameters used in UV ozone experiments ...............................36
Table 4.4. The analysis of variance for the fixed-effects model and a
single-factor experiment ...........................................................................................40
Table 5.1. Tensile properties of specimens built using the standard process
and the build process variation. ................................................................................46
Table 5.2. Single factor ANOVA results for contact angles on solid ABS P400 at
six treatment levels ...................................................................................................48
Table 5.3. Single factor ANOVA results for tensile testing on solid ABS P400 at
six treatment levels ...................................................................................................52

xii
List of Figures
Figure 1.1 Schematic of FDM process for legacy systems ...........................................................2
Figure 2.1. Features of deposited material produced by FDM .....................................................7
Figure 2.2. Schematic of FDM hardware......................................................................................8
Figure 2.3. Typical thermal properties for crystalline and amorphous polymers .......................14
Figure 2.4. Chemical structure of ABS – (C8H8)x·(C4H6)y·(C3H3N)z .........................................14
Figure 2.5. Formation and dissociation reactions that take place within an
ultraviolet ozone apparatus .......................................................................................16
Figure 2.6. Chemical structure of ULTEM – C37H36N2O6 .........................................................19
Figure 2.7. Chemical structure of polycarbonate (PC) – C16H18O3 ............................................18
Figure 2.8. Schematic illustrating the formation of carbonyl and hydroxyl functional
groups on polymer surfaces due to ultraviolet ozone (UV-O3) exposure ...............19
Figure 2.9. Cartoon of a sectioned dome demonstrated staircase effect
and geometrical inaccuracy ......................................................................................20
Figure 2.10. Pressure vessel example where the core and shell configuration can be
heat-treated to improve mechanical properties and reduce porosity ........................22
Figure 2.11. Optical image of cross-sectioned FDM-manufactured part .....................................23
Figure 3.1. Schematic of movements for each FDM system required to arrive
to the same local datum ............................................................................................30
Figure 4.1. Cartoon of build process variation ...........................................................................31
Figure 4.2. Test geometry for measuring surface roughness ......................................................32
Figure 4.3. Test setup used for measuring contact angles of test liquid
on ABS P400 substrate .............................................................................................34
xiii
Figure 4.4. Fabrication of multi-material specimens ..................................................................41
Figure 5.1. Demonstration pieces produced with the multi-color fabrication
and build process variation .......................................................................................43
Figure 5.2. FDM-manufactured sandwich structure ...................................................................44
Figure 5.3. Optical image of cross-sectioned part produced with
the build process variation ........................................................................................45
Figure 5.4. Average surface roughness of specimens built using the standard process
and build process variation .......................................................................................46
Figure 5.5. Contact angle of water and ethylene glycol on UV/O3 treated ABS ........................47
Figure 5.6. Surface energy of UV/O3 treated ABS substrates ....................................................49
Figure 5.7. Ultimate tensile stress of FDM-manufactured P400 ABS specimens
treated with UV/O3 at each layer ..............................................................................50
Figure 5.8. Strain at ultimate tensile stress of FDM-manufactured P400 ABS
specimens treated with UV/O3 at each layer ............................................................50
Figure 5.9. Modulus of elasticity of FDM-manufactured P400 ABS specimens
treated with UV/O3 at each layer ..............................................................................51
Figure 5.10. Results from ASTM D638 tensile testing for untreated and
heat-treated PC – ABS specimens ............................................................................53
Figure 5.11. Mean dimensional changes caused by heat treating PC – ABS specimens .............54

1
Chapter 1
Introduction
1.1 Background
Additive Manufacturing (AM), also known as layer manufacturing, rapid prototyping,
solid freeform fabrication, and 3D printing, is a relatively new fabrication process which entered
the commercial platform in the late 1980’s. Technologies within AM are able to produce parts
directly from computer-aided design (CAD) data and are well suited for low volume production
and mass customization. These parts have found applications as prototypes, structural parts,
tooling, biomedical implants and fashion attire, just to name a few (Bourell et al., 2009). As an
example, large amounts (in the order of millions) of customized dental crowns and housings for
hearing aids are currently being produced by AM technologies (The Economist, 2012). Still,
AM technologies have yet to reach a level of wide acceptance for producing customer or
engineering products.
Fused deposition modeling (FDM) is a heated material extrusion AM process that uses
thermoplastics (ASTM F2792, 2012). The process entails driving a thermoplastic filament into a
liquefier to produce a semi-molten plastic. While scanning a horizontal plane, the plastic is
extruded through a small diameter nozzle and selectively deposited onto a build platform to
produce a cross section or layer (Figure 1.1). The build platform is lowered after the completion
and thermal fusion of each layer until the part is fabricated in its entirety. To enable the
fabrication of complex parts, a sacrificial support material is also deposited for overhanging
features. Although this fabrication process produces geometrically complex parts, several
attributes need to be improved to enable the everyday use of FDM in many industries. In

2
particular, improvements are needed to resolve issues related to poor surface quality, limited
feature resolution, weak bonds between adjacent filaments, and relatively slow build times.
1.2 Motivation
The sustained success of FDM has allowed this technology to evolve since its
commercialization through continuous process enhancements including dimensional accuracy
improvements and material selection expansion. However, much work is required before FDM
can become entirely competitive with traditional plastic manufacturing processes like injection
molding or screw extrusion. Therefore, the main motivation of the present research is to develop
and construct an FDM system that facilitates experimental methods that address the current FDM
aspect in need of improvement: surface quality, feature resolution, bonds between adjacent
filaments, and build times. The developed FDM system will enable the evaluation of three
hypotheses for improving FDM technology. First, it is hypothesized that having access to more
than two extrusion tips will enable the rapid and accurate deposition of both model and support
material using variable layer thicknesses and road widths to improve surface quality, part
accuracy, and reduce build time. Second, it is hypothesized that employing an ultraviolet ozone
vertical translation
support material
heated extrusion
nozzle
Build platform
horizontal translation
Figure 1.1 Schematic of FDM process for legacy systems.
thermoplastic material

3
surface treatment will increase surface energy, which will strengthen interlayer bonding and in
turn improve mechanical properties. Lastly, it is hypothesized that fabricating discrete multi-
materials parts will allow heat treatments for the improvement of mechanical properties and
density (i.e., reduce porosity).
1.3 Thesis Objectives
There are six thesis objectives and are listed as follows:
1. Incorporate two previously modified legacy FDM machines into a single system.
2. Design and develop a software program to control the two modified FDM
machines and enable the fabrication of novel AM parts.
3. Develop and evaluate a process for fabricating geometrically complex parts with
fine contours and coarse internal rasters to improve surface quality, part accuracy,
and build time.
4. Develop a fabrication process using discrete multi-materials to produce novel AM
parts and enable the heat treatment of FDM-manufactured parts for improving
mechanical properties and density.
5. Experimentally determine the effects of ultraviolet ozone surface treatments on
surface energy and mechanical properties.
1.4 Thesis Outline
The subsequent material was divided into the five chapters. Chapter 2 is composed of an
overview of FDM as well as a literature review of topics pertinent to the hypothesis statements in
section 1.2. These topics include the anisotropic mechanical properties of FDM-manufactured
parts, FDM building strategies, previous interlayer bonding improvement processes, and the
nature of amorphous polymers. In Chapter 3 the developed multi-material, multi-technology
(MMMT) FDM system is described including the hardware and software. Chapter 4 consists of
the experimental methodology employed for (1) determining the processing time, surface

4
roughness, and mechanical properties of specimens built using varying layer thicknesses and
road widths (from this point forward referred to as build process variations), (2) determining the
effects of ultraviolet ozone surface treatments on surface energy and mechanical properties, and
(3) determining the effects of heat treatments on the mechanical properties of discrete multi-
material specimens. The results of these experiments are discussed in Chapter 5. Additionally,
multi-material demonstrations and parts produced using the build process variations are
described in Chapter 5. Finally, conclusions and recommendations for future work are offered in
Chapter 6.

5
Chapter 2
Literature Review
2.1 Introduction
Additive Manufacturing (AM) refers to the rapid production of complex objects in a
layer-by-layer fashion directly from three-dimensional Computer Aided Design (CAD) data and
in doing so effectively circumvents the costly production steps associated with traditional
manufacturing (e.g., process planning, long lead times, expensive tooling). Initially, AM
technologies and their products were primarily used for prototyping purposes, but recent
advancements have altered the focus of AM to include the production of end-use parts in the
pursuit of making a shift to Direct Digital Manufacturing (DDM) (Bellini and Guceri, 2003).
Generally, an AM technology will employ seven steps in the fabrication of a part; 1) generating a
CAD model, 2) converting the CAD model to stereolithography (STL) file format, 3) generating
tooling commands from the STL file and transferring them to the AM system, 4) setting up the
AM system, 5) building the part layer by layer, 6) removing the fabricated part from the AM
system, and 7) post-processing the part. The duration of the building process (step 5) is
dependent on the AM technology being used and its process parameters as well as the shape and
orientation of the part. The AM technology options include those that use a system of liquid
polymers, discrete particles, molten materials, or solid sheets where each uses a unique
technology to deposit or solidify materials – lasers, liquefiers, electron beams, or print heads
(Gibson, Rosen, and Stucker, 2010). The application of the finished product dictates the material
and technology to be used as well as the degree of post-processing – some parts may require
little or no post-processing while others may require machining, sanding, priming, and painting.

6
Although initial applications of AM were limited to prototyping, the more recent
improvements of mechanical properties and surface finish have allowed the mass customization
of structural parts, tooling, biomedical parts, architectural design representations, and artwork
(Bourell et al., 2009 roadmap). Within this method of manufacturing, several technologies have
been introduced including stereolithography, fused deposition modeling (FDM), laser sintering,
laser melting, laminated object manufacturing, laser engineered net shaping, and electron beam
melting with capabilities of processing thermoplastics, ceramics, photoreactive resins, metals,
and biocompatible materials.
2.2 Fused Deposition Modeling (FDM)
Fused Deposition Modeling (FDM), a registered trademark of and a technology
developed by Stratasys, Inc. (commercialized in 1990), is a material extrusion process that
fabricates components in a layer-by-layer fashion using thermoplastics (ASTM F2792, 2012).
According to the Wolhers Report (2012), Stratasys, Inc. is the leader among manufacturer of
industrial AM systems indicating that FDM is the most utilized AM technology. As such, much
effort has been devoted to finding novel applications for FDM-manufactured parts and resolving
issues related to feature resolution, part accuracy, interlayer bonding, and surface finish.
FDM follows a variation of the general steps described above: 1) generate a CAD model,
2) convert the CAD model to STL file format, 3) import the STL file into Insight software for
slicing and generating toolpaths in the form of a SML file, 4) build the part applying the
processing parameters specified by the user, and 5) perform the required post processing (e.g.,
removal of support material, surface smoothing). Among the most important processing
parameters are the air gap between rasters, road width, layer thickness, and raster orientation,
which are illustrated in Figure 2.1. From a production standpoint, these processing parameters

7
are critical because they have a great effect on build time. Additionally, these parameters have a
significant effect on the performance of FDM-manufactured parts, as is discussed in later
sections.
An FDM machine builds parts by driving a thermoplastic filament (Ø = 1.77mm) into a
heated liquefier and extruding a semi-molten polymer fiber through a small-diameter nozzle
(Ø = 0.127, 0.118, 0.254, or 0.330mm). The liquefier is fixed on an extrusion head that traverses
parallel to the XY plane and over a build platform (Figure 2.2). The extrusion head is equipped
with two liquefiers that work in concert to deposit both a model and sacrificial support material
required for the fabrication of overhanging features and complex geometries. After the layer is
completed, the build platform lowers along the Z direction a predetermined distance equivalent
to the layer thickness to allow for the deposition of the next layer. In this sense, a part is
fabricated from bottom to top and is composed of concatenated layers. FDM-manufactured parts
typically exhibit an accuracy of ± 0.127mm (0.005-in.). Moreover, this layered manufacturing
process in carried out in a temperature controlled envelope that aids in controlling material
shrinkage and development of internal stresses (Wang, Xi, and Jin, 2007).
road width
air gap layer thickness
raster contour
Figure 2.1. Features of deposited material produced by FDM

8
When compared to other AM technologies that process polymers such as
stereolithography and laser sintering, FDM has a clear advantage in that a variety of production
grade thermoplastics may be processed – commercial materials for FDM (Table 2.1) include
acrylonitrile-butadiene-styrene (ABS), polycarbonate (PC), PC-ABS blend, ABS-M30, and
polyetherimide (ULTEM 9085). Additionally, non-commercial materials (e.g., poly(methyl
methacrylate) (Espalin et al., 2010), poly(ε-caprolactone) (Zein, et al., 2002), silicon nitride
ceramic (Iyer et al., 2008)) have also shown promise for use with FDM. The material choices
Find datum for FDM1 Tensile Strength Tensile Modulus Glass Transition
Temperature Coefficient of Thermal
Expansion Specific Gravity
MPa MPa °C mm/mm/°C
ABS 22.00 1,627 104 10.08 X 10⁻⁵ 1.05 ABS-M30 36.00 2,413 108 8.46 X10⁻⁵ 1.04 PC 68.00 2,280 161 3.80 X 10⁻⁵ 1.20 PC-ABS 41.00 1,917 125 7.40 X10⁻⁵ 1.20 ULTEM 9085 71.64 2,220 186 ---- 1.34
Table 2.1. Select properties for commercial FDM materials
thermoplastic filament
extrusion tip
y z
x liquefier
extrusion head
build platform
Figure 2.2. Schematic of FDM hardware (overview on left and close up of extrusion head on right)

9
for stereolithography and laser sintering are limited and lack the robust mechanical and thermal
properties as well as high chemical resistance of materials used with FDM.
Despite this clear advantage, the transition to Direct Digital Manufacturing (DDM) and
industry-wide adoption of FDM technology has not occurred due to poor surface quality
(Pandey, Reddy, and Dhande, 2003a), low feature resolution (when compared to SL), weak
bonds between adjacent filaments (Bellini and Guceri, 2003; Rodriguez, Thomas, and Renaud,
2003), and relatively long build times. Poor surface quality is a result of “stepping” or the
unsmooth transition from one layer to the next. Weak interlayer bonds give rise to anisotropic
material properties. As an example, tensile strength is greater along the axial direction of the
deposited filament when compared to loads carried across filaments or layers (Ahn, et al., 2002).
This is primarily due to weak bonds between adjacent filaments. While many users of FDM
commonly orient filaments along the load bearing direction, the fabrication of functional parts is
limited and sometimes prohibited by their anisotropic mechanical properties that lack the ability
to withstand transverse loading. As such, any improvement to bonds between adjacent filaments
would enable the production of functional FDM-manufactured parts.
2.3 Anisotropic mechanical properties of FDM-manufactured parts
The layer-by-layer manufacturing process employed by FDM results in parts exhibiting
anisotropic mechanical properties. This behavior is of utmost importance in the fabrication of
functional parts and as a response, much research has been performed to identify the design and
processing parameters that have a significant effect on performance criteria. Work performed by
Es-said et al. (2000) analyzed the effect of layer orientation (0°, 45/-45°, 45°, 90°, and 45/0°) on
three mechanical properties. This study demonstrated that layer orientation had an effect on
tensile strength, flexural strength, and absorbed energy during Izod impact testing as well as

10
fracture path. Similar work performed by Ahn et al. (2002) employed a design of experiments to
conclude that the air gap between rasters and orientation of rasters are process variables that have
an effect on tensile strength. In particular, this work noted that tensile strength had a dependence
on build orientation resulting in tensile strength anisotropy. Other studies performed by Bellini
and Guceri (2003) tested filaments before and after the FDM extrusion process and conclude that
the process does not have a significant influence on tensile strength and modulus, but does affect
maximum strain – possibly due to the viscoelastic nature of polymers. Lee et al. (2005) utilized
the Taguchi method (FDM parameters: air gap, raster angle, raster width, and layer thickness;
each at three levels) to determine the optimal process parameters that yielded the best
performance from a fabricated catapult. This work indicated that application-specific parameters
may be determined by considering the main effects revealed through a statistical analysis. Sun et
al. (2008) noted that the bond quality between adjacent polymer filaments is dependent on the
degree of neck growth as well as the randomization of polymer chains across the interface and
molecular diffusion. Through in-process monitoring, it was determined that the temperature
history of the interfaces was a major contributor to bond quality. Specifically, microphotographs
of cross-sections revealed that bottom-most layers achieved larger neck growth when compared
to top layers. When considering the part location on the build platform, it was concluded that
both the location and immediate surroundings (i.e., presence or absence of adjacent parts) have
an effect on the temperature history, and therefore bond quality. Sood et al. (2010) implemented
a central composite statistical design to determine the effect of five processing parameters (part
orientation, layer thickness, raster angle, raster width, and air gap between rasters; each at three
levels) on tensile, flexural, and impact strength. Results included the use of response surfaces to
identify relationships between the processing parameters of interest.

11
From the aforementioned works it can be concluded that anisotropic properties are due to
1) the alignment of polymer molecules along the raster direction, 2) the presence of voids
between adjacent rasters, 3) residual stresses caused by volumetric shrinkage, and 4) weak
interlayer bonding. Research has shown that FDM-manufactured parts fail under a fraction of
the tensile stress that an injection molded ABS P400 parts is capable of withstanding ( 10 - 73%
of 26 MPa) (Ahn et al., 2002). Furthermore, research related to the anisotropy of FDM-
manufactured parts has mostly been devoted to determining the optimum FDM processing
parameters and little work has been devoted to developing an interlayer bonding improvement
method independent of the FDM processing parameters.
2.4 Previous interlayer bonding improvement strategies
The anisotropic mechanical properties associated with FDM-manufactured parts are often
mitigated by designing and orientating the part so that the layers and fibers can accommodate the
mechanical loading. However, this strategy cannot always accommodate every loading scenario
and as a result anisotropic mechanical properties inhibit FDM-manufactured parts from being
used in many applications (e.g., pressure vessels, structural components undergoing multi-
direction mechanical loading). Having realized this limitation, several research groups have
attempted to find a permanent solution that addresses bonding between layers. Parker et al.
(2009) utilized hot pressing to evaluate if hot isostatic pressing (HIP) could be an effective
method for eliminating the voids present between adjacent polymer fibers. Polyphenylsulfone
(PPSU), PC, and ULTEM 9085 were tested at pressures up to 150 MPa and at temperatures
below their associated glass transition temperatures. Results from these studies demonstrated
that the volume of voids may be reduced at optimum pressure and temperature conditions;
however, dimensional distortion may arise if either pressure or temperature is too high. Despite

12
the reduction in volume fraction of voids, the corresponding ultimate tensile strength did not
consistently increase. This behavior lead the authors to conclude that the reduction in volume
fraction of voids does not necessarily strengthen the produced parts.
Other work performed by Partain (2007) used a pre-deposition heating system in an
attempt to increasing the degree of material bonding between polymer fibers and layers. The
pre-deposition heating system was designed with the intent of increasing the temperature at the
layer-layer interface by using localized forced air at the recently deposited material before the
deposition of additional material. Essentially, one can imagine a hot air welder tool aimed
directly at the material being deposited. Single factor and multiple factor design of experiments
were performed and the results were processed through an analysis of variance. The authors
concluded that parts produced with the pre-deposition heating system did not exhibit higher
flexural strength that those produced without the pre-deposition heating system. Evidently,
significantly and consistently improving interlayer bonding for FDM-manufactured parts has
been unsuccessful and more efforts in this area are required.
2.5 Amorphous Polymers
Polymers can be generally characterized based on their structure, arrangement and
physical form (Stevens 1999, 61). As a result, polymers are typically grouped into one of two
morphologies – amorphous or crystalline. The discussion here is solely focused on the
amorphous state since ABS polymer (commonly accepted as amorphous) was used in this study.
Amorphous polymers are characterized by a physical state in which molecules, for the most part,
are ordered randomly, and the polymer resembles a glass. Conversely, molecules in crystalline
polymers are aligned in regular patterns or arrays that are in part analogous to lattice crystals, for
13
example, of solid crystalline metals. However, crystalline polymers never reach a complete
crystalline state and therefore are often referred to as semicrystalline.
To a great extent, the properties of polymers are dependent on molecular weight and
chemical structure. This argument is supported by the fact that specific molecular weights must
be achieved before attaining a desired set of mechanical properties (Stevens 1999, 61). These
specific molecular weights are highly dependent on the polymer’s molecular structure.
Furthermore, mechanical properties in part arise from the attractive forces between the polymer
molecules. These intermolecular forces can generally take form as induction forces, dipole-
dipole interactions (including hydrogen bonding), dispersion, London forces among nonpolar
molecules, ionic bonding, or ion-dipole interactions. These secondary bonding forces contribute
to achieving the desired mechanical properties for polymers (Stevens 1999, 62).
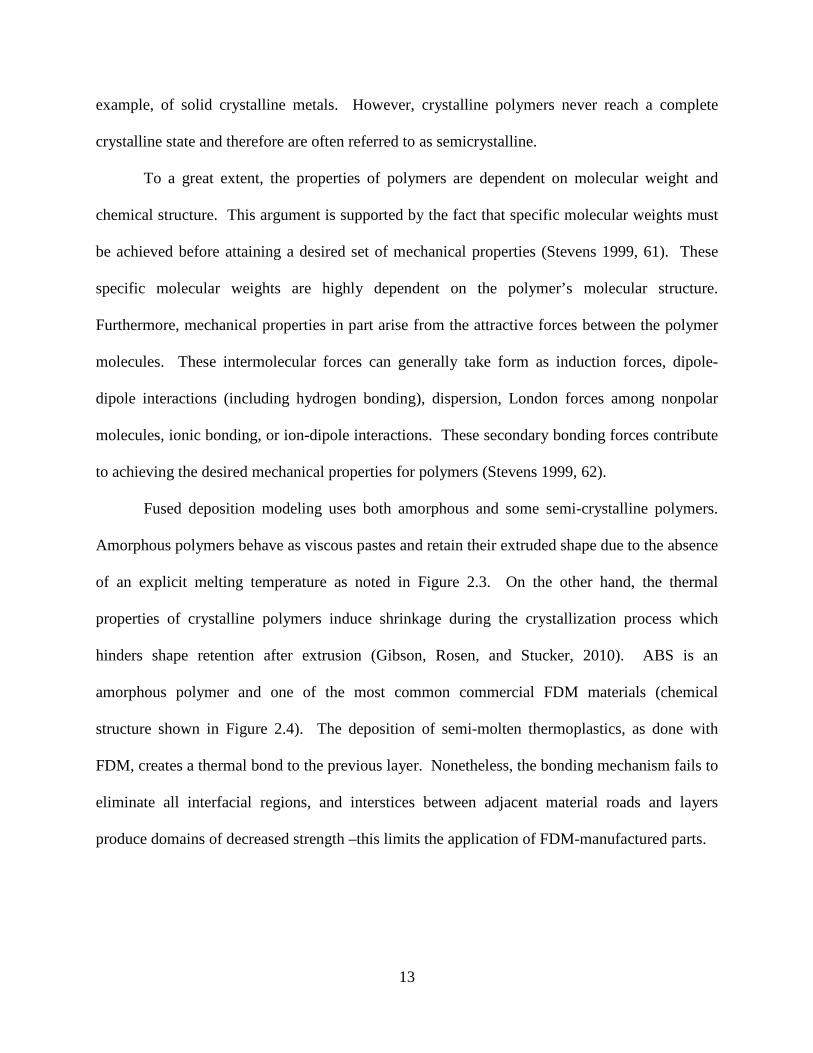
Fused deposition modeling uses both amorphous and some semi-crystalline polymers.
Amorphous polymers behave as viscous pastes and retain their extruded shape due to the absence
of an explicit melting temperature as noted in Figure 2.3. On the other hand, the thermal
properties of crystalline polymers induce shrinkage during the crystallization process which
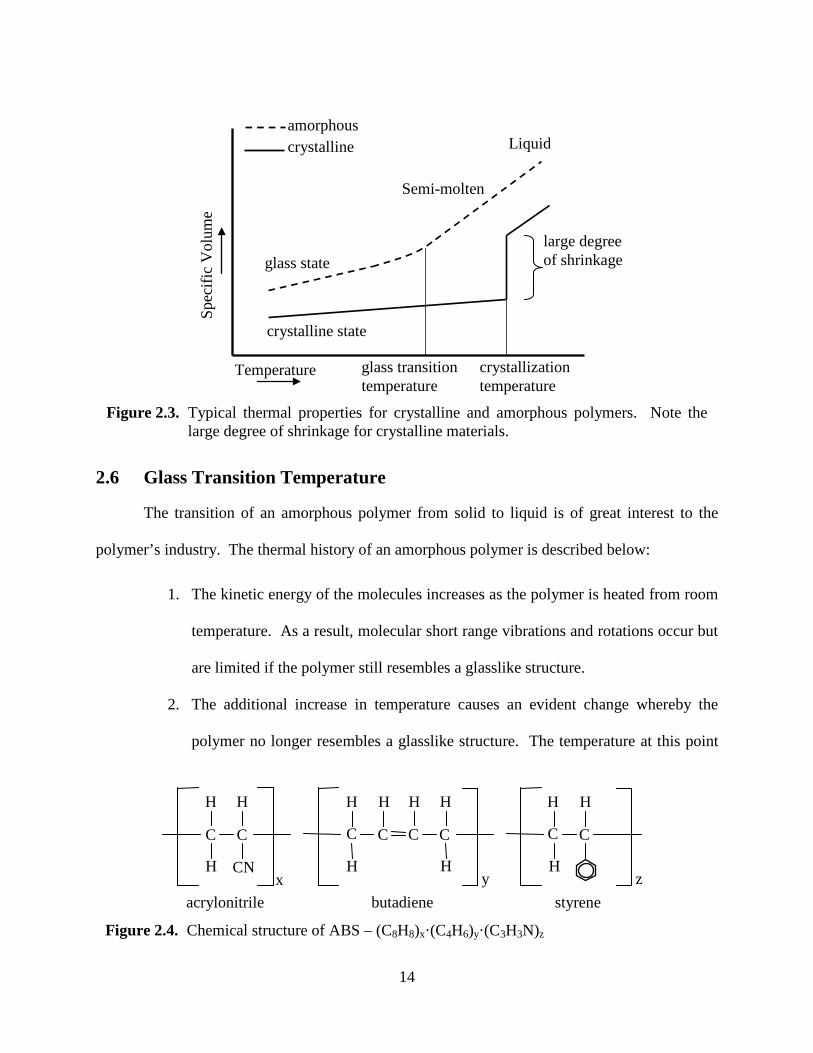
hinders shape retention after extrusion (Gibson, Rosen, and Stucker, 2010). ABS is an
amorphous polymer and one of the most common commercial FDM materials (chemical
structure shown in Figure 2.4). The deposition of semi-molten thermoplastics, as done with
FDM, creates a thermal bond to the previous layer. Nonetheless, the bonding mechanism fails to
eliminate all interfacial regions, and interstices between adjacent material roads and layers
produce domains of decreased strength –this limits the application of FDM-manufactured parts.
14
2.6 Glass Transition Temperature
The transition of an amorphous polymer from solid to liquid is of great interest to the
polymer’s industry. The thermal history of an amorphous polymer is described below:
1. The kinetic energy of the molecules increases as the polymer is heated from room
temperature. As a result, molecular short range vibrations and rotations occur but
are limited if the polymer still resembles a glasslike structure.
2. The additional increase in temperature causes an evident change whereby the
polymer no longer resembles a glasslike structure. The temperature at this point
Temperature crystallization temperature
glass transition temperature
Liquid
Semi-molten
glass state
crystalline state
large degree of shrinkage
Spec
ific
Vol
ume
amorphous crystalline
Figure 2.3. Typical thermal properties for crystalline and amorphous polymers. Note the large degree of shrinkage for crystalline materials.
H
H
H
CN
C C
x
H
H
H
C C
y
H
H
H
C C
H
H
H
C C
z acrylonitrile butadiene styrene
Figure 2.4. Chemical structure of ABS – (C8H8)x·(C4H6)y·(C3H3N)z

15
is commonly referred to as the glass transition temperature and is denoted by Tg.
3. If the polymer is heated further, a loss of elasticity is experienced and a flowable
liquid is produced
At a molecular level, the glass transition temperature signifies a condition where the
following occur: 1) long-range molecular motion, 2) rotational freedom, and 3) segmental
motion of the chains. Upon reaching the glass transition temperature, the segmental motion is
estimated to involve ~20-50 chain atoms, which indicates that there must be an increase of free
volume (the space between atoms) and therefore an increase of specific volume. Several studies
have recorded other notable behaviors such as a change in enthalpy, modulus, stiffness,
refractive index, and thermal conductivity (Stevens 1999, 70).
2.7 Alternative interlayer bonding improvement strategies
The successful decomposition of photoresist polymers via ultraviolet (UV) irradiation by
Bolon and Kuns in 1972 lead to the development of a dry cleaning method wherein surface
contaminants are decomposed by the UV irradiation and ozone (O3) chemical oxidation – this
photo-sensitized oxidation process is known as ultraviolet ozone (UV-O3) cleaning (Tsao and
DeVoe, 2009). Although UV-O3 was initially used to remove unwanted organic compounds
(e.g., cutting oils, soldering fluxes, contaminants resulting from persistent air exposure) from
substrate surfaces such as optical lenses, the process may also be used to create functional groups
for enhanced bonding/adhesion of organic substrates. In terms of surface free energy, functional
groups are created when polymers chains that have undergone scission due to the UV irradiation
react with free oxygen (also produced by UV irradiation), which increase the polar component to
its total surface free energy (Mathieson and Bradley, 1995).

16
The UV-O3 apparatus uses a low-pressure mercury vapor lamp to produce two principal
wavelengths: 184.9 nm and 253.7 nm. The simultaneous presence of both wavelengths is
critical. O3 is generated when the 184.9 nm UV rays interact with atmospheric O2, while the
253.7 nm UV rays dissociate the O3 to produce atomic oxygen (Figure 2.5). The continuous
formation and dissociation of O3 ensures a steady presence of atomic oxygen that has exceptional
oxidizing abilities. Concurrently, the organic compounds being irradiated with the UV rays
undergo photolysis wherein ions, free radicals, excited molecules, and neutral molecules are
produced.
The energy (E) available from a photon is determined by employing Planck’s relation
𝐸 = ℎ𝜈 Equation 1
where h is Planck’s constant (6.626 × 10⁻³⁴ J-s) and ν is the photon’s frequency. Furthermore,
the frequency is related to wavelength λ by
𝜈 =𝑐𝜆
Equation 2
where c is the velocity of light (2.998 × 1010 cm-s-1). Combining these two relations and
incorporating Avogadro’s constant N (6.022 × 10²³ mol-1) yields the energy per mol available
from a photon at a particular wavelength.
𝐸 =𝑁ℎ𝑐𝜆
Equation 3
formation of O3 with 184.9 nm UV ray
O2 O + O O2 + O O3
dissociation of O3 with 253.7 nm UV ray
O3 O2 + O
Figure 2.5. Formation and dissociation reactions that take place within an ultraviolet ozone apparatus.

17
Calculations for the energy per mol available from the principal UV rays associated with
UV-O3 cleaning are as follows.
𝐸184.9𝑛𝑚 =(6.022 × 10²³ 𝑚𝑜𝑙−1)(6.626 × 10⁻³⁴ 𝐽 ∙ 𝑠)(2.998 × 10¹⁰ 𝑐𝑚 ∙ 𝑠−1)
184.9 × 10⁻⁷𝑐𝑚
= 647 𝑘𝐽 ∙ 𝑚𝑜𝑙−1
Equation 4
𝐸253.7𝑛𝑚 =(6.022 × 10²³ 𝑚𝑜𝑙−1)(6.626 × 10⁻³⁴ 𝐽 ∙ 𝑠)(2.998 × 10¹⁰ 𝑐𝑚 ∙ 𝑠−1)
253.7 × 10⁻⁷𝑐𝑚
= 472 𝑘𝐽 ∙ 𝑚𝑜𝑙−1
Equation 5
Typical bonds present in organic compounds and their corresponding bond energy
(Blansky and Ellison, 2003) are shown in Table 2.2. The energy supplied through the UV-O3
process must exceed the bond energy to promote photolysis and yield free radicals. When UV-
O3 is used for removing organic contaminants, these free radicals react with the atomic oxygen to
form simple, volatile molecules such as CO2, H2O, and O2, which are easily removed
(Truckenmuller et al., 2004).
As previously mentioned, UV-O3 exposure can be used to create functional groups for
enhanced bonding/adhesion of organic substrates. The composition of ABS, PC, and ULTEM
Bond Bond Energy (kJ mol-1) Bond Bond Energy
(kJ mol-1) Bond Bond Energy (kJ mol-1)
O – O 138.9 C – N 291.6 C = O 724 O = O 490.4 C ≡ N 791 C – Cl 328.4 O – H 462.8 C - O 351.5 C – F 441.0 C – C 347.7 C = C 607 H – Cl 431.8 C – H 413.4 C ≡ C 828 N – H 309.8
shaded cells indicate the bonds present in ABS, PC, or ULTEM that can be broken via UV-O3
Table 2.2. Bond energy of typical bonds in thermoplastics

18
(common polymers used with FDM) can be seen in Figures 2.4, 2.6, and 2.7. Based on the
energy per mol available from UV rays at 184.9 nm and 253.7 nm, the bonds that can be broken
with UV-O3 are highlighted in Table 2.2. Moreover, the UV-O3 exposure can break the polymer
chains and insert functional groups containing oxygen (Tsao and DeVoe, 2009). That is,
chemical bonds within hydrocarbons can be broken and oxidized with atomic oxygen to produce
carbonyl and hydroxyl functional groups (Figure 2.8), which result in an increase of surface
energy.
In addition to the creation of functional groups on the surface of the polymer, the glass
transition temperature (Tg) of the polymer is locally reduced. Work performed by Truckenmuller
et al. (2004) has shown that treating poly(methylmethacrylate) with UV-O3 reduces the Tg by
~60 K. This reduction of Tg is localized to the thickness of the affected polymer layer, which is
determined by the optical absorption length of the polymer. As an example, the absorption
length of ABS when irradiated with 248nm wavelength is 0.11µm (Frerichs et al., 1995).
Therefore, the bulk thermomechanical properties of the polymer (treated with OV-O3) do not
experience consequential changes. This behavior allows the bonding of polymers at
temperatures below their bulk Tg without causing any noticeable changes in dimensional
accuracy. It can also be argued that if substrates are bonded at the bulk Tg, then the UV-O3
affected area will be well above the local Tg, which will promote more and quicker molecular
diffusion at the bond interface. This is the foundation for the second hypothesis statement in
C O
CH3
CH3
O C
O
n
Figure 2.6. Chemical structure of polycarbonate (PC) – C16H18O3.

19
section 1.2: employing an ultraviolet ozone surface treatment will increase surface energy,
which will strengthen interlayer bonding and in turn improve mechanical properties.
2.8 FDM build strategies
A CAD model is generated and converted to a stereolithography (STL) file format. In the
STL model, a network of triangular facets on the surface of the solid model approximates the
geometry of the CAD model. Creating slices throughout the model’s height is accomplished by
intersecting it with horizontal planes. The intersection of the horizontal plane and the STL
model results in a polygon, which lies on the intersecting plane and is referred to as a slice. A
layer is produced by depositing material at the periphery and interior of the bounding polygon.
Conventional FDM processes utilize uniform layer thicknesses for the layers that make up a part.
C
N CH3
CH3
O C
O
n
C
C O
O
O
C
O
N
Figure 2.7. Chemical structure of ULTEM – C37H36N2O6
OH O OH O
OH O
UV-O3
Figure 2.8. Schematic illustrating the formation of carbonyl and hydroxyl functional groups on polymer surfaces due to ultraviolet ozone (UV-O3) exposure.

20
For complex geometries, the bounding polygons at one slice are different from that of an
adjacent slice. In the case where polygons between adjacent slices are dramatically different, the
deposited layers do not represent the geometry accurately and the resulting part exhibits poor
surface quality. In near horizontal surfaces, the inaccuracy is more pronounced and a series of
layers, in cross-section, resemble a staircase (Figure 2.9). Therefore, this geometrical inaccuracy
is referred to as the staircase effect. Moreover, the staircase effect causes undesirable surface
roughness and detrimentally affects aesthetics.
In work related to FDM, several methods have been proposed to reduce the staircase
effect. Adaptive slicing – a slicing method (Figure 2.9B) that assigns variable layer thicknesses
based on a part’s geometry to better approximate the outer surface (Kulkarni and Dutta, 1996;
Pandey, Reddy, and Dhande, 2003a) – is one example of such effort at improving surface
quality. The adaptive slicing method, however, is not support by commercial software or
hardware. Other work that used a standard FDM machine equipped with two extrusion tips was
focused on depositing model material with regular thin layers for exterior regions while using
Figure 2.9. Cartoon of a sectioned dome demonstrated staircase effect and geometrical inaccuracy. A) uniform layer thickness. B) varying layer thickness produced by adaptive slicing.
A B
deposited material
deposited material
actual geometry
staircase effect
21
thick layers for interior regions to reduce the build time up to 80% while preserving the surface
quality (Sabourin, Houser, and Bohn, 1997). This approach has demonstrated remarkable
improvements to FDM build times and has partially inspired the first hypothesis statement in
Section 1.2: having access to more than two extrusion tips will enable the rapid and accurate
deposition of both model and support material using variable layer thicknesses and road widths
to improve surface quality, part accuracy, and reduce build time. The access to four extrusion
tips with different orifice diameters not only allows build variation for the model material, but
the support material can also be deposited using the same method to further reduce build time.
2.9 Additive Manufacturing and multiple materials
The use of discrete multi-materials within single components is viewed as a technically
challenging and economically favorable manufacturing method that can enable unprecedented
levels of functionality and adaptability (Salonitis et al., 2009). By utilizing multi-material
components, economic and lightweight designs may be achieved via the reduction of required
assembly processes and parts. The automotive industry has already begun taking advantage of
multi-material designs in numerous applications (e.g., multi-colored taillights, components with
compliant hinges).
Polymers and fiber reinforced polymers are widely used because they exhibit such
characteristics as low density, reduced manufacturing cost, ease of manufacturing, high specific
strength, and exceptional resistance to corrosion (Mangus, 2012; Young and Lovell, 2011;
Zhong et al., 2001). Similarly, these same attributes have attracted much attention in the area of
AM. Previous work has demonstrated the use of AM technologies in conjunction with multi-
materials to produce a variety of functional components including electroactive polymer
actuators (Malone and Lipson, 2008) and biomedical scaffolds (Arcaute, Mann, and Wicker,

22
2006). However, there is no indication in literature that FDM has been explored for discrete
multi-material fabrication even though production-grade thermoplastics (e.g., polycarbonate,
acrylonitrile butadiene styrene) are already commercially available for use with FDM, which
may generate greater functionality.
In practice, joining of similar and dissimilar polymer materials can be achieved by
fastening mechanically, welding, or bonding with adhesives; however, each of these methods are
susceptible to failure due to various factors. For example, in the presence of humidity the
development of corrosion on metallic fasteners can ultimately lead to premature failure.
Components joined with adhesives can fail due to improper surface treatment, humidity and
ageing (Campilho et al., 2012), and welding can be difficult to accomplish when the contact
surfaces have complex geometries. The fusion joining performed with FDM is accomplished
when thermoplastic material is deposited at a temperature sufficiently high so that the previously
deposited layer is thermally activated up to a polymer chain mobility level at which the surface
of the layers are chemically or covalently united (Haisma and Spierings, 2002; Sun et al., 2008).
shell material (higher Tg)
core material (lower Tg)
Figure 2.10. Pressure vessel example where the core and shell configuration can be heat-treated to improve mechanical properties and reduce porosity.

23
An FDM system with more than two extrusion tips may enable the fabrication of
complex, discrete multi-material components by using at least two tips for dissimilar model
materials and one tip for support material. It is anticipated that fabricating with two dissimilar
materials in a shell-and-core configuration (Figure 2.10) will enable innovative heat treatments
of FDM-manufactured parts. Specifically, dissimilar materials exhibiting different glass
transition temperatures (Tg) can be heat-treated to improve both the density and mechanical
properties of the core material without distorting the geometry. This concept is the basis for the
final hypothesis: fabricating discrete multi-materials parts will allow heat treatments for the
improvement of mechanical properties and density of FDM-manufactured parts. If the heat
treatment is performed above the Tg of the core material but below that of the shell material, the
core material will flow like a viscous fluid to eliminate interstices (Figure 2.11) commonly found
in FDM-manufactured parts (Sun et al., 2008) while prohibiting (1) long-range molecular
motion, (2) rotational freedom, and (3) segmental motion of the shell material chains – behavior
that results in physical deformation and is observed at and above the glass transition temperature
of a thermoplastic (Young and Lovell, 2011).
interstices
model material
Figure 2.11. Optical image of cross-sectioned FDM-manufactured part. Note the interstices between the model material.

24
Chapter 3
Novel Multi-Material, Multi-Technology FDM System
3.1 Concept
FDM may be considered a multiple material fabrication process since both a model and
support material is extruded within one single machine. Although the support material is
sacrificial, the two extrusion tips contained in one FDM machine must work in concert to
accurately fabricate the desired geometries. For the multi-material, multi-technology (MMMT)
FDM system, this concept was extended to include four extrusion tips and allow the use of at
least three discrete model materials in one fabricated part.
In this work, a multi-material, multi-technology FDM system, referred to as MMMT
FDM system for convenience, was designed and constructed to enable experimental methods
that address the current FDM aspect in need of improvement: surface quality, feature resolution,
bonds between adjacent filaments, and build times. In addition, the fabrication of thermoplastic
parts composed of discrete multiple materials can be explored. The MMMT FDM system
includes two legacy FDM machines in which four extrusion tips were made available for the
build process variations and fabrication of multi-material components. Essentially, one extrusion
tip was reserved for the support material and the other extrusion tips were available for three
thermoplastics. Advancements in discrete multi-material fabrication are also being performed in
other polymer processing technologies to enable co-extrusion and co-molding of discrete
polymers. These advancement efforts have been motivated by a variety of benefits including: 1)
eliminating the need to assemble discrete polymer components, 2) increasing wearability of
surfaces by including abrasion resistance polymers, 3) achieving aesthetic requirements by using
polymers of different colors, and 4) attaining desired properties (e.g., bulk

25
tensile/compressive/flexural strength, weight, thermal conductivity) by strategically combining
layers of polymers that display different properties. It should be noted that these benefits apply
to the FDM of multiple polymers as well as multiple material systems with one or more discrete
materials made of ceramic or a low melting temperature metal alloy (solder). Although the work
presented here does not include ceramics or solders, recent work (Bellini, Shor, and Guceri,
2005; Allahverdi et al., 2001; Mireles et al., in press) has enabled the processing of these
materials using FDM and as such could be implemented with the MMMT FDM system. The
current state of this system (Appendix A) includes two legacy FDM systems working in concert
to fabricate multi-material components. Further details regarding the hardware and software
configurations are discussed in the following sections.
3.2 Hardware
The MMMT FDM system includes two legacy FDM machines, a pneumatic slide, a
programmable automation controller, and a central PC. The legacy FDM machines (models
FDM 3000 and 2000, Stratasys Inc., Eden Prairie, MN) were used because the standard
operations of these machines allow the user to specify model, support, and envelope
temperatures. This is particularly beneficial in the sense that non-commercial FDM polymers
may be processed, as demonstrated with composite materials (Zhong et al., 2001) and
polymethylmethacrylate (Espalin et al., 2010), in contrast to the current FDM machines (e.g.,
Fortus 400mc or 900mc), which use material-specific microchip canisters that lock-in the
machine build parameters.. Moreover, each legacy FDM machine communicates using an
Automove® Control Language (ACL) that is relatively easy to modify for accommodating non-
commercial FDM polymers and interrupting the fabrication process.

26
The two legacy FDM machines were modified so that the X/Y traversing extrusion head
was installed on the Z stage. The modifications to the FDM systems were performed in previous
work (Choi et al., 2011). As previously mentioned, the non-modified FDM machine consists of
an independent X/Y traversing extrusion head and a Z stage. Installing the X/Y traversing head on
the Z stage allowed the FDM system to mimic a gantry and enabled the transportation of the
work piece between the first FDM machine (FDM1) and the second FDM machine (FDM2).
A modular, multiple position pneumatic slide (series SFM, PHD, Inc., Fort Wayne,
Indiana) delivering a +3.0/-0.0mm travel tolerance and ±0.04mm repeatability was used to
transport the work piece between the two FDM machines. The pneumatic slide was configured
with two adjustable end stops at each FDM machine and a mid-position actuator as well as
corresponding magnetic, solid-state switches at each stop – the voltage output generated by the
switches allowed for monitoring the build platform position and coordinated the overall
programming logic. Cap and saddle mounted shock absorbers were installed to address abrupt
deceleration and dispersed end-of-travel kinetic energy that could have dislodged the work piece
from the build platform.
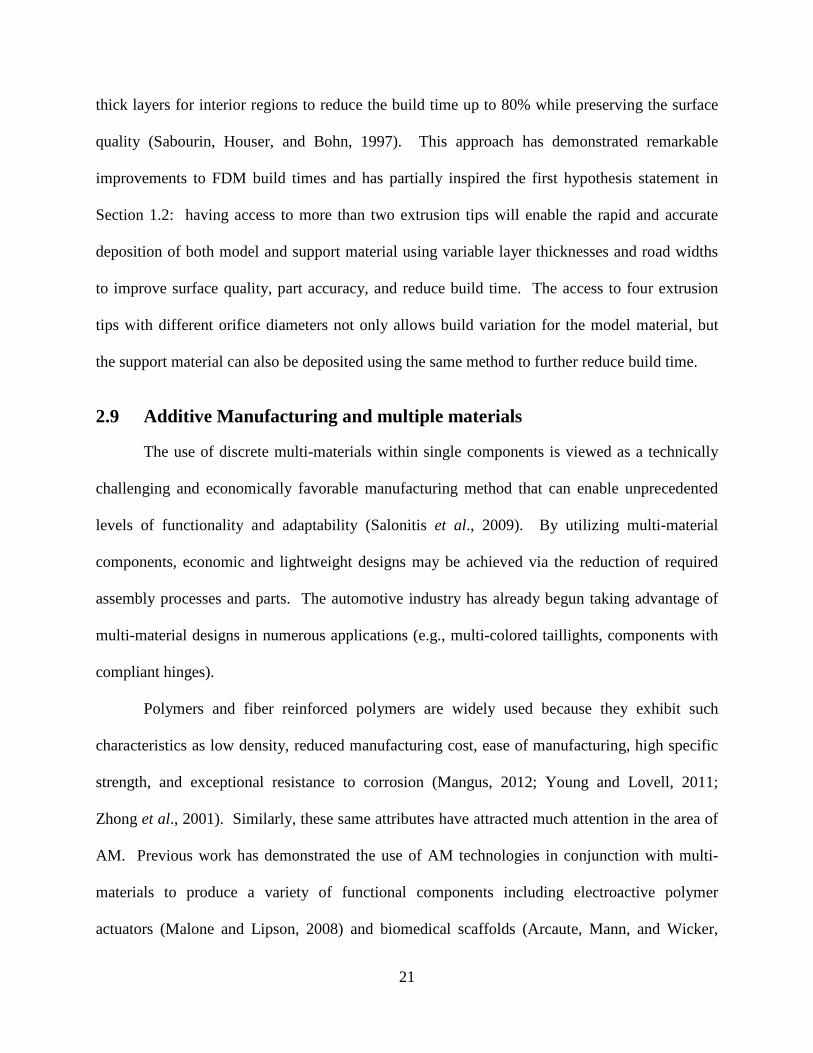
The two FDM systems and the pneumatic slide were controlled through the use of an
overall control system. Table 3.1 provides a brief description of noteworthy components that
constitute the control system as well as the component functions for the MMMT FDM system.
3.3 Control Software: FDMotion
3.3.1 FDMotion control and graphic user interface A software program and graphic user interface (GUI) was developed using LabVIEW
2011 (National Instruments Corporation, Austin, TX) to control the fabrication process within
the MMMT FDM system. The custom-made software program (Appendix C) was named
27
FDMotion for convenience. Through this interface, the user is able to control the pneumatic
slide (Figure C3), each of the two extrusion heads (Figure C4), and send the toolpath commands
to the MMMT FDM system. The block diagram in Appendix B illustrates the sequence of
actions that are performed by FDMotion.
FDMotion was designed to provide users with two operating modes – Single FDM
operation and Multiple FDM operation. The original standalone software supplied with each
technology is used within FDMotion. For instance, FDMotion interfaces with both FDM
systems via the FDM Status software (Stratasys, Inc., Eden Prairie, MN).
3.3.2 Modifying SML files and sending ACL commands to the legacy FDM systems The Insight software (Stratasys, Inc., Eden Prairie, MN) that ships standard with all FDM
machines is designed to import a CAD model and slice it at predetermined locations along the Z
building direction. Each slice is then treated as a two-dimensional profile and toolpath
commands are written for the deposition of both model and support layers. These commands are
expressed in Automove® Control Language (ACL) for the FDM 2000 and 3000 systems
equipped with legacy Asymtek Automove® Series of X-Y tables and motor controllers
Product Model Function
reconfigurable real-time controller
National Instruments cRIO-9074
communicate with control software and individual modules
digital Output Module National Instruments 9472
provide voltage signals to pneumatic valves and switches
digital Input Module National Instruments 9411
detect logic levels from pneumatic switches and FDM pause indicator
solid-state relay outputs National Instruments 9485
emulate the pressing of front panel buttons on FDM system
Table 3.1. Select properties for commercial FDM materials

28
(Asymtek, Carlsbad, CA). The commands are supplied to the FDM Status software and then
buffered to the FDM machine controllers. Commands to the X-Y table enable the FDM extrusion
head to traverse over a build platform while commands to the extrusion head motors drive the
thermoplastic material into the liquefier.
Operating the MMMT FDM system in the Single FDM Operation mode only required
one FDM system and therefore the unchanged ACL commands were delivered to the FDM
system chosen by the user. To minimize the number of programs the user needed to access and
operate, a batch file with the script shown below was written to open the FDM Status software
and pass option arguments including the filename (%1) associated with the ACL commands, the
machine name (%2) that identified the FDM system, and a “no graphics” option argument (%3)
that ran the FDM Status software without graphics.
@echo off
C:
cd \InsightV35\nt
Fdmspd.exe %1 %2 %3
After the user specified a filename for the ACL code, the batch file was executed from
within LabVIEW through the use of a System Exec. virtual instrument (VI).
When in Multiple FDM operation mode, the ACL code created by Insight needed to be
modified such that tasks were delegated appropriately to each FDM system. This was
accomplished by manually modifying the ACL code before supplying it to each FDM system.
Noteworthy changes to the ACL code include (1) the insertion of PS (pause) commands that
interrupted the build process and allowed the build platen to be transported between each FDM
system, (2) the modification of MZ (relative movement in the Z direction) commands to ensure

29
that the extrusion head would not obstruct the transport of the workpiece and that each material
was deposited at the correct Z location. The MZ commands, in particular, were modified often
for the build process variation (variable layer thickness and road width) since each FDM
machine was depositing different layer thicknesses.
3.3.3 Placing the extrusion tips at the start location and initiating build sequences For conventional operations of a non-modified FDM 3000, the user is required to press
the pause button on the machine’s front panel after buffering the ACL code to the FDM machine.
The machine then proceeds to finding a global datum for the X, Y, and Z axes after which the
user is allowed to place the extrusion tip at the start location (local datum) by manually pressing
cursor buttons on the machine’s front panel. Once the tip is in place, the pause button must be
pressed again to commence the building sequences. Through FDMotion, these required actions
are performed via the graphic user interface that monitors and controls a series of digital inputs
and solid state relays. Additionally, the FDMotion software offers a snapshot (Figure C1) of the
status for each FDM system.
When operating in Multiple FDM Operation mode, both FDM systems were required to
start building at the same X/Y location relative to a benchmark on the build platform. The
selected benchmark for both systems was the bottom left corner of the build platform as shown
in Figure 3.1. The distance between the global datum and the benchmark was measured for each
FDM system. Initial measurements were performed with a ruler and fine adjustments were
carried out after measuring offset distances with a stereomicroscope. These X/Y distances were
used to develop a VI (Appendix C – Figures C26-27) that required the user to specify a start
location relative to the benchmark. Within this VI, the X/Y distances between the global datum
and the benchmark were subtracted or added accordingly to place the tooling head of both FDM

30
systems at the same local datum. In this manner the discrete materials are deposited and
properly aligned to generate dimensionally accurate parts.
FDM1 build platform
FDM2 build platform
benchmark global datum local datum
simulated path to benchmark and local datum
actual traveled path
Figure 3.1. Schematic of movements for each FDM system required to arrive to the same local datum.

31
Chapter 4
Experimental Methodology
4.1 Surface Roughness, mechanical properties and build time of build process variation
The build process variation refers to the deposition of coarse rasters (inner fill pattern)
using a T25 tip and fine contours using a T10 tip (Figure 4.1). The layer thicknesses were
intended to result in a contour-to-raster thickness ratio of 4:1. The test geometry shown in
Figure 4.2 has been used in similar work (Pandey, Reddy, and Dhande, 2003a) and was used
here to determine the surface roughness (arithmetic average of absolute values for the surface
profile, Ra) using a surface roughness tester (Mitutoyo Surftest SJ 201P, Mitutoyo, Aurora IL).
The Ra of each surface was measured five times at different locations within each of the four
inclined planes. For the build time study, a simple square prism (50.8mm by 50.8mm and
Figure 4.1. Cartoon of build process variation showing (1) the deposition of an initial coarse raster, (2) the deposition of fine contours, and (3) the deposition of a subsequent coarse raster.
FDM1 FDM2
1 2
3

32
25.4mm tall) was fabricated with both a non-modfied FDM 3000 machine (using T10 tips) and
the MMMT FDM system (using T10 tips for FDM1 and T25 for FDM2).
Tensile test specimens were fabricated using a non-modified FDM 3000 machine and the
MMMT FDM system to compare the effect of the build process vatiation on mechanical
properties. Tensile tests were conducted on an Instron 5866 system (Instron®, Norwood, MA)
following guidelines provided by the ASTM D638 standard. A 10kN load cell was used and a
deformation cross head speed of 5mm/min was employed. Each sample was comprised of five
Type I specimens each of which was conditioned in a standard laboratory atmosphere (23±2°C
and a relative humidity of 50±10%) for a minimum of 40 hours. From the collected data, the
mechanical properties of ultimate tensile stress (UTS), strain at UTS, and modulus of elasticity
were acquired.
4.2 Ultraviolet ozone surface treatment for interlayer bond improvements
4.2.1 Design of Experiments
4.2.1.1 Effects of UV ozone treatment on contact angle and surface energy of solid ABS P400
A design of experiments (DOE) consisting of a single factor with six levels was
employed to determine the effects of UV ozone treatment on contact angles of solid ABS P400.
45° 10°
15° 30°
Figure 4.2. Test geometry for measuring surface roughness containing four inclined planes.

33
The levels and responses for this DOE are shown in Table 4.1. Six ABS P400 substrates were
produced by melting FDM stock filament and each substrate was treated with UV ozone for 0,
0.5, 1.0, 1.5, 2.0, or 3.0 minutes. Guidelines provided by ASTM D7490 were followed while
using 7µL droplets of water and ethylene glycol as the working fluids. Two angle measurements
were made on each droplet (one on each drop edge) Average contact angles were determined by
making two angle measurements
Table 4.2 contains the total surface tension of each test liquid (𝛾𝐿) as well as the
respective dispersion (𝛾𝑆𝑑) and polar components (𝛾𝐿𝑝). The Owens-Wendt-Kaelble equation
shown below was used to calculate the total surface tension (𝛾𝑆 = 𝛾𝑆𝑑 + 𝛾𝑆𝑝) of solid ABS P400
for each treatment. Figure 4.3 presents a schematic of the test setup using an in-house-made
goniometer.
𝛾𝐿(1 + 𝑐𝑜𝑠𝜃)2
= ��𝛾𝐿𝑑𝛾𝑆𝑑�1/2
+ �𝛾𝐿𝑝𝛾𝑆
𝑝�1/2� Equation 6
Substrate Exposure Time (minutes) Response 1 Response 2 S1 0.0
water contact angle
ethylene glycol contact angle
S2 0.5 S3 1.0 S4 1.5 S5 2.0 S6 3.0
Table 4.1. Levels and responses for determining the effects of UV ozone treatment on contact angle and surface energy
Test Liquid Total surface energy, γL (mJ/m2)
Dispersion component, γL
d (mJ/m2) Polar component,
γLp (mJ/m2)
water 72.8 21.8 51.0 ethylene glycol 48.0 33.8 14.2
Table 4.2. Surface tension of water and ethylene glycol

34
4.2.1.2 Effects of UV ozone treatment on mechanical properties of FDM-manufactured specimens
A single factor design of experiments containing six levels was implemented to
determine the effects of UV ozone treatment on tensile mechanical properties of FDM-
manufactured specimens. Each layer (except for the last one) of the tensile test specimen was
exposed to UV ozone for 0, 0.5, 1.0, 1.5, 2.0, or 3.0 seconds by using a UV ozone cleaner (model
342 A, Jelight Company Inc., California). The UV ozone treated parts were mechanically tested
under a tensile load according to ASTM D638 and as such the test parts were in the shape of
standard tensile specimens (dog bones). Tensile testing of FDM-manufactured parts is typically
done by employing the Type I specimen dimensions, however, due to the size limitations (152.4
X 152.4 X 25.4 mm) of the UV ozone cleaner, the Type V specimen dimensions were used (see
Appendix D – Figure D2 for dimensions). Mechanical testing was performed with the
equipment and procedure discussed in Section 4.1.
The fabrication and testing of the FDM-manufactured specimens was random, which
required the fabrication of one test specimen per build sequence. Appendix E contains the order
of fabrication and testing. The UV ozone treatments were carried out in the following fashion.
Figure 4.3. Schematic (left) and actual (right) test setup used for measuring contact angles of test liquid on ABS P400 substrate.
camera
light source
variable pipettor
ABS P400 substrate 10µL water droplet
elevator stage
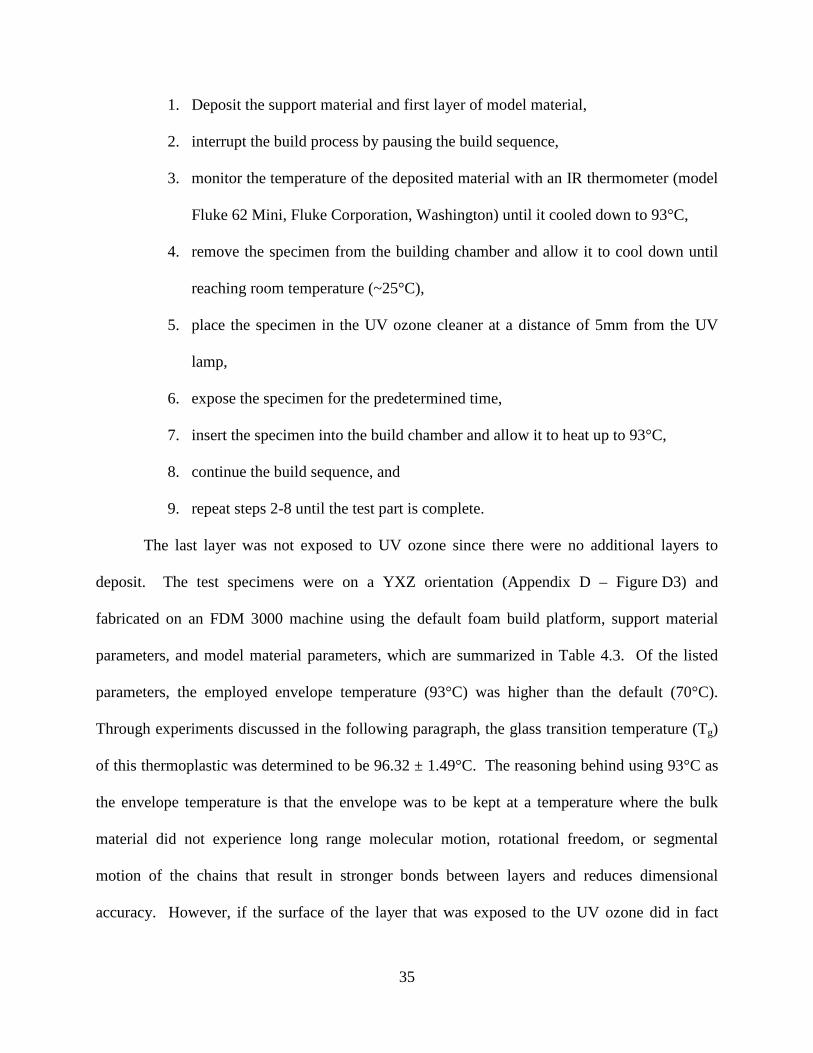
35
1. Deposit the support material and first layer of model material,
2. interrupt the build process by pausing the build sequence,
3. monitor the temperature of the deposited material with an IR thermometer (model
Fluke 62 Mini, Fluke Corporation, Washington) until it cooled down to 93°C,
4. remove the specimen from the building chamber and allow it to cool down until
reaching room temperature (~25°C),
5. place the specimen in the UV ozone cleaner at a distance of 5mm from the UV
lamp,
6. expose the specimen for the predetermined time,
7. insert the specimen into the build chamber and allow it to heat up to 93°C,
8. continue the build sequence, and
9. repeat steps 2-8 until the test part is complete.
The last layer was not exposed to UV ozone since there were no additional layers to
deposit. The test specimens were on a YXZ orientation (Appendix D – Figure D3) and
fabricated on an FDM 3000 machine using the default foam build platform, support material
parameters, and model material parameters, which are summarized in Table 4.3. Of the listed
parameters, the employed envelope temperature (93°C) was higher than the default (70°C).
Through experiments discussed in the following paragraph, the glass transition temperature (Tg)
of this thermoplastic was determined to be 96.32 ± 1.49°C. The reasoning behind using 93°C as
the envelope temperature is that the envelope was to be kept at a temperature where the bulk
material did not experience long range molecular motion, rotational freedom, or segmental
motion of the chains that result in stronger bonds between layers and reduces dimensional
accuracy. However, if the surface of the layer that was exposed to the UV ozone did in fact

36
undergo a localized reduction of Tg by more than ~3°C, then at 93°C bonds between layers
would be stronger and evident through mechanical testing results.
The Tg of the ABS P400 Blue thermoplastic was determined by following guidelines in
ASTM E1640 (Assignment of the glass transition temperature by dynamic mechanical analysis).
A dynamical mechanical analysis (DMA) instrument (model Q800, TA Instruments, Delaware)
was used with the following testing parameters: 0.01N preload, 15µm amplitude, 1 Hz
frequency, and 2°C/min ramp rate. The test specimen, shaped like a rectangular prism, was 35 X
10 X 4mm. Five specimens were fabricated in one build sequence using a flat layout and the
default building parameters shown in Table 4.3 were used, except the default envelope
temperature (70°C) was used. Each part was tested with the DMA instrument and the resulting
data was averaged to represent a sample mean.
Model material ABS P400 Blue extrusion tip T16 extrusion temperature 270°C part interior style solid-normal part raster width 0.508 mm (0.020”) contour width 0.508 mm (0.020”) Support material water soluble extrusion tip T16 extrusion temperature 235°C support style sparse self-supporting angle 45° base layers 5 Envelope envelope temperature 93°C
Table 4.3. Processing parameters used in UV ozone experiments

37
4.2.2 Statistical Analysis The data collected from the UV ozone treatment experiments was evaluated with an
analysis of variance (ANOVA) – a statistical method to test for equality of treatment effects. In
general, for a single factor or treatment there may be a different levels. Each factor will produce
a response in the form of a random variable. For each treatment there may be n observations that
can be represented by the linear statistical model
𝑌𝑖𝑗 = 𝜇 + 𝜏𝑖 + 𝜖𝑖𝑗 �𝑖 = 1, 2, … ,𝑎𝑗 = 1, 2, … ,𝑛
�
Equation 7
where 𝑌𝑖𝑗 is the (ij)th observation (random variable), µ is the overall mean common to all
treatments, 𝜏𝑖 is the ith treatment effect, and the random error effect is denoted by 𝜖𝑖𝑗. Another
form of the linear statistical model can be represented as
𝑌𝑖𝑗 = 𝜇𝑖 + 𝜖𝑖𝑗 �𝑖 = 1, 2, … ,𝑎𝑗 = 1, 2, … ,𝑛
� Equation 8
where 𝜇𝑖 = 𝜇 + 𝜏𝑖 represents the mean of the ith treatment. In this model, the assumption that
𝜖𝑖𝑗 is normally and independently distributed with mean zero and variance σ2 allows the
evaluation of each treatment as a normal distribution with mean µi and variance σ2.
In a fixed-effects model, the factor levels are chosen by the experimenter and hypotheses
about the treatment means are tested. Usually, the treatment effects 𝜏𝑖 are described as
deviations from the overall mean µ resulting in the following:
�𝜏𝑖
𝑎
𝑖=1
= 0 Equation 9
For each treatment, the total and average of the observations under the ith treatment are shown,
respectively, as follows.

38
𝑦𝑖 . = �𝑦𝑖𝑗
𝑛
𝑗=1
𝑖 = 1, 2, … ,𝑎 Equation 10
𝑦�𝑖 . = 𝑦𝑖 ./𝑛 𝑖 = 1, 2, … ,𝑎 Equation 11
In the above equations, the period indicates the summation over the replaced subscript.
Similarly, the grand total and mean of all the observations can be expressed mathematically as
𝑦. . = �𝑎
𝑖=1
�𝑦𝑖𝑗
𝑛
𝑗=1
Equation 12
𝑦�. . = 𝑦. ./𝑁 Equation 13
where N is the total number of observations (an).
The equality of the a treatment means (𝜇1, 𝜇2, … , 𝜇𝑎) can be tested by using Equation 9
and noting the equivalence to the following hypothesis testing
𝐻0: 𝜏1 = 𝜏2 = ⋯ = 𝜏𝑎 = 0
𝐻1: 𝜏𝑖 ≠ 0 for at least one i Equation 14
This test indicates that if the null hypothesis (𝐻0) is true, a normal distribution with mean µ and
variance σ2 describes all N observations. In other words, if the null hypothesis is true, changing
the level of the factor has no effect on the mean response.
The ANOVA describes the total variability in the data with the total sum of squares
(𝑆𝑆𝑇).
𝑆𝑆𝑇 = �𝑎
𝑖=1
��𝑦𝑖𝑗 − 𝑦�. .�2
𝑛
𝑗=1
Equation 15

39
The total variability in the sample data is partitioned into two components – sum of squares of
differences between treatment means and the grand mean (𝑆𝑆𝑇𝑟𝑒𝑎𝑡𝑚𝑒𝑛𝑡𝑠) and sum of squares of
differences of observations within a treatment from the treatment mean (𝑆𝑆𝐸). Mathematically,
this partition (also known as the sum of squares identity) is shown in the following equation.
𝑆𝑆𝑇 = 𝑆𝑆𝑇𝑟𝑒𝑎𝑡𝑚𝑒𝑛𝑡𝑠 + 𝑆𝑆𝐸
or
�𝑎
𝑖=1
��𝑦𝑖𝑗 − 𝑦�. .�2
𝑛
𝑗=1
= 𝑛�(𝑦�𝑖 . − 𝑦�. .)2𝑎
𝑖=1
+ �𝑎
𝑖=1
��𝑦𝑖𝑗 − 𝑦�𝑖 .�2
𝑛
𝑗=1
Equation 16
In the 𝑆𝑆𝑇 partition, 𝑆𝑆𝑇𝑟𝑒𝑎𝑡𝑚𝑒𝑛𝑡𝑠 is a measure of the differences between treatments and 𝑆𝑆𝐸 is
produced by way of random error.
In addition to the partition of the total variability, the number of degrees of freedom is
also partitioned. 𝑆𝑆𝑇 has a total of an-1 degrees of freedom while 𝑆𝑆𝑇𝑟𝑒𝑎𝑡𝑚𝑒𝑛𝑡𝑠 has a-1 degrees
of freedom and 𝑆𝑆𝐸 has a(n-1) degrees of freedom. The ratio of the sum of square to the
associated degrees of freedom is called the mean square.
𝑀𝑆𝑇𝑟𝑒𝑎𝑡𝑚𝑒𝑛𝑡𝑠 =𝑆𝑆𝑇𝑟𝑒𝑎𝑡𝑚𝑒𝑛𝑡𝑠
(𝑎 − 1) mean square of treatments Equation 17
𝑀𝑆𝐸 =𝑆𝑆𝐸
𝑎(𝑛 − 1) error means square Equation 18
Both 𝑀𝑆𝑇𝑟𝑒𝑎𝑡𝑚𝑒𝑛𝑡𝑠 and 𝑀𝑆𝐸 are independent and establish the test statistic F0 for the F-test.
𝐹0 =𝑆𝑆𝑇𝑟𝑒𝑎𝑡𝑚𝑒𝑛𝑡𝑠/(a − 1)𝑆𝑆𝐸/[a(n − 1)] =
𝑀𝑆𝑇𝑟𝑒𝑎𝑡𝑚𝑒𝑛𝑡𝑠𝑀𝑆𝐸
Equation 19

40
The results from an ANOVA are typically tabulated in a fashion similar to that of Table 4.4. For
an F-test, the rejection criteria is within an upper-tail, one-tail critical region and therefore, 𝐻0 is
rejected if 𝑓0 > 𝑓𝛼,𝑎−1,𝑎(𝑛−1), where 𝑓0is the calculated value of F0 and α is the significance
level. Since the UV ozone treatment experiments involved only one factor (UV ozone treatment)
at multiple levels (exposure times), the above method for an ANOVA was employed.
4.3 Mechanical properties of PC – ABS heat-treated specimens
4.3.1 Fabrication of tensile specimens Tensile test specimens were fabricated with dimensions of ASTM D638 Type I
specimens (Appendix D – Figure D1). Four sample groups each made of PC, ABS, and discrete
PC – ABS materials were fabricated. Except for the extrusion temperature of the model
materials, the fabricating parameters (contour and raster widths, raster angles, air gaps, part
orientation, and envelope temperature) were the same for all specimens. Figure 4.4A shows an
image of a PC – ABS specimen being built, and the cross-section of the narrow section of the
test specimens are shown in Figure 4.4B to illustrate the shell-and-core configuration of the
multi-material specimens. For the fabrication of the PC – ABS specimens, FDM1 deposited the
support material (layers 1 - 5) followed by two layers of PC (layers 6 - 7). Next, two PC
Source of variation
Sum of squares
Degrees of freedom Mean square F0
Treatments 𝑆𝑆𝑇𝑟𝑒𝑎𝑡𝑚𝑒𝑛𝑡𝑠 𝑎 − 1 𝑀𝑆𝑇𝑟𝑒𝑎𝑡𝑚𝑒𝑛𝑡𝑠 𝑀𝑆𝑇𝑟𝑒𝑎𝑡𝑚𝑒𝑛𝑡𝑠
𝑀𝑆𝐸
Error 𝑆𝑆𝐸 𝑎(𝑛 − 1) 𝑀𝑆𝐸
Total 𝑆𝑆𝑇 𝑎𝑛 − 1
Table 4.4. The analysis of variance for the fixed-effects model and a single-factor experiment

41
contours were deposited by FDM1 on layer 8 after which the build platform was moved to the
FDM2 location for the deposition of ABS rasters in layer 8. Layers 9 - 15 also consisted of PC
contours and ABS rasters while layers 16 and 17 were made of PC. These layers were stacked
along the z direction indicated in Figure 4.4B.
To directly compare the effect of heat treating PC – ABS specimens, one group was heat-
treated while another was left untreated. Specimens were measured for dimensions with a digital
caliper before and after the heat treatment. The heat treatment consisted of placing the discrete
PC – ABS specimens in an oven at room temperature and then heating to 160°C. The specimens
were left at this temperature for 2 hours after which the oven was turned off and samples were
removed once they reached room temperature. Referring to Table 2.1 and noting the glass
transition temperature of PC (161°C) and ABS (104°C), the heat treatment was performed at
160°C to enable the flow of ABS and yield a dense core while prohibiting the PC shell from
severe deformation.
PC shell, Area = 20.56 mm2
ABS core, Area = 24.01 mm2 A B
z
Figure 4.4. Fabrication of multi-material specimens. A) PC – ABS specimen built using multi-material, multi-technology FDM system. Note that the fabrication process used three discrete materials - PC, ABS, and a water-soluble support material. B) diagram of cross-section for the narrow section of the PC – ABS test specimens.

42
4.3.2 Mechanical testing Tensile tests were conducted following guidelines provided by the ASTM D638 standard.
Section 4.1 describes the employed equipment and procedure.
4.3.3 Statistical Analysis Student’s t-tests were performed on the data collected for the heat-treated and untreated
specimens to determine if the mean of the ultimate tensile strength, modulus of elasticity, and
strain at ultimate strength were equal. The significance level used was α = 0.05.

43
Chapter 5
Results and Discussion
5.1 Demonstration: FDM using multi-colors and a build process variation
The MMMT FDM system provided access to four extrusion tips that allowed fabrication
using multi-colors and build process variations (variable layer thickness and road width). To
demonstrate these capability, several parts were produced in which ABS P400 thermoplastic was
deposited in either the blue or red variation in the form of relatively high resolution contours (ie.,
thin layers and narrow roads) and low resolution fill patterns or rasters. As will be discussed
later, the fine contours were intended to improve surface roughness when compared to the
default contours, which contain a layer thickness of 0.254mm for T10 tips. Figure 5.1 contains
images of several demonstration pieces in which all parts (1-4) were fabricated using multi-
colored thermoplastics and parts highlighted with labels 1-2 were fabricated with the build
Figure 5.1. Demonstration pieces produced with the multi-color fabrication and build process variation.
1
2
3
4
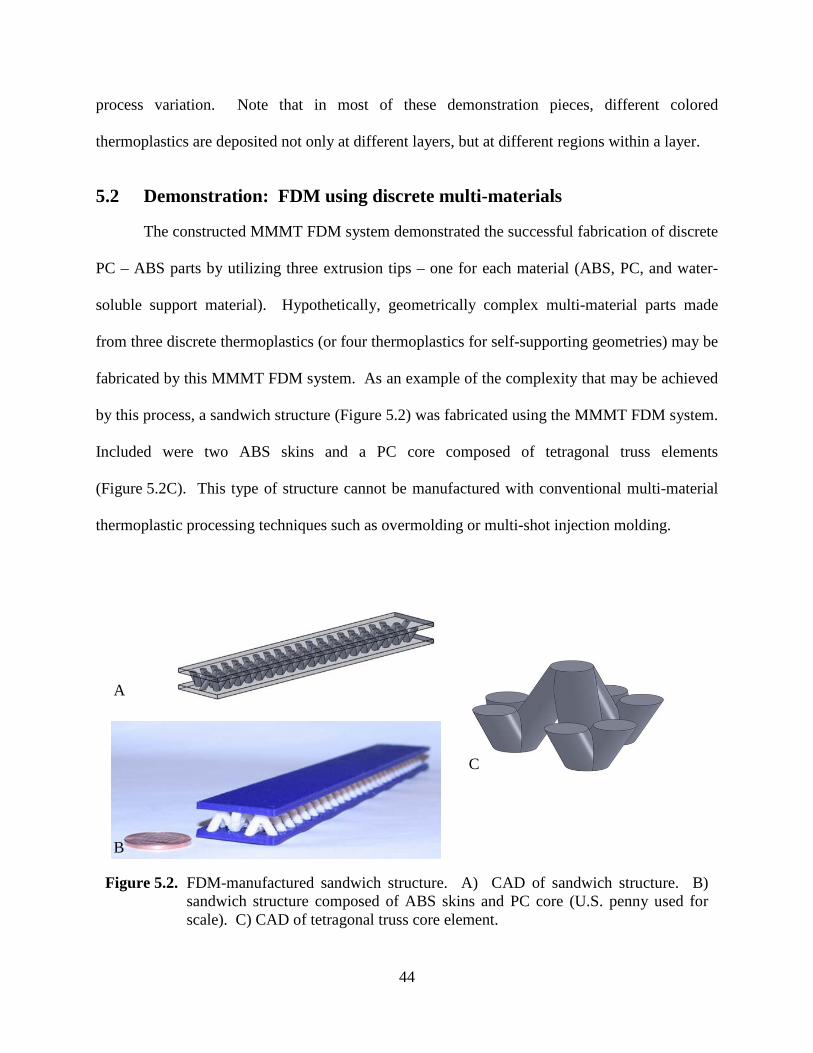
44
process variation. Note that in most of these demonstration pieces, different colored
thermoplastics are deposited not only at different layers, but at different regions within a layer.
5.2 Demonstration: FDM using discrete multi-materials
The constructed MMMT FDM system demonstrated the successful fabrication of discrete
PC – ABS parts by utilizing three extrusion tips – one for each material (ABS, PC, and water-
soluble support material). Hypothetically, geometrically complex multi-material parts made
from three discrete thermoplastics (or four thermoplastics for self-supporting geometries) may be
fabricated by this MMMT FDM system. As an example of the complexity that may be achieved
by this process, a sandwich structure (Figure 5.2) was fabricated using the MMMT FDM system.
Included were two ABS skins and a PC core composed of tetragonal truss elements
(Figure 5.2C). This type of structure cannot be manufactured with conventional multi-material
thermoplastic processing techniques such as overmolding or multi-shot injection molding.
A
B
C
Figure 5.2. FDM-manufactured sandwich structure. A) CAD of sandwich structure. B) sandwich structure composed of ABS skins and PC core (U.S. penny used for scale). C) CAD of tetragonal truss core element.

45
5.3 Properties of parts produced using the build process variation
Optical images shown in Figure 5.3 were captured with a stereomicroscope (model: MZ
16, Leica Microsystems Inc., Buffalo Gove, Illinois) equiped with a digital CCD camera (model:
Retiga-2000R, QImaging, Surrey, British Columbia). For the fill pattern roads (rasters),
measurements (µ ± σ) showed a 1200 ± 39µm road width and 497 ± 11µm layer thickness.
Contour measurements displayed a 269 ± 18µm road width and 133 ± 3µm layer thickness. The
mechanical properties of the parts produced with the non-modified FDM 3000 (standard build
process) and the MMMT FDM system are shown in Table 5.1. There was no statistical evidence
that the mechanical properties (ultimate tensile stress and associated strain as well as the
modulus of elasticity) of the specimens produced with the standard and build process variation
were different (p-values > 0.05 for student’s t test, µ1-µ2 = 0, n = 5). That is, the build process
variation did not significantly reduce or alter the mechanical properties of the produced parts
when compared to the standard build process.
500 µm 500 µm
fill pattern
contour
Figure 5.3. Optical image of cross-sectioned part produced with the build process variation.

46
Surface roughness measurements in the form of Ra values are reported in Figure 5.4. The
Ra values decreased on all four planes. In particular, there was a 55% reduction in surface
roughness on the plane that was inclined 10° from vertical. Reducing the layer thickness to
achieve high resolution contours was anticipated to increase the total build time, and as such
compensatory rasters for the internal fill pattern were built using a larger layer thickness and
wider road width. In fact, using this build variation reduced the build time by approximately
35%. The time required to build a simple square prism (50.8mm X 50.8mm and 25.4mm tall)
using the standard process and the build process variation was 6.2 hr and 4.0 hr, respectively. It
Ultimate Tensile Stress, UTS (MPa)
Strain at UTS (%)
Modulus of Elasticity (MPa)
Standard Build Process 18.61 1.63 540.03 Build Process Variation 18.23 1.51 517.9
Table 5.1. Tensile properties of specimens built using the standard process and the build process variation.
0
5
10
15
20
25
30
35
10 15 30 45
Surf
ace
Roug
hnes
s, R
a(µ
m)
Inclination of Plane from Vertical (degrees)
FDM 3000
MMMT FDM system
Figure 5.4. Average surface roughness of specimens built using the standard process and build process variation (each bar is the average of five measurements and the standard deviation was used for error bars).
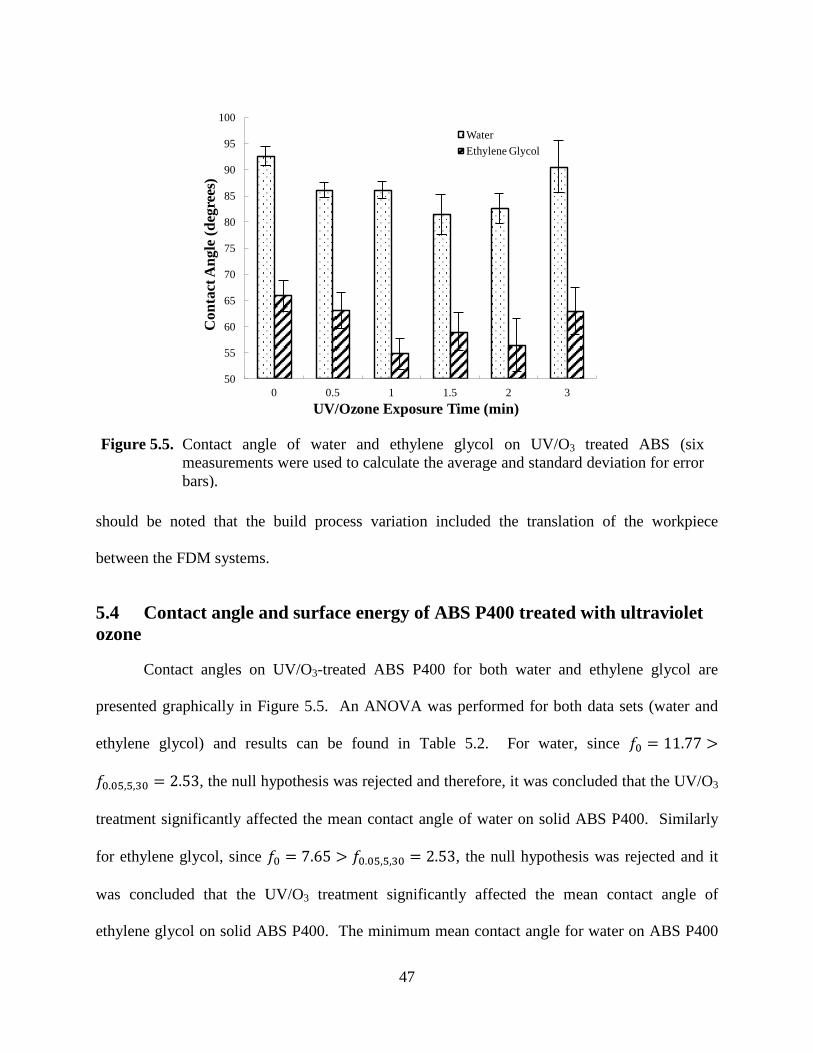
47
should be noted that the build process variation included the translation of the workpiece
between the FDM systems.
5.4 Contact angle and surface energy of ABS P400 treated with ultraviolet ozone
Contact angles on UV/O3-treated ABS P400 for both water and ethylene glycol are
presented graphically in Figure 5.5. An ANOVA was performed for both data sets (water and
ethylene glycol) and results can be found in Table 5.2. For water, since 𝑓0 = 11.77 >
𝑓0.05,5,30 = 2.53, the null hypothesis was rejected and therefore, it was concluded that the UV/O3
treatment significantly affected the mean contact angle of water on solid ABS P400. Similarly
for ethylene glycol, since 𝑓0 = 7.65 > 𝑓0.05,5,30 = 2.53, the null hypothesis was rejected and it
was concluded that the UV/O3 treatment significantly affected the mean contact angle of
ethylene glycol on solid ABS P400. The minimum mean contact angle for water on ABS P400
50
55
60
65
70
75
80
85
90
95
100
0 0.5 1 1.5 2 3
Con
tact
Ang
le (d
egre
es)
UV/Ozone Exposure Time (min)
WaterEthylene Glycol
Figure 5.5. Contact angle of water and ethylene glycol on UV/O3 treated ABS (six measurements were used to calculate the average and standard deviation for error bars).

48
was 81.38° and was achieved with a UV/O3 exposure time of 1.5 minutes. This constituted an
approximate 12% reduction in mean contact angle when compared to untreated ABS P400,
which displayed a mean contact angle of 92.54°. Similarly, the mean contact angle between
ethylene glycol and solid ABS P400 experienced an approximate 17% reduction when the ABS
P400 was treated with UV/O3 for 1 minute and compared with an untreated specimen.
The mean contact angle for each test liquid and UV-O3 treatment were used in
conjunction with the Owen-Wendt-Kaelble relationship (Equation 6) to determine the dispersion
and polar components of the ABS P400 surface tension. Results can be found in Figure 5.6. The
polar component displayed a general increasing trend between an exposure time of 0-1.5 minutes
indicating that functional groups were being formed at the polymer surface. The decreasing
trend in surface energy after the 1 minute UV-O3 exposure is most likely due to the production of
low molecular weight, broken-down fragments that in essence began to contaminate the polymer
surface. Also, the total surface tension of an untreated ABS P400 was 21.4mJ/m2 and a surface
Test liquid: Water Source of variation SS df MS f0
UV ozone exposure time 565.58 5 113.12 11.77
Error 288.20 30 9.61
Total 853.77 35
Test liquid: Ethylene glycol
UV ozone exposure time 554.38 5 110.88 7.65
Error 434.96 30 14.50
Total 989.34 35
Table 5.2. Single factor ANOVA results for contact angles on solid ABS P400 at six treatment levels (α = 0.05)
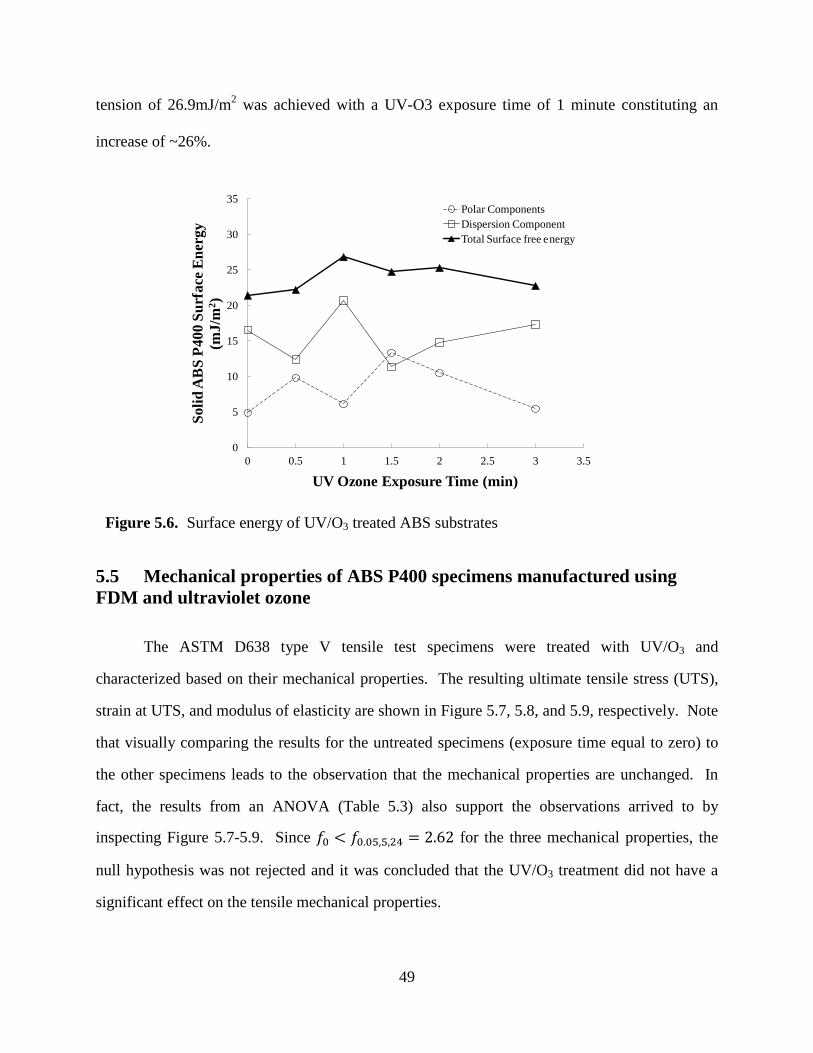
49
tension of 26.9mJ/m2 was achieved with a UV-O3 exposure time of 1 minute constituting an
increase of ~26%.
5.5 Mechanical properties of ABS P400 specimens manufactured using FDM and ultraviolet ozone
The ASTM D638 type V tensile test specimens were treated with UV/O3 and
characterized based on their mechanical properties. The resulting ultimate tensile stress (UTS),
strain at UTS, and modulus of elasticity are shown in Figure 5.7, 5.8, and 5.9, respectively. Note
that visually comparing the results for the untreated specimens (exposure time equal to zero) to
the other specimens leads to the observation that the mechanical properties are unchanged. In
fact, the results from an ANOVA (Table 5.3) also support the observations arrived to by
inspecting Figure 5.7-5.9. Since 𝑓0 < 𝑓0.05,5,24 = 2.62 for the three mechanical properties, the
null hypothesis was not rejected and it was concluded that the UV/O3 treatment did not have a
significant effect on the tensile mechanical properties.
0
5
10
15
20
25
30
35
0 0.5 1 1.5 2 2.5 3 3.5
Solid
AB
S P4
00 S
urfa
ce E
nerg
y (m
J/m
2 )
UV Ozone Exposure Time (min)
Polar ComponentsDispersion ComponentTotal Surface free energy
Figure 5.6. Surface energy of UV/O3 treated ABS substrates

50
0
5
10
15
20
25
30
0 0.5 1 1.5 2 3
Ulti
mat
e Ten
sile
Stre
ss (M
Pa)
UV Ozone Exposure Time (min)
Figure 5.8. Ultimate tensile stress of FDM-manufactured P400 ABS specimens treated with UV/O3 at each layer.
0
0.2
0.4
0.6
0.8
1
1.2
1.4
1.6
1.8
2
0 0.5 1 1.5 2 3
Stra
in a
t Ulti
mat
e Str
ess (
%)
UV Ozone Exposure Time (minutes)
Figure 5.7. Strain at ultimate tensile stress of FDM-manufactured P400 ABS specimens treated with UV/O3 at each layer.

51
5.6 Mechanical properties of heat-treated multi-material specimens
Results for ultimate tensile strength, strain at ultimate strength, and modulus of elasticity
are presented in Figure 5.10. Note that the experimental ultimate tensile strength and modulus of
elasticity for ABS and PC groups are lower than those reported by the manufacturer (Table 2.1).
For ABS, the experimentally determined UTS is 20% lower than the tensile strength reported by
the manufacturer and the modulus is 67% lower than the manufacturer value. Likewise for PC,
the UTS is 34% lower than the tensile strength reported by the manufacturer and the modulus is
74% lower than the manufacturer value. The difference is due in part to the part orientation
during fabrication. That is, using the orientation notation in ASTM F2921 (2011) the
manufacturer constructed test specimens using either the XZY or YZX orientations while for this
study the test specimens were built using the YXZ orientation. Additionally, the raster angles
may have been different – this study used a starting angle of 0° and delta angle of 90°.
0.00
0.50
1.00
1.50
2.00
2.50
0 0.5 1 1.5 2 3
Mod
ulus
of E
last
icity
(GPa
)
UV Ozone Exposure Time (min)
Figure 5.9. Modulus of elasticity of FDM-manufactured P400 ABS specimens treated with UV/O3 at each layer.

52
The student’s t-test revealed that the means for the ultimate tensile strength of heat-
treated and untreated specimens were significantly different (p = 0.004 < 0.05). In fact, the heat
treatment resulted in ~25% increase of ultimate tensile strength. Likewise, the means for the
modulus of elasticity of heat-treated and untreated specimens were significantly different (p =
0.006 < 0.05) – an ~18% increase due to the heat treatment was observed. There was no
statistical evidence that the means of the strain for the heat-treated and untreated specimens were
different, however, the standard deviation does seem to decrease with the heat treatment.
Optical microscopy images of the fracture surfaces are also shown in Figure 5.10. Note
that in the untreated specimen (left image in Figure 5.10D) the roads are still distinguishable.
Spaces between roads and layers are also present that result in stress concentrators known to
Ultimate Tensile Strength Source of variation SS df MS f0
UV ozone exposure time 3.51 5 0.70 0.27
Error 61.76 24 2.57
Total 65.27 29
Strain at Ultimate Stress
UV ozone exposure time 0.096 5 0.019 2.02
Error 0.22 24 0.0095
Total 0.32 29
Strain at Ultimate Stress
UV ozone exposure time 0.12 5 0.025 0.67
Error 0.89 24 0.037
Total 1.01 29
Table 5.3. Single factor ANOVA results for tensile testing on solid ABS P400 at six treatment levels (α = 0.05)

53
reduce the tensile strength of FDM-manufactured parts (Bellini and Guceri 2003; Rodriguez,
Thomas, and Renaud 2003). On the other hand, the heat-treated specimens (right image of
Figure 5.10D) show a fully dense ABS region. This densification resulted in the ~25% increase
in ultimate tensile strength.
PC – ABS untreated
PC – ABS heat-treated
0100200300400500600700
AB
S
PC
PC-A
BS
PC-A
BS
heat
-trea
ted
Mod
ulus
of E
last
icity
(MPa
)
0
1
2
3
4
AB
S
PC
PC-A
BS
PC-A
BS
heat
-trea
tedStra
in a
t Ulti
mat
e Str
engt
h (%
)
0
10
20
30
40
50
AB
S
PC
PC-A
BS
PC-A
BS
heat
-trea
ted
Ulti
mat
e ten
sile
stre
ngth
(M
Pa)
A B
C D
Figure 5.10. Results from ASTM D638 tensile testing (error bars represent ± σ calculated from five specimens). A) mean ultimate tensile strength. B) mean strain at ultimate strength. C) mean modulus of elasticity. D) optical microscopy images of fracture surfaces for untreated and heat-treated PC – ABS specimens.

54
5.7 Dimensional Accuracy of heat-treated multi-material specimens
The dimensional change for the specimen’s features (thickness, width, and length) caused
by the heat treatment is shown in Figure 5.11. Note that a negative dimensional change indicates
a reduction in dimension for the comparison. In general, the difference between heat-treated and
untreated dimensions for all features decreased due to the heat treatment in which the largest
change was in length (-1.4mm) – the width change was -0.5mm and thickness change was -
0.3mm. In terms of percentages, the dimensions of the width, thickness, and length decreased by
3.4%, 7.3%, and 0.8%, respectively.
-3
-2.5
-2
-1.5
-1
-0.5
0
0.5
1
1.5
width thickness length
Dim
ensio
nal C
hang
e (m
m)
Feature
Difference between untreated part andCAD dimensions
Difference between heat-treated partand CAD dimensions
Difference between heat-treated anduntreated dimensions
length
thicknesswidth
Figure 5.11. Mean dimensional changes caused by heat treating PC – ABS specimens (error bars represent ± σ calculated from five specimens).

55
Chapter 6
Conclusion and Recommendations
6.1 Conclusions
A multi-material, multi-technology FDM system was designed and constructed. The
developed FDMotion software allowed the control of hardware through a series of GUI’s.
FDMotion also allowed the use of two modes (Single FDM operation and Multiple FDM
operation mode) with easy to follow in-process instructions. The MMMT FDM system gave
access to four extrusion tips that allowed the fabrication of novel thermoplastic parts including
multi-colored parts made from similar and dissimilar materials as well as a novel process for
fabricating complex geometries using FDM and subsequently performing a heat treatment that
improved mechanical properties and density.
Multi-material fabrication was used to produce multi-colored parts and demonstrate the
deposition of discrete materials at any layer and within different regions of a layer. Several
geometries were constructed that used blue and red ABS P400 thermoplastic to easily identify
the different regions. This use of multi-colored thermoplastics can be used to fabricate
aesthetically pleasing and highly attractive 3D parts that may contain a company’s logo, provide
another level for mass customization, and easily identify mating surfaces for complex
assemblies. Dissimilar thermoplastics were also used in a single build sequence to construct a
sandwich structure composed of ABS skins and a complex PC core constructed from tetragonal
truss elements. The geometric complexity of this structure is such that it is impossible to
fabricate using injection molding. These types of structures may be employed by the
transportation and aerospace industries since sandwich structures can exhibit high strength to
weight ratios and result in less overall fuel consumption.
A build process variation using variable layer thicknesses and road widths was used to
reduce the surface roughness of planes that were inclined 10, 15, 30, and 45° from vertical by 55,
43, 44, and 38%, respectively. The mechanical properties of parts produced with the build

56
process variation were not compromised and the build time was reduced by 35% for the
fabrication of a simple rectangular prism (50.8mm by 50.8mm and 25.4mm tall). However, it is
noted that the reduction in build time is highly dependent on the geometry and as such time
savings are expected to vary. The maximum reduction in build times, therefore, will be achieved
when the volume ration of internal fill to contour is highest. The FDM build process variation
improved both surface roughness and build time – two FDM aspects commonly viewed in need
of improvement.
The developed MMMT FDM system also allowed the ultraviolet ozone treatment at
every layer to determine its effect on mechanical properties. Although it was determined that the
surface energy increased by 26% when ABS was exposed for 1 minute, this increase did not
translate to an increase in mechanical properties. However, this method of increasing surface
energy and wettability may be useful for adhesive bonding processes that require clean and
chemically active surfaces. Also, since the MMMT FDM system allows the FDM process to be
easily interrupted and supplemented by other technologies (like UV/O3 in this case),
experimentation with other interlayer improvement strategies can be easily implemented.
A novel heat treatment method was developed using parts fabricated with the MMMT
FDM system. The parts were made of discrete PC – ABS materials and a shell-and-core
configuration. Fabricating the shell using a material with higher glass transition temperature
(PC) than the core material (ABS) allowed the heat treatment of the core without drastically
changing the overall dimensions of the part. The heat treatment, although not optimized,
demonstrated a substantial increase in ultimate tensile strength (~25%). Optical images also
showed that the density of the core increased. This multi-material and heat treatment method in
combination is very promising in that the tensile and potentially fatigue properties of FDM-
manufactured parts may be improved. The densification of FDM-fabricated parts can also
expand FDM into applications of high pressures – an area that has not been explored in detail
due to porous parts.

57
6.2 Recommendations for Future Work
Future work should include the use of the developed MMMT FDM system to explore
other mechanical and chemical interlayer bonding improvement strategies. Also, the build
process variation demonstrated in this work should be applied to the deposition of support
material to determine the additional time savings. In regard to the heat treatment of multi-
material parts, a design of experiments can be developed to determine the effect of temperature
and time on mechanical properties and density. This study may reveal improvements in ultimate
tensile strength greater than the 26% improvement shown in this work. Additionally, parts
fabricated with this heat treatment method should be tested for their pressure withstanding
capabilities to identify other application of FDM-fabricated parts. The integration of
complementary technologies such as CNC or laser micro-machining and direct-write into the
MMMT FDM system should also be pursued in the future. These technologies would aid in
achieving microscale features and heterogeneous structures.

58
References
Ahn, S., Montero, M., Odell, D., Roundy, S., Wright, P., 2002. Anisotropic material properties
of fused deposition modeling ABS. Rapid Prototyping Journal 8 (4) pp. 248-257.
Allahverdi, M., Danforth, S.C., Jafari, M., Safari, A. 2001. Processing of advanced
electroceramic components by fused deposition technique. Rapid Prototyping Journal 21
(10-11), 1485-1490.
Arcaute, K., Mann, B.K., Wicker, R.B. 2006. Stereolithography of three-dimensional bioactive
poly(ethylene glycol) constructs with encapsulated cells. Annals of Biomedical
Engineering 34 (9), 1429-1441.
ASTM Standard D638-10. 2010. “Standard Test Method for Tensile Properties of Plastics”.
ASTM International, West Conshohocken, PA.
ASTM Standard D7490-08. 2008. “Standard Test Method for Measurement of the Surface
Tension of Solid Coatings, Substrates and Pigments using Contact Angle Measurements”.
ASTM International, West Conshohocken, PA.
ASTM Standard E1640-09. 2009. “Standard Test Method for Assignment of the Glass
Transition Temperature By Dynamic Mechanical Analysis”. ASTM International, West
Conshohocken, PA.
ASTM Standard F2792-12a. 2012. “Standard Terminology for Additive Manufacturing
Technologies”. ASTM International, West Conshohocken, PA.

59
ASTM Standard F2921-11. 2011. “Standard Terminology for Additive Manufacturing –
Coordinate Systems and Test Methodologies”. ASTM International, West
Conshohocken, PA.
Bellini, A., Guceri, S. 2003. Mechanical characterization of parts fabricated using fused
deposition modeling. Rapid Prototyping Journal 9 (4), 252-264.
Bellini, A., Shor, L., Guceri, S. 2005. New developments in fused deposition modeling of
ceramics. Rapid Prototyping Journal 11 (4), 214-220.
Blanskby, S.J., Ellison, G.B. 2003. Bond dissociation energies of organic molecules. Accounts
of Chemical Research 36 (4), 255-263.
Bourell, D.L., Beaman, J.J., Leu, M.C., Rosen, D.W. 2009. A brief history of Additive
Manufacturing and the 2009 Roadmap for Additive Manufacturing: Looking back and
looking ahead. Proceedings from the RapidTech 2009 US-Turkey Workshop on Rapid
Technologies.
Campilho, R.D.S.G., Pinto, A.M.G., Banea, M.D., da Silva, L.F.M. 2012. Optimization study of
hybrid spot-welded/bonded single-lap joints. International Journal of Adhesion &
Adhesives 37, 86-95.
Choi, J., Medina, F., Kim, C., Espalin, D., Rodriguez, D., Stucker, B., Wicker, R., 2011.
Development of a mobile fused deposition modeling system with enhanced
manufacturing flexibility. Journal Of Materials Processing Technology 211 (3) pp. 424-
432.

60
The Economist. “A Third Industrial Revolution.” The Economist 21 April 2012. Print.
Espalin, D., Arcaute, K., Rodriguez, D., Medina, F., Posner, M., Wicker, R., 2010. Fused
deposition modeling of patient-specific polymethylmethacrylate implants. Rapid
Prototyping Journal 16 (3) pp. 164-173.
Es-said, O.S., Foyos, J., Noorani, R., Mendelson, M., Marloth, R. 2000. Effect of layer
orientation on mechanical properties of rapid prototyped samples. Materials and
Manufacturing Processes 15 (1) pp. 107-122.
Frerichs, H., Stricker, J., Wesner, D.A., Kreutz, E.W. 1995. Laser-induced surface modification
and metallization of polymers. Applied Surface Science 86 (1-4) pp. 405-410.
Gibson, I., Rosen, D.W., Stucker, B. 2010. Additive manufacturing technologies: Rapid
prototyping to direct digital manufacturing. New York: Springer.
Haisma, J., Spierings, G.A.C.M. 2002. Contact bonding, including direct-bonding in a historical
and recent context of material science and technology, physics, and chemistry: Historical
review in a broader scope and comparative outlook. Materials Science and Engineering
Vol. 37 (1-2), 1-60.
Iyer, S., McIntosh, J., Bandyopadhyay, A., Langrana, N., Safari, A., Danforth, S.C., Clancy,
R.B., Gasdaska, C., Whalen, P.J., 2008. Microstructural characterization and mechanical
properties of Si3N4 formed by fused deposition of ceramics. International Journal of
Applied Ceramic Technology 5 (2) pp. 127-137.

61
Kulkarni, P., Dutta, D. 1996. An accurate slicing procedure for layered manufacturing.
Computer-Aided Design 28 (9), 683-697.
Lee, B.H., Abdullah, J., Khan, Z.A. 2005. Optimization of rapid prototyping parameters for
production of flexible ABS object. Journal of Materials Processing Technology 169 (1)
pp. 54-61.
Malone, E., Lipson, H. 2008. Multi-material freeform fabrication of active systems.
Proceedings of the 9th Biennial ASME Conference on Engineering Systems Design and
Analysis, July 7-9, Haifa, Israel.
Mangus, C., 2012. Feasibility study of metal to polymer hybrid joining. Master’s thesis,
Lappeenranta University of Technology.
Mathieson, I., Bradley, R.H. 1996. Improved adhesion to polymers by UV/ozone surface
oxidation. International Journal of Adhesion and Adhesives 16 (1), 29-31.
Mireles, J., Kim, H., Lee, I.H., Espalin, D., Medina, F., MacDonald, E., Wicker, R. (in press).
Development of a Fused Deposition Modeling system for low melting temperature metal
alloys. Journal of Electronic Packaging.
Pandey, P.M., Reddy, N.V., Dhande, S.G. 2003a. Improvement of surface finish by staircase
machining in fused deposition modeling. Journal of Materials Processing Technology
132 (1-3), 323-331.

62
Pandey, P.M., Reddy, N.V., Dhande, S.G. 2003b. Real time adaptive slicing for fused
deposition modelling. International Journal of Machine Tools & Manufacturing 43 (1),
61-71.
Parker, M. E., Arbegast, W., Boysen, A., West, M. 2009. Eliminating voids in FDM processed
polyphenylsulfone, polycarbonate, and ULTEM 9085 by hot isostatic pressing. South
Dakota Schools of Mines & Technology, Research Experience for Undergraduate.
Partain, S.C. 2007. Fused deposition modeling with localized pre-deposition heating using
forced air. Master’s thesis, Montana State University.
Rodriguez, J.F., Thomas, J.P., Renaud, J.E. 2003. Mechanical behavior of acrylonitrile
butadiene styrene fused deposition materials modeling. Rapid Prototyping Journal 9 (4),
219-230.
Sabourin, E., Houser, S.A., Bohn, J.H. 1997. Accurate exterior, fast interior layered
manufacturing. Rapid Prototyping Journal 3 (2), 44-52.
Salonitis, K., Pandremenos, J., Paralikis, F., Chryssolouris, G. 2009. Multifunctional materials
used in automotive industry: A critical review. Engineering Against Fracture 1, 59-70.
Sood, A.K., Ohdar, R.K., Mahapatra, S.S., 2010. Parametric appraisal of mechanical property of
fused deposition modeling processed parts. Materials and Design 31 (1) pp. 287-295.
Stevens, Malcolm P. 1999. Polymer chemistry: An introduction. New York: Oxford
University Press

63
Sun, Q., Rizvi, G.M., Bellehumeur, C.T., Gu, P. 2008. Effect of processing conditions on the
bonding quality of FDM polymer filaments. Rapid Prototyping Journal 14 (2) pp. 72-80.
Truckenmuller, R., Henzi, P., Herrmann, D., Saile, V. Schomburg, W.K. 2004. Bonding of
polymer microstructures by UV irradiation and subsequent welding at low temperatures.
Microsystem Technologies 10 (5) pp. 372-374.
Tsao, C., DeVoe, D.L. 2009. Bonding of thermoplastic polymer microfluidics. Microfluidics
and Nanofluidics 6 (1) pp. 1-16.
Wang, T., Xi, J., Jin, Y. 2007. A model research for prototype warp deformation in the FDM
process. International Journal of Advanced Manufacturing Technology 33 (11-12),
1087-1096.
Wohlers, T. 2012. Wohlers Report 2012: Additive manufacturing and 3D printing state of the
industry.
Young, R., Lovell, P.A. 2011. Introduction to polymers. New York: CRC Press, Taylor &
Francis Group.
Zein, I., Hutmacher, D.W., Tan, K.C., Teoh, S.H. 2002. Fused deposition modeling of novel
scaffold architectures for tissue engineering applications. Biomaterials 23 (4), 1169-
1185.
Zhong, W., Li, F., Zhang, Z., Song, L., Li, Z. 2001. Short fiber reinforced composites for fused
deposition modeling. Materials Science and Engineering: A 301 (2), 125-130.

64
Appendix A
FDM1
FDM2
A
pneumatic slide
build platform
B
Figure A1. Multi-material, multi-technology FDM system. A) overview of entire system. B) close-up view of FDM1 building on the platform that is attached to a pneumatic slide.
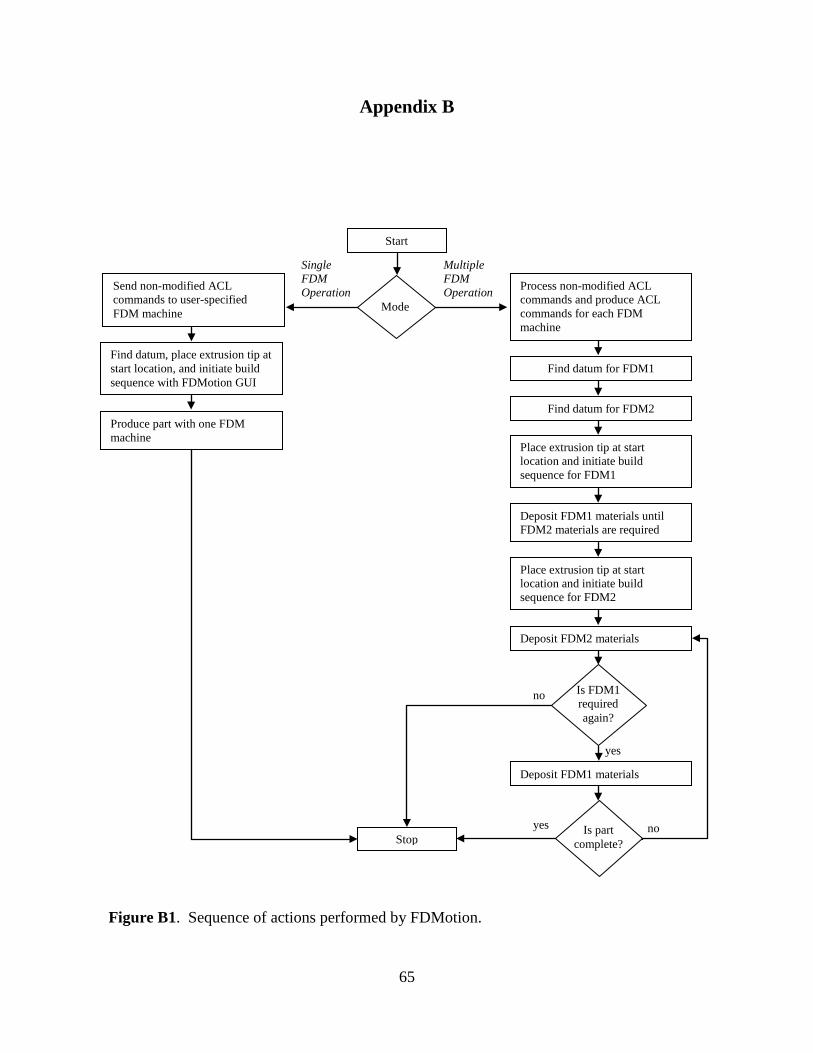
65
Appendix B
Start
Mode
Find datum, place extrusion tip at start location, and initiate build sequence with FDMotion GUI
Single FDM Operation
Produce part with one FDM machine
Multiple FDM Operation Process non-modified ACL
commands and produce ACL commands for each FDM machine
Find datum for FDM1
Deposit FDM2 materials
Place extrusion tip at start location and initiate build sequence for FDM1
Find datum for FDM2
Place extrusion tip at start location and initiate build sequence for FDM2
Deposit FDM1 materials until FDM2 materials are required
Is part complete?
Is FDM1 required again?
Stop
Deposit FDM1 materials
yes
no yes
no
Send non-modified ACL commands to user-specified FDM machine
Figure B1. Sequence of actions performed by FDMotion.

66
Appendix C
Figure C1. “FDMotion.vi” front panel and block diagram showing Case 0

67
Figure C2. “FDMotion.vi” block diagram showing Case 1-5

68
Figure C3. Front panel and block diagram for “Pneumatic Slide Control Panel.vi.”

69
Figure C4. Front panel and block diagrm for “FDM1 Control Panel.vi” (top) and “FDM2 Control Panel.vi.” (bottom).

70
Figure C5. States within the “data transfer.vi.” “Start” and “multimaterial” states are shown.

71
Figure C6. States within the “data transfer.vi.” “FDM1 file” and “FDM1 batch (T)” states are shown.

72
Figure C7. States within the “data transfer.vi.” “FDM1 batch (F)” and “FDM user wait” states are shown.

73
Figure C8. States within the “data transfer.vi.” “FDM2 file” and “FDM2 batch” states are shown.

74
Figure C9. States within the “data transfer.vi.” “FDM clear (T)” and “FDM1 clear (F)” states are shown.

75
Figure C10. States within the “data transfer.vi.” “home FDM1” and “FDM2 clear” states are shown.

76
Figure C11. States within the “data transfer.vi.” “home FDM2” and “FDM1 press pause” states are shown.

77
Figure C12. States within the “data transfer.vi.” “FDM1 release pause (T)” and “FDM1 release pause (F)” states are shown.

78
Figure C13. States within the “data transfer.vi.” “FDM1 press pause normal” and “FDM1 release pause normal” states are shown.

79
Figure C14. States within the “data transfer.vi.” “FDM2 press pause” and “FDM2 release pause” states are shown.

80
Figure C15. States within the “data transfer.vi.” “FDM2 press pause normal” and “FDM2 release pause normal” states are shown.

81
Figure C16. States within the “data transfer.vi.” “FDM1 Finding Home” and “XY Dist FDM1” states are shown.

82
Figure C17. States within the “data transfer.vi.” “Open FDM1 Ctrl P” and “FDM2 finding home” states are shown.
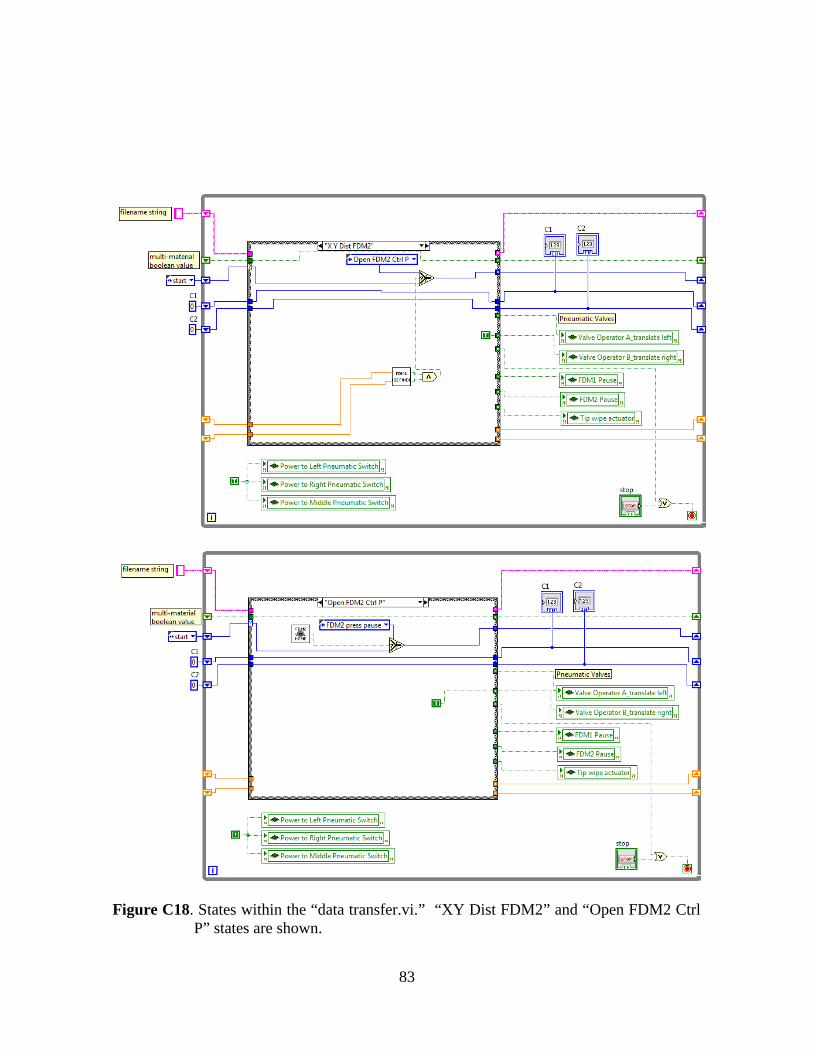
83
Figure C18. States within the “data transfer.vi.” “XY Dist FDM2” and “Open FDM2 Ctrl P” states are shown.
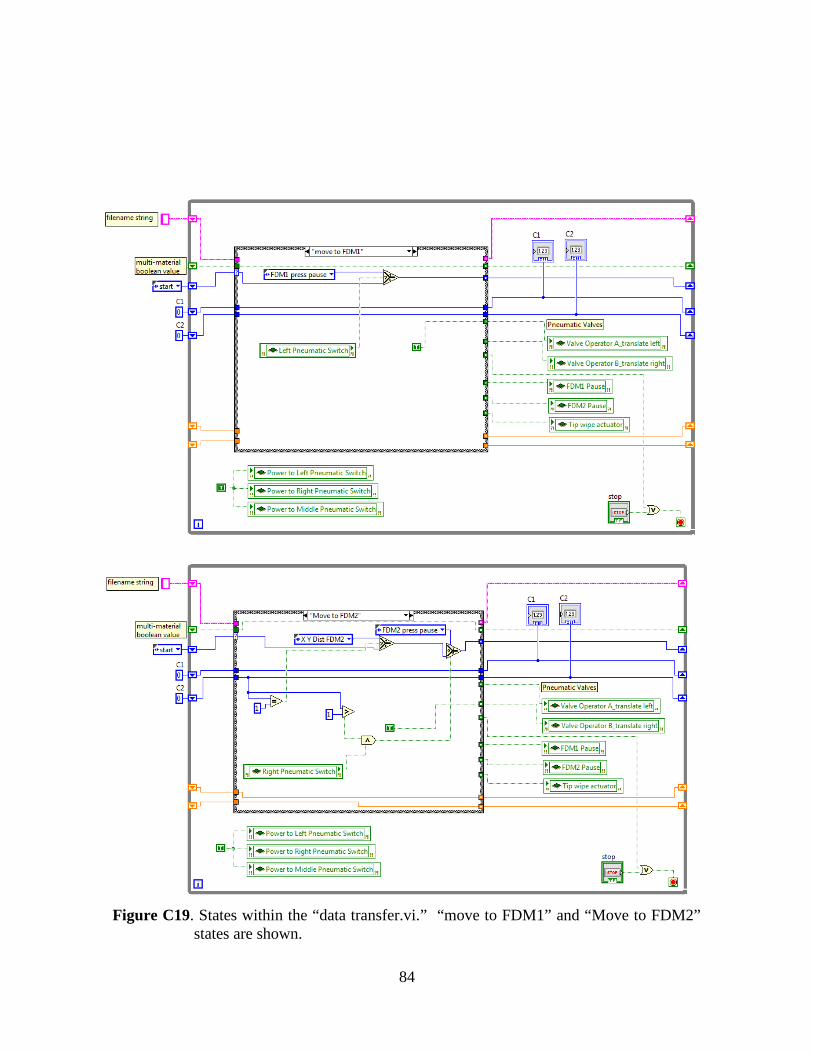
84
Figure C19. States within the “data transfer.vi.” “move to FDM1” and “Move to FDM2” states are shown.

85
Figure C20. States within the “data transfer.vi.” “FDM1 building (T)” and “FDM1 building (F)” states are shown.

86
Figure C21. States within the “data transfer.vi.” “FDM2 building” and “stop” states are shown.

87
Figure C22. Front panel and block diagram for “multimaterial decision.vi” (top) and “FDM1filename.vi” (bottom).

88
“FDM1 batch.vi”
Figure C23. Block diagrams for “FDM1 batch.vi” and “FDM2 batch.vi.” Front panel and block diagram for “buffering data dialog.vi.”
“FDM2 batch.vi”
“buffering data dialog.vi”

89
Figure C24. Front panels and block diagrams for “FDM2 filename.vi”.

90
Figure C25. Front panels and block diagrams for ”FDM1 clear.vi” (top), “FDM2 clear.vi” (middle), and “start location.vi” (bottom).

91
Figure C26. Block diagram for “start build location.vi.” showing true case
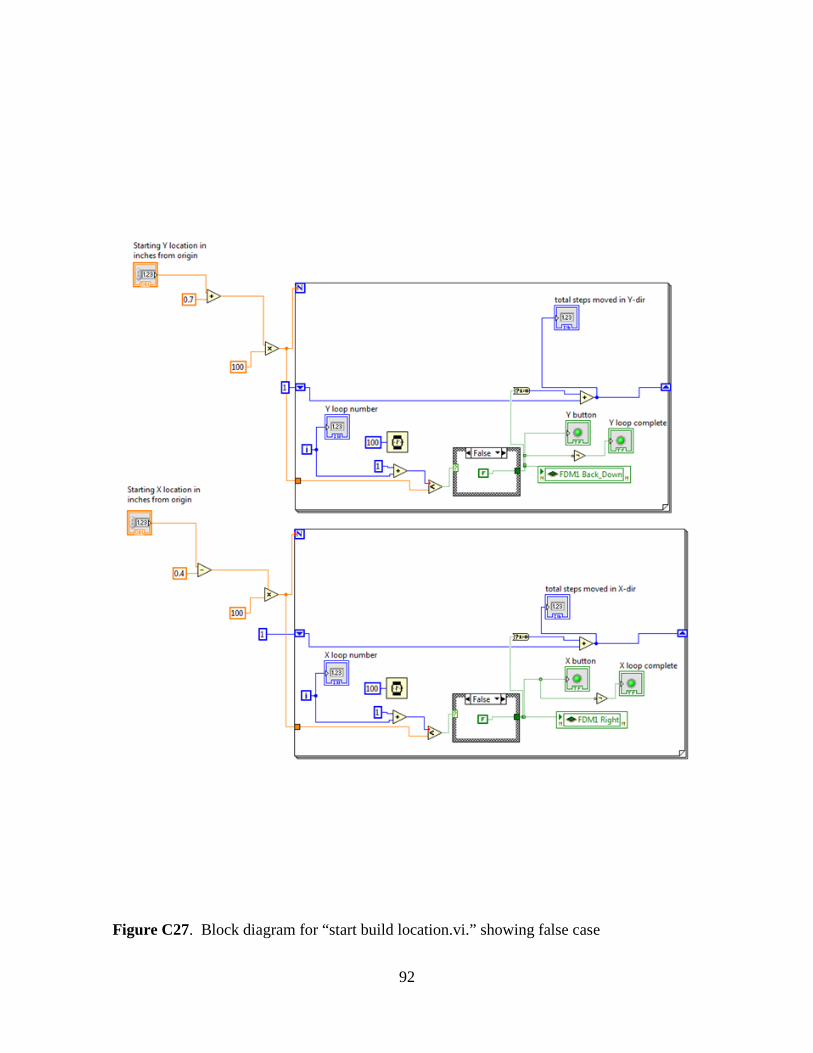
92
Figure C27. Block diagram for “start build location.vi.” showing false case

93
Figure C28. Front panel and block diagram for “FDM1 Control Panel_Finding Home.vi.”

94
Figure C29. Front panel and block diagram for “FDM2 Control Panel_finding home.vi.”

95
APPENDIX D
Figure D2. ASTM D638 Type V specimen (all units in millimeters)
Figure D1. ASTM D638 Type I specimen (all units in millimeters)
19
165
3.2
9.53
3.2
63.5
Figure D3. Tensile test specimen build in the YXZ orientation
Z
Y
X

96
APPENDIX E
Exposure time-replicate Random fabrication order Random testing order 0-TS1 1.0-TS2 1.0-TS5 0-TS2 2.0-TS1 0-TS5 0-TS3 1.0-TS5 1.5-TS1 0-TS4 3.0-TS4 3.0-TS5 0-TS5 1.5-TS1 1.0-TS3 0.5-TS1 3.0-TS1 1.0-TS4 0.5-TS2 0.5-TS5 0.5-TS4 0.5-TS3 0-TS3 0.5-TS3 0.5-TS4 0-TS4 0.5-TS5 0.5-TS5 3.0-TS3 2.0-TS5 1.0-TS1 0-TS1 1.5-TS5 1.0-TS2 1.5-TS5 3.0-TS1 1.0-TS3 2.0-TS2 0-TS4 1.0-TS4 1.5-TS4 3.0-TS3 1.0-TS5 1.0-TS4 1.0-TS1 1.5-TS1 3.0-TS5 0-TS3 1.5-TS2 1.5-TS2 3.0-TS2 1.5-TS3 0-TS5 0.5-TS2 1.5-TS4 0.5-TS2 3.0-TS4 1.5-TS5 2.0-TS5 2.0-TS4 2.0-TS1 1.0-TS3 2.0-TS2 2.0-TS2 0.5-TS1 2.0-TS1 2.0-TS3 1.5-TS3 0.5-TS1 2.0-TS4 1.0-TS1 1.5-TS3 2.0-TS5 0.5-TS3 1.5-TS4 3.0-TS1 2.0-TS3 0-TS1 3.0-TS2 2.0-TS4 0-TS2 3.0-TS3 3.0-TS2 1.0-TS2 3.0-TS4 0.5-TS4 1.5-TS2 3.0-TS5 0-TS2 2.0-TS3
Table E1. Run order for UV/O3 experiments

97
Vita
David Espalin Jr was born on January 12, 1978 and is the son of Mrs. Luz E. Espalin and
Mr. David Espalin (1951-1979). David obtained a high school diploma in May of 1996 from
Santa Teresa High School located in New Mexico. He obtained a Bachelor of Science Degree in
Mechanical Engineering with cum laude distinction from the University of Texas at El Paso in
May of 2010. As an undergraduate student, David received the Best Paper Award at the 2009
International Solid Freeform Fabrication Symposium for his work entitled “Fused deposition
modeling of patient-specific polymethylmethacrylate implants”, which was also published in the
Rapid Prototyping Journal. That same year he also received an honorable mention at the 2009
National Science Foundation LSAMP Conference. While pursuing a graduate degree, David
regularly helped college students with classes, tutored high school students on the weekends,
hosted training sessions related to lab equipment and software, peer-reviewed technical papers as
well as wrote technical papers and proposals. In 2012, he was part of a group that received the
Best Business Plan Award at the 2012 Camino Real Venture Competition.
Permanent address: 313 Poplar Ct.
Sunland Park, NM, 88063
This thesis was typed by David Espalin, Jr.