DEVELOPMENT OF A HYBRID SOLAR WIND TURBINE FOR … · DEVELOPMENT OF A HYBRID SOLAR WIND TURBINE...
45
i DEVELOPMENT OF A HYBRID SOLAR WIND TURBINE FOR SUSTAINABLE ENERGY STORAGE SOON CHING CHUN A project report submitted in partial fulfillment of the requirement for the award of the Degree of Master of Mechanical Engineering Faculty of Mechanical and Manufacturing Engineering Universiti Tun Hussein Onn Malaysia JULY 2015
Transcript of DEVELOPMENT OF A HYBRID SOLAR WIND TURBINE FOR … · DEVELOPMENT OF A HYBRID SOLAR WIND TURBINE...

i
DEVELOPMENT OF A HYBRID SOLAR WIND TURBINE FOR
SUSTAINABLE ENERGY STORAGE
SOON CHING CHUN
A project report submitted in partial
fulfillment of the requirement for the award of the
Degree of Master of Mechanical Engineering
Faculty of Mechanical and Manufacturing Engineering
Universiti Tun Hussein Onn Malaysia
JULY 2015

v
ABSTRACT
This thesis presents the design of hybrid solar wind turbine system for the power
generation system by utilising both solar and wind renewable energy to the domestic
household in the remote area which is unable to connect to the grid. The study was
started by investigating the availability of both solar and wind energy in the desired
location which is southern region of Malaysia. The design of wind turbine is
modelling by Solidworks computer aided design (CAD) software. The computational
fluid dynamics (CFD) is conducted by Solidworks Flow Simulation. The method of
virtual wind tunnel simulation was adopted for wind turbine internal flow analysis
with several of wind speed, in order to obtain the result of wind turbine performance
in various levels of wind data. The data of solar radiation and wind speed were
collected from the Malaysian Meteorological Department, then system configuration
analysis done by simulation tool, HOMER. The basic requirement of electric
primary load is determined in 12.06 kW per day for single household which is
included the essential load demand such as lighting, computer and household
appliance. The optimization analysis is conducted for generating most feasible
system configuration and determines the quantity of components in the hybrid energy
system, in order to meet the load demand of household and achieve the autonomy
power supply with storing excess power generated in batteries storage for the
sustainable energy storage.
vi
ABSTRAK
Thesis ini memperkenalkan sistem hibrid turbin angin dan solar untuk sistem
penjanaan electrik dengan menggunakan kedua-dua tenaga boleh diperbaharui,
iaitu solar dan angin bagi bekalan elektrik kepada kawasan pedalaman yang tidak
mempunyai bekalan kuasa. Kajian ini telah dimulakan dengan menyiasat adanya
kedua-dua tenaga solar dan angin di lokasi yang dikendaki, iaitu kawasan selatan
Malaysia. Reka bentuk turbin angin adalah dimodelkan oleh perisian reka bentuk
bantuan komputer (CAD) “Solidworks”. Pengiraan dinamik bendalir (CFD)
dilaksanakan oleh perisian “Solidworks Flow Simulation”. Kaedah simulasi
terowong angin maya telah digunakan untuk analisis aliran dalaman turbin angin
dengan beberapa kelajuan angin, tujuannya untuk mendapatkan keputusan prestasi
turbin angin di pelbagai peringkat halaju angin. Maklumat solar radiasi dan kelajuan
angin dikumpulkan dari Jabatan Meteorologi Malaysia, analisis konfigurasi sistem
hibird dilaksanakan oleh perisian simulasi, HOMER. Keperluan asas beban elektrik
ialah 12.06 kW sehari untuk permintaan beban elektrik penting seperti lampu,
komputer dan peralatan rumah bagi sebuah rumah. Analisis pengoptimuman
dijalankan untuk mendapatkan konfigurasi sistem tenaga hibird yang paling sesuai
dan menentukan kuantiti komponen dalam sistem tenaga hibrid, sistem tersebut
diperlukan memenuhi permintaan beban isi rumah dan mencapai bekalan kuasa
autonomi dengan menyimpan kuasa lebih dijana dalam bateri simpanan untuk tenaga
boleh diperbaharui penyimpanan.

vii
CONTENTS
TITLE i
DECLARATION ii
DEDICATION iii
ACKNOWLEDGEMENT iv
ABSTRACT v
CONTENTS vii
LIST OF TABLE xi
LIST OF FIGURES xiii
LIST OF SYMBOLS AND ABBREVIATIONS xviii
LIST OF APENDDIX xix
CHAPTER 1 INTRODUCTION 1
1.1 Introduction 1
1.2 Problem Statement 2
1.3 Aim 3
1.4 Objectives 3
1.5 Scope of study 4
CHAPTER 2 LITERATURE REVIEW 5
2.1 Solar energy 5
2.1.1 History of photovoltaics 6
2.1.2 Photovoltaic structure 7
2.1.2.1 Semiconductors p-n type 7
2.1.2.2 Photovoltaic Effect 8
2.1.2.3 Main Cell Types 10

viii
2.1.2.4 Main Parts of a Photovoltaic
System 11
2.1.3 Main principles of PV systems 12
2.1.4 Advantages of PV systems 16
2.2 Wind Energy 16
2.2.1 The Wind 16
2.2.2 History of Wind Energy 18
2.2.3 Wind Turbine Types 20
2.2.3.1 Vertical Axis Wind Turbine
(VAWT) 21
2.2.3.1 Savonius Turbine 21
2.2.4 Principles of Savonius Rotor Wind
Turbine 22
2.3 Power Electronic Circuit 23
2.3.1 AC-DC Rectifier 23
2.4 Energy Storage System 24
2.5 Hybrid Wind and Photovoltaic Power System 25
2.6 Summary of Literature Review 26
CHAPTER 3 METHODOLOGY 28
3.1 Introduction 28
3.2 Flowchart of hybrid solar wind turbine system 29
3.3 Theory and Design 30
3.3.1 Wind Turbine Design 30
3.3.2 Photovoltaic (P.V) Solar Modules 34
3.3.3 Design of Hybrid Solar Wind Turbine
Model 35
3.4 Simulation and analysis 36
3.4.1 Computational Fluid Dynamics (CFD)
Analysis 36
3.4.1.1 Internal flow analysis 36
3.4.2 Simulation Tool of HOMER 40
3.4.2.1 Overview of HOMER 40
3.4.2.2 Measured Solar and Wind
Speed Data 40

ix
3.4.2.3 Load Profile 42
3.4.2.4 Modelling Components in
HOMER 44
3.5 Expected Outcome 46
CHAPTER 4 RESULTS AND ANALYSIS 47
4.1 Introduction 47
4.2 Flow Simulation in the virtual wind tunnel 48
4.2.1 Simulation result of vertical axis wind
Turbine at wind speed 3 m/s 48
4.2.2 Simulation result of vertical axis wind
Turbine at wind speed 5 m/s 51
4.2.3 Simulation result of vertical axis wind
Turbine at wind speed 7 m/s 54
4.2.4 Simulation result of vertical axis wind
Turbine at wind speed 10 m/s 57
4.2.5 Simulation result of vertical axis wind
Turbine at wind speed 12 m/s 60
4.2.6 Simulation result of vertical axis wind
Turbine at wind speed 15 m/s 63
4.2.7 Simulation result of Power Curve for
vertical axis wind Turbine at various
wind speed 66
4.3 Hybrid solar and wind turbine energy system
simulation in HOMER 67
4.3.1 Result of most feasible system
configuration 67
4.3.2 Assessment of wind resource data 68
4.3.3 Assessment of solar resource data 70
4.3.4 Alternative current (AC) primary load 73
4.3.5 Optimization Analysis 75
4.3.6 Result of PV output 82
4.3.7 Result of wind turbine output 83
4.3.8 Result of Battery Output 84
4.3.9 Result of DC to AC Converter 86

x
4.4 Discussion 88
CHAPTER 5 CONCLUSION AND RECOMMENDATIONS 89
5.1 Conclusion 89
5.2 Recommendations 91
REFERENCES 92
APPENDIX 97

xi
LIST OF TABLES
3.1 Value of cut-in speed, rated wind speed, and cut-out
speed 31
3.2 Summary of design parameters 32
3.3 Summaries of rotor blade design and the material
properties of Aluminium Alloys. 33
3.4 Technical specifications of solar cell PT15-300 35
3.5 Load demand 43
4.1 Summary of wind turbine simulation result at wind
speed 3 m/s 48
4.2 Summary of wind turbine simulation result at wind
speed 5 m/s 51
4.3 Summary of wind turbine simulation result at wind
speed 7 m/s 54
4.4 Summary of wind turbine simulation result at wind
speed 10 m/s 57
4.5 Summary of wind turbine simulation result at wind
speed 12 m/s 60
4.6 Summary of wind turbine simulation result at wind
speed 15 m/s 63
4.7 Simulation of system components quantity range 68
4.8 Overall optimization result 76
4.9 Optimization result in a categorized form 77
4.10 Result of energy production by hybrid solar wind
energy system 77
4.11 Net present cost breakdown for the renewable
resource contribution 78

xii
4.12 Annualized cost breakdown for the renewable
resource contribution 79
4.13 Proportion of power consumption in the system 79
4.14 Result of excess electricity generated in the hybrid
system 80
4.15 Summary of PV output 82
4.16 Summary of wind Turbine output 83
4.17 Result of battery storage bank efficiency 85
4.18 Summary of converter performance 86
4.19 Summary of converter information 87

xiii
LIST OF FIGURES
2.1 Basic structure of a generic silicon PV cell 7
2.2 Operation of a PV cell 8
2.3 I-V curve of a typical silicon PV cell under standard
test conditions 9
2.4 General schematic of a residential PV system 11
2.5 I-V curve in different intensities of solar irradiance 13
2.6 The global wind circulation 17
2.7 Worldwide installed wind capacity the last 17 years 18
2.8 A multi-bladed wind turbine 19
2.9 Schematic drawing showing the drag forces exert
on two blade Savonius 22
2.10 Full-bridge, single-phase, AC-DC controlled
rectifier circuit 23
2.11 Proposed hybrid wind/PV power generation system
with energy storage system 25
3.1 Flow Chart of hybrid solar wind turbine system 29
3.2 Design of Savonius rotor blades 33
3.3 Model of PV array 34
3.4 Positioning of the Flexsolarcells solar cells on the
blade of the vertical axis wind turbine 35
3.5 Model of virtual wind tunnel in Solidworks Flow
Simulation 37
3.6 Vertical wind turbine incorporated in the middle
of virtual wind tunnel 37
3.7 Section view of vertical wind turbine model in
virtual wind tunnel 37
3.8 Computational domain of simulation model 38

xiv
3.9 Inlet velocity of virtual wind tunnel 38
3.10 Outlet condition of virtual wind tunnel 39
3.11 Measured solar data from southern region of
Malaysia, Johor. 41
3.12 Measured wind speed data from southern region of
Malaysia, Johor. 41
3.13 Load profile for a typical house in rural areas of
Malaysia. 42
3.14 Kinetic battery model illustrations 45
3.15 The hybrid energy system with PV/ wind turbine/
battery storage 46
4.1 Virtual wind tunnel simulation for the vertical axis
wind turbine 47
4.2 Section view of flow trajectories plan at wind
speed 3 m/s 49
4.3 Top view of flow trajectories plan at wind
speed 3 m/s. 49
4.4 Bottom view of flow trajectories plan at wind
speed 3 m/s 50
4.5 Isometric view of flow trajectories plan at wind
speed 5 m/s 52
4.6 Top view of flow trajectories plan at wind speed
5 m/s 52
4.7 Bottom view of flow trajectories plane at wind
speed 5 m/s 53
4.8 Section view of flow trajectories plan at wind
speed 5 m/s 53
4.9 Isometric view of flow trajectories plane at wind
speed 7 m/s 55
4.10 Top view of flow trajectories plane at wind
speed 7 m/s 55
4.11 Bottom view of flow trajectories plane at wind
speed 7 m/s 56

xv
4.12 Isometric view of flow trajectories plane at wind
speed 10 m/s 57
4.13 Top view of flow trajectories plan at wind speed
10 m/s 58
4.14 Bottom view of flow trajectories plane at wind
speed 10 m/s 58
4.15 Section view of flow trajectories plane at wind
speed 10 m/s 59
4.16 Section view of flow trajectories plane at wind
speed 12 m/s 61
4.17 Top view of flow trajectories plane at wind speed
12 m/s 61
4.18 Bottom view of flow trajectories plane at wind
speed 12 m/s 62
4.19 Isometric view of flow trajectories plane at wind
speed 15 m/s 64
4.20 Top view of flow trajectories plane at wind speed
15 m/s 64
4.21 Bottom view of flow trajectories plane at wind
speed 15 m/s 65
4.22 Section view of flow trajectories plane at wind
speed 15 m/s 65
4.23 Detail section view of flow trajectories plane at
wind speed 15 m/s 66
4.24 Power curve of vertical axis wind turbine in various
wind speed 66
4.25 System configuration of hybrid solar PV, wind
turbine, battery storage for the household of remote
area in HOMER 67
4.26 Measured data of wind resource 68
4.27 Monthly average value of wind speed 69
4.28 Scaled monthly data of wind for the hour over a
year 69

xvi
4.29 Weibull Curve and wind speed probability density
function 69
4.30 Wind speed cumulative density function 70
4.31 Scaled data daily profile of wind speed 70
4.32 Global horizontal radiations 71
4.33 Monthly average value of solar radiation 71
4.34 Monthly average value of global horizontal solar
radiation 72
4.35 Monthly average value of global solar radiation
incident on the PV array 72
4.36 Solar radiation probability density function (PDF) 72
4.37 Solar radiation cumulative density function (CDF) 73
4.38 Scaled data daily profile of solar radiation 73
4.39 AC Primary load daily profile 74
4.40 AC Primary load seasonal profile 74
4.41 Monthly average value of AC primary load 74
4.42 The proportion of solar and wind based on monthly
average 77
4.43 Net present cost summary for the renewable
resource contribution 78
4.44 Annualized cost summary for the renewable
resource contribution 79
4.45 Daily excess electrical productions in 12 months
period 80
4.46 Daily unmet electrical loads in 12 months period 81
4.47 Daily capacity shortages in 12 months period 81
4.48 Daily PV power output over a 12 months period 82
4.49 Daily wind turbine power output over a 12 months
period 83
4.50 Frequency histogram for state of battery charge 84
4.51 Monthly statistics for State of charge 84
4.52 Battery bank state of charge in annual 85
4.53 Battery input power in day of year 86
4.54 Inverter input power over 12 months 87

xvii
4.55 Inverter output power over 12 months 87

xviii
LIST OF SYMBOLS AND ABBREVIATIONS
- Swept area
λ - Tip speed ratio
σ - Solidity
- Diameter of rotor
- Maximum power coefficient
- Total solar irradiance
- Height of rotor
- Intensity of the rotation
- Density of air
- Power of electromagnetic radiation
- Electrical power generated from a photovoltaic panel
- Wind power
- Radius of the rotor
- Overall heat transfer coefficient (W/m2*K)
- Voltage
- Wind velocity in meters per second
ω - Angular velocity
AC - Alternating current
CAD - Computer-Aided Design
CFD - Computational Fluid Dynamics
DC - Direct current
HOMER - Hybrid Optimization of Multiple Energy Resources
MPP - Maximum power point
NPC - Net present cost
PV - Photovoltaic
VAWT - Vertical axis wind turbine
xix
LIST OF APPENDIX
APPENDIX TITLE PAGE
A Project Grant Chat 97
B Vertical axis wind turbine model 99
C Overall optimization result of hybrid solar 100
wind turbine system

CHAPTER 1
INTRODUCTION
1.1 Introduction
In the initial stage of power energy system development, the electricity is supplied to
the users in a type of bulk electric transmission system. Due to the technology of
power system is improved, the traditional type of power system operating pattern
seems to occur some weak points in the field of flexibleness and securities. Besides
that, fossil fuel price is fluctuating due to the global economic and limited resource,
it found that producing electricity with conventional fossil fuel will lead to the
environment pollution. In order to overcome all these issues, the hybrid solar wind
turbine system based on renewable energy such as solar and wind is taken into
account as the alternative method to produce and supply electricity power energy to
the users. (Kumar et. al, 2009)
Solar and wind can be categorised an intermittent source of energy since it is
not continuous supply and does not meet electricity load demand in some time. For
these two types of renewable energy, wind energy is the more affected source if
compared to solar energy due to its inconstancy. Similarly, these two unpredictable
energy sources standalone system will produce fluctuated output energy and thus
cannot ensure the minimum level of power continuity required by the load. (Park et.
al, 2009)
Solar energy system, Photovoltaic (PV) cells are electronic devices that are
based on semiconductor technology and can produce an electric current directly from
sunlight. The best silicon PV modules currently commercially available have an
efficiency of over 18%, and it is expected that in about 10 years’ time module
efficiencies may raise to 25%. The photovoltaic system also depends on the weather

2
conditions and only can operate during day-time. Wind power is basically electricity
produced by a generator, which is driven by a turbine according to flowing air’s
aerodynamics, and is one of the fastest growing renewable energy technologies
around the world. (Subrahmanyam and Alluyada, 2012)
A hybrid energy system is defined as the component combination of two or
more types of power generation system. For this research, solar energy system is
integrated with wind turbine system to form a hybrid renewable energy system. Since
the power output of these renewable energy is ultimately depends on climatic
conditions such as temperature, solar irradiance, wind speed and etc., the instability
of the system output is compensated by adding a suitable energy storage system to
the hybrid energy system. The power autonomy is greatly relied on the perfect
balance exist between power demand and generated power. (Kaldellis, 2012)
The benefits of utilising renewable energy sources such as hybrid solar wind
turbine systems are increased the reliability of the hybrid energy system because it is
based on more than one electricity generation source. Besides that, it is a free from
the pollution and environmental friendly system, since it does not use any fossil fuel
to drive gas turbine for generator. The solar energy also becomes one of the most
promising alternatives for conventional energy sources and has been increasingly
used to generate electric power from sunshine (Popni, 2010). Moreover, the hybrid
solar wind energy system is suitable to use in remote areas with inaccessible to utility
grid. However, there is also disadvantage of using hybrid systems such as in most
cases the system is over- sized because it contains different types of power
generation system. (Subrahmanyam and Alluyada, 2012)
1.2 Problem Statement
Since the sources of both individual solar and wind energy are not stable and often
inconsistent. It is required to hybridize the power generation of wind and solar
energy source with batteries bank as the storage to overcome the periods without
wind or solar energy supplies a stable and constant power generation. However, in
the case of wind power, it is totally different to the conventional fossil fuel, nuclear
power plant and hydroelectric power station. Meanwhile, wind energy is one of the
least expensive renewable energy technologies currently. PV cells or photovoltaic is

3
commonly known as solar cells, it able to convert the thermal energy from sunlight
into direct current electricity. Solar energy offered major advantages which are better
than other renewable energy such as no noise pollution during the power generation
and insignificant periodic maintenance required. (Subrahmanyam and Alluyada,
2012)
Although the solar and wind energy are known as dependable and widely
available renewable energy sources in Malaysia, but the intermittent energy sources
will cause the power generator to produce a fluctuating output. For example, we
could not generate energy using a standalone PV system at night or during a cloudy
day because there is no solar radiation. Similarly, the varying wind speed will affect
the amount of energy generated by a standalone wind turbine system. . In other
words, both standalone systems do not present desirable efficiency in generating
energy.
Conventional solar systems occupy valuable land to absorb the sun light with
larger solar panel as possible. Therefore, compact design is required to overcome the
constraint of space due to the land pricing keep increasing and sun tracking solar
systems are experienced in higher cost of installation.
Hence, in the project, hybrid solar and wind turbine system was introduced
for the operation in day and night. In daylight hours, solar system can achieve the
highest efficiency during the sunny day. Wind turbine able to function during day
and night time without any restriction of climate with at least of wind. In order to
achieve the highest efficiency for renewable energy systems in whole day, hybrid
solar wind turbine system is one of optimum solution to generate the energy in
anytime and all weather conditions.
1.3 Aim
This research is aiming to design the model of hybrid solar wind turbine in single
setup and then investigate the feasibility of the hybrid solar vertical wind turbine
system, energy output and storage.

4
1.4 Objectives
The objectives of conducting this project are,
i. To access a hybrid solar vertical wind turbine model and design in Computer-
Aided Design (CAD) software.
ii. Optimize the design of renewable energy component in hybrid energy system
configuration.
iii. To simulate the performance of the solar and vertical wind turbine hybrid
system in accordance with weather record of Southern Region from
Malaysian Meteorological Department.
iv. To examine a hybrid solar vertical wind turbine system that capable to secure
at least 24 hour autonomy power supply for household in remote area and
sufficient batteries as support of sustainable energy storage.
v. To compare the power output of the hybrid system with the required electric
load demand of domestic household.
1.5 Scope of study
i. Weather data collection of solar radiation and wind speed at Southern Region
Malaysia
ii. Modelling of hybrid solar vertical wind turbine in CAD Software,
SolidWorks.
iii. Simulation of hybrid solar wind turbine would be carried out with separated
into individual standalone system due to the constraint of software ability.
iv. Wind Turbine would be simulated by Computational Fluid Dynamics (CFD)
based on wind speed data at Southern Region Malaysia.
v. Solar system would be simulated in HOMER based on solar radiation data
during sunny day daylight hours.
vi. Electrical energy generated result would be obtained from the result of
simulation and converted output data from kinetic energy.
vii. System optimisation would be simulated and analysis by HOMER.
viii. Investigation feasibility of the energy storage system for the energy generated
by hybrid solar vertical wind turbine system.

5
CHAPTER 2
LITERATURE REVIEW
2.1 Solar Energy
The sun is the largest energy source of life at the same time, it is the ultimate source
of all energy (except power of geothermal). The sun radiates 174 trillion kWh of
energy to the earth per hour. In other words, the earth receives 1.74 x 10 17 watts of
power from the sun (Breeze P., 2009).
Characteristics of the sun is simplified as follows : mass 2× kg,
beam length 700.000 km, age 5× years and estimated roughly 5 billion more
years of life. The surface temperature of sun is approximately 5800 K while the
internal temperature is approximately 15.000.000 K. High temperature reactions is
due to the transformation of hydrogen in helium. The process of the nuclear
fusion, which is characterized from the following reaction 4 →
Energy, is the result of the sun high temperature and the large amounts of
energy emitted continuously. It is calculated that for each gram of hydrogen,
that is converted to He, sun radiates energy equal with U= 1.67× kWh. The
solar energy is emitted to the universe mainly by electromagnetic radiation. (SAO,
2014)
The estimated distance from the sun is 150,000,000 km while the sun is
stationed and spins around by the earth in an elliptic orbit. The light having the
travelling speed of 300,000 km/sec to overcome the aforesaid distance, it consumed

6
approximately 8.5 minutes. Actinic of emitted radiation is removed by the aster to
the space and the intensity of radiation J, is calculated by the equation below:
(2.1)
P is presenting the electromagnetic radiation power and d is presenting the
distance from the sun. It is estimated that one-third of the radiation is reflected back.
The rest of energy will be absorbed and retransmitted to the space while the earth
reradiates just as energy as it receives and creates a balance of energy balance at the
level of temperature which is suitable for life. Solar energy can be used to
generate electricity directly with the photovoltaic panels. (Duffie and Beckman,
2013)
2.1.1 History of Photovoltaics
Photovoltaic is defined that using sun light to generate the electricity. Sunshine hits
photovoltaic cells or a mirror arrangement and electricity is generated. In the second
half of 20th Century, the development of photovoltaic cells technology was moving
rapidly, although Edmond Becquerel has observed the effect of photovoltaic in 1839.
A Cambridge scientists Adams was published his first research report of photovoltaic
report in 1877. Next, selenium solar cell was built by Charles Fritts in 1883, even
though the efficiency less than 1% but it is similar to contemporary silicon solar cells.
First modern silicon solar cells were manufactured in 1954 by Chapin, Fuller and
Person, the solar element with p-n junction was achieved 6% efficiency of system.
The cost of initial commercial manufactures was high and relatively low efficiency
in 5 – 10%. In addition, the solar cells were mainly made by crystalline material such
as crystal silicon (c-Si). (Patel, 2006)
At the present stage, the crystalline silicon cells is achieved the best
efficiency in 24% for photovoltaic cells used in field of aerospace technology and
achieved overall efficiency 14-16% for those used for industrial and domestic use.
The cost will be cheaper if they are purchased in bulk quantities. (Hulk Energy, 2011)

7
2.1.2 Photovoltaic Structure
The photovoltaic cells structure is quite straightforward. It consists of 6 different
layers of materials as shown in Figure 2.1. First of all, the efficiency of photons
absorption is increasing due to the assistance of black cover glass surface, the glass is
protecting the cell from the elements of atmosphere. The reflection losses of the
photons are reduced to less than 5% by the anti-reflective coating. The travelling
distance of the Photons was minimized by contact grid, so that it able to reach the
semiconductors. The heart of the photovoltaic system is consisting of semiconductors
p and n in the form of two thin layers. Lastly, the back contact is contributing for the
better conduction. (Luque and Hegedus, 2009)
Figure 2.1 Basic structure of a generic silicon PV cell (Toothman, 2012)
2.1.2.1 Semiconductors p-n type
The photovoltaic cells that mentioned previously consist of 2 semiconductors p-n
which are both made of crystalline silicon. The n-type semiconductor is created when
some of their atoms of the crystalline silicon are replaced by atoms of another
material which has higher valence band like phosphorus. Consequently an n-
type semiconductor is being created which has a surplus of free electrons in

8
its valence band. On the other hand a p-type semiconductor is created when some of
the atoms of the crystalline silicon are replaced by atoms with lower valence
like boron and the result is the creation of another material with deficit of free
electrons and is known as p-type semiconductor. These missing electrons are called
holes. (Duffie and Beckman, 2013)
Figure 2.2 Operation of a PV cell (Toothman, 2012)
The p-n junction is created while semiconductors are touching together,
depletion region is formed when the electric field is setting up in that particular
region. In Figure 2.2, it is observed that diffusion from one semiconductor to the
other one that can able to make the electrons move,this process is created that
particles with positively charged in one direction and particles with negatively
charged in opposite direction. (Luque and Hegedus, 2009)
2.1.2.2 Photovoltaic Effect
The sun light beam is the main key to create the photovoltaic effect. Electrons will be
stimulated when the photons in the photovoltaic cell exposed to the sun light beam.
The electrons will jump into the conduction band after it starts moving rapidly, and
then holes in the valence band leaved by electrons. Holes of nearby p-side are
combining with electrons attracted from opposite direction which is n-side.
The electric current in the photovoltaic cell is creating by electrons from one
of semiconductor flow over to the other. In addition, if grooved Si surface and the
coating of anti-reflective surface can be used, it can definitely maximize the
absorption of the photons in the Photovoltaic cell. Besides that, the open circuit
voltage will occur if the current is indicated minimum (zero) value, the resistance in
the circuit is infinite and the voltage reaches maximum value. Otherwise, the short

9
circuit will happen if the current of circuit reaches the maximum value, the resistance
of circuit is zero. The photovoltaic cell’s I-V characteristic curve can be defined if
the resistance between infinity and zero varies, the voltage and current will be
determined to vary as well. Maximum power point (MPP) of Photovoltaic cell can be
found in the Figure 2.3. (Tzanakis, 2006)
Figure 2.3 I-V curve of a typical silicon PV cell under standard test conditions
(Tzanakis, 2006)
Finally, international standard test conditions are established, in order to measure the
power output of photovoltaic cells. The level of irradiance is defined as 1000 W/m²,
with the reference of air mass 1.5 solar spectral irradiance distributions and cell
junction with temperature of 25°C. (Luque and Hegedus, 2009)

10
2.1.2.3 Main Cell Types
The material that is used widely in the industry for the production of
photovoltaic cells is silicon. Silicon can be found inside the sand in the form
of silicon oxide (SiO2). The final product is characterized by high purity
99.99999%. The photovoltaic cells of silicon are distinguished in four categories,
depending on the structure of the basic material from which they are made and the
particular way of their preparation. The types are the following ones:
1. Single-Crystal Silicon: The basic material is monocrystalline silicon. In order to
make them, silicon is purified, melted, and crystallized into ingots. The ingots
are sliced into thin wafers (Wafer~300µm) to make individual cells. The
efficiency of a single crystal silicon cell oscillates between 13-16% and it is
characterized by a high cost for the manufacture and has a dark blue colour. (Patel,
2006)
2. Polycrystalline Silicon: The particular cell is relatively large in size and it can be
easily formed into a square shape which virtually eliminates any inactive area
between cells. Its efficiency oscillates between 10-14% and it is characterized by
lower cost silicon which is used for its manufacture and has light blue colour. (Luque
and Hegedus, 2009)
3. Ribbon Silicon: Ribbon-type photovoltaic cells are made by producing a
ribbon from the molten crystal silicon instead of an ingot. Its efficiency is
around 13% and is very expensive with a limited industrial production. (Luque and
Hegedus, 2009)
4. Technology which uses thin film solar cells while the total thickness of a semi-
conductor is about 1µm. Amorphous or thin film silicon cells are solids in which the
silicon atoms are much less ordered than in a crystalline form. By using multiple
junctions this kind of photovoltaic cells achieve maximum efficiency which is
estimated at about 13% while the installation cost is reduced. Furthermore the
output of an amorphous silicon cell isn’t decreased as temperature increases and is
much cheaper to produce than crystalline silicon. (Patel, 2006)

11
2.1.2.4 Main Parts of a Photovoltaic System
In the figure 2.4, photovoltaic system is consisting of various devices. The complete
photovoltaic system is constituted by inverter, charge controller and batteries.
Figure 2.4 General schematic of a residential PV system (Toothman, 2012)
In this renewable energy system, the energy produced by Photovoltaic cell is
stored in the batteries. Furthermore, Energy will be supplied to the system, it
generally happens at nights, cloudy days and days which are required higher
electrical demands. Deep-cycle batteries is the most common type of batteries and
commonly be used. Deep-cycle batteries are categorised as type of lead-acid battery
and advantages of wide range of usage. Nickel-cadmium battery is very costly, but
the energy stored can be discharged at the higher level than lead-acid battery and
high level of durability. (Kaldellis, 2012)
Before the photovoltaic system connects to the grid, it is required to consider
the characteristics of the batteries as follows:
1. Battery total capacity is representing the total load of battery (Ampere hour)
that the energy capable to be stored in the battery.

12
2. Battery voltage is defined according to the electrolyte type and the elements
number.
3. Discharge depth represents that the battery discharge level which is capable
to achieve in daily.
4. The cost per kWh represents that the total electrical energy to be calculated
while the batteries supplying the power during the life cycle.
5. The battery operational life shows that the battery life cycle in the
photovoltaics system, the battery has to be replaced after 5-6 years operation.
6. Operating temperature represents that battery capacity is reduced as
temperature goes down, and increased as temperature goes up.
Charge controller is an important device for the battery life cycle. In the
operation mode of charge controller, the life of battery will be reduced if overcharge
occurs in the battery. In order to increase the battery life, the charge controller will
block the electrical load continuously flowing in while the batteries are fully charged.
(Mousavi and Fathi, 2009)
The inverter is an important device that able to convert alternative current
(AC) from direct current (DC Alternative current usage is essential and crucial, since
it has been widely used for all variety of industry sector and domestic uses. It is used,
generally, in cases where a source of continuous electric voltage is allocated
and where an alternative electric voltage is used, as it happens with the
installed PV cells on the buildings. The efficiency of the inverter is quite high
and varies between 93% and 96%. (Shagar and Vinod, 2012)
2.1.3 Main Principles of PV Systems
A photovoltaic cell is rarely used in single set or individually, since it is unable to
supply sufficient power and voltage of electronic device requirement. Due to this
reason, it needs more set of photovoltaic cells be coupled together and to be
connected parallel or in series for energy production, in order to achieve the higher
power output and voltage as possible.
A typical photovoltaic system is made of 36 individual 100 cm² silicon
photovoltaic cells and auxiliary devices which are lead-acid batteries with a typical

13
voltage of 12 V. This system has the capacity of producing more than 13V during
cloudy days and can charge a 12 V battery. (Duffie and Beckman, 2013)
In order to utilise the system efficiently, it is required to understand that how
does it works during various electrical loads connected in the system. As
aforementioned, I-V curve is the most important key for the photovoltaic cell, it is
reflecting the performance and characterises a photovoltaic cell. Each parameter of
the photovoltaic cell can be determined and calculated by using the I-V curve as
shown in Figure 2.5. (Patel, 2006)
Figure 2.5 I-V curves in different intensities of solar irradiance (Patel, 2006)
In real conditions, the function of a photovoltaic system may be varied
because of the intensity fluctuation of the solar radiation over a period of time.
When the light of photovoltaic cells, which supplies an electrical resistance, changes,
the power point shifts. This point can be seen experimentally, if the electric power,
which is provided by the PV cell with a given power density E and applied on a
variable electric resistance. Since the resistance varies, fluctuations can be
measured in current and voltage by using the appropriate measurement devices;
ammeter and voltmeter. In Figure 2.5, it can be observed that presents a peak point
in the “knee” of the I-V curve. The values of the electrical current in the
maximum power point are symbolized with and . The max power, which a
PV cell can produce, is calculated as follows:
(2.2)

14
Using the max power and the appropriate I-V curve, the fill factor can
be calculated. Fill factor is the key characteristic in evaluating cell performance of a
PV cell, while it can also show that the efficiency of photovoltaic system. As the
values of the fill factor are closer to the unit 1, the efficiency of the system
performance will be increased. Typical values of the fill factor for a PV cell
which has a quite high efficiency are between 0.7 and 0.9.
(2.3)
In order to calculate the electrical power generated from a photovoltaic panel,
, the total solar irradiance, , and the efficiency of the electrical conversion,
, have to be calculated. The solar radiation which reaches the earth has two
different components; the beam radiation and the diffuse radiation. So by
adding these two values, the total solar irradiance for a point on the surface
of the earth, can be calculated (Duffie and Beckman, 2013)
(2.4)
The electrical conversion can be calculated using the following formula:
(2.5)
Where,
measuring in standard testing conditions (2.6)
A is the floor area of the panel
(2.7)
So as to calculate the electricity generated from a PV component, the
following equation is used:
(2.8)
Also the power entering the system can be calculated using the formula below:
(2.9)

15
And the system’s power loss from the component can be calculated using the
following formula:
(2.10)
Where U is the overall heat transfer coefficient (W/m2*K)
Using all the above values, the useful power supply from a PV cell can be
derived from the equation below:
(2.11)
Finally, the effectiveness of the electrical power output from a PV cell and
the efficiency of a PV system can be calculated as follows:
(2.12)
(2.13)

16
2.1.4 Advantages of PV Systems
Photovoltaic modules can easily penetrate in remote areas since the electrical power
that produce comes from a reliable, free from pollution and independent source, the
sun. Photovoltaic systems can be economically feasible , since it can help in a
large extent the viable growth of a region. Moreover they can produce electric
current during cloudy days and the current that produced is a direct current
(DC). Photovoltaic systems were manufactured in order to function in
unfavourable conditions and it has a very small weight. It is possible installed on
the ground, on the roofs of buildings or on any other location where sun light
beams can reach on the photovoltaic cell surface easily (Kaldellis, 2012). The
principal advantages of PV systems are:
i. A long life cycle since it can provide power for more than 20-25 years
ii. Zero operation cost, because it does not consume fuel or materials.
iii. Low variability of system efficiency and more reliable results.
iv. Maintenance cost is low.
v. No sound pollution in the period of operation.
vi. Energy conservation.
vii. Keep the environment clean and away from pollution of the CO2 emissions
in atmosphere.
A photovoltaic system is installed with an optimum power output of about
1 kW, in a year’s period operation can save around 1300 kWh of electrical energy
and 800 kg of CO2 emission. (Luque and Hegedus, 2009)
2.2 Wind Energy
2.2.1 The Wind
Wind is the continuous movement of atmospheric air masses and is determined by its
speed and orientation. This movement derives from the changes and the different

17
values of the atmospheric pressure while these values are the result of the
solar heating of different parts of the earth’s surface. Despite the fact that the
atmospheric air moves horizontally and vertically as well, only its horizontal
movement is actually considered as wind. (Breeze, 2009)
The wind energy derives from the air as a result of its movement which is
depicted in Figure 2.6. Wind energy is the conversion of a small percentage, about
0.2%, of the solar radiation that reaches the surface of the earth. The wind power
around the globe is estimated in 3.6×10⁹ MW while, according to valid
estimations of the world meteorology organization, the percentage which is
available for energy exploitation in various parts of the world is only 1% and it is
estimated around 0.6Q (175×1012 KWh). (Manwell and McGowan , 2009)
Figure 2.6 The global wind circulation (Tzanakis, 2006)
Many scientists support that the proper exploitation of the wind energy can
resolve in a way the world’s energy problem. For instances, the energy needs in here
hardly constitute the one tenth of the wind energy potential of the country. Nowadays
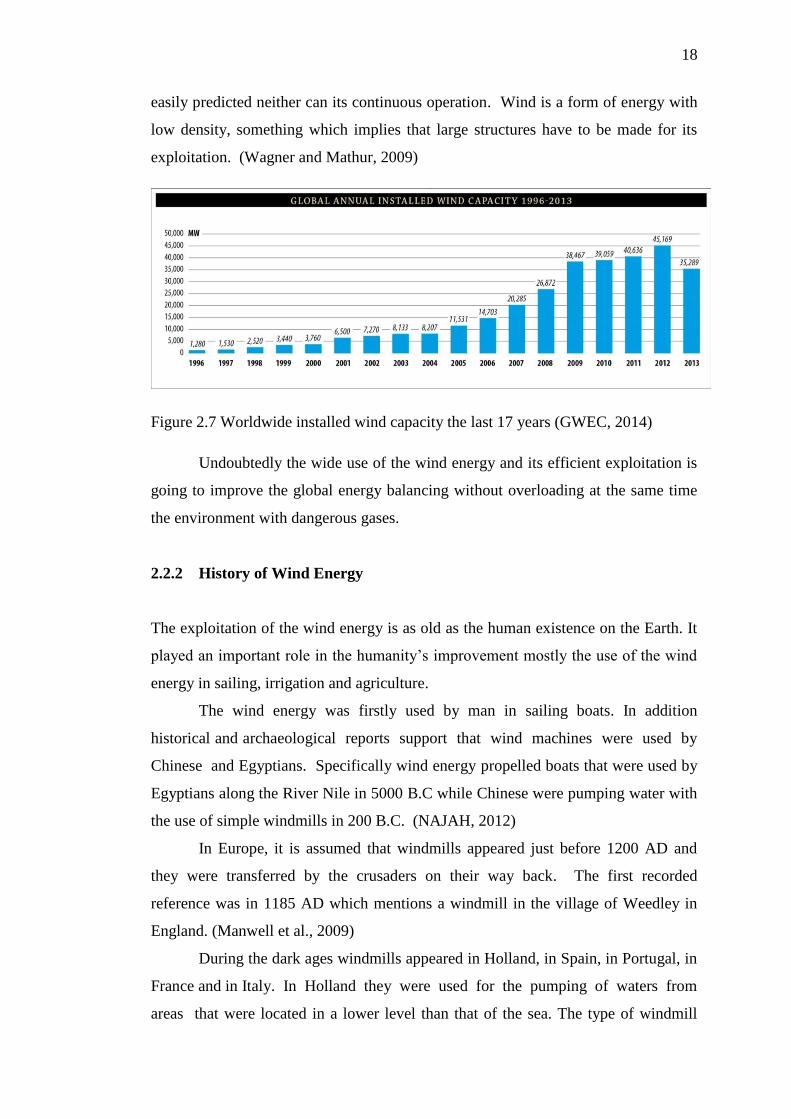
a total of 59,100 MW of wind generated capacity is installed around the world, with
an average annual growth rate of 29 percent over the last ten years as it can be seen
from Figure 2.7. Although each coin has two sides and thus wind energy can’t be
18
easily predicted neither can its continuous operation. Wind is a form of energy with
low density, something which implies that large structures have to be made for its
exploitation. (Wagner and Mathur, 2009)
Figure 2.7 Worldwide installed wind capacity the last 17 years (GWEC, 2014)
Undoubtedly the wide use of the wind energy and its efficient exploitation is
going to improve the global energy balancing without overloading at the same time
the environment with dangerous gases.
2.2.2 History of Wind Energy
The exploitation of the wind energy is as old as the human existence on the Earth. It
played an important role in the humanity’s improvement mostly the use of the wind
energy in sailing, irrigation and agriculture.
The wind energy was firstly used by man in sailing boats. In addition
historical and archaeological reports support that wind machines were used by
Chinese and Egyptians. Specifically wind energy propelled boats that were used by
Egyptians along the River Nile in 5000 B.C while Chinese were pumping water with
the use of simple windmills in 200 B.C. (NAJAH, 2012)
In Europe, it is assumed that windmills appeared just before 1200 AD and
they were transferred by the crusaders on their way back. The first recorded
reference was in 1185 AD which mentions a windmill in the village of Weedley in
England. (Manwell et al., 2009)
During the dark ages windmills appeared in Holland, in Spain, in Portugal, in
France and in Italy. In Holland they were used for the pumping of waters from
areas that were located in a lower level than that of the sea. The type of windmill

19
that was used during that era in Europe was mainly horizontal axis with four blades.
Another type of windmill which was widely used during the renaissance period was a
slow multi blade windmill as illustrated in the Figure 2.8:- (Manwell et al., 2009)
Figure 2.8 A multi-bladed wind turbine (NAJAH, 2012)
In the beginning of our century the Danish produced electricity from the wind,
while in America windmills with a metallic structure were used for electricity
production as well. From 1870 until 1930 Chicago became the biggest
industrial centre for windmills production with an estimated production of about 6
million units over that period. In 1891 an experimental wind turbine was operated in
Denmark with 2 electric generators and a rotor blade with a diameter of 22.8 metres
under the supervision of professor P.La.Cour. In addition during 1930 the Baltic
machine was manufactured with a power potential of 100 KW with the design
supervision of Sabanin and Yuriev. Finally in 1940 an experimental wind turbine
with two blades was manufactured in the Vermont in U.S.A which was rated at
1.25 megawatts in winds of about 30 mph. (Jain, 2011)
In the recent years that followed after the Second World War, the use of the
atomic energy along with the low prices of the oil significantly limited the
interest for the exploitation of wind energy. However the environmental pollution
and the energy crisis made the technologically developed countries to show an
intensive interest for this pure and ancient energy source. (Wagner and Mathur, 2009)

20
2.2.3 Wind Turbine Types
The machines, which were proposed to harness the wind energy, are
considered as wind turbines. Wind turbines are categorized according to the
orientation of their axes in comparison with the flow of the wind. There are various
types of modern wind turbines, which are distinguished in the following two main
categories: horizontal axis and vertical axis turbines. (Fernando et al., 2007)
Modern wind turbines are also classified as high rotation speed ones and low
rotation speed ones, depending on a non-dimensional value known as the tip speed
ratio (λ); this is defined as the ratio of the speed of the extremities of a
windmill rotor to the speed of the free wind, and is illustrated below. A useful
measure is provided by this ratio, based on which the different characteristics of
the wind turbines can be compared.
(2.14)
Where ω is the angular velocity in radians per second, R is the radius of the rotor in
meters and is the wind velocity in meters per second.
In addition, the rotation speed of a wind turbine depends on its
aerodynamic parameters and its wind blades size. Moreover, the interconnection
of the turbine to the electric grid plays an important role because all the modern wind
generators which are interconnected to the grid produce electric current which have
the frequency of the central grid. (Manwell et al., 2009)
Finally the parameter of solidity, it is used to distinguish the wind turbines.
Solidity is usually defined as the percentage of the area of the rotor, which contains
material rather than air. (Tzanakis, 2006)
For horizontal axis machines it is defined as:
(2.15)
For vertical axis machines it is defined as:
(2.16)

21
Where parameter σ is the solidity of the turbine, z is the number of the blades, R is
the radius of the rotor and c is the chord (width) of the blade.
2.2.3.1 Vertical Axis Wind Turbine (VAWT)
Vertical axis wind turbines are different from traditional wind turbines in that
their main axis is perpendicular to the ground. Their configuration makes them ideal
for both rural and urban settings and offers the owner an opportunity to offset the
rising cost of electricity and to preserve the environment. Besides, they do not need
the complicated head mechanisms of conventional horizontal axis turbines.
(Fernando et al., 2007)
VAWTs are not affected by the direction of the wind which is useful
in areas where the wind changes direction frequently or quickly. VAWTs are better
able to harvest turbulent air flow found around buildings and other obstacles. This
situation is more common in areas where people live. VAWTs are ideal for both
rural and urban applications including roof top installations.
The generator or other devices can be installed at the ground level,
making it simpler to install or maintain. VAWTs do not kill birds and wild life, it is
because the slow moving and highly visible. VAWTs can be significantly less
expensive to build. They produce less noise compare with horizontal ones. VAWTs
are more aesthetically pleasing.
2.2.3.2 Savonius Turbine
Savonius is a type of VAWT, which uses a rotor that was introduced by
Finnish engineer S. J. Savonius in 1922. Savonius turbines are one of the simplest
turbines. Aerodynamically, they are drag-type devices. In its simplest form it is
essentially two cups or half drums fixed to a central shaft in opposing
directions. Each cup or drum catches the wind and so turns the shaft, bringing the
opposing cup or drum into a flow of the wind. This cup or drum then repeats the
process, so causing the shaft to rotate further and completing a full rotation.
This process continues all the time the wind blows and the turning of the shaft is
used to drive a pump or a small generator. (Abraham and Plourde, 2012)
22
These types of windmills are also commonly used for wind speed
instruments such as the anemometer. Modern Savonius machines have evolved
into fluted bladed devices, which have a higher efficiency and less vibration
than the older twin cup or drum machines. (Manwell and McGowan, 2009)
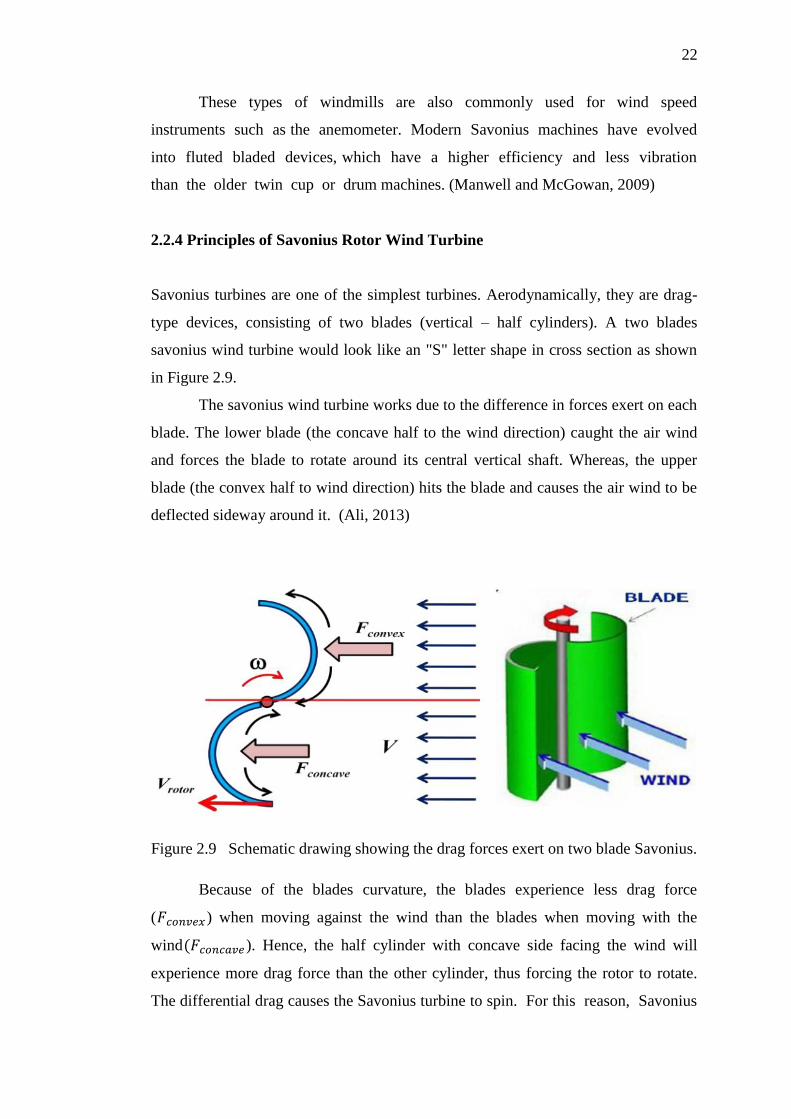
2.2.4 Principles of Savonius Rotor Wind Turbine
Savonius turbines are one of the simplest turbines. Aerodynamically, they are drag-
type devices, consisting of two blades (vertical – half cylinders). A two blades
savonius wind turbine would look like an "S" letter shape in cross section as shown
in Figure 2.9.
The savonius wind turbine works due to the difference in forces exert on each
blade. The lower blade (the concave half to the wind direction) caught the air wind
and forces the blade to rotate around its central vertical shaft. Whereas, the upper
blade (the convex half to wind direction) hits the blade and causes the air wind to be
deflected sideway around it. (Ali, 2013)
Figure 2.9 Schematic drawing showing the drag forces exert on two blade Savonius.
Because of the blades curvature, the blades experience less drag force
( ) when moving against the wind than the blades when moving with the
wind ). Hence, the half cylinder with concave side facing the wind will
experience more drag force than the other cylinder, thus forcing the rotor to rotate.
The differential drag causes the Savonius turbine to spin. For this reason, Savonius

23
turbines extract much less of the wind's power than other similarly sized lift
type turbines because much of the power that might be captured has used up
pushing the convex half, so savonius wind turbine has a lower efficiency.
(Abraham and Plourde, 2012)
2.3 Power Electronic Circuit
Power electronic circuits are used in converting electrical energy. To have a common
source in the hybrid system that combined wind and PV model, power converter is
needed to convert alternating current (AC) to direct current (DC) or vice- versa. The
converting is perform by solid-state semiconductor devices that operate with
periodically switched on and off at a desired frequency (Mohan N. 2009). Therefore,
power electronic converter also known as switching converter because the output is
controlled by switches.
2.3.1 AC-DC Rectifier
Hart (2007) presents the function of rectifier, which is converting alternating current
(AC) source to direct current (DC) source using power diodes or by controlling the
firing angles of controllable switches. In this project, a single phase full wave AC-
DC rectifier as shown in Figure 2.10 is connected to the output side of the wind
model. It will convert the AC voltages generated by the wind model into DC voltages.
Figure 2.10 Full-bridge, single-phase, AC-DC controlled rectifier circuit (Mohan N.
2009)

24
The generally power switch used rectifier is the Silicon-Controlled Rectifier,
where the delay angle is measured from the zero crossing in the positive half of the
AC voltage wave. From Equation (2.10), it shows that the output DC voltage can be
controlled by varying the delay angle α, which in turn controls the conduction (on-
time) of the switch (Patel 2006).
The average DC output voltage is
(2.17)
Where, is the source voltage at the AC side of the rectifier and α is the firing angle.
2.4 Energy Storage System
The two main types of batteries used in hybrid systems are nickel- cadmium
and lead-acid. Nickel-cadmium batteries are restricted in use for few systems
due to higher cost, lower energy efficiency and limited upper operating
temperature. Lead-acid batteries is still the most common type for the hybrid
systems (Mahmoud 2009) .
Lead–acid batteries are usually used for energy storage in hybrid systems to
store surplus energy, to regulate system voltage and to supply load in case of
insufficient solar radiation and/or wind. Only 2 or 3 days of autonomy is required for
batteries in wind–PV hybrid systems, while 5 to 6 days of autonomy are necessary in
separate PV or wind systems (Deshmukh and Deshmukh, 2008). Other storage
means can be used but lead–acid batteries are a low-cost, maintenance-free and
highly efficient technology.
A lead acid battery in its basic construction is made of more than one
electrochemical cells interconnected in such a way to provide the required
voltage and current. Lead acid battery is constructed of two electrodes , the
positive one consists of lead dioxide and the negative consists of pure
lead (Pb). The empty space between the two electrodes is filled with diluted
sulphuric acid ( ). The voltage of the battery depends on cell
temperature and the density of the acid solution, also its density changes with
temperature and charge state. A battery with a 12V nominal voltage is
constructed of 6*2V lead acid cells. The upper and lower limits of charging and

92
REFERENCES
A. Testa, (2010). "Optimal design of energy storage systems for stand- alone
hybrid wind/PV generators," in Power Electronics Electrical Drives
Automation and Motion (SPEEDAM), 2010 International Symposium,
1291-1296.
An-Najah National University (2012). Application of wind energy, Retrieved on
December 4, 2014, from http://www.najah.edu/page/3215
Breeze P. ,(2009). Renewable Energy Focus Handbook. Elsevier Inc.
D. W. Hart, (2007). Introduction to Power Electronics: Upper Saddle River:
Prentice-Hall International, Inc., 2007.
D.Popni, (2010). Analysis of diffusion paths for photovoltaic technology based
on experience curves. Solar Energy, vol. 64, 331-340.
Danish Wind Industry Association, (2011). Retrieved on November 30, 2014,
from http://www.windpower.org/en/tour
Dassault System (2011). Productivity: Experience the Benefits of SolidWorks.
Deshmukh, MK, Deshmukh, SS (2008). Modelling of hybrid renewable energy
systems. Renew Sustain Energy Rev, 12, 235–249.
Duffie, J.A. and Beckman, W.A., (2013). Solar Engineering of Thermal
Processes. 4th
ed. John Wiley and Sons, Inc.
Fernando D. B., Hernán D. B., and Ricardo J. M., (2007). Wind Turbine Control
Systems: Principles, Modelling and Gain Scheduling Design. London:
Springer-Verlag. 39-45

93
Flexsolarcells (2014). Retrieved on November 23, 2014, from
http://www.flexsolarcells.com/index_files/OEM_Components/Flex_Cells
/specification_sheets/21_FlexSolarCells.com_PowerFilm_Solar_PT15-
300_Specification_Sheet.pdf
Global Wind Energy Council (2014). Worldwide installed wind capacity the last
17 years. Retrieved on December 2,2014 from http://www.gwec.net/wp-
content/uploads/2014/04/4_21-1_global-annual-installed-wind-capacity-
1996-2013.jpg
Hayashi, T., Yan, L. and Suzuki, K. (2004). Wind Tunnel Tests on a Three-stage
Out-phase Savonius Rotor. Retrieved on November 26, 2014, from
http://www.2004ewec.info/files/231400_tsutomuhayashii_01.pdf
HOMER (2014). Energy Modelling Software for Hybrid Renewable Energy
Systems. Retrieved on December 10, 2014, from http://homerenergy.com/
Hulk Energy Machinery, (2011). Solar panel manufacturing. Retrieved on
November 30, 2014, from http://www.hulkenergy.com.
I. Daut and M. Irwanto (2010). Potential of Solar Radiation and Wind Speed for
Photovoltaic and Wind Power Hybrid Generation in Perlis, Northern
Malaysia, IEEE journal 2010, 132-137
J.B.V. Subrahmanyam and P. Alluvada, (2012). Development and Perspectives
of a Hybrid Solar-Wind System , Engineering Technology & Applied
Science Research 2(1), 177-181
J.F. Manwell and J,G. McGowan (2009). Wind Energy Explained, Theory,
Design and Application , 2nd
ed, John Wiley & Sons Ltd, UK.
J.K. Kaldellis (2010). Stand-alone and hybrid wind energy systems, Woodhead
Publishing Limited.
J.P. Abraham and B.D. Plourde (2012). Sumnary of Savonius wind turbine
development and future applications for small-scale power generation.
Journal of renewable and sustainable energy, 4(4), 241-264
Jain, P. (2011). Wind Energy Engineering, McGraw-Hill, New York
94
Jessika Toothman and Scott Aldous (2012). How Solar Cells Work. Retrieved on
December 2, 2014 , from
http://science.howstuffworks.com/environmental/energy/solar-cell7.htm
Johnson, C. (1998). Practical Wind-Generated Electricity. Retrieved on 24
September 2014, from http://mb-soft.com/public/wind.html
Kumar, et al. (2009). Modelling and Control of Micro-Turbine Based Distributed
Generation System, Signal Processing, 3(2), 65-72,
Leake, E.W. (2010). Genset-Solar-Wind Hybrid Power System of Off-Grid
Power Station for Rural Applications: Sustainable off-grid power station
for rural applications. IEEE journal 5(2), 98-102.
Luque, A. and Hegedus, S., (2009). Handbook of Photovoltaic Science and
Engineering. U.K.: John Wiley & Sons Ltd.
M.R.S Siti (2011). The evaluation of wind energy potential in Peninsular
Malaysia. International Journal of Chemical and Environmental
Engineering, 2(4), 72-80
Mahmoud M.M. (2009). On the Storage Batteries Used in Solar Electric
Power Systems and Development of an Algorithm for Determining
their Ampere-Hour Capacity. Electric Power Systems Research, 71(1),
85-89
Manwell, J.F., McGowan, J.G. and Rogers, A.L. (2009). Wind Energy Explained:
Theory, Design and Application, John Wiley & Son Ltd .
Mohammed Hadi Ali (2013). Experimental Comparison Study for Savonius
Wind Turbine of Two & Three Blades at Low Wind Speed, International
Journal of Modern Engineering Research, 3(5), 2978-2986

95
Mohan. N and U. T, (2009). Power Electronics Converters, Applications and
Design. New York: John Wiley & Sons
Musgrove, P. (2010). Wind Power, UK: Cambridge University Press.
Noh Dalimin Mohd.(2009). Renewable energy update: Malaysia. Renewable
Energy, 6(4), 435–439.
Patel, M.R., (2006). Wind and Solar Power Systems: Design, Analysis, and
Operation. Boca Raton: Taylor & Francis Group.
S. J. Park, et al. (2009). A Study on the Stand-Alone Operating or Photovoltaic
Wind Power Hybrid Generation System, 35th Annual IEEE Power
Electronics Specialists Conference, Aachen, Germany.
S.M. Mousavi and S.H. Fathi (2009). Energy management of wind/PV and
battery hybrid system with consideration of memory effect in battery,
Journal of IEEE Clean Electrical Power, 5(4), 630-633
Saha, U.K., Thotla, S. and Maity, D. (2008). Optimum Design Configuration of
Savonius Rotor Through Wind Tunnel Experiments. Journal of Wind
Engineering and Industrial Aerodynamics, 96(9), 1359-1375.
SAO (2014). Study Astronomy Online at Swinburne University, Encyclopaedia
of Astronomy. Retrieved on December 8,2014 ,from
http://astronomy.swin.edu.au/cosmos/S/Sun
Shagar Banu M. & Vinod .S (2012). Design of DC-DC converter for hybrid wind
solar energy system, IEEE International conference on computing,
electronics and electrical technologies, 429-435
Solanki, C.S. (2009). Renewable Energy Technologies: A Practical Guide for
Beginners. New Delhi: PHI Learning Private Limited, 103-106
Tzanakis, I., (2006). Combining Wind and Solar Energy to Meet Demands in the
Built Environment, University of Strathclyde: Thesis Ph.D.

96
Wagner, H. and Mathur, J., (2009). Introduction to Wind Energy Systems: Basics,
Technology and Operation. Berlin Heidelberg: Springer-Verlag.
Zhao, Z.Z., Zheng, T., Xu, X.Y., Liu, W.M. and Hu, G.X. (2009). Research on
the Improvement of the Performance of Savonius Rotor Based on
Numerical Study, Journal of Sustainable Power Generation and Supply,
3(2), 1-6.