Development of a holistic early warning system (EWS) for ...
294
Development of a holistic early warning system (EWS) for German food production SMEs _____________________________________________________________ Larissa Dell A thesis submitted to the University of Gloucestershire in accordance with the requirements for the degree of Doctor of Business Administration (DBA) in the Faculty of Business, Education and Professional Studies First supervisor: Prof. Dr. Brian Terry Second supervisor: Dr. Seema Sharma February 2017
Transcript of Development of a holistic early warning system (EWS) for ...

Development of a holistic early warning system (EWS) for
German food production SMEs
_____________________________________________________________
Larissa Dell
A thesis submitted to
the University of Gloucestershire
in accordance with the requirements for the degree of
Doctor of Business Administration (DBA)
in the Faculty of Business, Education and Professional Studies
First supervisor: Prof. Dr. Brian Terry
Second supervisor: Dr. Seema Sharma
February 2017
2
Comment
‘Controlling’ - meaning in the present work: “Controllers ensure the transparency
of business results, finance, processes and strategy and thus contribute to higher
economic effectiveness. Controllers co-ordinate secondary goals and the related
plans in a holistic way and organise a reporting-system which is future-oriented
and covers the enterprise as a whole. Controllers moderate and design the
controlling process of defining goals, planning and management control so that
every decision maker can act in accordance with agreed objectives. Controllers
provide managers with all necessary company management data and
information. Controllers develop and maintain controlling systems” (Vesper,
2014, p. 117).

3
Abstract
This research project, which is limited to German SMEs, deals with the
development of a holistic early warning system (EWS) integrating both a quality
management system (QMS) and controlling (CO).
Most of the concepts designed to identify company risks/crises are focused either
on quantitative (operative) or qualitative (strategic) factors. Several authors point
out the need for a more holistic approach including both quantitative and
qualitative factors.
This research, therefore, sought to explore controlling and quality management
tools for EWSs in the food production industry, which are appropriate for
recognizing risk factors of company failure, outlined by interview and literature
review. Concepts and relations were generated with the help of turnaround-,
controlling-, and quality management-experts and then confirmed/refined and
analyzed by considering how they can be implemented in practice through the
application of case study research.
This research makes a contribution in the following areas: identification of
requirements for an EWS; the exploration of appropriate QM and CO tools for
EWS; the proposal of a holistic approach. The EWS, developed during this work,
enables companies in the food production industry to tailor the framework for the
specific needs of the company. Such a comprehensive, systematic approach (CO
+ QM) is currently unknown, both in research and also practice. Therefore, the
work represents a new, innovative and implementable practical model.

4
Declaration
I declare that the work in this thesis was carried out in accordance with the
regulations of the University of Gloucestershire and is original except where
indicated by specific reference in the text. No part of the thesis has been
submitted as part of any other academic award. The thesis has not been
presented to any other education institution in the United Kingdom or overseas.
Any views expressed in the thesis are those of the author and in no way represent
those of the University.
Larissa Dell
February 2017

5
Acknowledgements
First of all, I would like to express my sincere gratitude to all people, who
supported me during the preparation of the doctoral thesis. In this context, I would
like to name my colleagues and participants in this research, who were of great
support in making valuable contributions to this research.
Moreover, I am indebted to Prof. Dr. Brian Terry and Dr. Seema Sharma, who
acted as doctoral advisors. Both guided me well through the research path over
three to four years.
Special thanks to the members of the University of Gloucestershire, Dr. Philippa
Ward, Dr. Barry Davies and Prof. Dr. Polke for their help in all matters of the
doctoral study. The administrative staff in München and Cheltenham always
reacted quickly to queries and concerns.
I owe my children Vanessa and Alexander the highest respect for allowing me to
do the research during the weekend and mostly before or after work.
Furthermore, I would like to thank my mother, my brothers and my friends
remembering me of their encouragement and continuous moral support
throughout a lifetime of study, without which the completion of this thesis would
have been no more than a dream.
And last, but by no means least, my special thanks to Mark Waistell from Accent
International (Bicton College, Devon), who supported in proof-reading the thesis.
Larissa Dell

6
Table of Contents
ABSTRACT .......................................................................................................................... 3
DECLARATION .................................................................................................................... 4
ACKNOWLEDGEMENTS ...................................................................................................... 5
LIST OF FIGURES ............................................................................................................... 11
LIST OF TABLES................................................................................................................. 13
ABBREVIATIONS ............................................................................................................... 14
1 INTRODUCTION ........................................................................................................ 16
1.1 Problem and aim of work ........................................................................................................ 16
1.1.1 Relevance of the research ......................................................................................................... 17
1.1.2 Previous work within this topic ................................................................................................. 18
1.1.3 Contribution .............................................................................................................................. 20
1.2 Research Questions ................................................................................................................. 22
1.3 Research Objectives ................................................................................................................ 22
1.4 Research Process ..................................................................................................................... 22
1.5 Thesis Structure ...................................................................................................................... 35
2 DEFINITION OF TERMS AND LITERATURE REVIEW .................................................... 40
2.1 Introduction ............................................................................................................................ 40
2.2 Definitions............................................................................................................................... 40
2.2.1 EWS ........................................................................................................................................... 40
2.2.2 Risk ............................................................................................................................................ 42
2.2.3 Concept of risk .......................................................................................................................... 43
2.2.4 Types, Stages, and Process of Crisis .......................................................................................... 44
2.2.5 Quality Management ................................................................................................................ 47

7
2.2.6 Controlling ................................................................................................................................. 50
2.3 Literature Review .................................................................................................................... 51
2.3.1 Development Stages of EWS in the Business Economics literature .......................................... 51
2.3.2 EWS – forms of appearance ...................................................................................................... 54
2.3.3 Operative Early Warning and Early Recognition ....................................................................... 57
2.3.3.1 Characteristics and differentiation of operative early warning system ........................... 57
2.3.3.2 KPI oriented early recognition .......................................................................................... 58
2.3.3.2.1 Approach of Beaver ...................................................................................................... 59
2.3.3.2.2 Altman's Z-Score ........................................................................................................... 60
2.3.3.2.3 Argenti’s Model ............................................................................................................ 65
2.3.3.3 Extrapolation-oriented early recognition ......................................................................... 66
2.3.3.4 Indicator-based early detection ....................................................................................... 68
2.3.3.4.1 Concept of Krystek & Müller-Stewens .......................................................................... 68
2.3.4 Differentiation between ‘operative’ and ‘strategic’ Early Recognition ..................................... 71
2.3.5 Concepts of Strategic Early Warning Systems ........................................................................... 72
2.3.5.1 Tools used during strategic Concepts ............................................................................... 74
2.3.5.2 Concept of Kirsch and Trux ............................................................................................... 75
2.3.5.3 Concept of Battelle Institute ............................................................................................ 76
2.3.5.4 Concept of Hammer ......................................................................................................... 78
2.3.6 Overview of previous work ....................................................................................................... 79
2.3.7 Identification of literature gap .................................................................................................. 83
3 RESEARCH METHODOLOGY ...................................................................................... 98
3.1 Philosophical Framework ........................................................................................................ 98
3.2 Research Methodology ........................................................................................................... 99
3.2.1 Theoretical Position .................................................................................................................. 99
3.2.2 Qualitative Data ........................................................................................................................ 99
3.2.3 Semi-Structured Interview ...................................................................................................... 102
3.3 Case Study Approach ............................................................................................................. 109
3.3.1 Theoretical Background .......................................................................................................... 109
3.3.2 Case Study Approach applied to my Research Design ............................................................ 112
3.4 Refining ................................................................................................................................. 116
3.5 Minimizing bias ..................................................................................................................... 116

8
3.6 Limitations ............................................................................................................................ 117
4 PHASE I: IDENTIFICATION OF REQUIREMENTS FOR EWS ........................................ 118
4.1 Literature review ................................................................................................................... 118
4.1.1 EWS – definition ...................................................................................................................... 118
4.1.2 EWS – a topic in this day and age............................................................................................ 119
4.1.3 Design of an EWS .................................................................................................................... 119
4.1.4 External / internal area ........................................................................................................... 121
4.1.5 Strategic and Operational ....................................................................................................... 123
4.1.6 Qualitative and Quantitative ................................................................................................... 124
4.1.7 Responsibility of CEO .............................................................................................................. 125
4.1.8 Reasons and Symptoms .......................................................................................................... 128
4.1.9 Integration of EWS .................................................................................................................. 132
4.2 Semi-structured Interview..................................................................................................... 134
4.2.1 Early Warning Systems - a topic in this day and age ............................................................... 135
4.2.2 Requirements which an EWS in the Food Production Industry has to fulfill .......................... 136
4.2.3 Business areas which an EWS should be able to cover ........................................................... 138
4.2.4 Priority which an EWS should have in a company .................................................................. 139
4.2.5 Stakeholders by whom it should be agreed ............................................................................ 140
4.2.6 Software appropriate for an EWS ........................................................................................... 141
4.2.7 Persons who are responsible for the appropriateness of the EWS ........................................ 141
5 PHASE II: EXPLORATION OF CO AND QM TOOLS ..................................................... 143
5.1 Literature review ................................................................................................................... 143
5.1.1 Methods for determination of context ................................................................................... 143
5.1.2 Methods for risk identification................................................................................................ 145
5.1.3 Methods for risk monitoring and review ................................................................................ 154
5.2 Semi-structured Interview..................................................................................................... 155
5.2.1 Early Warning Systems - a topic of CO and QM ...................................................................... 155
5.2.2 Requirements from Phase I, which an EWS in the Food Production Industry has to fulfill .... 156
5.2.3 Appropriate CO and QM tools according to the requirements from Phase I ......................... 157
5.2.4 Tools classified as ‘best-practice-elements’ ............................................................................ 158
5.2.5 Integration in a company ........................................................................................................ 161
5.2.6 Tool Software appropriate for an EWS ................................................................................... 162
5.2.7 Persons who are responsible for the appropriateness of the CO and QM tools .................... 162

9
6 DEVELOPMENT OF AN EWS .................................................................................... 164
6.1 QMS & CO as a construct for EWS tools ................................................................................ 166
6.2 Determination of context ...................................................................................................... 172
6.2.1 Weak Signals ........................................................................................................................... 173
6.2.1.1 Scanning and Monitoring ............................................................................................... 176
6.2.1.2 Sources of Weak Signals ................................................................................................. 177
6.2.2 Tools for determination of company context ......................................................................... 178
6.2.2.1 PESTLE ............................................................................................................................ 178
6.2.2.2 Cross-Impact-Analysis .................................................................................................... 180
6.2.2.3 SWOT Analysis ................................................................................................................ 181
6.3 Risk Identification ................................................................................................................. 182
6.3.1 Tools for risk identification ..................................................................................................... 184
6.3.1.1 Diffusion Theory ............................................................................................................. 184
6.3.1.2 Trend Landscape ............................................................................................................ 185
6.3.1.3 Scenario technique ......................................................................................................... 186
6.3.1.4 Planning .......................................................................................................................... 190
6.3.1.5 Turtle Diagram ................................................................................................................ 192
6.3.1.6 FMEA .............................................................................................................................. 193
6.3.1.7 HACCP ............................................................................................................................. 194
6.3.1.8 Fault Tree Analysis .......................................................................................................... 195
6.3.1.9 Delphi Method ............................................................................................................... 196
6.3.2 Summary of Risk Identification ............................................................................................... 198
6.4 Risk Monitoring and Review .................................................................................................. 199
6.4.1 Balanced Scorecard ................................................................................................................. 200
6.4.1.1 Extension of BSC ............................................................................................................. 203
6.4.1.2 Sustainability Scorecard ................................................................................................. 203
6.4.1.3 Early Warning Indicators ................................................................................................ 206
6.4.1.4 Cause-and-Effect Relationships ...................................................................................... 214
6.4.1.5 Key Risk, Performance and Control Indicators ............................................................... 217
6.4.1.6 Monitoring of the defined Indicators and KPIs .............................................................. 230
7 PHASE III: CASE STUDY APPROACH ......................................................................... 237
7.1 Phase III: Case Studies ........................................................................................................... 237
7.2 Expert Interviews within the Case Study ............................................................................... 238

10
7.2.1 EWS-Existing in the company .................................................................................................. 238
7.2.2 Tools use for EWS .................................................................................................................... 240
7.2.3 Satisfaction with current tools ................................................................................................ 240
7.2.4 Critical interfaces .................................................................................................................... 241
7.2.5 Used tools for communication and cooperation of involved party ........................................ 241
7.2.6 Medium for obtaining of information for the company’s protection ..................................... 241
7.2.7 Information process provided for the external company protection ..................................... 242
7.2.8 Critical comments on the developed EWS .............................................................................. 243
7.2.9 Additional requirements for the developed EWS according to the requirements of the
Turnaround Consultants (see Phase I) ................................................................................................. 243
7.2.10 Realizable constellation of this system in praxis................................................................. 244
7.2.11 Measurable risk criteria, which should be integrated into this system .............................. 244
7.2.12 Additional benefit for the company through use of this EWS ............................................ 244
7.2.13 Additional effort, which participants have to bear for the system use .............................. 245
7.2.14 Aspects, which could make the use of this system difficult in praxis ................................. 245
7.2.15 Increased assurance of the company survival .................................................................... 246
8 PHASE IV: REFINING ................................................................................................ 248
9 CONCLUSION .......................................................................................................... 250
9.1 Summary and Discussion of the Results ................................................................................ 250
9.2 Limitations ............................................................................................................................ 257
9.3 Contribution to Knowledge ................................................................................................... 258
9.4 Contribution to Practice ........................................................................................................ 262
9.5 Critical Assessment and Further Research Possibilities.......................................................... 264
9.6 Implications for Practice ........................................................................................................ 271
REFERENCES .................................................................................................................. 272
ANNEX ........................................................................................................................... 288
INTERVIEW GUIDELINE................................................................................................... 288

11
List of Figures
Figure 1 Iterative Research Process ............................................................................................ 23
Figure 2 Initial Literature Review and intended Research Outcome ........................................... 25
Figure 3 Identification of requirement and the intended outcome ............................................... 27
Figure 4 Exploration of CO and QM tools and the intended outcome ......................................... 29
Figure 5 Development of a holistic EWS ..................................................................................... 32
Figure 6 Case Study Approach .................................................................................................... 33
Figure 7 Refining .......................................................................................................................... 34
Figure 8 Research process and thesis structure ......................................................................... 36
Figure 9 Crisis Stages and Crisis Management........................................................................... 46
Figure 10 Development Stages of EWS in Business Economics literature ................................. 52
Figure 11 Overview of EWS - forms of appearance .................................................................... 56
Figure 12 Tools of operative early recognition ............................................................................. 58
Figure 13 Chinese Character for Crisis ........................................................................................ 64
Figure 14 Indicator-based EWS ................................................................................................... 69
Figure 15 Knowledge-State of Discontinuity ................................................................................ 74
Figure 16 Tools used during strategic concepts .......................................................................... 75
Figure 17 Required holistic EWS ................................................................................................. 83
Figure 18 Conceptual framework - identification of research gap ............................................... 84
Figure 19 Overview of tools used in previous concepts .............................................................. 89
Figure 20 Intended development during the research ................................................................. 93
Figure 21 Conceptual framework - context of the research questions and objectives ................ 96
Figure 22 Process map of research phases and their intended outcome ................................. 101
Figure 23 Kurt Lewin's Change Model ....................................................................................... 127
Figure 24 Tools for a holistic EWS ............................................................................................. 165
Figure 25 QMS & CO as construct for EWS tools ..................................................................... 169
Figure 26 Determination of company context ............................................................................ 173

12
Figure 27 Knowledge-State of Discontinuity .............................................................................. 175
Figure 28 SWOT Analysis .......................................................................................................... 181
Figure 29 Methods for risk identification .................................................................................... 183
Figure 30 Scenario Funnel ......................................................................................................... 187
Figure 31 Portfolio-Analysis ....................................................................................................... 188
Figure 32 Methods for risk monitoring and review ..................................................................... 200
Figure 33 Balanced Scorecard................................................................................................... 201
Figure 34 BSC as Manager Cockpit .......................................................................................... 232
Figure 35 Tools overview during QMS & CO ............................................................................. 235
Figure 36 Conceptual framework - context of the research questions and objectives .............. 251
Figure 37 Holistic EWS .............................................................................................................. 259
Figure 38 Comparison of tools from previous concepts and developed model ......................... 260

13
List of Tables
Table 1 Previous work within this topic ........................................................................................ 19
Table 2 Comparison of the criteria used in models for crisis identification .................................. 62
Table 3 Literature overview of concepts dealing with crisis or risk recognition ........................... 82
Table 4 Research questions and research objectives ................................................................. 95
Table 5 Interviewees from Phase I ............................................................................................ 104
Table 6 Interviewees from Phase II ........................................................................................... 107
Table 7 Interviewees from Phase III .......................................................................................... 114
Table 8 Reflecting on Knowing, Doing and Being ..................................................................... 131
Table 9 Differentiation of scanning and monitoring by basic activities during the detection phase
................................................................................................................................................... 176
Table 10 External Pressure........................................................................................................ 207
Table 11 Intercompany Scope ................................................................................................... 209
Table 12 Internal Area ................................................................................................................ 212
Table 13 Preliminary properties of various indicators between 1992 and 2012 ........................ 215
14
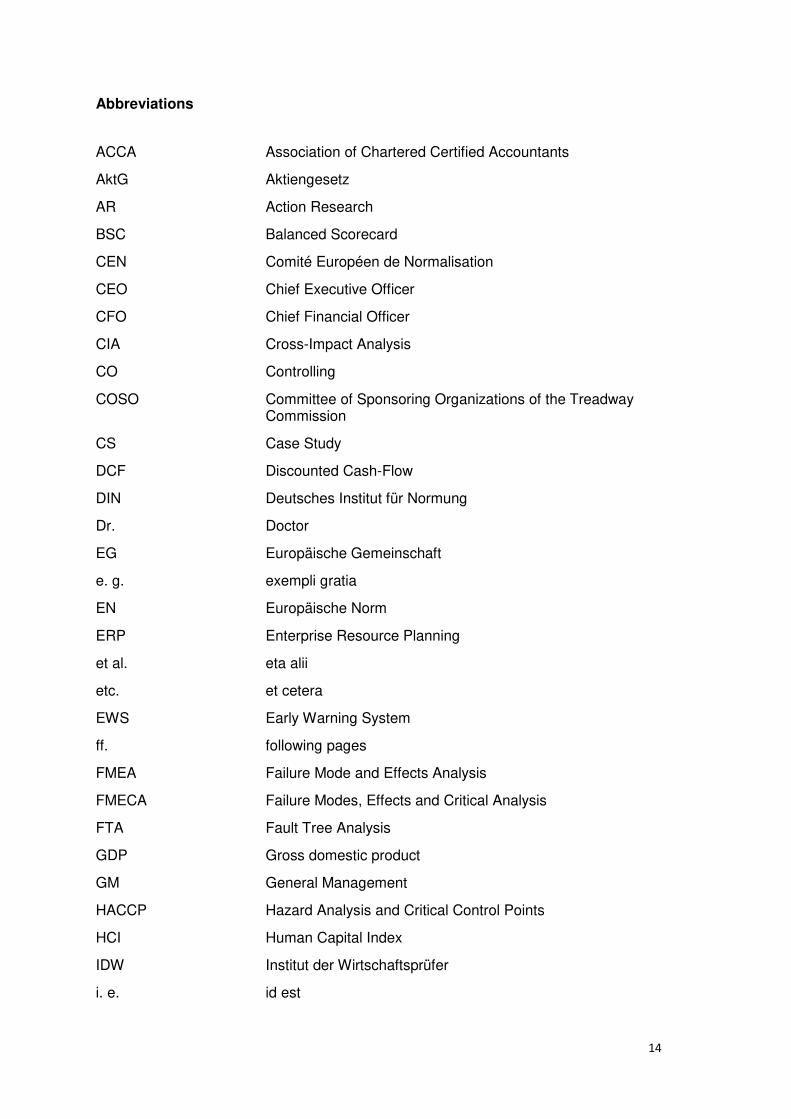
Abbreviations
ACCA Association of Chartered Certified Accountants
AktG Aktiengesetz
AR Action Research
BSC Balanced Scorecard
CEN Comité Européen de Normalisation
CEO Chief Executive Officer
CFO Chief Financial Officer
CIA Cross-Impact Analysis
CO Controlling
COSO Committee of Sponsoring Organizations of the Treadway Commission
CS Case Study
DCF Discounted Cash-Flow
DIN Deutsches Institut für Normung
Dr. Doctor
EG Europäische Gemeinschaft
e. g. exempli gratia
EN Europäische Norm
ERP Enterprise Resource Planning
et al. eta alii
etc. et cetera
EWS Early Warning System
ff. following pages
FMEA Failure Mode and Effects Analysis
FMECA Failure Modes, Effects and Critical Analysis
FTA Fault Tree Analysis
GDP Gross domestic product
GM General Management
HACCP Hazard Analysis and Critical Control Points
HCI Human Capital Index
IDW Institut der Wirtschaftsprüfer
i. e. id est

15
IfM Institut für Mittelstandsforschung
IFO Institut für Wirtschaftsforschung
InsO Insolvenzordnung
ISO International Organisation for Standardization
IT Information Technology
KonTraG Gesetz zur Kontrolle und Transparenz im Unternehmensbereich
KPI Key Performance Indicator
LFGB Lebensmittel-, Bedarfsgegenstände- und Futtermittelgesetzbuch
Mariks Mindestanforderungen an das Risikomanagement
Mio. Million
MS Microsoft
OEE Overall Equipment Effectiveness
p. a. per anum
PDCA Plan-Do-Check-Act
PESTLE Political, Economical, Sociological, Technological, Legal, and Environmental
P&L Profit and Loss
PMI Purchasing Managers` Index
Prof. Professor
QM Quality Management
QMS Quality Management System
R&D Research & Development
RM Risk Management
RMS Risk Management System
ROI Return on Investment
SBU Strategic Business Unit
SME Small and medium-sized enterprises
SWOT Strengths, Weaknesses, Opportunities, and Threats
WACC Weighted Average Cost of Capital
ZEW Zentrum für Europäische Wirtschaftsforschung
16
1 Introduction
1.1 Problem and aim of work
The aim of this research project, which is limited to German SMEs, is to develop
a simple early warning system (EWS) integrating both a quality management
system (QMS) and controlling (CO) tools.
There are two main reasons why this thesis will only discuss small and medium
enterprises (SMEs). The first is the value for the – in this case – German
economy. Nevertheless, the SMEs – and this is the second reason for dealing
only with SMEs – are the enterprises with a much higher probability of getting into
a crisis situation or of getting hit by a crisis. The percentage of insolvencies of
SMEs in comparison to big companies in Germany was 99.7% in 2012 (Bretz &
Kobuss, 2012).
The European Commission defines SMEs as an enterprise with up to 250
employees and a turnover of up to € 50 million or a balance sheet total of up to €
43 million (Commission, 2017). In 2014 the German economy recorded 3,632
million SMEs with a total of about 16.44 million employees. These SMEs
generated more than € 2,204 billion turnover, which is 35.3% of all turnover
subject to VAT (IfM, 2016). Even during the Euro-crisis, SMEs have been crucial
for Germany’s lasting economic stability. Whereas the business climate in the
more export - oriented big companies has shown only a slight increase lately,
SMEs, which focus on the domestic market, are still stable and growing. Thus,
they are an important pillar of the economic climate in Germany (Schönwald,
2011).
The IfM (2016) also analyzed the growth of the number of employees in the SMEs
as well as the big companies. Between the years 2001 and 2009, the number of
employees in SMEs grew by over 13.6% whereas the big companies' number of
employees decreased by about 1.2% (IfM, 2016). These statistics underline the
economic weight of SMEs and their economic perspective.
A company crisis does not automatically mean the death of the company. This is
mainly connected with the time in which the management recognizes the crisis
and initiates counteractions (Crone & Werner, 2012). To have the possibility of

17
seeing the symptoms at an early stage, the company has to have an early
warning system, which includes Controlling and Quality Management as
Management System.
The survey by Roland Berger, conducted in 2003, shows that in 2001 around
80%, and in 2003 around 70%, of the companies that got into a crisis, identified
the crisis for the first time in the acute stage of a liquidity crisis, which is very late
and costs valuable time (Welsch, 2010).
The beginning of a crisis lies a long time before the illiquidity - Crone & Werner
(2012) describe in the book “Modernes Sanierungsmanagement” six parts of
crisis: stakeholder, strategy, product, success, liquidity crisis and, finally,
insolvency.
A successful leader has to know the company processes, constantly develop new
goals, innovate, make sure that the organization is still true to its core values, and
continues to nurture a culture that fosters continual learning (Frontiera & Leidl,
2012). To have the possibility of overseeing the whole area he has to have an
appropriate management system.
Most of the concepts designed to identify company risk or crisis are focused either
on quantitative, such as the operative EWS of Krystek & Müller-Stewens (1993)
or Altman`s Z-Score model (Altman, 1968), developed further by others
(Kurschus et al., 2015) and also the Fulmer`s H-Score model (Fulmer et al., 1984)
etc., or qualitative factors, such as the “weak signals” of Ansoff (1976) or
Argenti`s A-model (Kurschus et al., 2015). Several authors point out the need for
a more holistic approach including both quantitative and qualitative factors
(Bedenik et al., 2012; Purvinis et al., 2005; Kurschus et al., 2015). This is the
central rationale of this work: to develop an approach that entails an optimum
consideration of both quantitative and qualitative factors.
1.1.1 Relevance of the research
An EWS can be defined as an information system designed to warn companies
when problems arise or can arise (Löhneysen, 1982). Crönetz et al. (2009) state
that EWS success factors comprise issues related to: market, company
18
background/identity, continuous improvement, resources, structure, processes,
and competence – these factors are regulated in ISO 9001 (Hinsch, 2014) and
can be monitored by a quality management system (QMS). However, additional
factors that are related to corporate aims and strategy need to be included and
can be monitored by a CO system.
This research, therefore, draws on the combination of an existing QMS approach
(Foster, 2013), where the process is driven by customer expectation (Evans,
2014) alongside consideration and integration with a controlling system. As stated
by Bruhn (2001), QM and CO are taken together to form a more holistic EWS
than if a single system were to be used in isolation.
Companies within the food production industry need to demonstrate high quality,
as its lack of quality management can lead to serious problems (Petersen &
Nüssel, 2013); thus most have a quality management system (QMS) based on
ISO 9001ff (Ruderer, 2009). This need and the evident use of QMS make the
sector appropriate to the needs of this research.
1.1.2 Previous work within this topic
“In the context of early warning German literature first differentiates between the
anticipation of risks and chances for the own organization and for other
organizations“ (Kirschkamp, 2007, p. 7). Table 1 provides a summary of recent
examples of EWS and regulations, dependent on their time of occurrence.

19
Table 1 Previous work within this topic
Source: Compiled by author
The four generations of EWS differentiate between early warning methods by
their date of introduction. The first generation was developed in 1973 and makes
projections on the basis of past data (Hauser, 1989; Schulenburg, 2008). The
second started in 1977 and tries to detect potential risks and chances by means
of indicators (Schulenburg, 2008; Krystek & Müller-Stewens, 1993). The third
generation began at the end of the 1970s by including the strategic early
recognition of soft signals, strategic radar, potential chances and risks (Welsch,
2010; Krystek & Müller-Stewens, 1993). The last generation is characterized by
networked thinking and helps to detect risks and chances, as well as a holistic
approach of ‘operative’ and ‘strategic’ Early Enlightenment (Schulenburg, 2008;
Krystek et al., 2007; Krystek & Müller-Stewens, 1993). The term “EWS” will be
used as a synonym, as differentiation between Early Warning, Early Recognition
and Early Enlightenment, is not really clearly delineated (Hauff, 2010).
Year Description Source
1970 - 19751st generation of the EWS: focussing on handling threats by operative earlywarning, finance indicators, expansion and risks.
Hauser, 1989 Schulenburg, 2008
1975 - 19802nd generation of the EWS: operative early recognition indicators andpotential chances and risks.
Schulenburg, 2008 Krystek & Müller-Stewens, 1993
1980 - 19903rd generation of the EWS: strategic early recognition of soft signals,strategic radar, potential chances and riks.
Welsch, 2010 Krystek & Müller-Stewens, 1993
1990 - present4th generation of the EWS: strategic and operative early clarification,networking thinking, chances, risks and action.
Schulenburg, 2008 Krystek et al., 2007 Krystek & Müller-Stewens, 1993
1998KonTraG (law for control and transparency in public limited companies –concern big companies!), requires a holistic approach for EWS, where itexplicitly warns against only focussing on one area, such as for e.g. finance.
Woll, 2007
2007 BASEL II: requirement of an EWS.Woll, 2007 Ruderer, 2009
2015 ISO 9001-2015, requires a risk oriented Quality Management System. DIN EN ISO, 2015
Four generations of Early Warning System (EWS)
Regulations
20
It is evident that regulations have influenced EWSs (Woll, 2007), and it is
becoming apparent that such rules now explicitly require an EWS to be in place;
in particular this is evident through the recent ISO 9001:2015 regulations, which
require a risk-oriented Quality Management System (Hinsch, 2014). Furthermore,
BASEL II, which regulates finance and banking internationally, requires an EWS
(Woll, 2007; Ruderer, 2009). KonTraG developed in 1998, as a law for control
and transparency in public limited companies, and so is only concerned with big
companies, requires a holistic approach for EWS, where it explicitly warns against
only focussing on one area, such as e.g. finance (Woll, 2007).
1.1.3 Contribution
Following on from the literature review in chapter two, the development of EWS
has grown historically and has been formulated in more detail and partly adapted
to the circumstances. With the awareness that risks exist for companies and that
they can mostly be detected even at an early stage in order to initiate adequate
countermeasures, it was seen that it was necessary to come to a very detailed
division between operational and strategic, qualitative and quantitative, internal
and external areas and EWSs. Numerous tools, concepts and methods have also
been developed in the literature, in order to identify individual risks and risk areas
within a company, branch, etc. (Ruderer, 2009), but a holistic EWS, effected by
including quantitative (operative) and qualitative (strategic) factors is missing.
This is the main contribution of this study, based on the identified gap, in
developing a holistic EWS by the combination of explored tools, as shown in
chapter six. Furthermore, based on the answers to the research questions, a
contribution to knowledge is also effected by identifying the requirements for a
successful EWS and the exploration of appropriate QM and CO tools for an EWS
which matches those identified requirements and are appropriate for the
recognition of the risk factors of company failure. These contributions will be now
described in detail.
The first contribution to knowledge was achieved through the first phase of this
research, by the identification of requirements for a successful EWS from the
literature review, followed by the semi-structured interview. The findings from the

21
theoretical and empirical area were compared, categorized and combined to form
a unified list. The outcome helps to establish a basis from both points of view,
theoretical and practical, for requirements which should be considered during the
development of an EWS.
The second contribution to knowledge arises from the second phase of this
research, where the unified list of the requirements from phase one, was used as
a starting point for the exploration of the CO and QM tools, appropriate for the
recognition of the risk factors of company failure, from the literature review and
also from the semi-structured interview. The findings from both sources were also
defined, categorized, compared and unified for the subsequent development of
an EWS. The aggregated results from the literature and interviews can be used
for integration into an existing system or combined to form holistic EWS, which
are limited to German food production industry.
The third and main contribution was achieved through the sequential use of the
data from the research phases by consideration of the requirements for an EWS,
the inclusion and combination of explored CO and QM tools, which then proposes
a holistic EWS for German food production industry.
The final contribution to theory within this research lies in the suggestion of its
use as a holistic framework. This framework is developed through the synthesis
of existing theoretical research on early recognition and CO and QM tools, with
evidence gathered from the empirical study within the SME, in order to review
how it could be implemented and used in practice.
There is no evidence in the literature from previous theoretical or empirical
studies of the existence of a holistic EWS which includes CO and QM tools. The
framework matches the phases of ISO 31000 (ISO, 2009) by starting from the
‘Determination of Context’, through ‘Methods of Risk Identification’, to ‘Methods
for Risk Monitoring and Review’.
Moreover, it fulfills the requirements of several authors, who point out the need
for a more holistic approach including both quantitative (operative) and qualitative
(strategic) factors (Bedenik et al., 2012; Purvinis et al., 2005; Kurschus et al.,
2015).

22
1.2 Research Questions
1. What are the requirements for a successful early warning system
(EWS) with respect to company crisis in SMEs within the food
production industry, as identified by turnaround / interim managers?
2. Which controlling (CO) and quality management (QM) tools are
appropriate for a successful EWS for SMEs in the food production
industry and how can they be combined to form an integrated
framework?
3. Which tools can be used to anticipate and define a potential company
crisis in SMEs in the food production industry?
1.3 Research Objectives
The objectives are:
1. to identify the requirements for EWSs in SMEs in the food production
industry
2. to explore CO and QM tools appropriate for an EWS for a German
food production SME and to combine them to form an integrated
framework.
3. to analyze implementation issues and considerations relevant to
EWS tools in the food production SME context.
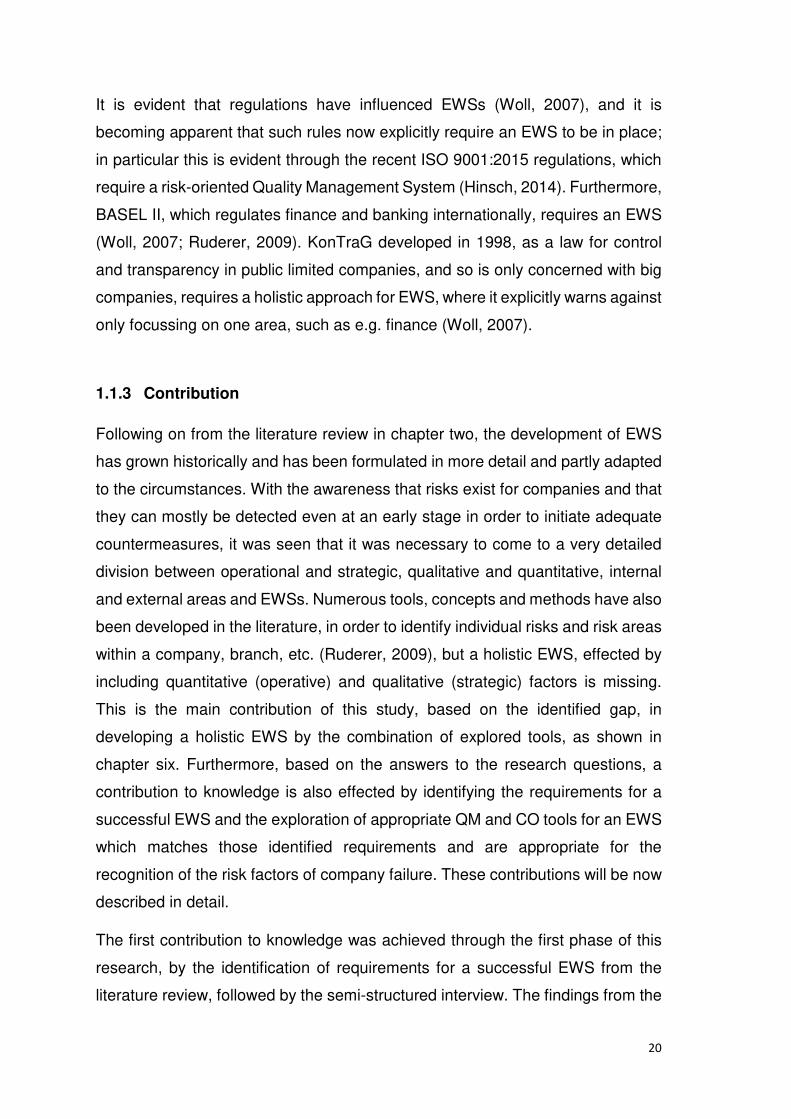
1.4 Research Process
“Iterative Research is a methodology that focusses on multiple, short cycles
between the field, development, and lab testing” (Pratt, 2009, p. 1). For Ryan
(2016) the iterative design cycle consists of EXPLORE, CREATE and
EVALUATE components. Pappas (2016), in contrast, states that iterative design
involves developing and revising each element of a project before moving onto
the next. However, this research process, shown in figure 1, starts with the Initial
Literature Review. Afterwards, during Phase I, the requirements for EWSs are
23
identified, followed by Phase II where CO & QM tools are explored, according to
the requirements, and then combined to form a holistic EWS. Furthermore, during
Phase III, the practical and integrative approach of the developed EWS is
analyzed by two Case Studies and, finally, refined accordingly during Phase IV.
Figure 1 Iterative Research Process
Source: own illustration
Figure 1 illustrates the iterations and their relationship to each other. As the
diagram shows, after identification of the philosophical stance taken in the

24
development of EWSs, the first phase, by identification of requirements, is then
used to help to explore CO & QM tools during the second phase. These tools
satisfy the requirements of the first phase and are also appropriate for the
identification of risks which cause failure. A solution to the selected problem
during the initial literature review, is the combination of the tools to form a model
(holistic EWS) which, during the third phase is then analyzed for practical
implementation and finally, during the fourth phase, is appropriately refined.
The stages and their intended outcomes, as well as the need for the chosen
iterative research, will be now explained in more detail. The research starts in
Chapter Two with the initial literature review, shown in figure 2 below, where the
aim is to capture the theoretical and empirical aspects of the topic, as well as to
indicate what gaps in knowledge exist and which of these gaps this work aims to
fill. The intended Research Outcome of this chapter was to make explicit the
philosophical stance taken in the development of the early warning system.

25
Figure 2 Initial Literature Review and intended Research Outcome
Source: own illustration
The main outcome is that most of the concepts designed to identify company risk
or crisis are focused either on quantitative, such as the operative EWS of Krystek
& Müller-Stewens (1993) or Altman`s Z-Score model (Altman, 1968), developed
further by others (Kurschus et al., 2015) and also the Fulmer`s H-Score model
(Fulmer et al., 1984) etc., or qualitative, such as the “weak signals” of Ansoff
(1976) or Argenti`s A-model (Kurschus et al., 2015). Several authors point out the
need for a more holistic approach including both quantitative and qualitative
factors (Bedenik et al., 2012; Purvinis et al., 2005; Kurschus et al., 2015). This is

26
the central rationale of this work: to develop an approach that entails an optimum
consideration of both quantitative (operative) and qualitative (strategic) factors.
However, as the existing literature is very limited to the general, and thus
relatively superficial, representation and, as the concepts were developed for the
application to many, if not all, types of enterprises and companies, it is really not
possible to fulfill the requirements of a holistic system, not even by linking already
existing ‘strategic’ and ‘operative’ EWSs, especially when also trying to cover the
practical aspect. This lack of depth in the descriptions and implementation
approaches is one gap that ultimately leaves a lot of scope for individual
interpretation or even intuition and is difficult to close for the SME. I would like to
close this gap in this work, not by giving a "handbook" but at least a guide.
The bulk and generality of the literature shows that most criteria are quite strictly
separated from one another. Among the most elementary separations in these
focus-limited EWSs are, from my point of view:
- Theoretical and practical
- Operational and strategic
- Quantitative and qualitative
For a holistic and applicable EWS, however, it is impossible to avoid combining
these sub-areas with one another, and even fusing them, so that a smooth
transition from the strategic to operative area, including both quantitative and
qualitative aspects, becomes possible. It is precisely this interplay and the linking
of the quantitative and qualitative areas that are particularly important to
emphasize. In the literature, these criteria are strictly and stringently assigned to
operational (quantitative) and strategic (qualitative). It is a fact, however, that
these factors are inseparable because (almost) every quality can be quantified
and (almost) every quantity describes a certain quality. The qualitative or
quantitative expression is therefore used, as quality can sometimes only be
expressed by several quantities, and vice versa.
To be able to start the development of a holistic EWS, where all relevant factors
and their interdependencies are able to be identified and dealt with (Kirschkamp,

27
2007), the requirements of an EWS will be identified, by answering the first
research question:
1. What are the requirements for a successful early warning system
(EWS) with respect to company crisis in SMEs within the food
production industry, as identified by turnaround / interim managers?
Figure 3 Identification of requirement and the intended outcome
Source: own illustration

28
This iteration is to make sure, that all relevant factors which build the
basis/framework for an EWS are considered in the next research step.
The first phase, shown in figure 3, starts in Chapter Four with identification of
the requirements for a successful EWS from literature review, followed by the
semi-structured interview of three turnaround/interim management experts. The
findings from the theoretical and empirical area are compared, categorized and
combined to form a unified list. The outcome helps the author establish a
framework from both points of view, theoretical and practical, for the requirements
to be considered during the next stage, as shown in figure 4, of the exploration of
CO and QM tools appropriate for an EWS for the German food production
industry.

29
Figure 4 Exploration of CO and QM tools and the intended outcome
Source: own illustration
When dividing the EWS into the two major areas of "scanning" and "monitoring",
according to Ansoff (1976), whereas the literature mostly covers the "monitoring"
area to a large extent, if not completely. By being able to elaborate on the area
of "scanning" in the form of a guideline approach, we find a gap in the current
literature during the concepts for the use of tools for EWS. This is described in
the literature as a complex area with a diversity of different risk areas, which
reflects the quite incomplete elaboration. This work tries to address this gap by
the use of PESTLE, named by Stewart & Rogers (2012) as a key tool for scanning

30
of the environment. Furthermore, a tool for the link from strategic to operative,
which this work intends to solve by BSC, is completely missing in the previous
concepts. Even Hammer (1998) himself names this as the most difficult part. This
is, however, the main criticism of Concept of Hammer (1998), even though
Bertram (1993) states that Hammer's concept is one of the most far-reaching
considered, due to its detailed classifications and control function, as his concept
covers most known requirements of the literature. However, the tools PESTLE
and BSC, are only two of those tools which this work intends to include in the
model as new elements. Although a part of the literature already contains
chapters devoted to the tools and methods, these are often just listed and only
briefly described. The precise application areas and possibilities for the
respective instruments are missing. This fact, however, is understandable
because of the focus on the "generality" of the literature as mentioned above.
However, the aim of this work is the use for a smaller range of enterprises, where
I will close this existing gap by exploring more closely the most important tools
and methods and how they can be integrated into the construct of an EWS. To
be able to fulfill this aim, as stated by Bruhn (2001), QM and CO are taken
together to form a more holistic EWS and it is necessary to answer the second
research question:
2. Which controlling (CO) and quality management (QM) tools are
appropriate for a successful EWS for SMEs in the food production
industry and how can they be combined to form an integrated
framework?
For this purpose, I will give an overview of the instruments that can be used
mainly in the German food production SMEs, which risk areas can be covered
and scanned, and then elaborate and verify the best-practice elements, including
the evidence from the interviews conducted.
If we now take a closer look at the gaps presented individually, it becomes clear
that "black-and-white thinking" prevails in the literature. Attempts were made to
divide the hard-to-grasp issue of an EWS into as many individual parts as
possible. These, however, cannot, and do not, have smooth separation points,
and an attempt was made to make these sub-areas individually transparent,

31
comprehensible and applicable. This is the correct approach in a complex
situation, but the parts have to be reassembled afterwards, so that the end
product is again interlocked and practicable as, otherwise, it becomes a non-
applicable theoretical object. I intend to create a combination of the mostly
theoretically described parts within a certain kind of enterprise, with an equally
detailed practical recommendation. This is based on the two main areas of CO
and QMS and is supported by a pool of common tools and methods that are
relevant for this branch of business, which, as shown in figure 5, combine, during
Chapter Six (Phase II continued), to form a practically applicable and effective
EWS.

32
Figure 5 Development of a holistic EWS
Source: own illustration
Following this, Popper`s approach is used insofar as he suggests examining
interview data informally and using it to derive conjectures (Wood & Welch, 2010).
This links with the next step of Case Study, which is then used for analysing the
appropriate implementation and use in SMEs as best-practice elements designed
by Experts and literature review.
To be able to cover also the practical and integrative approach, it is necessary to
address the third question:

33
3. Which tools can be used to anticipate and define a potential company
crisis in SMEs in the food production industry?
During phase three in Chapter Seven, as shown in the figure 6, the developed
model is presented to the companies with the aim of analyzing the practical and
integrative approach in SMEs, as well as for refinement. The two studies take
place within two separate and independent medium-size companies. Both
companies are German producers of food with QM and CO departments.
Figure 6 Case Study Approach
Source: own illustration
34
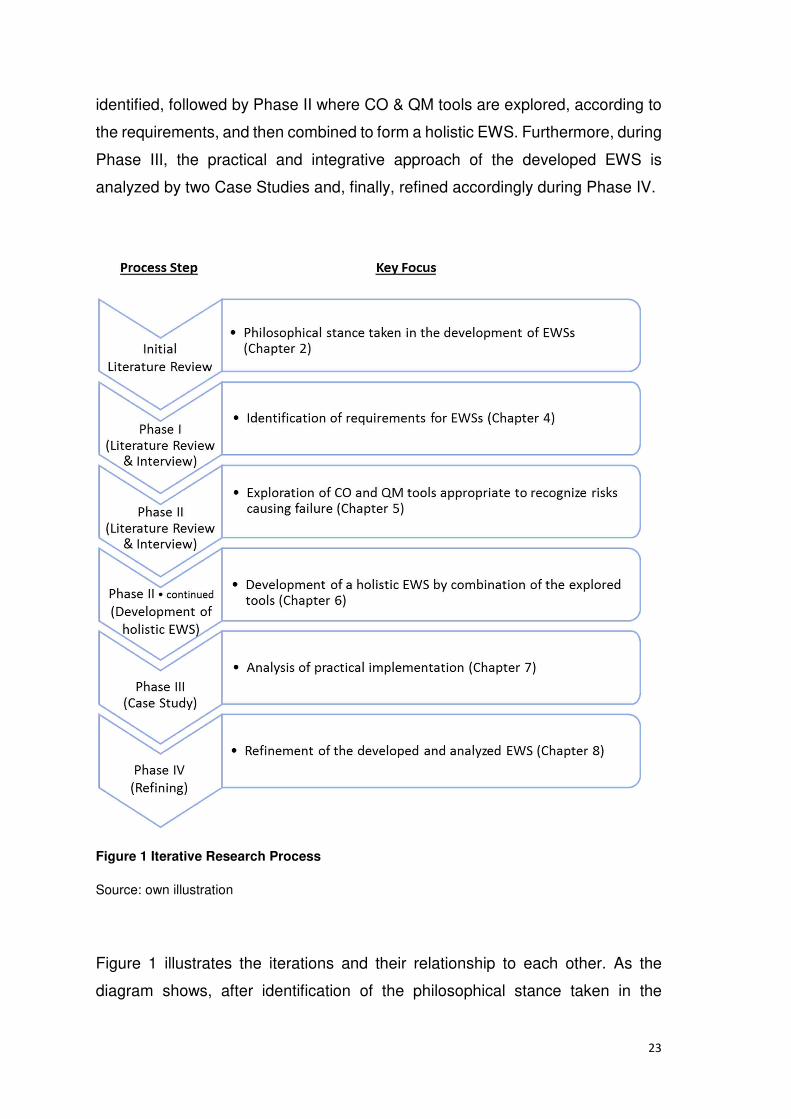
Additionally, Yin (2009) recommends further investigation and refinement of best
practices. Consequently, the aggregated results of the interviews from the Case
Studies, as shown in figure 7, were integrated during phase four in Chapter
Eight, into the corresponding model by analytical consideration of the theoretical
basis and integration with the statements from practice. For this reason, the
technical, financial, organizational, and operational views were taken into
account.
Figure 7 Refining
Source: Own illustration

35
Finally, this approach enabled the verification of a practicable EWS, which is
compared, validated and refined appropriately following suggestions for the
implications of its use.
1.5 Thesis Structure
The thesis structure is provided as an overview and includes a brief description
of every section, including all of its chapters. This thesis starts with the
introduction chapter, followed by the literature review. The next chapter includes
methodology, which describes how the study is performed. The fourth chapter
shows the identified requirements for an EWS, followed by the exploration of CO
& QM tools, appropriate for recognizing risk factors of company failure. The
subsequent chapter details the development of the EWS, which is analysed for
practical use during the case study in chapter seven. The eighth chapter refines
the developed model and leads to the ninth and final chapter which is the
conclusion. Each of these chapters is shown in figure 2 and described below.

36
Figure 8 Research process and thesis structure
Source: Own illustration

37
Chapter One: Introduction
The first chapter outlines the research problem, research questions and
objectives, research phases and their intended outcome, followed by the thesis
structure. The thesis structure includes a map of the research process, which
guides the reader through the research phases and their treatment in the thesis.
Furthermore, it discusses the contribution to knowledge and practice, as well as
provides background and rationale for the work.
Literature Review (Chapters Two, Four and Five)
Three chapters within the current study constitute the literature review. Chapter
Two presents the initial analysis of the comprehensive literature review to
facilitate the understanding of the previous studies of early risk and crisis
recognition, which makes explicit the philosophical stance taken in the
development of the Early Warning System. This captures both, the theoretical
and empirical aspects of the topic. It starts with the development stages of EWS
in the Business Economics literature, its forms of appearance, followed by the
description of different models and finishing with EWS approaches. In addition, it
includes a synthesis section, which demonstrates to what extent there is an
agreement between workers and to what extent there is disagreement,
summarized in a table with key literature sources and the contributions they have
made. Finally, the literature review finishes with an indication of what gaps in
knowledge exist and which of these gaps this work aims to fill. Chapter Four
(Phase I) starts with the review of requirements for a successful EWS from
literature, where the main points are described and afterwards contrast with the
data from the interview. Chapter Five (Phase II) of the literature review extends
the previous chapter exploring CO and QM tools, suitable for recognizing risk
factors of business failure, which matches the requirements from the previous
chapter.
Semi-Structured-Interview (Chapters Four and Five)
Two chapters in this study use the semi-structured interview. Chapter Four
(Phase I) starts with the overview of requirements for a successful EWS from

38
literature, followed by the findings from interviews, which are compared with data
from the literature review. Chapter Five (Phase II) shows and explains CO and
QM tools from the literature review, suitable for recognizing risk factors of
business failure. This is followed by the data from interviews and an unified list of
the requirements, which were identified in the previous chapter. The findings were
compared with data from the literature review.
Chapter Three: Methodology
The research methodology chapter provides an overview of how the research
paradigm is described in relation to its ontology, epistemology, the selected
research approach, research strategy employed and a justification of these
choices. This is followed by the description of methods by which data were
collected and analysed. The final part of this chapter describes the problems
arising from bias and how it was attempted to avoid them.
Chapter Six: Development of EWS (Phase II continued)
This section on the elaboration of an EWS approach is divided into three stages:
determination of the context, followed by risk identification and finished by risk
monitoring and review. Each stage examines the recommended best-practice
tools by an explanation of their uses and aims. The development of the EWS is
based on the findings, worked out through theoretical results and interviews,
conducted during this work.
Chapter Seven: Case studies (Phase III)
The EWS approach developed in Chapter Six was validated by two case studies.
Chapter Seven starts with the description of the appropriateness of case study
for this research and finishes with the results of the interviews obtained by the
case study.
39
Chapter Eight: Refining (Phase IV)
Chapter Eight refines the EWS approach by integration of the aggregated results
from the interviews into the corresponding model by analysis, consideration of
the theoretical basis and recognition of the statements from practice. Technical,
financial, organizational, and operational viewpoints were taken into account.
Chapter Nine: Conclusion
This chapter discusses the answers to the research questions and summarizes
the empirical and literature review findings. It justifies the approach of EWS and
explains the limitations of the present study, as well as giving suggestions for
future research.

40
2 Definition of Terms and Literature Review
2.1 Introduction
This chapter presents a definition of terms relevant to this study and then moves
on to the critical analysis of the literature review to facilitate the understanding of
the previous studies of early risk and crisis recognition. The aim is to assist in
identifying appropriate CO and QM tools for a holistic EWS approach.
2.2 Definitions
The aim of this chapter is the definition of terms. The defined terms below relate
to the specific aims and problems of this work. The definitions originate from the
literature, as well as from the author when no suitable source was found.
2.2.1 EWS
An Early Warning System (EWS) can be defined as an information system
designed to warn companies when problems arise (Löhneysen, 1982) where
companies have to initiate counteractions (Götze & Mikus, 2000). Kästner (2012)
adds that an EWS should promptly predict factors, which are essential for the
development of the company's success. The aim of an EWS is to identify
risks/crisis in real time, where the company has enough time to handle them
(Löhneysen, 1982). Trustorff (2012), in contrast, states that an EWS has to
recognize the risk in the formation phase.
Ruderer (2009) goes one step further and claims that an EWS has, by exploitation
of available information as early as possible, precisely and comprehensibly to
predict the relevant variables of the company. Bedenik et al. (2012, p. 672) sum
up by saying that: "The role of early warning systems as an instrument for crisis
aversion is in: revealing weak signals, transferring relevant information about
environmental changes, prevention of business crisis, and constructing a creative
base for timely and appropriate response".

41
However, EWS is a valuable tool for risk identification, which informs its user in
time about latent (which means invisible but existing) risks, thus optimizing
company control (Romeike & Hager, 2013). It makes it possible for the companies
to gain valuable time for an adequate response to imminent dangers or for
explaining potential opportunities (Ruderer, 2009). Early warning can be used as
a way of thinking, which accepts the decisions and the possibilities of changes as
well as the uncertainties in the company and the environment (Kloss, 1984). The
EWS is appropriate if it is able to recognize the risks both correctly and early
enough (Hillebrand, 2005). Kloss (1984) states that both the environment and
the company give out recognizable signs, which should be noticed.
Crisis identification and risk identification, according to Reimer & Fiege (2009),
will be used in this work to mean the same, as the difference is not clearly defined
in the literature. Ruderer (2009) assigns the EWS to the risk identification process
phase and also includes the risk handling process for the reason that after the
prediction and clarification activity it also initiates counteraction by the decision
makers. Crönetz et al. (2009) state that the EWS is the initial form of risk
identification. The phase of risk identification includes the collection of actual and
future (potential and latent) risks, which is the most important stage of risk
management, as the result of this stage is essential for all the following steps
(Krystek & Fiege, 2015).
Breitkreuz & Lange (2011), in contrast, argued that EWS is a major tool of crisis
management. EWS is a "Before Fact Approach", and crisis management is an
"After Fact Approach" (Wiedmann, 1984). Crönetz et al. (2009) add that EWS
works as a preventative in crisis avoidance whereas crisis management serves
to overcome an already existing crisis. Krystek (2015) explains it in more detail,
naming the avoidance of crisis as Active Crisis Management, subdivided into
Accrual and Preventive Crisis Management, and the handling of crisis as
Reactive Crisis Management, which is subdivided into Repulsive and Liquidative
Crisis Management – which will be discussed in Chapter 2.3.
However, the main point here is to identify the correct problem, especially with
the aim that the EWS can be used by SMEs. "In the SME sector, the company's
crisis identification is specific because of the nature of SME business

42
management which creates the strong reliance of business results on human
resources and environmental factors" (Kurschus et al., 2015, p. 152).
Furthermore, the information search and information processing expenditure is
enormous, so that it is not manageable for SMEs for the reason of lack of
sufficient technological and human resources, to overview the whole area, in
contrast to big companies (Schlüter, 2004). The management has to start with
the company policy and strategic plan, reducing complexity, so that the
exploration of information can be found close to the symptoms, without an
endless search for alternative problems (Kelders, 1996). It means that EWS
should be able to recognize risks and an ongoing crisis (Reimer & Fiege, 2009).
2.2.2 Risk
“Risks are events with the potential to have a significant negative impact on the
organization“ (Hopkin, 2013, p. 1). Schaper (2010) adds that risk is an economic
action combined with risk of loss. The standard dictionary definition, in contrast,
gives “risk” as an opportunity, where something unpleasant may happen, which
gives rise to further questions associated with the opportunities (or likelihood) of
the event occurring and the nature of the unpleasant outcomes (impact or
consequences) (Hopkin, 2013).
ISO 31000 explains risk as “Risk: effect of uncertainty on objectives
- NOTE 1: An effect is a deviation from the expected – positive and/or
negative.
- NOTE 2: Objectives can have different aspects such as financial, health
and safety, and environmental goals) and can apply at different levels
(such as strategic, organization-wide, project, product, and process).
- NOTE 3: Risk is often characterized by reference to potential events,
consequences, or a combination of these.
- NOTE 4: Risk is often expressed in terms of a combination of the
consequences of an event (including changes in circumstances) and the
associated likelihood of occurrence.

43
- NOTE 5: Uncertainty is the state, even partial, of deficiency of information
related to understanding or knowledge of an event, its consequence, or
likelihood” (ISO, 2009, p. 1-2).
The Oxford English Dictionary (2016) definition of ‘risk’ is: “the possibility that
something unpleasant or unwelcome will happen” and the definition of ‘at risk’ is
‘exposed to danger’. In this context, ‘risk’ is used to signify negative
consequences (Hopkin, 2013). In addition, “the Concise Oxford English
Dictionary (2011) defines ‘risk’ as, ‘hazard a chance of bad consequences, loss
or exposure to mischance” (McNeil et al., 2015, p. 3).
The Committee of Sponsoring Organizations of the Treadway Commission
(COSO) describes ‘risk’ as “Internal and external events affecting achievement of
an entity`s objectives which must be identified, distinguishing between risks and
opportunities” (COSO, 2014).
Allenspach (2006) describes ‘risk' as the possibility that, in the context of goal
achievement processes – due to success factors as interference processes – the
result of the underlying expectations deviate. The success factors of a company
shown by Crönetz et al., (2009) comprise market, business background/identity,
continuous improvement, resource, structure, processes, competence, aims and
strategy, which all have to be monitored.
2.2.3 Concept of risk
The risk in an organizational context is usually defined as anything that can have
a significant impact on the fulfillment of corporate objectives, which can also be
an opportunity (Hopkin, 2013). Krystek et al., (2007) describe risk as a companion
for each business activity.
“However, it is helpful to clarify two issues: 1) whether risk can be attached to
features of the organization other than corporate objectives; and 2) whether risk
should always be considered as a negative” (Hopkin, 2013, p. 15). To bring clarity
to the purpose of the initiative, the word ‘risk’ is used, throughout this work, to
indicate negative events and/or those events with an unacceptable level of
uncertainty.

44
2.2.4 Types, Stages, and Process of Crisis
Company Crisis is a serious problem which often gets ignored. It can be
described as an economic difficulty or as a threat to the company which will reach
unto the border of its existence (Krystek, 1987). The Strategy crisis e. g. can be
seen as the lack of competitiveness, market share, unclear market and product
position (Mayer, 2008). The Profit Crisis follows the product and selling crisis
when the countermeasures have not been taken (Crone & Werner, 2012) and in
the Liquidity Crisis stage, the company suffers from insufficient Working-Capital
Management, the complexity of finance structure as well as the relation between
equity and debt capital (Hohlberger & Damlachi, 2010). In this stage, Crisis
Management will still be effected out of court.
The final stage of a crisis is Insolvency, which involves judicial proceedings
(Crone & Werner, 2012). The obligation in Germany for an insolvency form is,
according to §§ 17 – 19 InsO, when the Company is Illiquid, Illiquidity is
threatening, or the organization is deeply in debt (InsO, 2012).
Crisis is a process, and knowledge about the stages helps recognition of the signs
and facilitates their better handling in an appropriate manner, which can be either
active or reactive (Krystek et al., 2007). The crisis process can be of varying
length, where extreme forms of long-lasting, only gradually accelerating crisis
processes are found as well as abruptly - occurring crisis processes, with rapid
acceleration and extremely short processing time (Löhneysen, 1982). Krystek et
al. (2007) state that for the determination of appropriate starting points for crisis
prevention and crisis management, a subdivision of the crisis process into
different phases can and must be made.
The beginning of the crisis can be described as a combination of the efficiency
factors, which are not workable anymore for the reason that one or more factors
are no longer available (Bratschitsch & Schnellinger, 1981). It could be calculable
as well as incalculable, differing in the reaction time during which the
management has the opportunity to react (Krystek et al., 2007). The calculable
crisis sends warning signals, and the organization would be well advised to react
immediately to the crisis with management and communication process
(Löhneysen, 1982).

45
The incalculable crisis, in contrast, does not send any warning signals and the
company has to conduct simulation scenarios for the recognition of them
(Reineke, 1997). The establishment, growth, or maturity of crises are parts of the
Life Cycle Stage and can cause suffering within the company if the counteractions
do not work - it could be the beginning of stagnation, shrinking, or growth-crisis,
which attack the development of a Company (Hohlberger & Damlachi, 2010).
Furthermore, the selling-, management-, purchasing-, technological- or
organizational crisis brings about the imbalance of the company and leads, at the
end, to failure (Ackemann, 1986). To get to know the signals of the failure, it is
important to know about the CRISIS STAGES.
The crisis stage marks the degree of the threat to the company, and it is
indisputable that a crisis is at hand, when the company is over-indebted or illiquid
and for this reason has to file for insolvency (Crone & Werner, 2012). This part is
clearly defined by law (Hauschildt & Leker, 2000), but the aim of this thesis is to
recognize the risks before a crisis arises and if it does so, then it is better to realize
the crisis at the beginning of the process, which begins with the potential crisis
(shown in the figure below), where the company does not really realize that it has
a problem (Krystek et al., 2007).

46
Figure 9 Crisis Stages and Crisis Management
Source: Welsch (2010)
The reason for this stage is that the symptoms of a crisis are difficult to see (Crone
& Werner, 2012). This means that the company has to analyze the state of their
health continuously (Krystek et al., 2007).
When the company can clearly recognize a long-standing crisis, it is already
acute. The target is to counteract this with proper measurements (Ackemann,
1986) before the manifest crisis arises, wherein the impact of time on the
progression of the crisis will be shorter and the need for avoidance of insolvency
greater (Hauschildt & Leker, 2000). Following this stage, the decision about asset
stripping or continuation of the company will be made (Leker, 1993).
The avoidance of crisis can be called Active Crisis Management and subdivided
into Accrual and Preventive Crisis Management (Krystek et al., 2007). Accrual
Crisis Management has as reference point the Potential Crisis, during which the
aim is to avoid the onset of a crisis by specific prognosis (Leker, 1993). At the
stage of Latent Crisis, the company should recognize the crisis in time and initiate
appropriate measurements for Avoidance of Crisis (Krystek et al., 2007).

47
The handling of crisis will be called Reactive Crisis Management, subdivided into
Repulsive and Liquidative Crisis Management (Leker, 1993). At the
acute/controllable crisis stage, the Repulsive Crisis Management is responsible
for taking all actions to effect Turnaround (Crone & Werner, 2012). The
acute/uncontrollable crisis is no longer manageable and the company should be
liquidated to achieve the best creditor satisfaction (Krystek et al., 2007). Strategic,
Profit and Liquidity Crisis, as well as Insolvency, have already been discussed
above.
However, the aim of this thesis is to recognize the risks, explained in the above
chapter, before a crisis arises, and if it does, then it is important to identify a crisis
at the beginning of the process e. g. during the potential crisis (shown in figure
1 above), where the company usually has valuable time for counteraction
(Krystek et al., 2007).
2.2.5 Quality Management
The success of many German Companies is due to the quality of their products
and services. Experience shows that these are companies which set quality as a
company aim as well as the strategy and philosophy, which is led by employees
and management (Brüggemann & Bremer, 2012).
Quality Management Systems began in 1987 with DIN EN ISO 9000 ff. The
important years were between 1994 and 1996 when many companies
implemented their first QM-System. Today we have a lot of different norms
relating to specific industry sector, such as Automotive, Medical Technology,
Telecommunication, etc. (DIN, 1997).
Most businesses have a top-down structure. Individual divisions or departments
operate in parallel and are responsible for distinct functions like procurement and
production. The main focus is neither on customers nor orders, but on a specific
function (Faulhaber & Landwehr, 2006).
Welsch (2010) analyses three companies in difficulty in the form of a case study
and arrives at the conclusion that they have a non-transparent and inadequate
structure of processes, top-down communication, authoritarian leadership,

48
centralised structure of decisions and low experience of change, which can be
related to human error, irrespective of the industry.
Krystek et al. (2007) suggest motivating employees in the style of an evangelist
for alertness to crises, willingness to change and to think of the unimaginable
such as “what if …”. The requirement of Krystek & Müller-Stewens (1993) for
strategic forecasting is its spread throughout the whole company and not its
delegation to a few experts. The influence and control of processes like Quality
Management make the whole overview of the company possible (Wolf, 1996).
IBM has proved that by Business Reengineering, where the areas of costs,
quality, service and time were improved, they recognized that in many areas the
structure was too old and inapplicable (Weber, 1995) and they had to rethink the
strategies and reinvent the operating models before debilitating stalls set in
(Nunes & Breene, 2011). Brüggemann & Bremer (2012) add that the above
components are regulated in ISO 9001 and include Continuous improvement;
Internal customer-contractor-relationship; Process-driven organization and
working structure; Involvement and motivation of all employees.
ISO is the International Standards Organisation. It established a worldwide basis,
ISO 9001, that focuses on the documentation of a company’s quality system.
Therefore companies have to have a series of manuals about the structure and
implementation of the quality system (Brüggemann & Bremer, 2012).
As soon as the quality system is documented, the company is registered as a
company with a working quality system in place (DIN, 1997). This helps to
facilitate trade because of the Supplier’s conformance. ISO 9001 is one of the
most significant and popular Quality Management Systems (more than 40,000
companies are registered with this standard) (Bruhn, 2011).
To satisfy ISO 9001, a company has to get their processes under control; they
have to plan them, follow them, ensure that they are effective, correct them if they
are deficient and constantly improve the existing processes (Tricker, 2014). The
requirements of the main points for ISO 9001:2015 are in the following areas:
- Quality Management System as process approach
- Consideration of Quality Aims and Policy

49
- Strategy and Stakeholder Orientation
- Resource Management and Knowledge Management
- Customer Approach
- Product Development and Realization
- Measurement Analysis, Risk Prevention, and Improvement (Hinsch,
2014).
In general, it can be said that Quality Management has the following stated
principles, which a company has to prove and improve:
- The company has to focus on the customer
- The company is led by a leadership which involves people
- The management has to follow a systems approach while the company
has to apply the process approach and the decision making the factual
approach
- One of the most important principles is the continual improvement and last
but not least the mutually beneficial supplier relationship (Tricker, 2014).
The advantage of a QM-System is that you have a clearly defined process flow,
clear company structures, high transparency, increased efficiency, traceability of
products, sustainable quality consciousness, better image, reduction of mistakes
and cost cutting (Seghezzi et al., 2007). QMS is a Management System for the
conduct and control of a company in terms of quality, which in turn, determines
the policy and aims as well as the achievement of those aims (Giebel, 2011). The
ISO 9001 is appropriate as the basis for using the company flow chart for
integration of additional management systems (Wagner & Käfer, 2010).
To maintain the effectiveness of an organization, its activity must be identified,
linked, conducted and controlled, as the control loop of the model includes the
customers as well as the interested party and therefore goes beyond corporate
boundaries – only the Finance component is excluded (Giebel, 2011). This work
aims to remedy this deficiency of CO, which will be explained below and leads to

50
the connection of this to a suitable model of the effective relationships through a
process model.
2.2.6 Controlling
Controlling is a management subsystem and has the role of supporting the
management. The management has the task of planning, controlling, organizing
and leading the staff. In this case, Controlling ensures the necessary supply of
data and information. A Controller can be compared with a doctor who is
struggling to keep his patient in lifelong health, just as the Controller is seeking a
permanent positive development of the company (Fiedler, 2001).
To stay with this comparison, the necessity of a Controller is because of the
individual nature of the decisions in every part of the company as in a human
body, where every part has its individual purpose. A Controller/Doctor has to
check if all parts of the company/body are working together towards the main goal
and if not, to analyze which part is not and what the reasons may be (Küppler et
al., 2013).
Weber & Schäffler (2008) state that Controller is responsible for business results,
finance, processes and strategic transparency. Horváth & Gleich (2012) go a step
further and state that the corporate Vision and Mission are the cornerstones of
Strategic Controlling.
The Operative Controlling, in contrast, brings its aims and plans for measures
into line with Strategic Controlling (Weber & Janke, 2013), which means it
analyzes and detects the market share, price development and so on. The task
is to produce operational budgets, which include the finance plan, projected
balance sheet, etc., followed by cost planning and operative control (Fiedler,
2001).
However, "Controllers ensure the transparency of business results, finance,
processes and strategy and thus contribute to higher economic effectiveness.
Controllers coordinate secondary goals and the related plans in a holistic way
and organize a reporting-system which is future-oriented and covers the
enterprise as a whole. Controllers moderate and design the controlling process

51
of defining goals, planning and management control so that every decision maker
can act in accordance with agreed objectives. Controllers provide managers with
all necessary company management data and information. Controllers develop
and maintain controlling systems” (Vesper, 2014, p. 17).
2.3 Literature Review
2.3.1 Development Stages of EWS in the Business Economics literature
Early Warning Systems are not a new development in business, but were, long
before their application to business subjects, used especially in the military field.
Here, for example, they report enemy attacks significantly in advance so that
effective countermeasures can be taken at an early stage, and surprises can be
avoided (Rieser, 1980). Krystek (1987) adds that in other fields such as medicine,
biology, meteorology and geology early warning systems are long-established. In
the field of Economics, Aguilar's (1967) concept of "Environmental Scanning" was
mentioned by Hauff (2010).

52
Figure 10 Development Stages of EWS in Business Economics literature
Source: Kirschkamp (2007)
Figure 10 shows a possible differentiation of early warning methods with
reference to their time of occurrence. In the early 1970s (1973-1977) the first
generation was developed: the so-called (operative) early warning. This
generation only focused on determining and identifying latent risks or threats
(Kirschkamp, 2007). The aim, however, was to detect them so early that there
still remained sufficient time to plan, implement and control appropriate
counteractions (Krystek et al., 2007). The basis for early warning was especially
forecasting on the basis of historical values (Kirschkamp, 2007). This means that
reporting procedures were developed on the basis of key performance indicators,
which sent signals by the exceeding or falling below of defined thresholds (Hauff,
2010), where the early recognition was carried out in the classic bookkeeping
way. In addition, KPIs do not really work efficiently in showing discrepancies,
because there is only a signal for the internal orientation, and so the external
environment is missing (Hauser, 1989). At the same time, so-called ‘planning

53
forecasts' were developed, in which it was possible to make a comparison
between the planned or target data and the extrapolated actual data, and, at the
discovery of any discrepancies to take appropriate countermeasures in time
(Hauff, 2010).
The development of the so-called second generation took place from 1977 to
1979 (Hauff, 2010). Characteristics of the second generation, were the extension
to chances and opportunities (Krystek et al., 2007), as well as the extension of
the planning horizon of the (operative) early recognition (Hauff, 2010). While the
first generation only worked with annual plans and the appropriate (internal)
working indicators, in the second generation, indicators were developed, which
were designed to identify longer-term, internal and external changes (Hauser,
1989). Hauser (1989) adds that the determination of indicators is often difficult,
as well as being impractical. This development led quickly to the recognition that
this system can recognize not only risks and dangers but also latent opportunities
and chances (Krystek et al., 2007).
The (strategic) forecasting is mentioned as the third generation when describing
an additional development (Krystek et al., 2007). This has the additional goal of
early detection of risks and opportunities, as well as the initiation of appropriate
counteractions (Schlüter, 2004). Krystek et al. (2007) add that the Ansoff (1976)
Concept of "Weak Signals" is useable in this stage for the identification of Threats
and Opportunities from both the internal and external environment.
The fourth and last generation, so-called ‘operative and strategic early
enlightenment’, is based on a holistic approach by integration both ‘operative’ and
‘strategic’ early recognition (Krystek et al., 2007). This stage is also characterised
by networked thinking and builds the basis of response actions (Kirschkamp,
2007). Janßen & Riediger (2015) state that companies today have to identify risks
which were scarcely considered in the past. They add that due to globalization
companies are much more affiliated with each other (the figure of multinational
companies has increased in the last 50 years from 7,000 to 104,000; it is
estimated that it will reach 140,000 by 2020) and this increases the complexity
of risk. “Indicators and EWSs are becoming more important as they can predict

54
possible future changes in their early stages and thereby reduce the time needed
to make adequate decisions” (Bedenik et al., 2012, p. 672).
2.3.2 EWS – forms of appearance
The historical stages of development for early warning approaches are very
diverse and can be divided therefore into several different forms of appearance
(Krystek, 1987):
Cross-organizational framework
One of the first and fundamental differentiations is the differentiation between the
microeconomic and the macroeconomic early warning, where the
macroeconomic early warning is not limited to just one company, but also pursues
the development of whole regions or countries (Hauff, 2010). The focus here is
on the early detection of cyclical development and changes (Nerb, 2001).
For this purpose, various forecasting methods and indicator analyses were
applied in the economic research (Krystek, 1987). An example of such indicators
can be given by the “Geschäftsklima”, developed by the IFO institute, which has
been successfully applied for several decades (Nerb, 2001).
The microeconomic early recognition, in contrast, is focused on a single
company, but there is an incremental variance between these two poles within
the meaning of cooperation for several companies (e. g. the same industry)
(Hauff, 2010). Looking at the individual economic early recognition, many
different dimensions can be seen.
Application purpose
During the application purpose, it is determined whether the management system
is self-oriented or externally-oriented (Klausmann, 1983). The self-oriented early
recognition is looking for the "classic" early identification of threats and
opportunities for their own company (Hauff, 2010). The externally-based early
warning, in contrast, focuses on the threats and crises of other market

55
participants, such as competitors, customers or suppliers (Klausmann, 1983). In
practice, this is of interest, for example, for the credit assessment of credit
institutions (Krystek et al., 2007) or for the examination of equity or potential
investors (Krystek, 1987).
Organizational reference area
In organizational terms, the area is divided into a holistic business-related and a
division-related early recognition (Hauff, 2010). In the holistic business-related
early recognition all internal and external threats are always taken into
consideration (Krystek, 1987). The division-related early recognition focuses on
(core) areas of the company, such as sales, procurement or personnel
management (Hauff, 2010).
Sponsorship
The characteristic sponsorship divided early warning systems into company level,
intercompany and cross-company, early recognition. Whilst company level early
warning systems are only considered in relation to a single company, in the
intercompany early recognition several companies cooperate. If this cooperation
is supplemented by another (independent) institution such, as e.g. a research
institute, then one speaks about a cross-company recognition system (Krystek,
1987).
Performance
In performance, a distinction is made according to by whom early detection is
performed (Bertram, 1993). This can be carried out both by the company itself
(self-reference) or be purchased from third parties, e.g. by a service provider or
an institution (Hauff, 2010).

56
Signal source
With the signal source, a distinction is made by early detection information source
(Löhneysen, 1982). While corporate sources are based on internal KPIs and
statistics or also information from its own employees, there also exist the Official
Publications of statistics, reports, and analyses or external-company signals
(Bertram, 1993).
Phenomenon area
The phenomenon area of an early warning system considers the breadth of the
analysis (Hauff, 2010). While the mono-oriented phenomenon early recognition
considers only a single phenomenon, such as the economic, ecological or
technological development the multi-phenomenon related early warning system
focusses on several phenomena (Krystek, 1987).
The figure below shows a summarized overview of EWS – forms of appearance.
Figure 11 Overview of EWS - forms of appearance
Source: Hauff (2010)
Characteristic
Cross-
organizational
framework
Application
purpose
Organizational
reference area
Sponsorship company intercompany
cross-
company
early
recognition
Performance
Signal source
Phenomenon
area
self-reference purched
internal signals external signals
mono-oriented
phenomenon
multi-oriented
phenomenon
microeconomic
Possible specificity
macroeconomic
self-oriented externally-oriented
holistic business-related devision-related

57
As shown, there is a variety of distinct forms. A description of all features at this
point is not helpful and would go beyond the scope of this work. The items listed
here, are the most important (Hauff, 2010).
As shown in the figure 11, this approach can only cover sub-areas and can only
work within an integrative system. However, the main differentiation in both
practice and literature is between the Operative and Strategic Early Warning,
which will be now explained in more detail.
2.3.3 Operative Early Warning and Early Recognition
2.3.3.1 Characteristics and differentiation of operative early warning
system
In describing the characteristics and specifics of operative early warning systems,
the majority of the literature refers to the concept of Krystek & Müller-Stewens
(1993). This distinguishes the operative early recognition from the strategic by
using the following features:
- System-relation: The operative system is early in comparison to the more
system-oriented strategic. This means that it operates on the basis of
specific information systems, which are predominantly of a quantitative
nature (Krystek et al., 2007).
- Conceptually close to "patterns" from, for example, military or medicine,
which use previously-established early warning systems (Hauff, 2010).
The suitability of these features, however, is questioned by Geissler (1995), when
he states that they have insufficient selectivity. This is justified by the fact that
both the operative, as well as the strategic, early warning, can use special
information systems and therefore both are system-oriented, even though they
have different emphases. Furthermore, it is argued that “patterns” for the strategic
early warning systems already exist (Hauff, 2010). On the other hand, the
characteristic of the time-distinguishing mark makes a difference (Krystek et al.,
2007). During the operative early recognition, a time horizon of up to 2 years is
used as a basis, whereas the strategic early recognition ranges from 2 to 5 years
(Hauff, 2010).

58
The methods and tools of early warning systems were mentioned as the primary
distinguishing features, even if the strategic EWS still left a lot scope for
guesswork in the selection/identification of appropriate tools. The tools of
operative early recognition, comprise KPIs, projections, and indicators (Krystek
et al., 2007), are shown in figure 12, and are then described with their related
concepts, if any, in detail.
Figure 12 Tools of operative early recognition
Source: own illustration
2.3.3.2 KPI oriented early recognition
KPIs are quantitatively-expressed information, understood as conscious
information compacting the complex reality onto numerically ascertainable,
business-relevant, and directly ascertainable, situations (Weber & Janke, 2013).
Their objectives are operationalization, animation, and encouragement,
allegation, regulation and control (Kirschkamp, 2007). Weber & Janke (2013) add
that business ratios help executives to be informed about the situation of their
business. Kirschkamp (2007), in contrast, states that they simplify complex
circumstances and enable communication between departments and different
levels of hierarchy. He adds that business ratios are absolute values and are
compared to others, using the classic bookkeeping method.
The accounting data can be used for a variety of financial ratios that are indicative
of the company’s financial characteristics – solvency, liquidity, the contributions
of debt in relation to equity in financing operations, the asset cover for the equity

59
interests, rate of return, the interest cover given by the level of profits, the financial
implications of the relationships between the separate and aggregated amounts
of the different classes of assets and between the different classes of liabilities
(Leker, 1993). In this context, Deppe (1992) analyzed the EWS forecast models
of BEAVER, ALTMAN, WEIBEL, BEGHARDT and PERLITZ, some of which are
described below, and came to the conclusion that each of them uses the balance
sheet as the basis. Krystek (1984) adds that such forecasting models are
appropriate not only for the assessment of one's company but also for the
evaluation of competitors, customers, and suppliers. This concept, however, is
only able to recognize crisis or insolvency (insolvency is the last stage of crisis,
as described at the beginning of this chapter), where counteractions are often
difficult or already impossible (Kurschus et al., 2015).
2.3.3.2.1 Approach of Beaver
The approach in the form of a univariate discriminant analysis was developed in
1966 by William Beaver. Beaver (1966) examined 79 both crisis-affected and also
successful companies, based on 30 indicators. The research period was done
over a period of 5 years before any entrance into insolvency (Krystek, 1987). He
pointed out the ratio of cash flow to total capital/debt capital as the most
appropriate indicator for prediction of insolvency risks and states that it possesses
a success rate of 78% for 5 years in advance (Acca, 2008). Even if such a simple
review can seem elegant, it very soon becomes clear that insolvency risk cannot
easily be described by a single parameter. Firstly, this would be contrary to the
complex nature of a company and its financial situation (Acca, 2008). Secondly,
it could lead to very contradictory statements, when the results of meaningful
indicators are compared with this figure (Töpfer, 1999). The success rate of
Beaver’s formula is high and due to the fact that its evaluations took place after
the announcement of the results from researched companies and therefore it was
"tailored" in accordance with these results (Acca, 2008).
60
2.3.3.2.2 Altman's Z-Score
In order to take account of this complexity, a bankruptcy diagnostics model based
on linear multivariate discriminant analysis was developed by Altman (1968)
(Kurschus et al., 2015). Altman (1968) examined 33 company pairs (solvent and
insolvent, within the same industry sector and as far as possible with equal
balance sheets) based on 22 KPIs (Deppe, 1992) and finally came to the
conclusion that the following 5 KPIs provide the best results (Acca, 2008;
Kurschus et al., 2015):
- Working capital / total assets = working capital over assets (X1)
- Retained earnings / total assets = return on assets (X2)
- Profit before interest and tax / total assets = profitability of assets (X3)
- Market value of equity / book value of debt = equity coverage ratio (X4)
- Sales / total assets = income to assets (X5)
These indicators formed Altman's function and read as follows:
Z = 0.012X1 + 0.014X2 + 0.033X3 + 0.006X4 + 0.999X5
The calculated KPI ‘Z’ of a company, can now be classified as follows: (Deppe,
1962):
- Companies with a Z of more than 2.99 are not in danger of insolvency
- Companies with a Z of less than 1.81 are in acute danger of insolvency
- Companies with a Z of 1.81 to 2.99 are in the "gray zone", which means
that in the overlap area, errors of the first kind (insolvent companies are
classified as solvent) and of the second type (solvent companies are
classified as insolvent), may occur.
“The first formula of Altman (1968) for company bankruptcy diagnosis faced
criticism for omitting the specifics of a sector, company size, geographical area
and other important criteria, but this model was used in parallel as the background
for company’s financial state analysis and for further development of company
crises assessment models” (Kurschus et al., 2015, p. 154). Eidleman (1995) adds

61
that especially the index "sales / total assets", which is highly dependent on the
industry, was criticized during this model. Later Altman (2002), adjusted his
formula as follows:
Z = 6.56X1 + 3.07X2 + 6.72X3 + 1.05X4
The range must be specified, due to the above information and in this formula is
from 1.1 to 2.6.
A further criticism of Altman’s Z-score, made by Eidleman (1995) was the focus
on large companies with an average value of about $ 100 million (no company
had a value below $ 20 million). Despite criticism, his method is still used,
especially by shareholders, as balance sheet analysis and, as a “rule of thumb”
approach, he is unsurpassed nowadays. However, “he also had some active
followers of his ideas (Fulmer et al., 1984; Taffler & Tisshaw, 1977; Springate,
1978), who developed different models using the same linear discriminant
analysis methodology but financial ratios and different data for identification of
weightings for every criteria” (Kurschus et al., 2015, p. 154).
These additional forecasting models which have been developed, e.g. by Fulmer
et al. (1984), Springate (1978) or Taffler & Tisshaw (1977), will not be discussed
in detail as they all have one thing in common: they are purely quantitative and
relate only to historical values. An overview of each underlying KPI of the
respective models is summarized in the following table (Kurschus et al., 2015):

62
Models\ Criteria
Altman classic, 1968
Altman modified for Ltd’s, 2000
Fulmer, 1984
Taffler & Tisshaw, 1977
Springate, 1978
Net working capital/ Assets
+ + +
Retained earnings / Assets
+ +
Retained earnings from previous years / Assets
+
Profit before interests and taxes / Assets
+ + +
Profit before taxes / Short-term liabilities
+ +
Profit before taxes / Assets
+
Market value of equity / Liabilities
+
Book value of equity / Book value of liabilities
+
Sales / Assets + + + + Cash flow / Liabilities
+
Liabilities / Assets
+
Short-term liabilities / Assets
+ +
Long-tangible assets
+
Working capital / Liabilities
+
Long-profit before interests and taxes
+
Short-term assets / Liabilities
+
(Fast-moving assets – Short-term liabilities) / Operating expenses
+
Table 2 Comparison of the criteria used in models for crisis identification
Source: Kurschus et al., 2015

63
The early recognition of risks of insolvency by calculated KPIs based on balance
sheets has, however, been strongly criticized. Schneider (1997), for example,
believes that backward-looking indicators for forecasting future insolvency risks
may be applied only if the following points are fulfilled:
- It can be proven that a valid probability of this indicator is existent both in
the past and in the future
- This probability is constant over time
- There is a stochastic independence of bankruptcies, that is to say, that no
bankruptcies can be caused by bankruptcies
But these criteria cannot be met and will also not be fulfilled (Deppe, 1992).
Müller-Merbach (1977) comments on this as follows: "In fact, the global financial
indicators (as key indicators) of performance measurement systems for early
warning possess the same value as equipment for measuring the average
temperature of a forest for forest fire early warning. When the average
temperature in a forest has significantly increased, so that the event of a forest
fire should be considered as fulfilled, then the fire is already burning to its heart's
content, so that any message from an early warning system can be dispensed
with. It is much more useful to observe individual trees or small forest areas to
detect the fire directly at its source, which can then be fought successfully. "Since
performance measurement systems generally have a pyramid structure, it is
important for early recognition to look at details, e.g. to look at the bottom of the
pyramid, at the non-aggregated KPIs (Krystek, 1987). It can be said that KPIs are
past or present-based and are purely analytical in character, using quantitatively-
expressed information, but the future view is missing.
However, a summary can be taken from Hauschildt & Leker (2000), who also
used the balance sheet as the basis for different KPIs to analyze how far they
were appropriate for crisis diagnosis, within the given time frame. The analyses
were carried out by using different authors and 6638 crisis cases from 3809
companies. The definition of the crisis, measurements and the tools of the
balance sheet were clearly stated, only the time necessary for handling the crisis
was not made clear. They state that when the result of the analysis shows the

64
manifest crisis, shortly before insolvency, there is no space for a turnaround.
Derived from the above, it is mostly the relationship with the bookkeeping for the
balance sheet and indicator system, which is described by Hauschildt (2001),
Leker (1993) and Crone & Werner (2012), to mention but a few. This system
shows problems which have already occurred and brings in the disadvantage of
time lag. The problems are manifested in the company a long time before they
are viewable in the figures from bookkeeping (März, 1983). Furthermore, the
content of the balance sheet can be adapted by an interested party to influence
the decision (Bötzel, 1993). Management is not able to estimate the company
situation, in order to help them to make the right decisions (Berndt et al., 2011).
To try to solve the problem of time, Hauschildt & Leker (2000) analyzed the usage
of controlling analyses. They did not really give advice as to which way
Controlling should be used (this will be analyzed later in this account), but the
answer was clear: that the crisis will be recognized much sooner by controlling
analysis. The result of the survey of Institut für Unternehmensplanung also shows
Controlling as the most appropriate location for Early Recognition (Krystek et al.,
2007).
Figure 13 Chinese Character for Crisis
Source: Löbig (2010)
Furthermore, the Chinese Character for Crisis, shown above in figure 13, is made
up of the signs for Chance and Threat (Hornstein, 2009), the idea of which is also
expressed by an old Chinese proverb: “When the wind of change is blowing,
some people build walls and other build windmills” (Löbig, 2010, p. 64), where
the time plays a big role. Arlinghaus (2007) adds that risk and opportunity go
65
together – he who does not risk will not win. It is important that the whole
organization recognizes that Risk should not only be seen as a negative but can
also have the potential to force improvement and lead the company into (more)
success. Furthermore, it is an opportunity to have the possibility of seeing
weaknesses throughout the system and of implementing the improvement
process (Arlinghaus, 2007). In this way, it is important to evaluate how high the
risk is (Löhneysen, 1982).
Company crises are connected to economic action by economic activity and
companies will not be able to eliminate them completely (Arlinghaus, 2007). To
manage risks the company has to foresee, identify, evaluate and control both the
Risk and the Opportunity (Reimer & Fiege, 2009). The company has to be aware
of the past and the future in terms of Strength and Weakness as well as
Opportunity and Threat analysis, which supports the leadership in decision
making (Arlinghaus, 2007). However, an Early Warning System does not focus
on the solution to the problems, when they have already reached a certain level,
but it aims to discover them early, before they have a disadvantageous impact on
the company (März, 1983). “To finish first, you first must finish” (Pocalyko, 2011,
p. 1). Most companies do not die because they are wrong; most die because they
do not commit themselves. They fritter away their valuable resources (Kautt,
2013). In this context Projection as a feed-forward tool, which belongs to
Controlling, can be named and will be explained in chapter 2.3.3.3.
2.3.3.2.3 Argenti’s Model
One of the best-known crisis forecasting models, based on purely qualitative
data, as opposed to those described above, is the A-Score model of Argenti
(1976). For Argenti (1976) the primary measurement of data is not quantitative,
based on information of a financial nature, but qualitative data, such as the quality
of the management or the market structure (Kurschus et al., 2015). He developed
a total of seventeen criteria, which he divided into three groups: management
weaknesses, management errors and crisis symptoms (Kurschus et al., 2015),
which also included the building of sequential stages (Acca, 2008). To each of
these criteria, Argenti (1976) gives a specific code, on which basis the criteria

66
should be evaluated. The management weaknesses can be awarded a maximum
of 45 points and an assessment up to a maximum of 10 points is satisfactory. At
a higher rating, it can be assumed that it is management weaknesses that lead
to management errors, which may only become apparent after several years.
Management errors are awarded a maximum of 15 points (Argenti, 1976). The
last group consists of those which are already showing visible signs of crisis,
triggered by weaknesses and mistakes. The maximum awarded here is 26,
covering any signs of acute problems and high risk (Acca, 2008).
To sum up, it could be said that it seems to be very subjective, and so open to
attack, as the quantitative area is completely missing and for this reason, in
comparison to BSC, for example, which tries to break the qualitative factors down
to make them quantifiable, the data are unmeasurable. In addition, Argenti’s
model, as described, is not really appropriate as an EWS, since most of the facts
that are shown through performance measurement systems, are past-, or at best,
present-, based and so have a purely analytical character and are therefore
problematic for the gaining of relevant information for early recognition (Krystek
et al., 2007). Kirschkamp (2007) states that the most appreciated advantage of
performance measurement systems is the consolidation and related compressed
significance, which can, in terms of early recognition, result in a disadvantage.
2.3.3.3 Extrapolation-oriented early recognition
To counteract the disadvantage to key systems of the past relatedness above,
early recognition based on extrapolations were developed (Hauff, 2010). Hauser
(1989) describes extrapolations as a form of anticipatory control. The operation
consists of the comparison of the periodical plan data with the extrapolated
actual, or rather, future data (Klausmann, 1983). Therefore the extrapolation is a
feedforward tool, which opens up for early risk and opportunity recognition, a
significantly greater action period for the initiation of counteractions (Hauff, 2010).
However, during the extrapolation-oriented early recognition, there are also risks,
since this is based on historical experience and therefore unexpected events,
which have not been seen in the past, cannot be integrated into the extrapolation
(Krystek et al., 2007). Kirschkamp (2007) adds that, especially in terms of

67
breaking trends, the risk of misinterpretation is therefore very high. To address
this criticism Péter Horváth (Bratschitsch & Schnellinger, 1981) spoke at the
Pfingsttagung Innsbruck 1979 about Zero-Base-Budgeting as a Crisis-
Management Tool. He came to the conclusion that it would be appropriate as
prophylaxis for the company, supplying detailed information for crisis planning.
The company policy will be articulate; communication, motivation, coordination
and control will be improved. The difference of “zero-base-budgeting” in
comparison to traditional planning is, that the costs from the past years will not
be projected, but will be planned completely afresh from the base. The advantage
of this approach is the ‘Strategic Alignment’, where the company has to examine
their mission, policy, etc., and the systematic planning throughout the whole
company. The disadvantage could be that this approach is complex and time-
consuming – which is particularly difficult for SMEs.
However, Löhneysen (1982) tried to design an EWS as a conceptual framework
which shows the internal and external dangers at an early stage. Her opinion was
that the level of threat would be measurable if the company establishes a basis
with indicators which show it. The development of the system should include
people, plants and the combination of people and plants in a certain relationship,
as well as the determination of the internal and external monitoring area. The
features have to show the gap between the aim and the actual features of the
company. The gap can be described as an aim, as normal, as crisis or as
insolvency. She tries to achieve the quantification of crisis features, but the
concrete result of the way in which the company has to recognize the crisis, is
missing. The basic question is how the crisis situation is distinguishable from the
normal situation.
In summary, it can be said that the above-mentioned arguments support the
appropriateness of Controlling as EWS but, as already explained above, the
information including operational results, such as plan figures, operative key
figures, projections, possibility of query and informal information search by
Controlling is not enough. A further tool, which was identified for the operative
EWS, is the indicator-based early detection.

68
2.3.3.4 Indicator-based early detection
Hauff (2010) states that while KPIs are quantitative by nature and, therefore,
show facts directly, indicators, in contrast, are auxiliary quantities that help to
understand facts that are not directly observable phenomena (Kirschkamp,
2007). Brockhoff (1999) adds that, in this form of detection, indicators send
signals of relevant events/developments with sufficient regularity and sufficient
notice.
For distinction or division of external and internal indicators, Rieser (1980) gives
the following leading indicators:
External Early Indicators
- Macroeconomic indicators
- Indicators of market development
- Technological indicators
- Social indicators (Social and Demographic Trends)
- Political indicators
Internal Early Indicators
- Financial analysis KPIs
- Economic Indicators
- Employee-related Indicators
2.3.3.4.1 Concept of Krystek & Müller-Stewens
Early warning indicators can be considered as diagnostic signs for detection of
hidden events, which could be various kinds of positive and negative trends or
developments in the environment (Rothwell, 2010). Krystek et al. (2007) explain
that early warning indicators have to fulfill certain demands and demonstrate the
following attributes: singularity, completeness, timely availability of information
and economic justification. “These are the measures which, after surpassing
certain previously-set boundaries, indicate the occurrence of change and
development of new trends; they represent signals of possible upcoming crises,

69
but cannot predict the magnitude and time of indicator materialization and impact
on the firm” (Bedenik et al., 2012).
Indicator-based detection already belongs to the second generation of early
warning systems and is a further development to the KPI- and extrapolation-
oriented systems (Krystek et al., 2007), where the steps are as follows:
Figure 14 Indicator-based EWS
Source: Krystek et al. (2007)
The indicator-based EWS starts with the search for monitoring fields
(external/internal), followed by the selection of monitoring field. In the third step
the search for indicators appropriate for the defined monitoring field begins, and
these are selected during the fourth step (Hauff, 2010). Once all observation
areas and indicators have been set, the indicator values must be observed. This
will be done during the fifth step by definition of observers, followed by the
definition of frequency and reporting tool. The definition of headquarters and their
tasks will be done during step seven, where the main task is information sampling
and processing (Krystek et al., 2007). Additionally, to be able to recognize
deviation from the target value, which should be determined and defined during
70
the previous steps, the areas where the indicator is allowed to move without
triggering a signal must now be defined (Hauff, 2010), during the ninth step. The
last step includes the design of information exchange between observer and
central office in the form of channels of communication and also the feedback
from the observer (Krystek et al., 2007).
The described basic model for the indicator-oriented early recognition is often
adopted in science and literature, and it also seems that it is recognized in
practice (Schlüter, 2004; Geissler, 1995). However, the problems and/or
weaknesses should be not left unmentioned. One of the fundamental problems
is due to the definition of appropriate indicators/indicator catalogues, which
should be based on causal relationships, where indicator-based early warning
systems are founded on the concept of a directed search for changes (Hauff,
2010). Here, there lies the danger that relevant changes will not be recorded and
that existing causal chains will break down (Geissler, 1995).
Another point of criticism lies in the fact that (many) indicators should be
calculated and created on the basis of intuition and experience (Schlüter, 2004).
People tend to avoid costs associated with (comprehensive) information seeking
and thus, perhaps unwittingly, accept solutions that are not of maximum
usefulness, but are only adequate or acceptable (Hauff, 2010).
Krystek et al. (2007) also point out that due to the definition of indicators in
predefined monitoring areas, potentially relevant developments in unrecognized
observation areas will not be recorded. Hauff (2010) adds a further criticism by
stating that during the indicator-based early recognition, target values and
tolerances must be specified. However, this is very difficult and often not possible,
especially for SMEs, which can lack sufficient technological and human
resources, as many of these values and tolerances are based on difficult to
measure, qualitative data, and therefore, the objectivity, reliability, and validity of
indicators are questionable.
71
2.3.4 Differentiation between ‘operative’ and ‘strategic’ Early Recognition
Bedenik et al. (2012) describe ‘operative’ as short- term oriented and ‘strategic’
early warnings as long-term settings. Krystek & Müller-Stewens (1993) explain it
in more detail by differentiating between operative early warnings, which are
followed by short-term measures of success and are mainly aimed at detecting
risks, and strategic early warnings which have long-term objectives, profit
potentials and try to detect risks and chances. There exist two ways of detecting
the signals: by monitoring, which is the analysis of the environment limited to a
single phenomenon and by scanning, which is the activity of acquiring information
(Kirschkamp, 2007).
Kunze (2000, p. 40) describes "environmental scanning" as "(…) the acquisition
and use of information about events and trends in an organization's external
environment, the knowledge of which would assist management in planning the
organization's future courses of action". Hillebrand (2005) states that scanning is
the informal scanning of the environment and the company with the aim of
identification of the „weak-signals", which afterward will be analyzed and
completed by monitoring. Monitoring analyses the supposed changes in detail
and describes them together with the forecast of the potential consequences
(Kunze, 2000).
The operative EWS tries to prevent crises by frequently using instruments such
as business ratios, projections, and indicators (Kirschkamp, 2007). They are past-
oriented, which has the disadvantage, that some risks cannot be recognized in a
timely way (Hillebrand, 2005). The recognition of strategic risks, in contrast, will
be realized by locating the signal of the discontinuous change, analysis and
subsequent evaluation of its relevance (Trustorff, 2012). With strategic EWS it is
more or less impossible to recognize the signs by indicators, which is the reason
for the use of discontinuous factors and the advantage of more time for
counteraction (Hillebrand, 2005).
The discontinuity can be described as "unpredictable, unforeseen, natural or
man-made sudden change, consequence, event, or force that confounds or
disrupts earlier expectations or estimates" (Business Dictionary, 2015). Kunze
(2000) describes it as radar, which is oriented to "shadows" or "weak signals",

72
which signal changes in the company environment. Kirschkamp (2007, p. 12)
states that, "In this context, discontinuities are most important and therefore, it is
the first aim of strategic early warning to detect ANSOFF's weak signals to inform
the management and to initiate change". Ansoff (1984, p. 483) describes "weak
signals" as "(…) a development about which only partial information is available
at the moment when a response must be launched if it is to be completed before
the development impacts on the firm".
Ruderer (2009) states that an EWS should be in use for both operative and
strategic areas. “Operational early warning deals with data of high concreteness
whereas strategic early warning deals with data of low concreteness”
(Kirschkamp, 2007, p. 13). Trustorff (2012) warns about examination of operative
and strategic risks in terms of reference parameter (potential for success versus
operative success), time horizon (long-term versus short-term) and target
dimension (strategic versus operative) independently. At long distance, the
threats of success potentials will affect the success and the liquidity situation of
the company by wrong strategic decisions or ignored changes in the company
environment. Conversely, a high operative risk potential denotes a significant
restriction of the scope of action for handling strategic risks.
Bedenik et al. (2012) add that a global economic crisis should motivate the
companies to the use of operative early warning system as well as strategic,
which according to Ansoff (1976) means “when a threat/opportunity first appears
on the horizon, we must be prepared for very vague information, which will
progressively develop and improve with time”.
2.3.5 Concepts of Strategic Early Warning Systems
In general, the strategic EWSs are less system-based than the operative EWSs,
however in practice it is much easier to introduce such methods by a basic
principle / schematic diagram. In addition, according to the literature review, the
appropriateness for practical use shows some gaps, so the regulations will push
the future development of having to demonstrate a Risk Management System not
only for public limited companies, which are engaged by KonTrag to do this, but
also for SMEs, as since October 2015 according to DIN EN ISO 9001:2015 they

73
also have to extend their QMS by risk orientation. However, the first research
work about “environmental analysis” came from Aguilar in 1967, where he
constitutes the need for external review and monitoring by dividing company
environment into the following subsystems: Economic, Technological, Politico-
legal, Socio-cultural, Physical-ecological terms (Kunze, 2000). Thus, both the
concept of Aguilar (1967) and, especially, the concept of Ansoff (1976) can be
named as the origins of early detection. Below are presented and outlined only
some representative selected concepts, all of which are based on weak signals.
Basically, the structure and operation of the concepts, discussed in the literature,
are essentially very similar (Hauff, 2010). The fundamental idea of Ansoff-
Concept (1976) is the impulse of weak signals for strategic discontinuity from the
corporate environment (Löhneysen, 1982). At centre stage is the strategic
discontinuity gathering from vague information, which does not explain, what the
content and the reception of the signals are. Ansoff (1976) does not give a
definition of "Weak Signals". For this reason, the interaction of theory and early
recognition require critical analysis of their suitability (Hauser, 1989).
However, Ansoff (1976) distinguishes between five uncertainty levels (States of
Ignorance), where each has a different information content. As shown in the
figure below, the first uncertainty condition (Sense of Threat/Opportunity)
represents the highest level of ignorance in which it is only known that a threat or
opportunity is present. Neither its form nor its source can be determined. In the
second stage (Source of Threat/Opportunity) it is now possible to identify the
source of the change, but the precise characteristics of the threat or opportunity
are not yet determined. This is achieved only in the third stage of uncertainty
(Threat/Opportunity Concrete). Only here it is possible to determine the exact
nature of the impact and the timing of the threat or opportunity. Based on this,
during the fourth stage (Response Concrete) the counteractions and strategies
can be developed. Finally, in the fifth stage (Outcome Concrete) the
consequences of the proposed measures and their impact on the company's
success can be determined (Ansoff, 1976).

74
Figure 15 Knowledge-State of Discontinuity
Source: Kirschkamp (2007)
2.3.5.1 Tools used during strategic Concepts
However, tools, which were explicitly named during strategic early warning
concepts, especially by Battele Institut (1978) and Hammer (1998), are Diffusion
Theory, Creativity Methods, Trend Landscape, Cross-Impact-Analysis, Scenario
Analysis, SWOT Analysis, Strategic Planning and Portfolio Analysis, as shown in
the figure 16.

75
Figure 16 Tools used during strategic concepts
Source: own illustration
The description of these tools can be found in Chapter 5.
In summary it can be said that the well-known tools provide the basis, according
to the described need, for a strategic EWS, however there is still a lack of a tool
for scanning as a starting point, which this work tries to solve by PESTLE.
Although the concepts of Battele Institute (1978) and Hammer (1998) state the
need for environmental analysis, it is indisputable that, especially for SMEs, it will
be much easier to do it by a systematic tool like PESTLE. Furthermore, a tool for
the link from strategic to operative, which this work intends to solve by BSC, and
which even Hammer (1998) himself names as the most difficult part is completely
missing from the previous concepts. This is the main criticism of Concept of
Hammer (1998), even if Bertram (1993) states that Hammer's concept is one of
the most far-reaching considered, due its detailed classifications and control
function, as his concept covers most known requirements from the literature.
2.3.5.2 Concept of Kirsch and Trux
One of the first concepts of Strategic Early Warning Systems was developed in
1979 by Kirsch and Trux. This characterizes strategic early recognition as a multi-
paradigm problem and describes it metaphorically as "Disperse-Suck-Filter-
System with systematic recycling and automatic filter check" (Krystek et al.,
2007). For Kirsch and Trux (1979) the active search for early-clarifying
information with strategic relevance in the company and its environment is not

76
sufficient, as this would only be performed by those institutions which are
responsible for it. The search for such signals should rather be done by as many
positions at different levels of management as possible (Hammer, 1998). He adds
that the signals obtained by this "purposeless Exploration", speaking pictorially,
are dispersed downwards and sucked in (Krystek et al., 2007).
Due to the low precision of the dispersed and sucked signals they have to be
filtered - the more signals, the better they must be filtered, as it could otherwise
lead to "queuing effects" or to information overload at the management level
(Hammer, 1998). The next area of responsibility for this system is the check of
the filtered information for relevance (Krystek et al., 2007). Here, however,
depending on how the evaluation criteria are designed, errors can occur, so that
information and signals will be incorrectly evaluated and eliminated as irrelevant
(Hammer, 1998). Hammer (1998) states that in order to avoid this error and
correct it, a so-called ‘recycling' should be installed in the system offering the
possibility of bringing back these filtered signals into circulation in order to be able
to pick up them again when the context changes. Due to its potential usefulness,
the assessment criteria and relevance criteria need to be checked regularly as
they may change quickly (Krystek et al., 2007). Recycling and verification of the
relevance criteria can be seen according to Müller (1986) as the main
characteristic of strategic early recognition. His opinion is that it is not possible to
go away "... from the fiction of an always secure foundation of interpretation and
evaluation ..." (Hammer, 1998). However, this concept is rather vague –
especially with respect to the procedure and the action – and due to the fact that
it is mainly theoretical, it leaves a lot of scope for individual interpretation or even
intuition.
2.3.5.3 Concept of Battelle Institute
The Battelle Institute developed the first system to have a practical approach,
even if the description still has a theoretical and indistinct consistence, for
strategic early recognition in the early 1980s, and this is also represented by
Krystek (1987). Hauff (2010) states that this system is understood as based on
dynamic-based environmental analyses, which is a whole business-related

77
monitoring system. It already recognizes changes in its peripheral system at the
time of their content, which is of unstructured development; explores the causes
and interrelations; predicts their long development; sends signals of serious
deviations and determines and evaluates alternative strategies for response to
these deviations (Krystek et al., 2007). It is divided into the following five sub-
functions of early recognition (Hauff, 2010):
Sign-oriented environment analysis
In this stage, the weak signals will be primarily located in the strategic, relevant
observation areas and there subsequently follows the diagnosis of the reasons in
connection with sign-specific effect prognosis (Krystek et al., 2007). Battelle
Institut (1980) explained it in more detail: that this stage is based on Diffusion
Theory and the potential impact will be predicted by deviated Trend Landscape.
Afterwards, based on the prognosis results, appropriate Scenarios will be built
(Hauff, 2010).
Comparison between the premises of the strategic planning and the sign specific
scenario results
The statement derived from the sign-specified scenario will be compared with the
strategic planning, where only if there is sufficient deviation between premises of
the strategic planning and scenario results, will the next step follow (Hauff, 2010).
Evaluation of the deviation determination
Before alternative treatments are sought, the relevance of weak signals and the
urgency of possible action should be determined (Krystek et al., 2007). Does it
show enough relevance for the development of the company? Can the process
of the strategic early recognition at this point be stopped or started with a new
search for weak signals (Hauff, 2010)?
Search for strategic treatment alternatives
After selection of the company-relevant discontinuity, there follows, by the use of
known planning techniques (Hammer, 1998), the development of strategic
treatment (Strategic Planning) alternatives for the handling of the imminent
change (Hauff, 2010).

78
Evaluation and decision about strategic treatment alternatives
During the final stage, the selected treatment alternatives will be evaluated
according to their effect (Krystek et al., 2007). The EWS according to the Battelle
concept (1980) as well as to Krystek (1987), can be understood as a linear
sequence of part functions. The summary of the different activities during the first
stage of sign-oriented environment analysis and the possibility of a break during
the second or third phase makes this concept particularly special (Hauff, 2010).
2.3.5.4 Concept of Hammer
Another concept of strategic early warning, which is not completely different from
the concept of the Battelle Institute, especially when looking at the linear
prerequisites phases of strategic recognition, has been formulated by Hammer
(1998), divided into five phases, as follows:
As a first process step Hammer (1998) describes the observation of defined early
clarification of relevant corporate and environmental areas, and the recording of
weak signals. Hammer (1998) says that the observation of weak signals should
be via "scanning", e. g. on the basis of directed and undirected observation, then
recorded and afterwards monitored via "monitoring" (Hauff, 2010). The literature
mostly focuses on the “monitoring” area to a large extent, if not completely, at the
expense of “scanning”. This is described in the literature as a complex area with
a diversity of different risk areas, which reflects the rather incomplete elaboration
and description of the numerous tools and methods for risk identification.
However, the obtained results must then be documented, which categorizes them
directly during this first step, and are then subjected to a first relevance test
(Hammer, 1998).
The second phase deals with the analysis of these weak signals and also
evaluates the potential impact. The analysis is based on mathematical and
statistical methods that determine the behaviour and distribution patterns of
signals (Hauff, 2010). Hauff (2010) adds that in order to ensure a substantiated
forecast, the causes of these calculated patterns should also be analyzed.
Hammer (1998) indicates that the potential impact will be predicted by different

79
created Scenarios and by a comparison drawn with the principles of strategic
planning, based on the Diffusion Theory and deviated Trend Landscapes,
analyzed by Cross-Impact-Analysis.
In Hammer's (1998) third step there follows verification through objective and
reasonable relevance, which is done by using a so-called discontinuity survey of
experts in terms of their assessment of a specific question. Müller & Zeiser (1980)
add that according to this survey three aims should subsequently be reached:
determination of the potential impact of potential changes, determination of the
probability for the appearance of these and finally the assessment of the
necessity and urgency of reaction strategies. If reaction strategies seem to be
necessary, these strategies have to be developed by using Creativity Methods,
SWOT and Portfolio Analysis at an additional stage (Hammer, 1998).
Afterward, this will then be evaluated, and a selection will be made (Bertram,
1993).
The last and, according to Hammer (1998) the most difficult, part of a strategic
early warning system is the implementation of the strategies (Strategic Planning)
developed in Phase 4, into concrete actions. This includes points such as the
creation of operative plans, the organization and the monitoring of implementation
(Hauff, 2010).
Hammer suggests the combination of subsequent phases, even if the detailed
use of tools is missing, as the most appropriate approach in practice. Bertram
(1993) states that Hammer's concept is one of the most far-reaching considered,
due its detailed classifications and control function. Additionally, his concept
covers most known requirements from the literature. The main criticism, which
also exists in the literature, is the link to the operative area, which even Hammer
(1998) himself names as the most difficult part.
2.3.6 Overview of previous work
In summary, it can be said that the drafts showed and mentioned herein and
concepts as well as many other developed models - is basically a process of
evolution - subject, where some can be displayed in chronological order. Thus,

80
the concepts of Aguilar (1967) and especially the concept of Ansoff (1976) can
be named as the origin of early detection. These were only strategic and
qualitative in nature because they treated "only" the fact that (corporate) risks can
already emerge very early and these weak signals must be located by so-called
"scanning". Aguilar (1967) extended it in a bit more in detail by adding to the
component "scanning" even the so-called "monitoring", as the scanned risks can
not be recognized as such immediately, as they are of a potential nature and must
accordingly, be checked regularly.
The work of Kirsch & Trux (1979) builds on these concepts and leads to a
discontinuities detail form, already mentioned by Ansoff (1976). Furthermore,
Kirsch & Trux (1979) add to these concepts the filter system, as a further
component, as otherwise an overlay and slack flow of the potential risks would
emerge as result. Since these concepts, still rather vague - especially with
respect to the procedure and the action – were, also due to the fact that they were
mainly theoretical, there were developed further concepts both parallel to, as well
as on, this basis. Some tried to make the risks search and evaluation quantifiable
and for this reason tangible for business and corporate governance.
At this point should be mentioned the purely quantitative approaches based also
on crisis and insolvency risk calculation, the Beaver (1966), Altman (1968)
“Alman's Z-score” or Fulmer (1984), Taffler & Tisshaw (1977), Springate (1978),
which want to express the stability based on past values of the company’s
balance sheet by the use of only a few KPIs.
Furthermore, there is the concept of Krystek & Müller-Stewens (1993), who
picked up the theoretical approaches and developed primarily a key figure model
by which risks could be quantified. However, since key figures are based on
historical data and the recognition of risks can be realized shortly before their
entry or even after their entry, this concept can only be used as an operative
EWS. In addition, the ratios have been calculated only on the basis of internal
company data and disagrees with, for example, Aguilar's (1967) "environmental
scanning". Krystek & Müller-Stewens (1993) therefore extended the model by
systems, which were based on extrapolations and indicators and which at least
predict the "near" future and also took key figures from the business environment

81
into consideration. Depending on the choice of indicators this concept was able
to give a partial strategic orientation. The advantage of this concept was that early
detection concerning the ability to present the procedure on a scheduled basis
was implementable in a company. However, it is quite clear that the largely
operative alignment is not sufficient to recognize all business risks and to take
counteractions since the real weak signals and discontinuities cannot be
quantified directly, but should be broken down during a process of analysis. The
Table below gives an overview of the previous concepts.

82
Concept/
Alignment
Strategic/
operative
Qualitative/
quantitative
Precise/
vague
Theoretical/
practical
Internal/
external
Beaver (1966)
operative quantitative precise practical internal
Aguilar (1967)
strategic qualitative vague theoretical prevalent external
Altman (1968)
operative quantitative precise practical internal
Argenti (1976)
operative qualitative precise practical internal
Ansoff (1976)
strategic qualitative vague theoretical prevalent external
Taffler & Tisshaw (1977)
operative quantitative precise practical internal
Springate (1978)
operative quantitative precise practical internal
Battele Institut (1978)
strategic qualitative vague prevalent theoretical
prevalent external
Kirsch & Trux (1979)
strategic qualitative vague theoretical prevalent external
Fulmer (1984)
operative quantitative precise practical internal
Krystek & Müller-Stewens (1993)
prevalent operative
prevalent quantitative
precise practical prevalent internal
Hammer (1998)
strategic prevalent qualitative
precise practical internal + external
Table 3 Literature overview of concepts dealing with crisis or risk recognition
Source: Compiled by author

83
Most of the models designed to identify company risk or crisis, as shown above,
are focused either on ‘operative’ or ‘strategic’, where most of the ‘operative’ can
be also named as ‘quantitative’, and the ‘strategic’ as ‘qualitative’ models. Several
authors point out the need for a more holistic approach (Bedenik et al., 2012;
Purvinis et al., 2005; Kurschus et al., 2015; Geißler, 1995; Hammer, 1998).
Figure 17 Required holistic EWS
Source: own illustration
This is the central rationale of this work: to develop an approach that entails an
optimal consideration of strategic (qualitative) and operative (quantitative)
factors, as shown in figure 17.
2.3.7 Identification of literature gap
As already summarized in the overview and presented in a chronological
sequence, the development of EWS has grown historically and has been

84
formulated in more detail and partly adapted to the circumstances. With the
awareness that risks exist for companies and that they can be detected even at
an early stage in order to initiate adequate countermeasures, it is seen that it is
now necessary to come to a very detailed division between operational, strategic,
qualitative and quantitative, internal and external areas and EWSs. Numerous
tools, concepts and methods have also been developed in the literature, in order
to identify individual risks and risk areas during a company, branch, etc. (Ruderer,
2009).
Figure 18 Conceptual framework - identification of research gap
Source: Own illustration
Figure 18 shows a possible differentiation of early warning methods by inclusion
of some appropriate concepts as example, which have been explained above.

85
“Every class of early warning is typical of a specific time and has its own
instruments and objectives” (Kirschkamp, 2007, p. 8). In the early 1970s the first
generation was developed: the so-called (operative) early warning. This only
focused on determining and identifying latent risks or threats (Kirschkamp, 2007).
The aim, however, was to detect them so early that there still remained sufficient
time to plan, implement and control appropriate counteractions (Krystek et al.,
2007). The basis for early warning was especially forecasting on the basis of
historical values (Kirschkamp, 2007). This means that reporting procedures were
developed from key performance indicators, which sent signals by the exceeding
or falling below of defined thresholds (Hauff, 2010). The tools used in the
Concepts of the first generation are Business Ratios and Projections.
Business Ratios are past-, or present-, based and are purely analytical in
character, KPIs are quantitatively-expressed information. In addition, KPIs do not
really work efficiently in showing discrepancies because there is only a signal for
the internal orientation, and so the external environment is missing (Hauser,
1989), and the early recognition was carried out in the classic bookkeeping way.
The Bookkeeping Approach shows up problems which have already occurred
and it also includes the disadvantage of time lag. The problems are manifested
in the company a long time before they are viewable in the figures of the
bookkeeping documents. To overcome the criticism of Bookkeeping, as analyzed
by Hauschildt & Leker (2000), Controlling can curtail the time lag. The Controlling
Approach, deals with the transparency of business results, finance, processes
and strategy. The Controller is responsible for the design of CO-processes of
defining goals, planning and management control of decision making. However,
by analyzing the already-existing methods and tools described in the literature, it
seems to be an appropriate approach, if used in combination with other systems,
such as QM, which will be analyzed later during Chapter 6. During the same
period as work on CO, the so-called ‘planning forecasts' were developed, in which
it was possible to make a comparison between the planned or target data and the
extrapolated "actual data", and then, at the discovery of any discrepancies, to
take appropriate countermeasures in time (Hauff, 2010). Projection, which
belongs to Controlling, is a feed-forward tool, which is formed by the comparison
of the periodical plan data, but is based on historical experience. For this reason,

86
mistakes or errors, which were not recognized in the past, will remain
disregarded.
However, with reference to first generation, concepts like Beaver or the Altman
Z-Score model could be ascribed, using financial statements as their basis. The
Approach of Beaver (1966) is an univariate discriminant analysis, where he
points out that the ratio of cash flow to (total capital/debt capital) is the most
appropriate discriminant for insolvency recognition, even if it is impossible to
describe insolvency by only one parameter. Altman's Z-Score (1968) as a
bankruptcy diagnostic model, in contrast to Beaver, is based on multivariate
discriminant analysis. This was also criticized, especially because the index
“sales / total assets” is highly dependent on the industry. All further quantitative,
insolvency forecast models will be not named here further, as they all based on
the idea of Altman. Despite criticism, his method is still used, as mentioned
previously, especially as a rule of thumb. There remains the problem of the gap
between Altman’s Z-core model being purely quantitative and Argenti’s being
purely qualitative and, thus, unmeasurable.
The development of the so-called second generation took place from 1977 to
1979 (Hauff, 2010). Characteristics of the second generation, were the
extensions to chances and opportunities (Krystek et al., 2007), as well as the
extension of the planning horizon of the (operative) early recognition (Hauff,
2010). While the first generation only worked with annual plans and the
appropriate (internal) working indicators, in the second generation, indicators (as
instruments) were developed which were designed to identify longer-term,
internal and external changes (Hauser, 1989). Indicator-based early detection
(Concept of Krystek & Müller-Stewens, 1993) sends signals of relevant
events/developments with sufficient regularity and sufficient notice, where
‘external indicators’ are macroeconomic, market, technological, social and
political and ‘internal indicators’ are financial (KPIs), economic and employee-
related. This development led quickly to the understanding that this system can
recognize not only risks and dangers but also latent opportunities and chances
(Krystek et al., 2007). However, indicator-based EWS are founded on the concept
of directed search for changes, which hides the danger, that relevant changes
will not be recorded and that existing causal chains will be broken down.

87
Potentially relevant developments in unrecognized observation areas will not be
recorded. Hauser (1989) adds that the determination of indicators is often difficult,
as well as being impractical.
The (strategic) forecasting is mentioned as the third generation when describing
an additional development (Krystek et al., 2007). This has the additional goal of
early detection of risks and opportunities, as well as the initiation of appropriate
counteractions (Schlüter, 2004). Krystek et al. (2007) add that the Ansoff (1976)
Concept of "Weak Signals" is useable in this stage for the identification of Threats
and Opportunities from both the internal and external environment. All existing
strategic concepts, such as the concept of Kirsch and Trux, Concept of Battelle
Institute, or Concept of Hammer, are based on “Weak Signals”. To be able to
describe Ansoff’s concept (1976) in brief, firstly, the term ‘discontinuity’ should be
clarified. This can be described as "unpredictable, unforeseen, natural or man-
made sudden change, consequence, event, or force that confounds or disrupts
earlier expectations or estimates" (Business Dictionary, 2015). Kunze (2000)
describes it as radar, oriented to "shadows" or "weak signals", which signal
changes in the company environment. Kirschkamp (2007, p. 12) states that, "In
this context, discontinuities are most important and therefore, it is the first aim of
strategic early warning to detect ANSOFF's weak signals to inform the
management and to initiate change". Ansoff (1984, p. 483) describes "weak
signals" as "(…) a development about which only partial information is available
at the moment when a response must be launched if it is to be completed before
the development impacts on the firm". However, the first concept is based on
‘weak signals’, which Kirsch and Trux (1979) describe as Disperse-Suck-Filter-
System, with systematic recycling and automatic filter check. The process is:
Disperse, Suck, after filtering check for relevance, afterwards recycle by bringing
back this filtered information. This concept is purely theoretical (metaphor) and
strategic without concrete recommendations for its application, which makes it
difficult to use in practice. The Concept of Battelle Institute (1978), which is
often named in the literature as the first strategic radar approach is, in contrast,
based on dynamic-based environmental analysis, which is a whole business-
related monitoring system. It is divided into 5 steps: 1) sign-oriented
environmental analysis 2) comparison between strategy-planning and scenarios

88
3) evaluation of deviation 4) search for strategic treatment alternatives 5)
evaluation and decision about strategic treatment alternatives. Furthermore, the
Concept of Hammer (1998) which is divided into 5 phases: 1) observation via
scanning then recorded and afterwards monitored 2) analysis & evaluation of
potential impact, which is based on a mathematical or statistical method and will
be predicted by scenarios & comparison of strategic planning 3) verification by a
survey of experts for determination of potential impact, change & reaction 4)
development of strategies 5) implementation of strategies into concrete actions
(operative plans), is not completely different from the concept of Battelle Institute,
especially when looking at the linear prerequisites phases of strategic
recognition. The combination of subsequent phases, even if the detailed use of
tools is missing, is suggested by Hammer as the most appropriate approach in
practice. Additionally, his concept covers most requirements, cited in the
literature. The main criticism, which also exists in the literature, is the link to the
operative area, which Hammer himself even names as the most difficult part.
However, the tools which were used during the third generation are Diffusion
Theory, Creativity Methods, Trend Landscape, Cross-Impact-Analysis, Scenario
Analysis, SWOT Analysis, Strategic Planning and Portfolio Analysis, but for
special parts, such as scanning or for the link from strategic to operative, to name
but a few, tools are missing. This makes it especially difficult for SMEs to identify
the most appropriate elements.
The fourth and last generation, so-called ‘operative and strategic early
enlightenment’ is based on a holistic approach by the integration of both
‘operative’ and ‘strategic’ early recognition (Krystek et al., 2007). This stage is
also characterized by networked thinking and builds the basis of response actions
(Kirschkamp, 2007). As several authors have already pointed out, no holistic
approach exists (Bedenik et al., 2012; Purvinis et al., 2005; Kurschus et al., 2015).
It is the central rationale of this work to develop a holistic EWS by selection and
combination of appropriate tools. As also shown in figure 19 below, where an
overview of the tools used during the operative and strategic Concepts are given,
the related tools for a holistic Concept are unknown. This is within the operative
Concepts: KPIs, projections and indicators and also within the strategic
Concepts, when a part of the tools described above is missing: Diffusion Theory,

89
Creativity Methods, Trend Landscape, Cross-Impact-Analysis, Scenario
Analysis, SWOT Analysis, Strategic Planning and Portfolio Analysis.
Figure 19 Overview of tools used in previous concepts
Source: own illustration
However, as the existing literature is very limited to the general, and thus
relatively superficial, representation and, as the concepts were developed for the
application to many, if not all, types of enterprises and companies, it is really not
possible to fulfill the requirements of a holistic system, even not by linking already
existing ‘strategic’ and ‘operative’ EWSs, especially when also trying to cover the
practical aspect. This fact is apparent in Table 3, where only 2 of the 6 concepts,
which have not been devoted to pure quantification, as e. g. an insolvency model,

90
work on the topic of the EWS both in the theoretical sense, but also by providing
practical approaches such as the relatively precise function and description of its
parts (Krystek & Müller-Stewens, 1993, as well as Hammer, 1998). However,
these concepts also have a more one-sided view. Thus the work of Hammer
(1998) is very much focused on the strategic part of an EWS, while Krystek &
Müller-Stewens (1993) concentrate on to the operational view of the risks.
Hammer (1998) concentrates on giving a very detailed structure of how a
(strategic) EWS should look, but without taking into account how its so-called "5-
point plan", could be used in detail. In particular, the link from the strategic to
operative area is missing. Krystek & Müller-Stewens (1993), on the other hand,
are very focused on a key indicator and/or indicator-based EWS, which, however,
can only meet the almost operational requirements. This lack of depth in the
descriptions and implementation approaches is one gap that ultimately leaves a
lot of scope for individual interpretation or even intuition and is difficult to close
for the SME. I would like to close this gap in this work, not by giving a "handbook"
but at least a guide.
The generality of the literature leading to this topic is reflected, for example, in
Table 3. It is easy to see that most criteria are quite strictly separated from one
another. Among the most elementary separations in the subject EWSs are, from
my point of view:
- Theoretical and practical
- Operational and strategic
- Quantitative and qualitative
For a holistic and applicable EWS, however, it is impossible to avoid combining
these sub-areas with one another, and even fusing them, so that a smooth
transition from the strategic to operative area, which includes both quantitative
and qualitative aspects, would be possible. It is precisely the interplay and the
linking of the quantitative and qualitative areas that are particularly important to
emphasize. In the literature, these criteria are strictly and stringently assigned to
operational (quantitative) and strategic (qualitative). It is, however, a fact that
these factors are inseparable because (almost) every quality can be quantified
and (almost) every quantity describes a certain quality. The qualitative or

91
quantitative expression is therefore used, as quality can sometimes only be
expressed by several quantities, and vice versa.
To be able to start the development of a holistic EWS, where all relevant factors
and their interdependencies are able to be identified and dealt with (Kirschkamp,
2007), the requirements of an EWS will be identified, by answering the first
research question:
1. What are the requirements for a successful early warning system
(EWS) with respect to company crisis in SMEs within the food
production industry, as identified by turnaround / interim managers?
Based on the requirement findings, appropriate tools, which match the
requirements of a successful EWS, will be explored. This will include CO and QM
tools as best-practice elements, seeking to close the aforementioned gap. For
example, a tool for the link from strategic to operative, which this work intends to
solve by BSC, is completely missing during the previous concepts, which even
Hammer (1998) himself names as the most difficult part. This is, however, the
main criticism of Concept of Hammer (1998), even though Bertram (1993) states
that Hammer's concept is one of the most far-reaching considered, due its
detailed classifications and control function, as his concept covers most known
requirements from the literature. The BSC as a CO tool for example, which has
been mentioned too rarely in the EWS literature so far, is appropriate for use as
part of an EWS. On the one hand, it has a strategic orientation from the outset,
as it is based on the "vision" and "strategy", which are of purely qualitative nature.
In order to follow this vision and strategy and constantly review it, a connection
to operational key figures is required, which should be determined and developed
individually by each company. This is predominantly quantitative in nature but
may also have some qualitative approaches. There are already discussions about
the implementation of the BSC, whether it is sufficient as a stand-alone solution
for an EWS as it already covers many of the required areas - it is operational and
strategic, it is quantitative and qualitative, and it has a relation between product,
employees, finance and market. A counter-argument, however, is that the BSC,
is, for example, almost entirely devoid of consideration of the environment.

92
In order to facilitate and support the achievement of objectives, the QMS is
excellently suited, as it also includes both quantitative and qualitative aspects in
a balanced way. The advantage of a "symbiosis" of BSC and QMS is primarily
the fact that the QMS clearly defines the processes and the company structure in
advance. This results in a very high degree of transparency and efficiency in the
company, which, in turn, contributes significantly to the identification and
formulation of the BSC's vision and strategy and the definition of the relevant key
figures. The QMS also ensures a high-quality awareness and significantly
reduces the sources of errors and errors themselves, and thus contributes to a
high degree of risk prevention. The two components could be summarized, in
that, firstly, the BSC begins from a purely strategic, qualitative point, and closes
the loop by development of operative, more quantitative area, through which they
are examined, and achievement of objectives ensured. Both systems focus on
almost equal areas - on customers, processes, the market, and employees, but
with a complementary view. While the QMS ensures the efficiency and high-
quality requirements through detailed processes and high transparency, BSC
analyses the cause-and-effect relationship between all factors. In summary, it can
be said that the QMS is system-oriented and the BSC works as a result-oriented
system, and through this close and complementary structure, risks can be
detected quickly and appropriate reactions can be initiated simply and effectively.
However, an exploration of the most appropriate tools should be undertaken,
identifying those which match the requirements from the first research question,
as this work should include both the theoretical and practical part and at the end
deliver a guide for SMEs for the implementation and use of a holistic EWS.
In addition, if we now divide the EWS, according to Ansoff (1976), into the two
major areas of "scanning" and "monitoring", where the literature mostly covers
the "monitoring" area to a large extent, if not completely, but being able to
elaborate the area of "scanning" in the form of a guideline approach, we find a
gap (this work tries to solve it by PESTLE, named by Stewart & Rogers (2012) as
a key tool for scanning the environment) in the current literature during the
concepts for the use of tools for EWS. This is described in the literature as a
complex area with a diversity of different risk areas, which reflects the quite
incomplete elaboration and description of the numerous tools and methods for
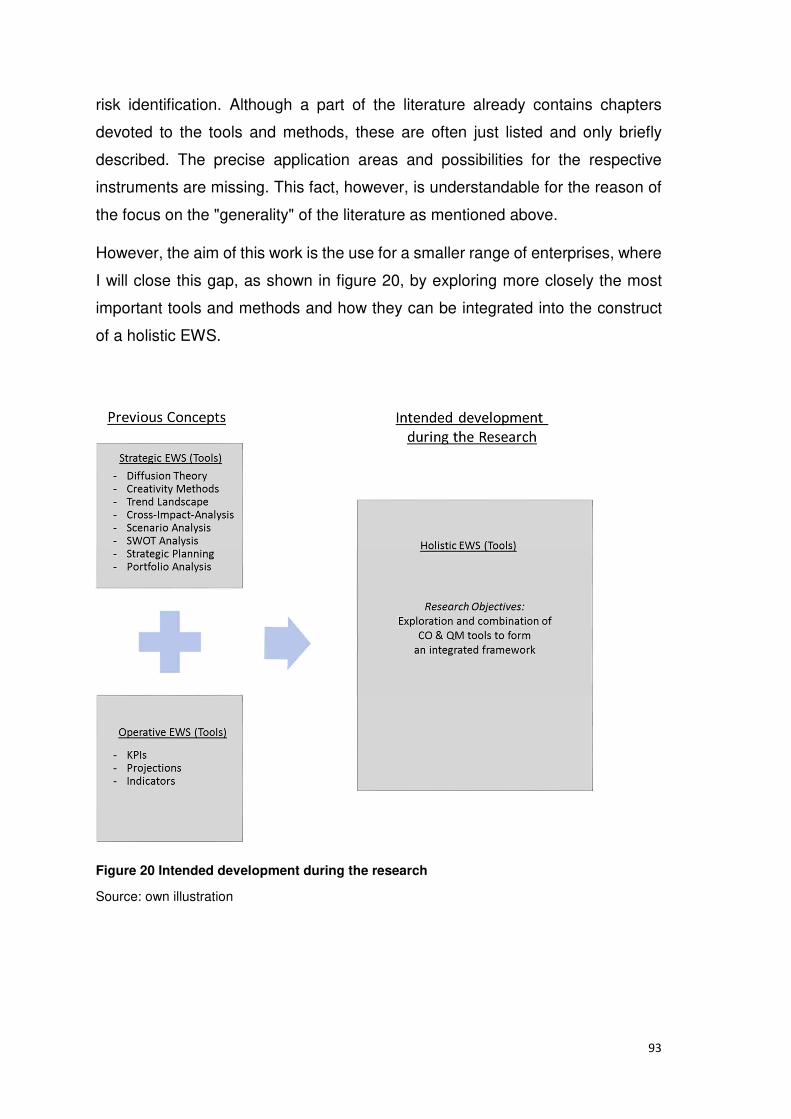
93
risk identification. Although a part of the literature already contains chapters
devoted to the tools and methods, these are often just listed and only briefly
described. The precise application areas and possibilities for the respective
instruments are missing. This fact, however, is understandable for the reason of
the focus on the "generality" of the literature as mentioned above.
However, the aim of this work is the use for a smaller range of enterprises, where
I will close this gap, as shown in figure 20, by exploring more closely the most
important tools and methods and how they can be integrated into the construct
of a holistic EWS.
Figure 20 Intended development during the research
Source: own illustration

94
To be able to fulfill this aim, it is necessary to answer the second research
question:
2. Which controlling (CO) and quality management (QM) tools are
appropriate for a successful EWS for SMEs in the food production
industry and how can they be combined to form an integrated
framework?
For this purpose, I will give an overview of the instruments that can be used
mainly in the German food production SMEs, which risk areas can be covered
and scanned, and then elaborate and verify the best-practice elements, also on
the basis of the conducted interviews.
If we now take a closer look at the gaps presented individually, it becomes clear
that in the literature "black-and-white thinking" prevailed. It was attempted to
divide the hard-to-grasp issue of an EWS into as many individual parts as
possible. These, however, cannot, and do not, have a smooth separation point,
and an attempt was made to make these sub-areas individually transparent,
comprehensible and applicable. This is a correct approach in a complex situation,
but the parts have to be reassembled afterward, so that the end product is
interlocked again and practicable, as otherwise, it becomes a non-applicable
theory object. This combination of the mostly theoretically described parts I would
like to make and detail in a certain kind of enterprise, by a detailed practical
recommendation. This is based on the two main areas of CO and QMS and is
supported by a pool of common tools and methods that are relevant for this
branch of business, which combine to form a practically applicable and effective
EWS.
To be able to cover also the practical and integrative approach, it is necessary to
address the third question:
3. Which tools can be used to anticipate and define a potential company
crisis in SMEs in the food production industry?
The aim is to provide a holistic EWS, which includes the following factors:
- Theoretical and practical

95
- Operational and strategic
- Quantitative and qualitative
Furthermore, it is the intention with this construct to build a baseline for further
research.
An overview of the three research questions and research objectives is shown in
Table 4.
Table 4 Research questions and research objectives
1. What are the requirements for a successful early warning system (EWS) with respect to company crisis in SMEs within the food production industry, as identified by turnaround / interim managers?
2. Which controlling (CO) and quality management (QM) tools are appropriate for a successful EWS for SMEs in the food production industry and how they can be combined to form an integrated framework?
3. Which tools can be used to anticipate and define a potential company crisis in SMEs in the food production industry?
1. to identify the requirements for EWSs in SMEs in the food production industry.
2. to explore CO and QM tools appropriate for an EWS for a German food production SME and to combine them to form an integrated framework.
3. to analyse implementation issues and considerations relevant to EWS tools in the food production SME context.
Research Questions
Research Objectives
The objectives are:

96
In the context of the framework developed from the results of the literature review
(Figure 18), the research questions and objectives can also be shown with
reference to what they specifically address. The first research question and
research objective aim to establish requirements for a successful EWS and
provide added knowledge on the objectives with regard to having a framework for
EWS building. The second research question and objective addresses points
concerned with knowledge creation on CO & QM tools, which match the
requirements of an EWS and their appropriate combination. The last question
and objective analyzes the practical and integrative approach, which builds a
contribution to practice. This is displayed in 1, 2 and 3 in Figure 21.
Figure 21 Conceptual framework - context of the research questions and objectives
Source: own illustration

97
This structured literature review on this given topic, the identified specific need
for research in this area, the other identified gaps in research as well as the
displayed connections between topics as displayed in Figure 18 and Figure 21
thereby demonstrate the initial contributions to knowledge and practice of this
thesis.

98
3 Research Methodology
In the literature, there exists only a little information about the existence,
implementation and, design of EWSs for the food production industry (Ruderer,
2009), which made it necessary to collect additional data in practice. This chapter
gives an overview of the applied methodology and methods for problem-solving,
as well as the selection of interviewees, and the analysis of results. Before
describing the research methodology and methods appropriate to this study, it is
appropriate to follow Kock`s (2007) suggestion, where he states that researchers
should be guided by a framework of appropriate methodology.
3.1 Philosophical Framework
The literature describes a wide range of frameworks for the classification of
philosophical paradigms, from which the researcher can select an appropriate
one (Kock, 2007). As the written products of all the efforts should be clearly
articulated for the reader (Huang, 2010), it could be done in the way of two
paradigms of positivism and constructivism by answering four philosophical
questions of: Ontology (What can be known?), Epistemology (What knowledge
can we get?), Methodology (How can we build that knowledge?), and Ethics
(What is the worth or value of the knowledge we build?) (Kock, 2007).
Constructivism is typically seen as an approach to qualitative research where the
goal is to rely as much as possible on the participants` views of the situation being
studied (Creswell, 2009). “Constructivism answers the methodological question
with two hypotheses, both recognizing (following the teleological hypothesis) that
we need knowledge, not just to understand, but also to build the reality we
experience: the principle of complexity and the principle of intelligent action”
(Kock, 2007, p. 73).
In contrast, Positivists rely on a traditional form of research, in which Causes
probably determine Effects or Outcomes, by careful observation and
measurement of the objective reality that exists in the world (Creswell, 2009).
However, the positivist research is seen as a method for testing and refining
hypotheses (Myers, 2013).

99
In a similar way to Huang, Ng & Coakes (2014) state that the researcher has at
first to choose a suitable research stance (core beliefs about the nature of things
in the world) which matches his beliefs of the world (ontology) and about how and
what the researcher chooses to define as ‘facts’ (epistemology). McNiff &
Whitehead (2010) narrow it down by describing Ontology as referring to a theory
of being, to do with identification of ourself in relation to others, followed by
Epistemology, which refers to knowledge, and asks what is known and how it
comes to be known, linking to Methodology and how things are done.
3.2 Research Methodology
3.2.1 Theoretical Position
Quinlan (2011) describes methodology as a way in which the research is carried
out followed by the means (methods) by which data is gathered for a research
project. Ng & Coakes (2014) conclude that methodology is a practical structure
based on ontology and epistemology close to the chosen methodology, methods
are tools for data collection. The methodology can be divided into qualitative,
regarding using words, and quantitative, regarding using numbers (Creswell,
2009).
As my personal view of society and organizations (ontology) and related
philosophical process (epistemology) relies more on the constructivism –
interpretivism, I prefer, as described by Ng & Coakes (2014), to immerse myself
in every part of my project, which aligns with the qualitative data research strategy
(Quinlan, 2011).
3.2.2 Qualitative Data
Qualitative research concentrates on the real world by observational data
collection methods and ‘interrogative’ methods of data collection, which are
exploratory or descriptive for researching complex issues (McGivern, 2013).
Myers (2013) is more precise by stating that Qualitative research is best if the
researcher wants to study a particular subject, especially when the topic is new
and not much literature exists on that topic.

100
McGivern (2013) states that qualitative research is appropriate for the
understanding of individuals and groups and why they think and behave in a
particular way. Huang (2010, p. 94) confirms this view in a very pragmatic
explanation: "Qualitative research is research about practice with practitioners".
Davies (2007) summarizes and explains that in qualitative research, the observer
is located in the world and interprets practical material, which makes the world
visible, thus transforming it.
“Qualitative methods are widely assumed to use qualitative data analysis and
induction“ (Wood & Welch, 2010, p. 59), where the theory is an outcome of
research (Brymann & Bell, 2003). Using inductive reasoning, research starts
‘bottom-up’ and begins with collecting data about the topic (Mayer, 2008).
The goal of this research was to explore and establish Controlling and Quality
Management tools for an EWS in the food production industry. Concepts and
interrelations were generated with the help of turnaround-, controlling-, and
quality management experts and then confirmed/refined and analyzed by
considering how they could be implemented in practice through the application of
case study research. To achieve these objectives of this research, this study
adopted a qualitative approach, involving an ongoing literature review, semi-
structured interviews, and two case studies.
Research plan
This research was split into 4 phases, which were developed sequentially.

101
Figure 22 Process map of research phases and their intended outcome
Source: Own illustration
Figure 22 shows the iterative research phases and the intended outcomes of
each, which will be described in brief.
The research started during Chapter Two with the initial literature review, where
the aim was to make explicit the philosophical stance taken in the development
of the early warning system.
The first phase during Chapter Four started with identification of the requirements
for a successful EWS from literature review, followed by the semi-structured
interview of three turnaround/interim management experts. The findings from the
102
theoretical and empirical area were compared, categorized and combined to form
a unified list. The outcome helped the author establish a basis from both points
of view, theoretical and practical, for the requirements which should be
considered during the development of an EWS for German food production
industry.
During the second phase in Chapter Five the unified list of the requirements from
phase one, which was the starting point for the third stage of literature review and
also for the semi-structured interview, was shown to the interviewees before
interview. It was important to explore CO and QM tools not only from the literature
but also from the empirical view as best-practice, with the help of two CO and two
QM experts, independent of the case companies, to establish appropriate risk
recognition factors of company failure and to match the requirements of a
successful EWS. Here were the findings from both sources defined, categorized,
compared and unified for the subsequent development of an EWS. The
aggregated results from the literature and interviews were integrated in Chapter
Six, where a holistic EWS was developed by the combination of the tools.
During phase three, in Chapter Seven, the developed model was shown to the
companies with the aim of analyzing the appropriateness of implementation and
use in SMEs, as well as for refinement. The two studies were within two separate
and independent medium-size companies. Both companies were German
producers of food with QM and CO departments.
During the fourth phase in Chapter Eight, the EWS was refined according to the
recommendations resulting from the Case Studies.
The four phases will be described in detail later; most of them, however, use semi-
structured interviews as their core data generation mechanism.
3.2.3 Semi-Structured Interview
The Semi-structured Interview uses the process of providing structure while
allowing improvisation, where the interviewee has the opportunity to add
important insights as they arise during the course of the conversation, while the
previously prepared questions offer a measure of focus (Myers, 2013). "If I

103
conduct an interview, I am a constructivist" (McNamee & Hosking, 2013, p. 55).
Saunders, Lewis, & Thornhill (2012) add, which makes sense to a constructivist,
that the Semi-structured interview is used to gather data that is normally analysed
qualitatively.
The Expert Interview is typically used for exploring a new field or for orientation
in an unstructured field (Bogner et al., 2009). Flick (2010) helps by describing
the Expert Interview as a specific form of applying semi-structured interviews,
representing a group of specific experts. Semi-structured interviews seem to be
appropriate to the chosen worldview of constructivism and to the complexity of
the topic, which can only be handled by having personal conversations with
experts.
Such an approach to interviewing enabled the author to address the complexities
of the topic through conversation with experts. It helped to identify requirements
of EWS, as well as to explore best-practice elements of controlling and quality
management tools for the development of an EWS in SMEs, which will be
explained in detail in the following sections:
Phase I: Identification of requirements for EWS
“The selection of expert-interviewees was based on purposive sampling” (Flick,
2010, p.168). An expert in this context could be defined as, “a person who is
responsible for the solution of the problem or who has access to information
needed for answering the questions” (Mayer, 2008). The experts here are either
employed as interim managers or as turnaround consultants/advisors in
struggling companies with more than five years’ experience in such roles. The
rationale for using interim managers or turnaround consultants is that, by virtue
of their professions, they will have seen more of this situation than most others.
Due to the author’s experience as manager and turnaround consultant in the
research area, access to a wide range of suitable interview candidates was
possible
Initially, three turnaround/interim management experts, shown in the table below,
participated in semi-structured interviews. Interviewing three respondents with
the described background provided adequate evidence regarding the

104
identification of requirements for EWS. The author concluded that interviewing
even more respondents from that sector would not provide any additional facts.
Date Interviewee Background
Interview
time
23.06.2015 Expert 1
Experience: Turnaround Consultant /
Interim Manager / Consultant for
EWSs
3h
26.06.2015 Expert 2
Experience: Turnaround Consultant /
Interim Manager / Consultant for
Excellence and Change Management
2h
25.06.2015 Expert 3 Experience: Turnaround / Interim
Management Advisor, Lecturer
2h
Table 5 Interviewees from Phase I
The structure (guideline) of the interviews was drawn from an ongoing systematic
literature review to inform topics to be addressed. The interview partners were
asked for their permission to conduct audio recording. The responses of the
interviewee in the face-to-face interviews were audio recorded and verified
directly after interviewing by playback of all answers. This method generated rich
data relevant to the research questions, which were exploratory in nature. As ISO
9001:2015 only came in in October 2015 and mandates a risk-oriented quality
management system, this research required an approach that was able to explore
tools that might not have been considered as relevant, or important, previously.
Therefore exploratory research offers a mechanism for considering the variations
of experiences to date.
The names of participants and companies were anonymized. Flick (2010) states
that all aspects of the research process have ethical implications, which he sees
as linked to the four items of non-maleficence, beneficence, self-determination
and justice. The research was conducted under the guidelines of “The University
of Gloucestershire’s Handbook of Research Ethics”. Participation was entirely

105
voluntary, and confidentiality was guaranteed for interviewees and participants in
the research.
Finally, I made sure that all research participants had the opportunity to review
their answers. Interview, protocol and other data is stored safely on the
researcher’s personal computer and will be destroyed after approval of the thesis
by the University of Gloucestershire (Argyris, 1982).
The interview data were translated and transcribed by the author. German was
used both for the interview questions and interviews, as German is the corporate
language within these companies. The data were analysed in 6 steps,
recommended by Mayer (2008), wherein the first step audio records were read
and transcribed to produce a report by marking text passages, which were
recognized as answers. This was followed by the categorisation of the answers
and, bringing data in a tabular format, the organizing of them by groups for
facilitation of comparisons. The purpose of categorisation and cross-tabulation
permitted the inspection of differences among groups and helped to determine
relationships between variables. The third stage was used for establishment of
internal logic between the individual pieces of information. After this, it was
possible to record the internal logic in a written form, where the classification of
the single items was detailed and specified further. In the fifth stage there followed
the establishment of analysis of text and interview excerpts, where finally, a report
including the opinions and interpretations together with recommendations or
suggestions for actions was developed.
Issues that emerge from the interviews were also examined within the literature
(Yin, 2014). The requirements for EWS were defined, categorised and compared
to those identified in the literature and then a unified listing was developed,
drawing on both sources. This was shown to the interviewee during Phase II.
Phase II: exploration of CO & QM tools, appropriate for recognizing risk
factors of company failure
The toolkit of CO and QM is very large and it was necessary, with the help of two
CO and two QM experts, independent of the case companies, to identify the most
appropriate, measurable by the company value, including shareholder value,
106
market value, customer value, people value and future value (Töpfer, 2000), for
EWSs, which matches the requirements identified by turnaround experts, interim
managers, lecturers and literature review. The experts here are either employed
as Controller or Quality Manager in companies, with more than five years’
experience in such roles. The rationale for using Controllers or Quality Managers
is that, by virtue of their professions, they are well able to identify the best-practice
tools appropriate for the described requirements.
A list of categories equal to those identified and defined in Phase I were shown
to informants before the interview. These requirements were worked out during
the literature review and interviews. Therefore, in particular, those described in
the following requirements for a practical EWS arise.
The requirements from Phase I, which an EWS in the Food Production Industry
has to fulfill, were named with the following main points by the Turnaround experts
and comply with literature review:
EWSs should:
- help recognizing risks timely and prevent them at an early stage.
- be holistic (strategic and operational) and practicable => not too complex.
- be future-oriented.
- include quantitative (hard) and qualitative (soft) factors.
- monitor all business areas.
- consider internal and external factors.
- be a top management information system – monitored by management.
- be designed for internal and external stakeholders with different reports.
- match characteristics of the company (culture, structure, size and type of
management).
- have responsibility for their suitability lodged with the management.
These were also confirmed by the CO and QM experts, summarized in the table
below.
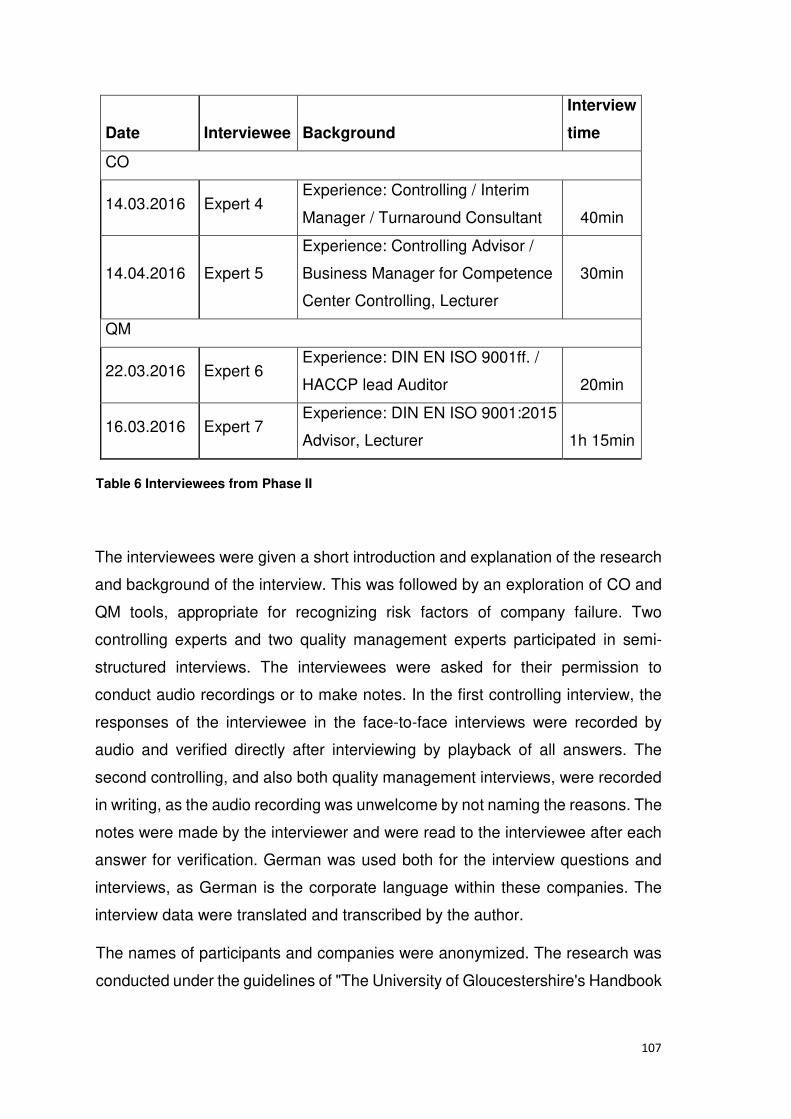
107
Date Interviewee Background
Interview
time
CO
14.03.2016 Expert 4 Experience: Controlling / Interim
Manager / Turnaround Consultant
40min
14.04.2016 Expert 5
Experience: Controlling Advisor /
Business Manager for Competence
Center Controlling, Lecturer
30min
QM
22.03.2016 Expert 6 Experience: DIN EN ISO 9001ff. /
HACCP lead Auditor
20min
16.03.2016 Expert 7 Experience: DIN EN ISO 9001:2015
Advisor, Lecturer
1h 15min
Table 6 Interviewees from Phase II
The interviewees were given a short introduction and explanation of the research
and background of the interview. This was followed by an exploration of CO and
QM tools, appropriate for recognizing risk factors of company failure. Two
controlling experts and two quality management experts participated in semi-
structured interviews. The interviewees were asked for their permission to
conduct audio recordings or to make notes. In the first controlling interview, the
responses of the interviewee in the face-to-face interviews were recorded by
audio and verified directly after interviewing by playback of all answers. The
second controlling, and also both quality management interviews, were recorded
in writing, as the audio recording was unwelcome by not naming the reasons. The
notes were made by the interviewer and were read to the interviewee after each
answer for verification. German was used both for the interview questions and
interviews, as German is the corporate language within these companies. The
interview data were translated and transcribed by the author.
The names of participants and companies were anonymized. The research was
conducted under the guidelines of "The University of Gloucestershire's Handbook

108
of Research Ethics". Participation was entirely voluntary, and confidentiality was
guaranteed for interviewees and participants in the research.
Finally, all research participants had the opportunity to review their answers.
Interview, protocol and other data is stored safely on the researcher’s personal
computer and will be destroyed after approval of the thesis by the University of
Gloucestershire (Argyris, 1982).
The data were analysed by reading and transcribing audio and written records to
produce a report by marking text passages, which were recognized as answers.
Followed by the categorisation of the answers and, bringing data in a tabular
format, organizing them by groups for facilitation of comparisons. The third stage
was used for establishment of internal logic between the individual pieces of
information. After this, it was possible to record the internal logic in a written form,
where the classification of the single items was detailed and specified further.
Finally, the explored CO and QM tools with the help of CO and QM experts were
finally defined and categorized in comparison with those identified in the
literature. The selection criteria evaluated not only whether, according to the
requirements from Phase I, the selected tools are needed, but also whether the
SMEs have the required resources and capabilities for their implementation
(Rocha-Lona et al., 2013).
Early warning systems, named by interviewees and related to the literature
review, could, according to the requirements from Phase I, include the following
tools:
- PESTLE
- SWOT Analysis
- Planning
- FMEA
- HACCP
- Turtle Diagram
- Fault Tree Analysis (FTA)

109
- Creativity methods
- BSC
which will be explained in detail during chapter 5.
The aggregated results of the interviews, as well as the tools from the previous
strategic concepts of Battele Institute (1978) and Hammer (1998), except Delphi-
Method (similar to Expert Survey named by Hammer), which are Cross-Impact-
Analysis, Portfolio Analysis, Diffusion Theory, Delphi-Method, Trend Landscape
and Scenario Analysis, were integrated into the corresponding chapter 4 / 5 and
built an important basis for the EWS approach in chapter 6, as well as for the
validation and final refinement. The aim of the interview was, additionally to the
theoretical basis, to consider the best-practice elements.
Afterwards, Popper`s approach was followed insofar as he suggests examining
interview data informally and using it to derive conjectures (Wood & Welch, 2010),
which link to the next step of Case Study, which was then used for analysing the
appropriate implementation and use in SMEs as best-practice elements designed
by Experts and literature review.
3.3 Case Study Approach
3.3.1 Theoretical Background
Before discussing the appropriateness of the case study research method for
confirmation and validation of best-practice elements identified through expert
interviews, it would be helpful to show the types, benefits, and risks of this
research approach. A lot of comments exist in literature and minds of researchers
about the aspects of case study research, especially what the near-synonyms
mean – single case, case work, case method, etc. (Gerring, 2009).
In a broad sense, a case study can be seen as the "main benefits in the structure
of knowledge for the development of an effective reasoning process, the
development of effective self-directed learning skills and increased satisfaction
with, and motivation for, learning" (Schwartz et al., 2002, p. 3). Yin (2009, p. 18)
defines Case Study as "an empirical inquiry that investigates a contemporary

110
phenomenon within its real-life context; when the boundaries between
phenomenon and context are not clearly evident; and in which multiple sources
of evidence are used".
A case study is about defining the topic, including the hypothesis and the set of
cases with their information (Gerring, 2009), which can be explanatory,
exploratory or descriptive case studies by answering the questions ‘What?’,
‘Why?’, and ‘How?’ (Yin, 2014). It may be understood as a single case which
refers to the analysis of a large/extreme case or as a multiple case which
incorporates several cases (Gerring, 2009). Yin (2014) states that even a single
case can be accepted, which statement needs a strong argument to counter
critics. "In sum, it is the choice of topic – not the method – that renders this genre
problematic" (Gerring, 2009, p. 210).
While some researchers link Case Study to qualitative research (Gerring, 2009),
Kumar (2011) states that quantitative design is also prevalent in the Case Study.
Myers (2013) refines this by the application of quantitative design for testing the
theory. Yin (2014), in contrast, does not distinguish between the various research
strategies regarding quantitative and qualitative research.
Case Study is about building theory by qualitative research, which is more
exploratory (to discover) or to test theory by quantitative research, which is more
explanatory (to test, explain, or to compare) research (Myers, 2013). Yin (2014)
concludes that some situations could be identified, where all strategies might be
relevant and, on the other hand, situations where two strategies might be
considered equally attractive.
However, the Positivist case study research is seen as a method for testing and
refining hypotheses (Myers, 2013), where, in contrast, constructivism is typically
seen as an approach to qualitative research, where the goal is to rely as much as
possible on the participants` views of the existing situation (Creswell, 2009).
There must be some general principles, where the researcher seeks to explain a
single outcome for a single case, “which may be understood as a study oriented
toward explaining the point score for a single case rather than a range of values
across cases, or a range of values occurring within a single case” (Gerring, 2009,
p. 187).

111
A single case refers to the analysis of a unique or extreme case, often
representing a critical case in testing a well-formulated theory, as well as the
revelatory case when an investigator has the opportunity to analyze a
phenomenon previously inaccessible to science inquiry (Verschuren, 2003). The
key here is to justify the choice with strong arguments for the reason to be able
to offer resistance (Yin, 2014). It would follow the explanation of Gerring (2009,
p. 209) that “if the within-case evidence is sketchy – if, for example, the case
might be constructed in a variety of different ways, each of which provides a
plausible fit for the theory and the evidence – then she may choose to place less
emphasis on these results”.
Multiple Case Study will, in contrast, be more powerful, where you have the
possibility of the replication of two or more cases, where the conduction of them
can require extensive resources and time, but where the decision to undertake
multiple studies decision in preference to single studies cannot be taken lightly
(Yin, 2014).
The single-, and multiple-, case studies reflect different design situations, where
within these two variants, there could be unitary or multiple units of analysis,
which can be characterised in four categories, each with two dimensions: single-
case (holistic) designs, single-case (embedded) designs, multiple-case (holistic)
designs, and multiple-case (embedded) designs (Verschuren, 2003).
"The holistic approach to research is once again more a philosophy than a study
design. You can use any design when exploring a situation from different
perspectives, and the use of multiple methods is prevalent and desirable" (Kumar,
2011, p. 129). Yin (2014) explains it in more detail, where he states that you can
use the holistic design when the case study examines only the global nature of
an organization or a program.
The embedded design, in contrast, can be a single case study as a program that
involves large numbers of funded projects, or an organization, including more
than one unit (Verschuren, 2003). “The individual cases within a multiple-case
study design may be either holistic or embedded. When an embedded design is
used, each individual case study may, in fact, include the collection and analysis

112
of quantitative data, including the use of surveys within each case” (Yin, 2014, p.
63).
The means of evidence-gathering depends on the type of information, which can
be obtained by interview, documents, newspaper, etc. (Kumar, 2011). Using
several different techniques in combination helps to avoid the loss of information,
which means the use of triangulating multiple sources of data (Saunders et al.,
2012). Gerring (2009, p. 4) in contrast argues that case study “should not be
defined by a distinctive method of data collection but rather by the goals of the
research relative to the scope of the research terrain”.
The advantage of a case study is that the researchers test or explore theories of
real-life situations, but particularly in a business setting, because firms may be
sceptical, it can be difficult to get access to a particular company or group of
companies (Kumar, 2011).
3.3.2 Case Study Approach applied to my Research Design
Yin (2014) explains that there is no formula to determine whether or not the Case
Study method is appropriate for the research. However, in order to answer
questions seeking to explain the present circumstances of ‘how’ or ‘why’, Case
Study research will be relevant. Furthermore, the need for an extensive
description of some phenomena makes this method appropriate (Gerring, 2009).
In considering the above explanation of Yin (2014), I have come to the conclusion
that I am also looking for the answers/ideas connected with the questions ‘WHY?’
(What are the requirements of an EWS/Why do companies fail?) and ‘HOW?’
(What are the best CO & QM elements for an EWS in SMEs?/How can company
risks and failure potentially be anticipated and prevented in SMEs?) I clearly
identified Case Study as an appropriate approach, especially for the kind of
knowledge of real-life, which Yin (2009) put at the heart of Case Study Research.
As a constructivist, I accept several definitions of the case study approach but
would base my strategy on Yin`s definition, where he points out that case study
is an inquiry and a research method, such as a survey or an experiment (Yin,
2014). The previous phases, including literature review and semi-structured

113
interviews, helped to identify requirements for EWS and explore CO and QM
tools, appropriate for recognizing risk factors of company failure. In the present
Phase III, two case studies have been used in order to confirm and refine best-
practice elements in EWSs.
The case studies were prepared by data gathering from the literature review and
the help of Turnaround, CO & QM Experts interviews, followed by practical
fulfilment of operational members' interview by case. "The sampling and
integrating further material is finished when the ‘theoretical saturation' of a
category or group of cases has been reached" (Flick, 2010, p. 119).
Phase III: Case Studies
Two studies were used in Phase III to confirm and refine best-practice elements
in EWSs (Yin, 2014). The two studies were within two separate and independent
medium-size companies. Both companies are German producers of food with QM
and CO departments: points which were important as selection criteria for this
research phase.
The first study was in a company “A”, which is specialized in food production
industry for fruit and vegetables. The second study was within an organization
“B”, which is also active in the food production industry, this time for milk products.
The studies involved three semi-structured interviews, shown in the table below,
per study of the senior management of relevant functions: quality, controlling and
the general management. The involvement of different functions had the
advantage of producing a discussion with the aim of analyzing the
appropriateness of EWS implementation from different points of view. German
was used both for the interview questions and interviews themselves, as German
is the corporate language within these companies.
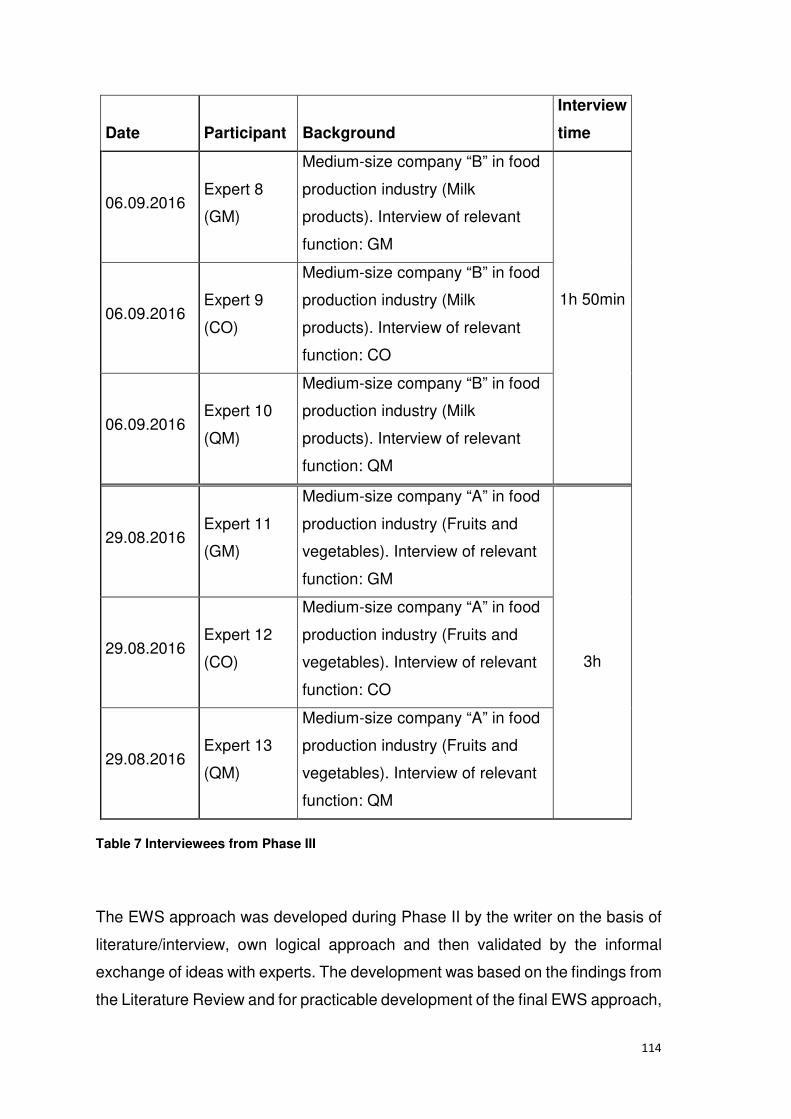
114
Date Participant Background
Interview
time
06.09.2016 Expert 8
(GM)
Medium-size company “B” in food
production industry (Milk
products). Interview of relevant
function: GM
1h 50min 06.09.2016
Expert 9
(CO)
Medium-size company “B” in food
production industry (Milk
products). Interview of relevant
function: CO
06.09.2016 Expert 10
(QM)
Medium-size company “B” in food
production industry (Milk
products). Interview of relevant
function: QM
29.08.2016 Expert 11
(GM)
Medium-size company “A” in food
production industry (Fruits and
vegetables). Interview of relevant
function: GM
3h 29.08.2016
Expert 12
(CO)
Medium-size company “A” in food
production industry (Fruits and
vegetables). Interview of relevant
function: CO
29.08.2016 Expert 13
(QM)
Medium-size company “A” in food
production industry (Fruits and
vegetables). Interview of relevant
function: QM
Table 7 Interviewees from Phase III
The EWS approach was developed during Phase II by the writer on the basis of
literature/interview, own logical approach and then validated by the informal
exchange of ideas with experts. The development was based on the findings from
the Literature Review and for practicable development of the final EWS approach,

115
with the help of CO and QM experts, best-practice CO and QM tools, appropriate
for an EWS within the food production industry, were explored. The developed
model was shown to the companies with the aim of analyzing the appropriateness
of implementation and use in SMEs of best-practice elements designed by
experts and literature review.
The interview partners were asked for their permission to conduct audio recording
or to make notes. The responses of the interviewees in the face-to-face interviews
were recorded by writing, as the audio recording was unwelcome – the reason
was not given. The notes were made by the interviewer and were read to the
interviewee after each answer for verification.
The names of participants and companies were anonymized. Yin (2014) advises
case study researchers, to work with special care and sensitivity, to gain informed
consent of participants, as well as to protect the privacy and confidentiality of the
participants. The research was conducted under the guidelines of “The University
of Gloucestershire’s Handbook of Research Ethics”. Participation was entirely
voluntary, and confidentiality was guaranteed for interviewees and participants in
the research.
Finally, I made sure that all research participants had the opportunity to review
their answers. Interview, protocol and other data are stored safely on the
researcher’s personal computer and will be destroyed after approval of the thesis
by the University of Gloucestershire (Argyris, 1982).
The data were translated by the author and analysed in 6 steps, recommended
by Mayer (2008). In the first step, written records were read and transcribed to
produce a report by marking text passages, which were recognized as answers.
Followed by the categorisation of the answers and, bringing data in a tabular
format, organizing them by groups for facilitation of comparisons. The third stage
was used for establishment of internal logic between the individual pieces of
information. After this, it was possible to record the internal logic in a written form,
where the classification of the single items was detailed and specified further. In
the fifth step followed the establishment of analysis of text and interview excerpts,
where finally a report including with the opinions and interpretations together with
recommendations or suggestions for actions were developed. The issues from

116
this phase were used for the refinement of the EWS for practical appropriateness
in Phase IV.
3.4 Refining
Phase: IV: Refining of the developed model
As Yin (2009) recommended further investigation and refinement of best
practices, subsequently, the aggregated results of the interviews were integrated
into the corresponding model by analytical consideration of the theoretical basis
and integration with the statements from practice. For this reason, the technical,
financial, organizational, and operational sight were taken into account. At the
end, this approach enabled the verification of a practicable EWS, which was
compared, validated and refined appropriately by suggestion for implication.
3.5 Minimizing bias
In all research, according to Pannucci & Wilkins (2010), “Bias”, described as
tendencies that prevent from unprejudiced reflection on a given issue, subject or
question, can occur at any phase of research, including study design or data
collection, as well as in the process of data analysis and publication. Miles et al.
(2014) states that bias should as far as possible be avoided. Voss et al. (2002)
add that risk of bias on the part of the researcher/observer can be minimised by
using triangulation and multiple case studies. Pannucci & Wilkins (2010) in
contrast, state that an appropriate research design can minise bias. Miles et al.
(2014) explain in detail, that especially the researcher has some opportunities to
avoid bias by, for example, including different positions from a company, keeping
questions firmly in mind during the interviews, making the intentions clear for
participants and clarifying things for the avoidance of misunderstandings.
Pannucci & Wilkins (2010), in conclusion, say that through understanding of bias,
such as selection bias, performance bias, etc., and how it affects study results,
enables the researcher to overcome it by designing the research accordingly.
The researcher tried to avoid all bias which could possibly occur during the
research. First of all, the qualitative research, by using semi-structured interview

117
as the method, enabled the researcher to explore all relevant details, clarify and
answer all questions, which arose during the interview. Furthermore, it was
possible for the researcher to focus, by using the semi-structered interview as a
guide, on questions during the interviews.
The consideration of different professional backgrounds was increased especially
by the choice of respondents for the first and second phase, thus different points
of view could be taken into account. During the first phase Interviewees with the
background of Tunaround Consultant, Interim Manager, Lecturer, Interim
Management Advisor were used and, during the second phase, those with the
background of Controlling, Interim Manager, Tunaround Consultant, Controlling
Advisor, Lecturer, Business Manager for Competence Center Controlling, DIN
EN ISO 9001 ff./ HACCP lead Auditor, DIN EN ISO 9001:2015 Advisor were
used.
Furthermore, by the choice of the case studies, by applying multiple case studies,
in this context it was arranged that the interviewees who participated were from
different positions within an organisation, such as Controlling, Quality
Management and General Management.
Finally, as it was a subsequent research study including an ongoing literature
review, it was able to compare the findings from different sources and additionally
verify daty by sequential phase.
3.6 Limitations
The results of this research are only applicable to the defined food production
industry sector; any transfer to other industries requires further investigation.

118
4 Phase I: Identification of requirements for EWS
Before best-practice CO and QM tools, appropriate for an EWS within the food
production industry, are explored with the help of CO and QM experts, first, the
requirements of an EWS will be identified by literature review and semi-structured
interviews with Turnaround and Interim Managers. This chapter answers the first
research question.
4.1 Literature review
The selection and practical development of the EWS used for the EWS-
development will be at first based on the findings from the literature review.
4.1.1 EWS – definition
An Early Warning System (EWS) can be defined as an information system
designed to warn companies when problems arise (Löhneysen, 1982) where
companies have to initiate counteractions (Götze & Mikus, 2000). Kästner (2012)
adds that an EWS should promptly predict factors which are important for the
development of company success. The aim of an EWS is to identify risks in real
time and give the company enough time to deal with them (Löhneysen, 1982).
Trustorff (2012) in contrast states that an EWS has to recognize the risk in the
formation phase. Ruderer (2009) goes one step further and claims that an EWS
has to work by making use of available information as early as possible, and so
accurately and comprehensibly predict the relevant variables of the company.
Bedenik et al. (2012, p. 672) conclude that "The role of early warning systems as
an instrument for crisis aversion is in: revealing weak signals, transferring
important information about environmental changes, prevention of business
crisis, and constructing a creative base for timely and appropriate response".
The Literature Review in Chapter 2 shows that numerous tools and methods
which try to cover the points mentioned above have already been developed but
it became clear that some gaps are still in existence. It is those gaps which this
work tries to fill by, firstly, attempting to establish a framework by identification of

119
requirements for the EWS as an important tool for risk and crisis identification. It
informs the user in time about latent (invisible but available) risks, which optimizes
control of the company (Romeike & Hager, 2013). It makes it possible for the
company to gain valuable time for an adequate reaction to imminent dangers,
using all possible measures (Ruderer, 2009). Early warning can be used as a
way of thinking which accepts the decisions and the possibilities of change as
well as the uncertainties in company and environment (Kloss, 1984), which is
especially relevant nowadays.
4.1.2 EWS – a topic in this day and age
Janßen & Riediger (2015) state that companies today have to identify risks which
were scarcely considered in the past. They add that due to globalization the
companies are much more affiliated with each other (the figure of multinational
companies has increased in the last 50 years from 7,000 to 104,000; it is
estimated that it will reach 140,000 by 2020) and increase the complexity of risk.
“Indicators and EWSs are becoming more important as they can predict possible
future changes in their early stages and thereby reduce the time needed to make
adequate decisions” (Bedenik et al., 2012, p. 672). The EWS is appropriate if it is
able to recognize risks correctly and early enough (Hillebrand, 2005) and this is
where its design plays an important role (Krystek, 1987).
As mentioned, the fourth and last generation, so-called ‘operative and strategic
early enlightenment’ is based on a holistic approach by integration of both
‘operative’ and ‘strategic’ early recognition. However, there is still no clear holistic
approach in existence.
4.1.3 Design of an EWS
The design of an EWS is subdivided into different areas, reasons/symptoms and
indicators, which will be summarized, wherein the first stage the monitoring area
will be determined then followed by the early warning indicator for each
monitoring area and the definition of the requisite size and tolerances (Krystek,
1987). Ruderer (2009) mentions the same three points and adds a fourth: the

120
definition of data processing. Furthermore, Trustorff (2012) states that for the
location and recognition of relatively weak signals, it is necessary to identify some
possible sources of the signals, e. g. journals, books, radio, TV, Internet, blogs or
social media.
The design of the system should include people, plants and the combination of
people and plants for a specific relationship (Löhneysen, 1982). These elements
record data, stimuli, impulse, signals and information about a specific situation or
development by analyzing them, measuring the probability of their occurrence
and determining the strength of their effect on the company (Hahn, 1979).
Ruderer (2009) adds that a modern EWS does not only predict as early as
possible the future development but is also an entry point for critical discussion
of cause and effect relationships, where the employees have continuously to deal
with changes occurring in the company environment. Argyris (1982, p. 38)
describes it as “a process in which people discover a problem, invent a solution
to the problem, produce the solution, and evaluate the outcome, leading to the
discovery of new problems”. This is followed by the explanation of “action” by
Sevón (1994, p. 2), which describes it as “the means by which a goal, which lies
in the surroundings of a though-action system, is achieved“. “Such analysis of
risk interactions can help managers understand that risk isn’t always what it
seems” (Hampton, 2009, p. 63). "This requires some analysis or understanding
of the new situation; it requires a background of knowledge or methods which can
be readily utilized; and it also requires some facility in discerning the appropriate
relationships between previous experience and the new situation" (Bloom et al.,
1956, p. 38).
The information about risk coming from different sources should be combined to
form a holistic system (Brühwiler, 2001). “Some companies have developed a
panel of early warning indicators, sometimes referred to as a risk dashboard, to
track movement in selected areas that are crucial to the company’s well-being.”
(Hampton, 2009, p. 63). Ruderer (2009) shares this view by stating that EWSs
are information tools, which have the aim to recognize the negative development
at an early stage so that the company has enough time for the reaction before
the damage sets in. Although a part of the literature already contains chapters
devoted to tools and methods, these are often just listed and only briefly

121
described. The precise application areas and possibilities for the respective
instruments are missing. However, the aim of this work is the use of an EWS for
a smaller range of enterprises, and this research seeks to fill this existing gap by
examining the most important tools and methods more closely and also how they
can be integrated into the construct of an EWS. For this purpose, I will give an
overview of the instruments that can be used mainly in the German food
production SMEs; which risk areas can be covered and scanned; and also
elaborate and verify the best-practice elements, also on the basis of the
conducted interviews.
Depré (2011) states that companies should pay attention to communication and
information policy where the information can come too late, not in accordance
with the required regulations, unauthorized, and with inappropriate
comprehension (too extensive, too tight). Kelders (1996) adds that for the
decision-making for recognized problems it is important to have processes for
information search. Good risk information can be used to develop early warning
systems that alert an organization to potentially dangerous situations (Hampton,
2009). The risk policy of the company has to be written down so that the
company's aims and expectations can be protected (Allenspach, 2006). The
participation of employees is also important in early warning systems, as the
system needs to match the characteristics of the company (structure, culture, size
and type of management) (Bedenik et al., 2012). Kloss (1984) states that the
environment and company give out recognizable signs, which should be noticed.
4.1.4 External / internal area
The first research work about “environmental analysis” came from Aguilar in
1967, where he constitutes the need for external review and monitoring by
dividing company environment into the following subsystems:
- Economic terms
- Technological terms
- Legal-political terms
- Socio-cultural terms

122
- Physical-ecological terms (Kunze, 2000).
The company has to fix the external and internal area of monitoring and, for each
area, there should be developed an indicator that sends a signal every time
access changes (Hauser, 1989). Löhneysen (1982) states that an EWS should
identify both internal and external dangers at an early stage. The operative EWSs
are based on KPIs relating to past performance, and the strategic EWSs predict
the future development of market, competitors, and company by supplementing
each other (Berndt, et al., 2011).
The scanning and monitoring should include the micro and macro environment
(Trustorff, 2012). Ruderer (2009) narrows it down by stating that the monitoring
area of an EWS should primarily focus on the external area including
macroeconomic, political, social and ecological environment by the inclusion of
the supplier’s sales market; on the other hand, the direction of an EWS concerns
the internal area marginals. Rieser (1980) adds the technological environment.
Berndt et al. (2011), in contrast, states that an EWS starts with the identification
and evaluation of risks in the operative area and communicating that information
to the central risk management. In this context, the question arises about where
and what could be possible sources of such information, especially for weak
signals. There are basic differences between internal and external sources
(Koslowski, 1994). Internal sources include primarily the controlling and
accounting. However, information from memos, reports and card files can be
helpful, as well as the knowledge and personal experience of corporate members
(Hauff, 2010). The external information gap about markets, competitiors,
economic cycle and law, is still big in SMEs and this is a latent danger for
decision-making. The manager should be aware of which information is
necessary, where the sources are for this information, and which methods can
provide this information (Mischon, 1982). External sources naturally include
newspapers, magazines or books, as well as information from seminars or fairs
(Röttger, 2005). However, weak signals can be seen as rooted in Ansoff’s (1976)
concept of the strategic early recognition, which will be explained below.

123
4.1.5 Strategic and Operational
Bedenik et al. (2012) describe "operational" early warnings as short-term oriented
and "strategic" early warnings as long term. Krystek & Müller-Stewens (1993)
explain it in more detail by differentiating between operational and strategic early
warnings which are based on short-term measures of success and mainly aim to
detect risks, whereas long-term objectives focus on profit and try to detect risks
and opportunities. There exist two ways of detecting the signs: Monitoring, which
is the analysis of the environment limited to single phenomena and Scanning,
which is the process of acquiring information (Kirschkamp, 2007). Kunze (2000,
p. 40) describes "environmental scanning" as "(…) the acquisition and use of
information about events and trends in an organization's external environment,
the knowledge of which would assist management in planning the organization's
future courses of action". Hillebrand (2005) states that scanning is the formal
scanning of the environment and the company with the aim of identifying the
"weak signals", which, afterwards, will be analyzed and completed by monitoring.
Monitoring analyzes the supposed change in detail and describes them together
with the prediction of potential consequences (Kunze, 2000).
The recognition of strategic risks will be accomplished by locating the sign of
discontinuous change, analysis and subsequent evaluation of its relevance
(Trustorff, 2012). With a strategic EWS it is more or less impossible to recognize
the signs by using indicators, which is the reason for the use of discontinuity which
also has the advantage of more time for counteraction (Hillebrand, 2005). The
discontinuity can be described as "unpredictable, unforeseen, natural or man-
made sudden change, consequence, event, or force that confounds or disrupts
earlier expectations or estimates (Business Dictionary, 2015). Kunze (2000)
describes it as radar, oriented to “shadows” or “weak signals” which signal
changes in the company environment. Kirschkamp (2007, p. 12) sums up thus,
“In this context, discontinuities are most important and, therefore, it is the first aim
of strategic early warning to detect Ansoff’s weak signals to inform management
and initiate change”. Ansoff (1984, p. 483) describes “weak signals” as “(…) a
development about which only partial information is available at the moment
when response must be launched, if it is to be completed before the development
impacts on the firm”.

124
Ruderer (2009) states that an EWS should be in use for both operational and
strategic areas. "Operational early warning deals with data of high concreteness
whereas strategic early warning deals with data of low concreteness"
(Kirschkamp, 2007, p. 13). The operational EWS tries to prevent crises by
frequently using instruments such as business ratios, projections, and indicators
(Kirschkamp, 2007). They are past-oriented, which has the disadvantage that
some risks can not be recognized in time. (Hillebrand, 2005). Trustorff (2012)
warns about the examination of operative and strategic risks regarding
independent reference parameters (potential for success versus operational
success), time horizon (long-term versus short-term) and target dimension
(strategic versus operational). In the long term, the threats of potential success
will affect the success and the liquidity situation of the company by wrong
strategic decisions or changes in the company environment going unremarked.
Conversely denoting a high operational risk potential produces a considerable
restriction of the scope of action for handling strategic risks. The survey by Roland
Berger, conducted in 2003, shows that in 2001 around 80%, and in 2003 around
70%, of the companies that experienced a crisis, identified the crisis for the first
time in the acute stage of a liquidity crisis, which is very late and costs valuable
time (Welsch, 2010). The beginning of a crisis lies a long time before the illiquidity
- in this book, “Modernes Sanierungsmanagement”, Crone & Werner (2012)
describe six types of crisis: stakeholder, strategy, product, success, liquidity crisis
and, finally, insolvency.
Bedenik et al. (2012) add that the global economic crisis should motivate
companies to use operational early warning systems as well as strategic, which
according to Ansoff (1976) means that when a threat/opportunity first appears on
the horizon, we must be prepared for very vague information, which will
progressively develop and improve with time.
4.1.6 Qualitative and Quantitative
Some signals, such as "weak signals" or "shadows" are usually measurable
qualitatively by the news, observation of events, people, organizations,
regulations or case laws (Kunze, 2000). Trustorff (2012) claims that strategic risk,

125
in contrast to operational risk, in terms of liquidity and success impact, can not be
measured and evaluated quantitatively. He says that the success potential
doesn`t belong to any stochastic regulation and only mathematically modellable
in accordance with the current state of research. Wiedmann (1984) adds that it
is important not only to look at quantitative but also qualitative aspects, which
demands holistic thinking. Furthermore, strategic risks, due to the high degree of
uncertainty, are difficult to quantify or calculate (Trustorff, 2012).
These highlighted points demonstrate that it is not enough to look only at financial
statements and financial ratios, because the management capabilities,
environment, human resources, ownership, and other qualitative factors are also
important for preventing failure (Kurschus et al., 2015). The combined set of
qualitative and quantitative factors allows identification of the real situation in the
company with regard not only to the financial statements but also to a wide variety
of factors related to company's management capabilities, competencies of
human resources, possible impact of internal and external environmental factors
and other important non-quantitative aspects, by supporting the company with
crisis identification (Kurschus et al., 2015).
“The ideal way forward for a successful handling of risk is a holistic approach, i.e.
an integrated approach taking all types of risk and their interactions into account”
(McNeil et al., 2015, p. 5). Several authors point out the need for a more holistic
approach including quantitative and qualitative factors (Bedenik et al., 2012;
Kurschus et al., 2015; Purvinis et al., 2005). The aim of this work, to develop an
approach that entails an optimum consideration of both quantitative and
qualitative factors, is to assist the management. A successful leader has to know
the company processes, constantly develop new goals, innovate, make sure that
the organization is still true to its core values, and continue to nurture a culture
that fosters continual learning (Frontiera & Leidl, 2012). To have the possibility of
overseeing the whole area he has to have an appropriate management system.
4.1.7 Responsibility of CEO
Monitoring is not a backroom function but instead an active process involving
managers at all levels who share an awareness of the risks that the organization

126
faces by providing them with necessary organizational flexibility (Bedenik et al.,
2012). Brühwiler (2001) adds that the CEO is responsible for the risk
management, which is the first step in any process or, to be precise, a
management process. According to COSO II, the management has the
responsibility for identifying all external and internal risks which could have an
effect on the strategy or company aim (Hillebrand, 2005).
Consistent with past studies, in his study, Abebe (2012) defines environmental
scanning as "the managerial activity of learning about events and trends in the
organization's environment". An EWS enables management to avoid the possible
crisis, as with the growth of uncertainty the gap between needed and available
time for business decision-making increases (Bedenik et al., 2012).
“The purpose of the early warning systems is to indicate all the possible changes
in the earliest crisis phase, in order for management to have enough time to
consider reactive activities and to provide the largest possible number of
measures available for countering the crisis, which increases the manager’s
sensitivity to changes” (Bedenik et al., 2012, p. 675). Pedler & Abbott (2013)
describe the connecting of feelings and lived experience with awareness of our
‘theory-in-use’ as ‘thinking on one’s feet’ by reflection-in-action that builds new
understandings which inform our actions in evolving situations. "This provides a
basis for future action and generates new or modified ideas in the process"
(Reynolds, 1998, p. 186).
In particular, Schön (1983) describes learning in and from work experience,
where practitioners reflect on their knowing-in-practice. This develops skills or
broader notions of competence (Reynolds, 1998). "A practitioner may reflect on
the feeling for a situation which has led him to adopt a particular course of action,
on the way he has framed the problem he is trying to solve, or on the role he has
constructed for himself within a larger institutional context" (Schön, 1983, p. 62).
However, by looking for a solution to a problem a practitioner has to stop and
think – to step back and reflect thoughtfully on his experience (Gosling &
Mintzberg, 2003). Schön (1983) adds that they seek to understand the situation
and change it. “This activity contains the famous planning tool Force Field
Analysis and is credited to Kurt Lewin, whose ‘field theory' described a field of

127
forces or pressures acting on any particular event. From this point of view, all
situations can be seen as being in temporary equilibrium, with the forces acting
to change the situation being balanced by the forces acting to resist change"
(Pedler et al., 2013, p. 130). Revans (1966) explains it in a very simple way by
the possibility of change for everybody after recognizing its necessity. Kurt Lewin
describes the change process in 3 phases, shown below,
Figure 23 Kurt Lewin's Change Model
Source: McAteer (2014)
where “the first phase of change is identified as unfreezing our normal or “current
state”, the second phase is changing, in which we begin our transition to a new
state of normal and the final stage we refreeze our new pattern and establish a
new mindset and a new normal" (McAteer, 2014).
Schön (1983) describes the reflection process as surfacing, testing and
evaluating intuitive understandings which are intrinsic to experience, where the
person is engaging in reflective conversation with the situation. Far-sighted
corporate management requires early information so that the company's
management has a larger field of action for crisis-prevention or opportunity
tackling (Jacob, 1986). The CEO has to set up appropriate reporting obligations
for the responsible divisions, which include all major risks and elements of risk
management and amendments thereto (Schmidt, 2015). "What is even more
important is that, in addition to developing such measures, they be a part of the

128
reports that reach top management so that awareness is created at the highest
level" (Gopinath, 2005, p. 26).
"In the SME sector, the company's crisis identification is specific because of the
nature of SME business management which creates the strong dependability of
business results on human resources and environmental factors" (Kurschus et
al., 2015, p. 152). Furthermore, the information search and information
processing expenditure is enormous, so that it is not manageable for SMEs for
the reason of lack of sufficient technological and human resources, in comparison
to big companies, to overview the whole area (Schlüter, 2004). The management
has to start with the company policy and strategic plan, reducing complexity, so
that the exploration of information could be found close to the symptoms, without
an endless search for alternative problems (Kelders, 1996).
4.1.8 Reasons and Symptoms
For the identification of risks the use of early warning indicators, which are
branch-, or company-, specific with the employees being sensitized to the critical
handling of recognized changes in the company and environment, is appropriate
(Ruderer, 2009). Early warning indicators can be considered as diagnostic signs
for detection of hidden events, which could be various kinds of positive and
negative trends or developments in the environment (Rothwell, 2010).
Krystek et al. (2007) explain that early warning indicators have to fulfill some
demand and demonstrate the following attributes: singularity, completeness,
timely availability of information and economic justification. "These are the
measures which, after surpassing certain previously set boundaries indicate the
occurrence of change and development of new trend; they represent signals of
possible upcoming crisis, but cannot predict the magnitude and time of indicator
materialization and impact on the firm" (Bedenik et al., 2012). Töpfer (1999)
explains it in more detail where he structures the early warning indicators in three
stages: early recognition, early awareness, and early warning.
In previous research it was shown that the most frequent use is still for operational
early warning indicators, focusing on profit margin and firm liquidity level, while

129
competitor and branch analysis, as strategic early warning instruments, are
neglected (Bedenik et al., 2012). “The financial statements of a small company
might show stable performance, but the change of some environmental factor
might force significant changes in the company’s finances” (Kurschus et al., 2015,
p. 154).
The concept of strategic early warning systems can be seen as rooted in Ansoff’s
(1976) concept of weak signals, which are inadequately defined and vaguely
structured pieces of information, which forewarn of the occurrence of strategic
discontinuities (e. g. changes of trend). “The concept of weak signals is based on
the assumption that discontinuities in technological, economic, social and political
environment do not appear at random, neither are they unpredictable, but rather
that they can be spotted by means of weak signals, since such discontinuities are
set in motion by people and their interests” (Bedenik et al., 2012).
Allenspach (2006) defines risk as the possibility, which in the context of goal
achievement processes – due to success factors such as interference processes
– affects the result of the underlying expectations. The success factors of a
company, as shown by Crönetz et al. (2009), consist of market, company
background/identity, continuous improvement, resource, structure, processes,
competence, aims, and strategy, which have to be monitored. Bedenik et al.
(2012) conclude that early warning indicators constitute a critical business
success factor and companies will be more successful if they use them. Early
warning indicators are therefore quantitative and qualitative auxiliary values,
supporting a company by identifying risks and possibilities at an early stage
before they become apparent (Töpfer, 2000). Kirschkamp (2007, p. 13) states,
"A holistic view is used where all relevant factors and their interdependencies
have to be identified and dealt with".
However, an appropriate way of dealing with them is an additional level of
consideration, known as Critical Reflection, and is used to identify good practice
through a deeper and more intense probing into practice and by challenging
practitioners to emancipate themselves from restrictive views and to provoke
direct action (Pedler & Abbott, 2013). Reynolds (1998), in particular, thinks that
Critical Reflection is the cornerstone of emancipatory approaches to education

130
and practice, being a radical pedagogy for the examination of social and political
processes, involving an analysis of power and control within the task or problem.
Rigg & Trehan (2008) describe Critical Reflection as a process by which adults
identify the assumptions governing their actions, locate the historical and cultural
origins of the assumptions, question the meaning of the assumptions, and
develop alternative ways of acting, which may also include new understandings
brought about by becoming conscious of their social, political, professional,
economic, and ethical assumptions. Sambrook & Stewart (2000) add four
activities, central to Critical Reflection: the assumption of analysis, contextual
awareness, imaginative speculation, and reflective skepticism.
Pedler & Abbott (2013) give an overview of three levels of reflection: Effective
Practice, which can be described as technical reflection based on the expert
knowledge of the practitioner; Reflective Practice, where ideas develop through
personal experience to create ‘hindsight’ by reflection-on-action, which is carried
out after the event or by building new understandings that inform our actions in
evolving situations by reflection-in-action; and Critical Reflection, which is
characterised by a deeper and more intensive probing into practice as shown in
the following table:

131
Initial stage:
Effective
Practice
(Technical
Reflection)
Development
stage:
Reflective
practice
Critical stage:
Critical reflection
Knowing The theory of
action learning
advising…
The theory in
relation to my
practice
The theory in relation to
new possibilities for
emancipation
Doing Imitating other
action learning
advisers
Questioning
the rules and
methods of
action learning
Questioning self and
the ends and purposes
of action learning
Being … In relation to
me as expert
practitioner
… In relation to
me as
reflective
practitioner
… In relation to me as
emancipatory
practitioner
Table 8 Reflecting on Knowing, Doing and Being
Source: Pedler & Abbott (2013)
In a practitioner's reflective conversation, where he is a part of it, he acts as an
agent or experiment by including his own contribution, which may foil his projects
and reveal new ideas (Schön, 1983). Gosling & Mintzberg (2003) put the ‘self' as
a subject for reflection, where, through the process of change, action pulls
together relationships, organization, self and context. The basis is that analysis,
intervention, organization theory and intervention theory combine together
(Cremer, 1980).
“Intervention produces practical improvements” (Huang, 2010, p. 100). There can
be no insight without self-knowledge. “Through the unintended effects of action,
the situation talks back – the practitioner, reflecting on this back-talk, may find
new meanings in the situation which lead him to a new reframing” (Schön, 1983,
p. 135). At the end, it is not only the absence of an EWS which causes a corporate
crisis but also its unsuitable integration into the company (Berndt, 2011).

132
4.1.9 Integration of EWS
Ruderer (2009) assigns the EWS to the risk identification process phase and also
includes the risk handling process for the reason that after prediction and
clarification activity it also initiates the counteraction by the decision makers.
Crönetz et al. (2009) state that the EWS is the original form of risk identification.
The phase of risk identification includes the collection of actual and future
(potential and latent) risks, which is the most important step during risk
management, where the result of this stage is essential for all following steps
(Krystek & Fiege, 2015). Breitkreuz & Lange (2011), in contrast, say that EWS is
a main tool of crisis management. EWS is a "Before Fact Approach", and crisis
management is an "After Fact Approach" (Wiedmann, 1984). Crönetz et al.
(2009) add that EWS works as a preventive in crisis avoidance and crisis
management serves to overcome an already existing crisis. Krystek (2015)
explains it in more detail where he names the avoidance of crisis as Active Crisis
Management, subdivided into Accrual and Preventive Crisis Management, and
the Handling of Crisis as Reactive Crisis Management, which is subdivided into
Repulsive and Liquidative Crisis Management – as already discussed in Chapter
2.3.
The main point here is to identify the right problem, the variety of the
recommendations for measurements can follow afterwards (Crönetz et al., 2009).
Following the main problems by the establishment of an EWS, where the
determination of them as critical for the countable monitoring area as well as the
definition of the early warning indicators are huge challenges (Ruderer, 2009).
"Board members, CEOs, and divisional directors are the main users of early
warning systems, while the lack of experts for gathering and analysis of
indicators, as well as the absence of management initiatives, are the crucial
reasons for deficiency in early warning systems implementation" (Bedenik et al.,
2012, p. 672). EWS plays an important role for company risk management and
by the integration and sensitization of employees in the critical handling process
to the recognition of internal and external changes, provides a huge contribution
to the establishment of a risk culture (Ruderer, 2009).

133
However, the literature discusses different approaches for the integration of EWS,
where the authors described it variously as a part of Risk Management, Crisis
Management, Compliance System (Laue & Kunz, 2014), Controlling System or
as standalone (Meier, 2007), etc. This work is based on the recommendations of
the ISO 31000 (combination of subsystems) and relies on the CO and QM
system, which focus on the Committee of Sponsoring Organizations of the
Treadway Commission (COSO) II principles I and II. According to the description
of Inderst et al. (2013) the term "risk identification" will be used in this work as
having the same meaning as EWS. COSO is a valid worldwide framework for
internal control and appropriate for improving corporate governance in Germany
(Löw, 2008). According to the "Business Judgement Rule" the General Manager
and the Board of Directors have to furnish proof that, at the time of making a
decision which brought the risk for business, they had a basis of appropriate
information (Inderst et al., 2013). The principles I and II of COSO II are to identify
all possible occurrences, without risk evaluation, which could have a positive or
negative effect on the execution of strategy or achievement of objectives
(Hillebrand, 2005). The risk identification should include all risks which need to
be considered during the decision-making process by the management (Schmidt,
2015). It has to sample all possible information about known and unknown risks
and to summarize them (Altenähr et al., 2009).
Rocha-Lona et al. (2013) recommend during the selection criteria process not
only to evaluate whether the selected tools are needed, but also whether the
SMEs have the required resources and capabilities for the implementation. The
information search process of a company has to be realistic, clear and simple
(Kelders, 1996). Also Donnersmarck & Schatz (1999) state that it is important to
focus on organizational, communicative and human aspects and to avoid strong
hierarchical structure.
However, an EWS has to predict the future of a company’s relevant variables
- as early as possible
- as accurately as possible
- as comprehensibly as possible

134
and the employees are to be sensitized to the critical handling of the recognition
of changes in their area (Gleißner & Meier, 2001). Practice means working with
other people in sets and including one's personal reflective practice (Pedler &
Abbott, 2013). Weick et al. (2005) narrow it down further by stating that Practice
is equated with doing, concreteness, understanding, know-how, and wholes as
opposed to Theory which is equated with thinking, explanation, knowing, and
dissection into parts.
It is important to have a common understanding of risk management and the tools
and processes, which describe and control the risks (Brühwiler, 2003). He adds
that the understanding of risk management begins with the recognition that the
most of the risks are "home made" by human characteristics, which could be, for
example, the wrong estimation of future development or missed monitoring of
exposed tasks, or of being too ambitious or too self-confident (Brühwiler, 2003).
In the end, the adoption of a management system has to be a strategic decision
for an organisation to help to improve its overall performance and provide a
sound basis for sustainable development initiatives, where the design and
implementation will be influenced by its varying needs, objectives, products
provided, processes employed and the size and structure of that organisation
(Tricker, 2014).
4.2 Semi-structured Interview
In addition to the requirements listed above, for the practicable development of
the final EWS, the requirements of the interviewees should also be considered.
These requirements were worked out during the interviews. The points described
in the following requirements for a practical EWS arise from this.
The following main requirements for an EWS in the Food Production Industry
were given by the Turnaround Consultants, Lecturers and Interim Managers
(Interview answers from Phase I):

135
4.2.1 Early Warning Systems - a topic in this day and age
The Literature Review states that companies today have to identify risks which
were scarcely considered in the past (Janßen & Riediger, 2015). The second
interviewee pointed out that the (working) world is becoming increasingly
complex: inconstant, uncertain, ambiguous and a complex environment and the
only way to respond to such developments in good time, without trying to
dominate the uncertainty, is to recognize risks in a timely fashion and prevent
them at an early stage. This is in line with the literature, where Janßen & Riediger
(2015) state that due to globalization, companies are much more affiliated with
each other (the number of multinational companies has increased in the last 50
years from 7,000 to 104,000; it is estimated that it will reach 140,000 by 2020)
and increase the complexity of risk. However, the aim of an EWS is to identify
risks in real time and give the company enough time to deal with them
(Löhneysen, 1982).
The third participant added that EWSs help to detect crises and counter them in
order to control early on, which increases the possibility of protecting assets and,
in the end, of securing jobs. Löhneysen (1982) describes the EWS as an
information system designed to warn companies when problems arise where
companies have to initiate counteractions (Götze & Mikus, 2000). The first
participant summed up with the statement that they have to meet the
requirements of risk management and help to connect to the future through
information sampling. The mentioned connection to the future equates to those
identified in the literature review by Bedenik et al. (2012, p. 672) that “Indicators
and EWSs are becoming more important as they can predict possible future
changes in their early stages and thereby reduce the time needed to make
adequate decisions”. However, it should be re-emphasised that the theory also
identifies methods within the EWS, such as Business Ratios, which are only past-
, or present-, based and also the classic Bookkeeping which includes the
disadvantage of time lag.
All interviewees confirmed that EWSs are definitely an important topic in the Food
Production Industry. They state that it helps to prevent large-scale disease by the
improvement of information on, and thus prevention of, health hazards that are

136
causally attributed to food consumption. Bedenik et al. (2012, p. 672) conclude
that "The role of early warning systems as an instrument for crisis aversion is in:
revealing weak signals, transferring important information about environmental
changes, prevention of business crisis, and constructing a creative base for timely
and appropriate response". It makes it possible for the company to gain valuable
time for an adequate reaction to imminent dangers, using all possible measures
(Ruderer, 2009). The third participant stated that to be able, in both a timely and
complete way, to protect the health of consumers, the company has to get
warnings on prominent food and possibly product recalls of dangerous food and
animal feed. The theory confirms this view by the description that an EWS is an
important tool for risk identification, where it informs the user in time about latent
(invisible but available) risks, which optimizes control of the company (Romeike
& Hager, 2013).
4.2.2 Requirements which an EWS in the Food Production Industry has to
fulfill
All participants pointed out that EWSs should be holistic (strategic and
operational) and practicable – so not too complex! The literature review explains
this in more detail and warns, Trustorff (2012), about the examination of operative
and strategic risks regarding independent reference parameters (potential for
success versus operational success), time horizon (long-term versus short-term)
and target dimension (strategic versus operational). In the long term, the threats
of potential success will affect the success and the liquidity situation of the
company by wrong strategic decisions or changes in the company environment
going unremarked. Conversely, denoting a high operational risk potential
produces a considerable restriction of the scope of action for handling strategic
risks. The first interviewee stated that it is not enough to collect pure economic
figures. Also Kurschus et al. (2015) state that it is not enough to look only at
financial statements and financial ratios, because the management capabilities,
environment, human resources, ownership, and other qualitative factors are also
important for preventing failure. Trustorff (2012) claims that strategic risk, in
contrast to operational risk, in terms of liquidity and success impact, can not be
measured and evaluated quantitatively. He says that the success potential

137
doesn`t belong to any stochastic regulation and is only mathematically modellable
in accordance with the current state of research. The combined set of qualitative
and quantitative factors allows identification of the real situation in the company
with regard not only to the financial statements but also to a wide variety of factors
related to company's management capabilities, competencies of human
resources, possible impact of internal and external environmental factors and
other important non-quantitative aspects, by supporting the company using crisis
identification (Kurschus et al., 2015).
The interviewee added that companies need market information – “if I do not
every day check the direction in which the values go, I have a problem relatively
quickly”. All participants revealed that they need business numbers, production
figures and the forecast of changes that can be expected in their industry in the
future. The literature review explains it in more detail by describing the design as
a system, which should include people, plants and the combination of people and
plants for a specific relationship (Löhneysen, 1982). These elements record data,
stimuli, impulse, signals and information about a specific situation or development
by analyzing them, measuring the probability of their occurrences and
determining the strength of their effect on the company (Hahn, 1979). The first
interviewee indicated that they have to bring in the information that is important
for their business to the manager every day. According to the theory the
information about risk coming from different sources should be combined to form
a holistic system (Brühwiler, 2001). “The ideal way forward for successful
handling of risk is a holistic approach, i.e. an integrated approach taking all types
of risk and their interactions into account” (McNeil et al., 2015, p. 5).
All participants summed up with the statement that a Comprehensive Early
Warning System consists of three areas: strategy, performance, and operational,
financial, economic area. They should include quantitative (hard) and qualitative
(soft) factors, which have to be future-oriented. Wiedemann (1984) adds that it is
important not only to look at quantitative but also qualitative aspects, which
demands holistic thinking. Furthermore, strategic risks, due to the high degree of
uncertainty, are difficult to quantify or calculate (Trustorff, 2012). Some signals,
such as "weak signals" or "shadows" are usually measurable qualitatively by the

138
news, observation of events, people, organizations, regulations or case laws
(Kunze, 2000).
4.2.3 Business areas which an EWS should be able to cover
The first interviewee stated that Early Warning Systems should have an
integrated financial Controlling system so that the interaction between strategic
and operational corporate management can be monitored and evaluated
interactively. This is in line with the results of the literature on curtailment of the
time lag by Controlling (Meier, 2007 or Hauschildt & Leker, 2000) and in line with
the central rationale of this work to develop a holistic approach.
The second participant, in contrast, stated that the internal and external risks for
all business processes and relevant support processes must be taken into
account. Also, the literature review states through Löhneysen (1982) that an EWS
should identify both internal and external dangers at an early stage. The first
research work about “environmental analysis” came from Aguilar in 1967, where
he constitutes the need for external review and monitoring by dividing company
environment into the following subsystems:
- Economic terms
- Technological terms
- Politico-legal terms
- Socio-cultural terms
- Physical-ecological terms (Kunze, 2000).
The company has to fix the external and internal area of monitoring and, for each
area, there should be developed an indicator that sends a signal every time
access changes (Hauser, 1989). Löhneysen (1982) states that an EWS should
identify both internal and external dangers at an early stage. The operative EWSs
are based on KPIs relating to past performance, and the strategic EWSs predict
the future development of market, competitors, and company by supplementing
each other (Berndt, et al., 2011).

139
The third interviewee added that the Financial Economic Area, liquidity sizes,
centralized Profit & Loss sizes, working capital - no area can be outsourced. All
participants confirmed that all business areas have to be monitored. The manager
should be aware which information is necessary, where the sources are for this
information and which methods can provide this information (Mischon, 1982). The
second interviewee pointed out that the necessary risk indicators must be
identified, properly selected and analyzed and evaluated iteratively. The third
interviewee added that it must first be created and later observed, what is
important for the company, for each sector, and this is of paramount importance.
The second summed up by saying that the whole thing will need effective and
efficient communication to internal and external areas. The literature review
confirms this view in Ruderer (2009) that a modern EWS does not only predict as
early as possible the future development but is also an entry point for critical
discussion of cause and effect relationships, where the employees have
continuously to deal with changes occurring in the company environment.
4.2.4 Priority which an EWS should have in a company
The second interviewee indicated that an EWS should hold an independent
position in a company, where neutral analysis and assessment is possible. The
second participant, in contrast, stated that it should be a top management
information system – monitored by management. This generally corresponds to
the literature review in Bedenik et al. (2012) that monitoring is not a backroom
function but instead an active process involving managers at all levels who share
an awareness of the risks that the organization faces by providing them with
necessary organizational flexibility.
The second interviewee gave an example of Employee Fluctuation, which is an
important parameter and is not anchored directly in the financial management
area originally, but in the power economic sector in human resources. He stated
that this could consider a million things and then be configured accordingly. Also,
literature review states in Brühwiler (2001) that the information about risk coming
from different sources should be combined to form a holistic system. All
interviewees summed up with the statement that in the end, the CEO must have
140
a Management Cockpit, which shows him what happens daily and where the
bottlenecks are, and where he has to intervene or respond. This is in line with the
results of the literature review, where “Some companies have developed a panel
of early warning indicators, sometimes referred to as a risk dashboard, to track
movement in selected areas that are crucial to the company`s well-being”
(Hampton, 2009, p. 63). This is in line with the work of Frontiera & Leidl, (2012)
in which they describe the need for a successful leader to have an appropriate
management system in order to be able oversee all necessary areas.
4.2.5 Stakeholders by whom it should be agreed
All interviewees stated that EWSs should be designed for internal and external
stakeholders with different reports, ideally based on central systems. This is in
line with the literature review, that early warning system has to fulfill some
demand (Krystek et al., 2007). They added that the processes could possibly be
extended to external suppliers and their value-added processes; other risks,
barriers to trade or from natural disasters should be checked and adapted if
necessary. This is even though, according to the theory, the external information
gap about markets, competitiors, economic cycle and law, is still big in SMEs,
which is a latent danger for decision-making.
All participants stated that the data should be prepared in accordance with
demand, especially in small businesses. In general, this corresponds with the
literature review that the information search and information processing
expenditure is enormous, so that it is not manageable for SMEs because of lack
of sufficient technological and human resources, in comparison to big companies,
to overview the whole area (Schlüter, 2004). The third participant added that top
management is interested in liquidity figures; the Production Manager is
interested in machine runtimes OEE (Overall Equipment Effectiveness). He
indicated additionally that timely data delivery also creates transparency and trust
towards shareholders or lenders. Gleißner & Meier (2001) state that an EWS has
to predict the future of a company`s relevant variables as early as possible, as
accurately as possible, as comprehensibly as possible and that employees are to
be sensitized to the critical handling of the recognition of changes in their area.

141
4.2.6 Software appropriate for an EWS
All participants confirmed that standard tools or software à la SAP for SMEs is
not known - there are mostly self-made solutions. This generally corresponds to
the literature review, that the recommendation is, in general, to use the Office
applications (Ruderer, 2009), such as Excel, Visio, etc., as no EWS software,
appropriate for SMEs, exists.
4.2.7 Persons who are responsible for the appropriateness of the EWS
All interviewees agreed that the responsibility for the suitability of an EWS is
definitely a management matter and is to be established accordingly at the
highest decision-making and control level. This is in line with the literature review
that the CEO is responsible for the risk management, which is the first step in any
process or, to be precise, a management process (Brühwiler, 2001). They stated
that it is important to understand that the property, resource, communication-
oriented and timely handling of the relevant risks only work if the roles and
responsibilities are clearly defined and are embedded in the organizational
structures of the company. This generally corresponds to the literature review that
the CEO has to set up appropriate reporting obligations for the responsible
divisions, which include all major risks and elements of risk management and
amendments thereto (Schmidt, 2015).
All participants indicated that it must be initiated top-down, and thus the
responsibility lies somewhere in the management. The third interviewee
commented that it could be located at the "Head of Controlling" but that the
commitment should come from the management. What is even more important is
that, in addition to developing such measures, they be a part of the reports that
reach top management so that awareness is created at the highest level”
(Kurschus et al., 2015). The first interviewee, in contrast, stated that it could be a
range, depending on CEO, CFO, IT and which one has the experience, to select
and create a list of requirements under normal circumstances, where the
company has to decide what it wants to achieve, what needs should be included,
how flexible and transparent it needs to be, and how safe it must be afterwards.
This is in line with the literature review, where it states that the adoption of a

142
management system has to be a strategic decision for an organisation that can
help to improve its overall performance and provide a sound basis for sustainable
development initiatives, where the design and implementation will be influenced
by its varying needs, objectives, products provided, processes employed and the
size and structure of that organisation (Tricker, 2014).
The above set of requirements will be used for the development of an EWS
approach for SMEs within the food production industry.

143
5 Phase II: Exploration of CO and QM tools
Based on the findings of the Literature Review and for practicable development
of the final EWS approach, with the help of CO and QM experts, best-practice
CO and QM tools, appropriate for an EWS within the food production industry,
will be explored. This chapter seeks to answer the second research question.
5.1 Literature review
Based on the findings of the Literature Review and for practicable development
of the final EWS approach, the resulting CO and QM tools will be used for the
EWS-development.
Risk Identification and Monitoring
Before the Risk Identification and Monitoring tools can be defined, their tasks will
be defined in detail for complete understanding in order to ensure that a common
understanding can be shared across the whole work (Hopkin, 2013). The
understanding of this work depends on ISO 31000:2009 explanation, where risk
identification is a process of finding, recognizing and describing risks, where risk
monitoring is responsible for continual checking, supervising, critically observing
or determining the status in order to identify change from the performance level
required or expected (ISO, 2009).
5.1.1 Methods for determination of context
The Literature Review gives, as appropriate tools for determination of context,
PESTLE, Cross-Impact-Analysis, SWOT-Analysis (Meier, 2007; Hopkin, 2013),
which are described below.
PESTLE
The first research work about “environmental analysis” came from Aguilar in
1967, as stated above, with his emphasis on the need for external review.
According to the literature review “The common qualitative approach is the
144
PESTLE analysis named by Stewart & Rogers (2012) as a key tool for
environmental scanning, that considers the political, economic, social,
technological, legal and ethical (or environmental) risks faced by the organization”
(Hopkin, 2013, p. 64). McCabe (2010, p. 57) states that “… the main functions of
PESTLE analysis is in the context of ‘environmental scanning’, an analytical
process described as necessary in terms of understanding events and trends in
the external environment”. Breitkreuz & Lange (2011) add, that the PESTLE
analysis is a model which adds to the environmental analysis. Notwithstanding
the fact, according to the research from Bedenik et al. (2012), that this tool is not
well known in practice, we see a high degree of necessity, as described above,
to analyse and to fix the environment of the company, which can be best done by
a systematic tool like PESTLE. However, Allenspach (2006) states that it belongs
more to the strategic work, where the main and sub-aims will be analyzed. The
interaction can be analyzed by CIA (Liebl, 1996).
Cross-Impact-Analysis
"Cross-Impact-Analysis is a method used in forecasting exercises aimed at
measuring the correlation between future events (variables)" (Ferretti, 2016). It is
a quantitative method, which shows the interdependency within a problem area
and creates an understanding of connections (Wirtschaftslexikon, 2016). CIA is
in order to identify how developments in one area interact with those in another.
It is able to show how one situation impacts another situation (Ferretti, 2016). At
this stage it is not clear whether or not this tool is too complex for SMEs. In this
context that means that the lack of experts for gathering and analysis, especially
relating to maths, as well as the absence of management initiatives, are the
crucial reasons for deficiency. The results should be able to predict the future
development of market, competitors and their own company’s position, which can
be afterwards included into a SWOT analysis to understand their own Strengths
and Weaknesses and to be ready to grasp the Opportunities and overcome the
Threats.
145
SWOT Analysis
"The SWOT Analysis has the advantage of also being able to consider the
rewards available to the organization from the opportunities in the external
environment. One of the strengths of the SWOT analysis is that it can be linked
to strategic and tactical decisions; a danger is that it is not a structured risk
classification system and, therefore, there is a possibility that not all of the
significant risks will be identified" (Hopkin, 2013, p. 64). SWOT analysis also
includes the non-financial aims and can be used as a qualitative tool (Allenspach,
2006). In summary, it can be said that SWOT can be seen as a matrix, where the
relevant results will be summarized, analyzed and used as a basis for further
actions. However, after the determination of the organizational context, the
company also has to identify sources of risk, areas of impact, and events, by
including changes in circumstances and their causes, as well as their potential
consequences and then adjust their strategic plan accordingly (Hauff, 2010).
5.1.2 Methods for risk identification
The phase of risk identification includes the collection of actual and future
(potential and latent) risks, which is the most important step during risk
management (Krystek & Fiege, 2015). The literature describes Brainstorming,
Brainwriting, Portfolio-Analysis, Delphi-Method, Scenario, Diffusion theory,
FMEA (Meier, 2007), Altenähr et al. (2009) add Fault Tree Analysis and SWOT
analysis as appropriate common tools for risk identification. Krystek (1987) states
that planning is also a tool which helps to identify risks. Allenspach (2006) in
contrast, differentiates between collection methods (Interview, Questionnaire) as
“identification of already existing risks” and “detection methods” (Fault Tree
Analysis, Brainstorming, Brainwriting, Delphi-Method, Joined-up Thinking,
Network Analysis) as identification of future and not yet known risk potentials.
According to the literature review, the risk identification phase begins with the
collection of information where, from the collected information, specific diffusions
or behavior patterns can be found by mathematical and statistical methods and
so prognoses can be made.

146
Diffusion Theory
Diffusion Theory describes that on one hand the concreteness of the information
increases with time and, on the other, the time for counteractions decreases. This
is described in the literature as a complex area with a diversity of different risk
areas. Due to uncertainties regarding existing paradigms and invariants of
diffusion backing (Innovation setting) the implementation of change is possible.
The diffusion theory includes empirically more or less secure legalities for the
dissemination of events, ideas, innovations. The contagion effects in the spread
of new forms of behavior are the focus of diffusion research, whose results are
shown in structural curves (diffusion functions). They interpret distribution
patterns derived from empirical studies (Krystek & Müller-Stewens, 1993). The
detection of diffusion patterns is divided into three different types of infection.
Either by infection of a constant percentage of uninfected persons per unit of time
or by exponential infection, the new ideas are transmitted from subject to subject.
Also, combinations of constant and exponential running expansions can be
observed (Hammer, 1998). The benefit of the practical application of diffusion
functions as an early Enlightenment concept is found over time, which leads to a
better adjustment to changes in the business environment. It is possible to set
limits on trend reactions earlier and to make better decisions and greatly reduce
risk, especially in long-term investment projects. Trend lines, which are adapted
to the situation, representing the designed diffusion functions, are based on
several considerations.
Trend Landscape
One of the well-known instruments for early detection is the generation of trend
landscapes. This is especially helpful in relation to the processing of the
information obtained through scanning and monitoring. Herein, the development
of discovered individual trends should be checked for correlations and
thematically combined or aggregated to rectifiable trends (Schlüter, 2004). This
combination of trends to form trend landscapes has several advantages as a
result: the cognitive load can be manageable (Neubauer & Solomon, 1977); the
flood of information leads quickly to clarifying failure (Wilensky, 1967); and
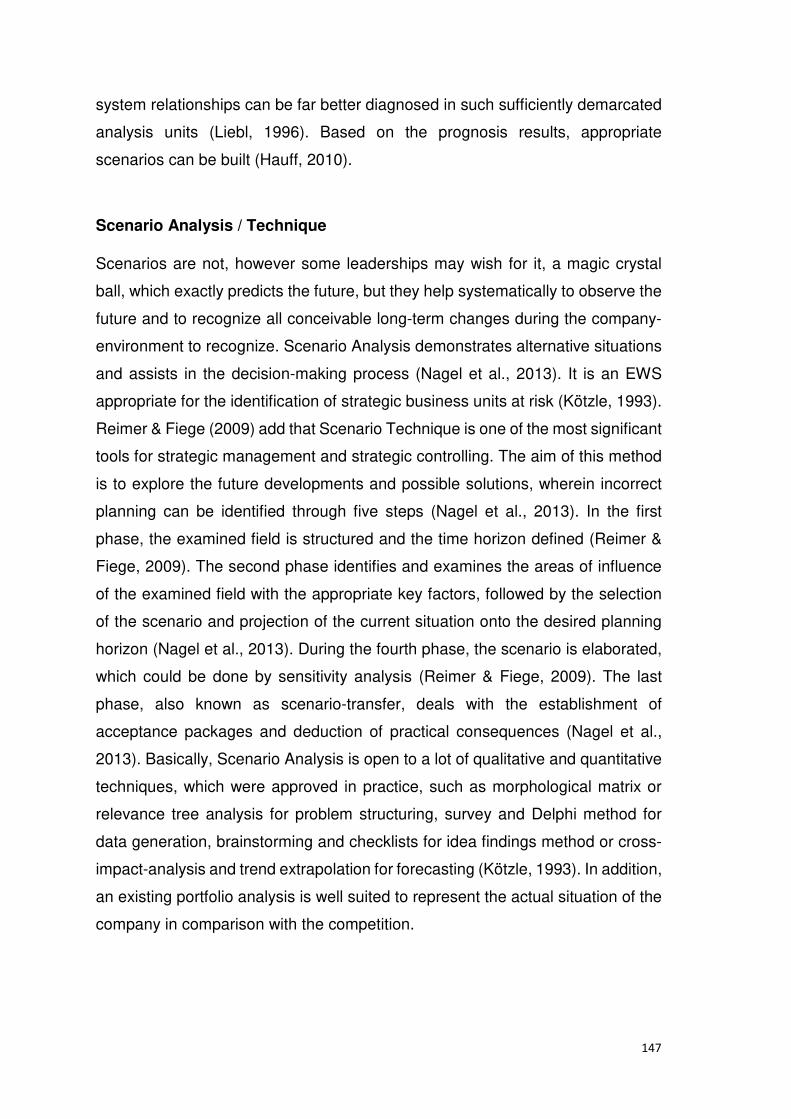
147
system relationships can be far better diagnosed in such sufficiently demarcated
analysis units (Liebl, 1996). Based on the prognosis results, appropriate
scenarios can be built (Hauff, 2010).
Scenario Analysis / Technique
Scenarios are not, however some leaderships may wish for it, a magic crystal
ball, which exactly predicts the future, but they help systematically to observe the
future and to recognize all conceivable long-term changes during the company-
environment to recognize. Scenario Analysis demonstrates alternative situations
and assists in the decision-making process (Nagel et al., 2013). It is an EWS
appropriate for the identification of strategic business units at risk (Kötzle, 1993).
Reimer & Fiege (2009) add that Scenario Technique is one of the most significant
tools for strategic management and strategic controlling. The aim of this method
is to explore the future developments and possible solutions, wherein incorrect
planning can be identified through five steps (Nagel et al., 2013). In the first
phase, the examined field is structured and the time horizon defined (Reimer &
Fiege, 2009). The second phase identifies and examines the areas of influence
of the examined field with the appropriate key factors, followed by the selection
of the scenario and projection of the current situation onto the desired planning
horizon (Nagel et al., 2013). During the fourth phase, the scenario is elaborated,
which could be done by sensitivity analysis (Reimer & Fiege, 2009). The last
phase, also known as scenario-transfer, deals with the establishment of
acceptance packages and deduction of practical consequences (Nagel et al.,
2013). Basically, Scenario Analysis is open to a lot of qualitative and quantitative
techniques, which were approved in practice, such as morphological matrix or
relevance tree analysis for problem structuring, survey and Delphi method for
data generation, brainstorming and checklists for idea findings method or cross-
impact-analysis and trend extrapolation for forecasting (Kötzle, 1993). In addition,
an existing portfolio analysis is well suited to represent the actual situation of the
company in comparison with the competition.

148
Portfolio Analysis
Portfolio Analysis of Boston Consulting Group is a systematic evaluation of
company`s business units or their product lines by the two variables of Market
Share and Market Growth based on the product life cycle. Depending on Growth
and Share, the graph shows Stars, Question Marks, Cash Cows and Poor Dogs
(Fiedler, 2001). It is questionable whether tools such as Portfolio Analysis, which,
at the beginning of 20th century, were important for the analysis of the right
position in the market for the company, are still workable. However, Nagel et al.
(2013) state that the portfolio analysis is based upon the life cycle of products and
services, where all products pass through different phases by showing the
company if the product/service is balanced. As the analysis horizon, a specified
period will be taken, one which is needed by the company for the development of
an innovation, the necessary time for acquisition and its launch on the market and
also the period for a realization of the investment projects and diversification
(Reibnitz, 1992).
Planning
Planning helps, with the use of known planning techniques, in the development
of strategic treatment alternatives for the handling of imminent change (Hauff,
2010). Krystek (1987) adds that planning helps to rethink, in advance, all possible
events/developments with crisis potential in order to react fast when a crisis
occurs. At this point the question arises whether nowadays, when the world is
becoming more and more dynamic, especially the planning, which relates to the
inflexible tool, is still appropriate -and how it should give the company orientation
and stability? This question should not encourage the companies to avoid
planning, but rather to make them aware of the developments and take them into
consideration. However, according to the Literature Review some concepts such
as the Concept of Battelle Institute (1978) uses planning as a comparison
between the premises of the strategic planning and the sign-specific scenario
results. The statement derived from the sign-specified scenario is compared with
the strategic planning, and only if there is sufficient deviation between the
premises of the strategic planning and the scenario results, the next step will

149
follow (Hauff, 2010). Also the Concept of Hammer (1998) indicates that the
potential impact will be predicted by different created scenarios and by a
comparison drawn with the principles of strategic planning. When planning, the
organization should consider the issues and determine the risks and opportunities
to avoid undesirable effects (Ohligschläger & Below, 2015). “A plan prepared to
take advantage of, or to minimize the effect of an event which is considered to be
unlikely to occur but, if it did, would have a considerable impact on the
organization's ability to achieve the objective” (Krystek, 1987, p. 132). There are
many ways in which risk can be defined and/or described, but it is important that
sufficient information is collected about each risk, which will be stored and/or
recorded (Brühwiler, 2003).
FMEA
Failure modes and effects analysis (FMEA), also known as failure modes, effects,
and criticality analysis, is used to identify ways a process or product can fail to
meet critical customer requirements (Foster, 2013). It is used to determine high-
risk functions or product features based on the impact of a failure, where it
systematically considers each component of a system: identifying, analyzing, and
documenting the possible failure modes within a system and the effects of each
failure on the system (Pyzdek & Keller, 2013).
Brühwiler (2003, p. 48) explains it in more detail: “This standard establishes
requirements and procedures for performing a failure mode, effects, and criticality
analysis (FMECA) to systematically evaluate and document by item failure mode
analysis, the potential impact of each functional or hardware failure on mission
success, personnel and system safety, system performance, maintainability, and
maintenance requirements. Each potential failure is ranked by the severity of its
effect so that appropriate corrective actions may be taken to eliminate or control
the high-risk items". Ruderer (2009) adds that the FMEA concentrates more on
the effect of the failure than the cause, where the aim is to avoid the potential
failure during the development of a product or establishment of a process, which
means it is also an appropriate tool for the food production industry.

150
FMEA is a preventative model, wherein it is important to recognize the failure as
early as possible (Romeike & Hager, 2013). FMEA uses a nine-step process
(Wilensky, 1967):
1) Assign an identifier to each component
2) List functions for each part
3) List one or two failure modes for each function
4) Describe effects of each failure mode
5) Determine hazard likelihood and categorize
6) Estimate likelihood of failure
7) Estimate failure detection
8) Identify highest risks
9) Eliminate or reduce highest risks (Foster, 2013).
The main problem during the risk management process is that risks which are not
recognized, can also not be analyzed and managed. Ellenbürger et al. (2009)
recommend combining the tools according to the risk profile for maximized
completeness of risk identification. Schmitz (2006) states that especially the
FMEA and HACCP in combination for the food production industry have a wide
range of method steps to build up self-control systems for risk control and risk
monitoring, which should be analyzed individually for each company. In practice
some companies develop a HACCP analysis, which is afterwards systematically
evaluated by FMEA.
HACCP
“Hazard Analysis and Critical Control Point (HACCP) has been recognized
internationally as a logical tool used in the food industry to identify potential food
safety hazards so that preventive actions can be taken to mitigate the potential
risks. The system continues to be used at all stages of the food supply chain”
(Reuvid, 2013, p. 151). Petersen & Nüssel (2013) describe HACCP as a QM
method which consists of the following seven principles:

151
- Procedure of Hazard Analysis
- Determination of Critical Control Points
- Determination of Critical Limits
- Monitoring of Critical Control Points
- Determination of Corrective Actions
- Verification of the HACCP system
- Documentation
Ruderer (2009) adds that HACCP is an important tool in the food production
industry for a systematic risk identification. Romeike & Hager (2013) go a step
further and state that HACCP is a method which aims to save the food production
industry and at the end to protect the consumer. However, risk identification
should include an examination of the knock-on effects of particular
consequences, including cascade and cumulative effects, where it has to sample
all possible information about known and unknown risks and to summarize those
(Altenähr et al., 2009). It should also identify what might happen, where it is
necessary to consider all possible causes and scenarios that show what
consequences can occur (Schmidt, 2015).
Fault Tree Analysis
The Fault Tree Analysis (FTA) is a top-down, deductive failure analysis, which
analyses all possible reasons of one undesired deviation (top event), which by
interrelation cause the disruption (Ruderer, 2009). Allenspach (2006) states that
the FTA has the advantage that it also considers ‘soft facts', such as technology,
people, etc. Ruderer (2009) adds that deviation from qualitative to quantitative is
also possible in this method. Brühwiler (2003), in contrast, states that FTA is a
quantitative tool, which calculates the probability of the occurrence of complex
scenarios when the connection of the event is known. He adds that this method
traces an event back to its root in order to find reasons. "Fault-tree analysis (FTA)
is an analytical tool that graphically renders the combination of faults that lead to
failure of a system" (Foster, 2013, p. 202). It is an appropriate tool for reliability

152
and safety analysis (Marshall, 2012). Foster (2013) adds that the technique is
useful for describing and assessing events within a system. Romeike & Hager
(2013) go a step further and state that Fault Tree Analysis is an appropriate tool
for simulation in which causes will be analyzed with the aim of producing a
statement of liability, security, and availability. For verification of the analysis
results from FTA, it is also possible to use the Delphi-Method.
Delphi-Method
This is a method of expert survey for creating quantitative forecasts, which has
proven itself in the generation of forecast information and assessment of changed
constellations and discontinuities. The basic concept refers to the overall better
results in the structuring and analyzing of problems by a group of experts
compared with individual assumptions (Götze, 1993). The experts estimate
anonymously, via standardized questionnaire, future developments both
qualitatively and quantitatively. The consensus of opinion ultimately obtained then
forms a basis for strategic planning (Koslowski, 1994). In implementing the Delphi
method a so-called monitor group that can exist alongside corporate employees,
also from consultants or market researchers, is responsible for defining the
problem domain, the preparation of questionnaires, the evaluation of results as
well as providing additional information (Götze 1994). According to the literature
review, in Hammer's (1998) third step there follows verification through objective
and reasonable relevance, which is effected by using a so-called discontinuity
survey, a so-called survey of experts in terms of their assessment of a specific
question. Müller & Zeiser (1980) add that according to this survey, three aims
should subsequently be reached: determination of the potential impact of
potential changes, determination of the probability for the appearance of these
and finally the assessment of the necessity and urgency of reaction strategies.
However, the quality of the results depends primarily on the expertise of the
respondents with respect to the subject area and method of application. A
combination of in-house and external experts prevents operating and industry
blindness. Additionally, the organization should establish, implement, maintain
and continually improve a management system, including the processes needed
and their interactions (DIN EN ISO 9001, 2015). For this tool to be really
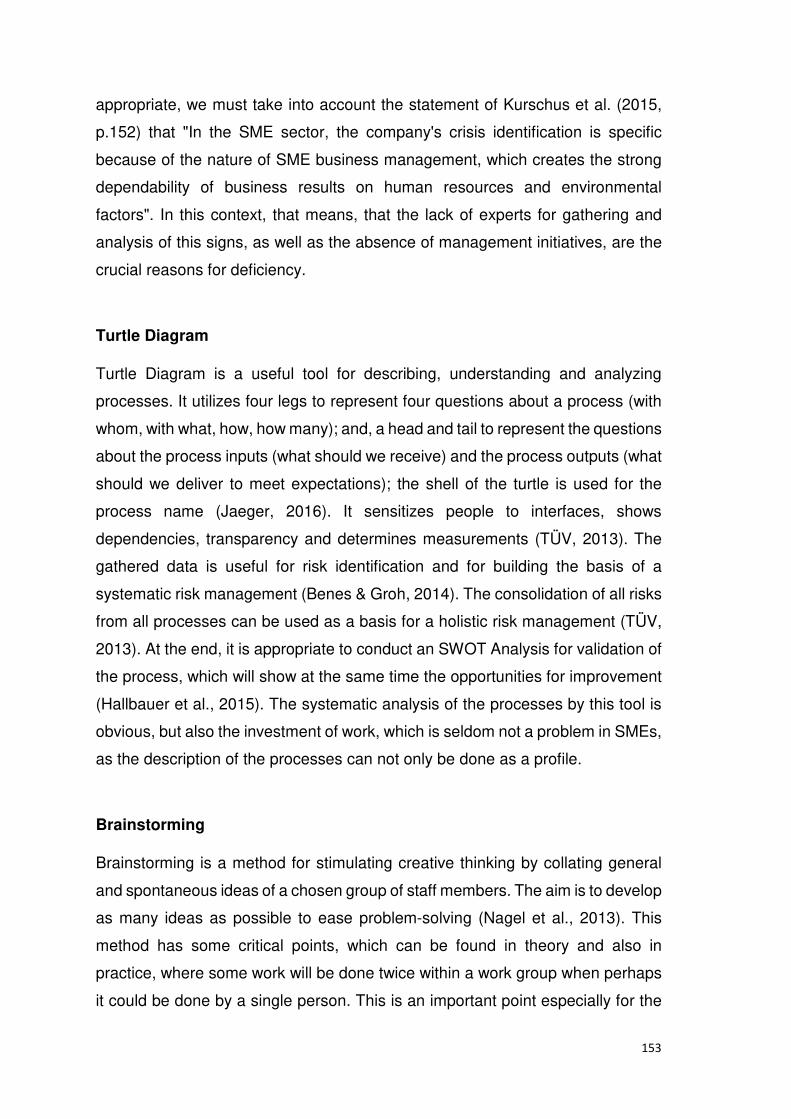
153
appropriate, we must take into account the statement of Kurschus et al. (2015,
p.152) that "In the SME sector, the company's crisis identification is specific
because of the nature of SME business management, which creates the strong
dependability of business results on human resources and environmental
factors". In this context, that means, that the lack of experts for gathering and
analysis of this signs, as well as the absence of management initiatives, are the
crucial reasons for deficiency.
Turtle Diagram
Turtle Diagram is a useful tool for describing, understanding and analyzing
processes. It utilizes four legs to represent four questions about a process (with
whom, with what, how, how many); and, a head and tail to represent the questions
about the process inputs (what should we receive) and the process outputs (what
should we deliver to meet expectations); the shell of the turtle is used for the
process name (Jaeger, 2016). It sensitizes people to interfaces, shows
dependencies, transparency and determines measurements (TÜV, 2013). The
gathered data is useful for risk identification and for building the basis of a
systematic risk management (Benes & Groh, 2014). The consolidation of all risks
from all processes can be used as a basis for a holistic risk management (TÜV,
2013). At the end, it is appropriate to conduct an SWOT Analysis for validation of
the process, which will show at the same time the opportunities for improvement
(Hallbauer et al., 2015). The systematic analysis of the processes by this tool is
obvious, but also the investment of work, which is seldom not a problem in SMEs,
as the description of the processes can not only be done as a profile.
Brainstorming
Brainstorming is a method for stimulating creative thinking by collating general
and spontaneous ideas of a chosen group of staff members. The aim is to develop
as many ideas as possible to ease problem-solving (Nagel et al., 2013). This
method has some critical points, which can be found in theory and also in
practice, where some work will be done twice within a work group when perhaps
it could be done by a single person. This is an important point especially for the

154
SMEs, which complain about lack of resources and time. However, it is a process
with a purpose and/or anticipated outcome that is applied to relatively complex or
unstructured ideas. (Watton et al., 2001). A very simple explanation of reflection
is expressed by Reynolds (1998) as a key element of problem-solving. Rigg &
Trehan (2008, p. 375) link the definition more to practice by explaining the
development of the transferable idea, and also by offering the potential for
organizational learning and change". It is not dependent on the already-existing
theory but establishes a new one by linking thinking with doing, which must later
be converted into action (Schön, 1983).
Brainwriting
In this tool, diversity of opinions becomes obvious as each participant writes down
their ideas on cards, which are displayed on a pin board. During this method, the
participants have on the one hand time to rethink things, but on the other hand
the spontaneity goes lost, where vague ideas, in contrast to brainstorming, will
not be activated. This has a high degree of effectiveness, as it committed
contributions from everyone and attempts to organize and structure possible
solutions (Nagel et al., 2013).
To provide both theoretical perspectives and accounts of practice where
practitioners reflect directly on their own practice, Pedler & Abbott (2013)
recommend ‘Writing’, which is an important part of professional practice by
facilitating self-reflection. Watton et al. (2001) explain Reflective Writing in more
detail by stating that it provides the opportunity to gain further insights into one’s
own work through deeper reflection on experiences, reviewing them with the help
of others by discussing issues, and through further consideration of theory.
5.1.3 Methods for risk monitoring and review
Altstetter (2008) describes the last phase of the Risk Management Process after
risk identification, analyzing and treatment, as the Monitoring Phase, where all
relevant risks have to be monitored and all possible changes in them should be
recognized as early as possible. The literature describes the BSC as an

155
appropriate tool for risk monitoring and review (Wolf, 2010; Brühwiler, 2003;
Töpfer 2000; Schröder, 2005).
Balanced Scorecard (BSC)
A balanced scorecard is a strategic tool appropriate for designing the whole
planning, monitoring, and control process, which combines the key performance
indicators from the past with future value drivers (Allenspach, 2006). Measurable
by Company Value = Shareholder, Market, Customer, People, Future Value
(Töpfer, 2000). Wolf (2010) describes BSC as CO tool, which is appropriate for
Risk Identification. Today’s world-environment changes rapidly and at this point
criticism could arise, if such a strong analytical process is still manageable for the
companies during this short period, by consideration of the relations, as well as
interdependencies. However, according to the literature, so far, BSC is
appropriate for use as part of an EWS. On the one hand, it has a strategic
orientation from the outset, as it is based on the “vision” and “strategy”, which are
purely qualitative in nature. However, in order to follow this vision and strategy
and constantly review it, there is a connection to operational key figures required,
which should be determined and developed individually by each company. These
are predominantly quantitative in nature.
5.2 Semi-structured Interview
In addition to the tools listed above, for the practical development of the final EWS
approach, the tools of the respondents should be considered. These tools were
worked out during the interview. Therefore, those described in the following list
are particularly relevant for a practical EWS.
5.2.1 Early Warning Systems - a topic of CO and QM
The fifth interviewee stated that CO and QM deliver data which are very important
for the decision maker. He added that it enables them to get the information at an
early stage, recognize risks on time and prevent them. This is in line with the
literature, where Seghezzi et al. (2007) state that QM is a model which focuses

156
on clients, products, processes, etc. and CO focuses on strategy, planning, and
company development. Donnersmarck & Schatz (1999) add that as the
information within both systems comes from the internal and external areas and
especially CO continuously sends signals of deviation, they are outstandingly
appropriate as an EWS.
The fourth participant explained it in more detail and indicated that it helps the
manager's study reports and compare them to the plans set earlier. According to
this statement, the literature review shows that the QM (DIN EN ISO 9001, 2015)
requires an annual management review, which should include decisions and
actions related to opportunities for improvement and any need for changes and
resources. Additionally, CO ensures the necessary supply of data and information
by inclusion of planning and management control (Fiedler, 2001). The fifth
interviewee added that results that management receives help to rethink all
possible events/developments with crisis potential in advance in order to react
fast when a crisis occurs: which may motivate them to re-plan, to set new
strategies, or to reshape organizational structure. This part is clearly shown in the
literature by the concepts of Battele Institute (1978) and Hammer (1998), where
they recommend, dependent on the deviation of the strategic plan, to re-think and
if necessary to re-plan the strategy. All participants confirmed that EWSs are an
important topic within the CO and QM area in the Food Production Industry. This
is in line with the literature where Löhneysen (1982) describes the EWS as an
information system designed to warn companies when problems arise where
companies have to initiate counteractions (Götze & Mikus, 2000).
5.2.2 Requirements from Phase I, which an EWS in the Food Production
Industry has to fulfill
A list of categories equal to those identified and defined in Phase I were shown
to informants before interview. These requirements were worked out during the
literature review and interviews. The requirements from Phase I, which an EWS
in the Food Production Industry has to fulfill, were named, with the following main
points, by Turnaround experts, Lecturers and Interim Managers and also comply
with literature review, as follows:

157
- EWSs should help recognize risks in a timely fashion and prevent them at
an early stage.
- They should be holistic (strategic and operational) and practicable => not
too complex.
- They should be future-oriented.
- They should include quantitative (hard) and qualitative (soft) factors.
- All business areas should be monitored.
- Internal and external factors should be considered.
- It should be a top management information system – monitored by
management.
- It should be designed for internal and external stakeholders with different
reports.
- It should match characteristics of the company (culture, structure, size and
type of management).
- The management should be responsible for the suitability of an EWS.
These were also confirmed by the CO and QM experts.
5.2.3 Appropriate CO and QM tools according to the requirements from
Phase I
The toolkit of CO and QM is very large and it was necessary, with the help of two
CO and two QM experts, independent of the case companies, to identify the most
appropriate for EWSs, which match the requirements identified during the Phase
I. Early warning systems, named by interviewees and related to the literature
review, could, according to the requirements from Phase I, include the following
tools:
- PESTLE
- SWOT Analysis

158
- Planning
- FMEA
- HACCP
- Turtle Diagram
- Fault Tree Analysis (FTA)
- Creativity methods
- BSC
all of which have been explained above.
The literature names additionally Portfolio Analysis, Delphi Method, Scenario
Analysis, Diffusion Theory, Trend Landscape and Cross-Impact-Analysis (Meier,
2007) as appropriate common tools for an EWS. The aggregated results, as well
as the tools named in the literature, except the Delphi Method (similar to Expert
Survey, according Hammer) during the previous strategic concepts of Battele
Institute (1978) and Hammer, will be considered during the development of the
EWS in Chapter 6.
5.2.4 Tools classified as ‘best-practice-elements’
The aim of the interview was, additionally to the theoretical basis, to consider the
best-practice elements. The rationale for using Controllers or Quality Managers
is that, by virtue of their professions, they are well able to identify the best-practice
tools appropriate for the described requirements. For the reason that the risks
should be identified as completely as possible, the best-practice tools are named
and briefly described also according to the literature review, below:
- PESTLE, which was named by the third interviewee, is a model which
counts to the environmental analysis and considers the political, economic,
social, technological, legal and ethical (or environmental) risks faced by
the organization. This is in line with the literature review by Meier (2007)
and Hopkin (2013).

159
- SWOT, which was named by the seventh interviewee, is helpful for a
company to understand their Strengths and Weaknesses, to be ready to
grasp the Opportunities and overcome the Threats. The literature by
Hopkin (2013) and Allenspach (2006) indicates SWOT as an appropriate
tool for the understanding of the internal Strengths and Weaknesses, as
well as of the external Opportunities and Threats.
- Planning, which was pointed out by the fourth participant, helps to rethink
all possible events/developments with crisis potential in advance in order
to react fast when a crisis occurs. Also, several authors (Hauff, 2010;
Krystek, 1987; Ohligschläger & Below, 2015) indicated ‘Planning’ as an
appropriate tool for risk/crisis identification.
- FMEA, indicated by the seventh interviewee, is used to identify ways a
process or product can fail to meet critical customer requirements. A lot of
literature is available which confirms it as a model for failure prevention
(Foster, 2013; Romeike & Hager, 2013; Ruderer, 2009; Brühwiler, 2003;
Pyzdek & Keller, 2013).
- TURTLE, pointed out by the sixth participant, analyses processes by
recognition of their weaknesses, effectivity, and efficiency, as well as the
interfaces and their dependencies. This, in general, corresponds to the
literature review by Jaeger (2016), TÜV (2013), Benes & Groh (2014) and
Hallbauer, et al. (2015).
- HACCP, named by the seventh interviewee, is used in the food industry to
identify potential food safety hazards so that preventive actions can be
taken to mitigate the potential risks. The literature review also reveals
HACCP as a valuable tool for risk identification within the food industry
(Ruderer, 2009; Romeike & Hager, 2013 and Reuvid, 2013).
- Fault Tree Analysis is a failure analysis, added by the seventh participant,
which analysis all possible reasons for an undesired deviation (a major
event), which by interrelation can cause the disruption. Also, several
authors cited the FTA as a tool for analysis of an undesired deviation
(Ruderer, 2009; Allenspach, 2006; Foster, 2013; Marshall, 2012 and
Romeike & Hager, 2013).

160
- Creativity methods, such as Brainstorming or Brainwriting, named by the
fourth and fifth interviewee, can be used for supporting the above methods,
by data-gathering. Creativity methods were also described in the literature
review as a supporting tool for data-gathering (Nagel et al., 2013; Rigg &
Trehan, 2008; Reynolds, 1998 and Watton, Collings & Moon, 2001).
- BSC, named by the fourth participant as a Management Cockpit and by
the sixth expert as risk radar, is a strategic tool appropriate for designing
the whole planning, monitoring, and control process, which combines the
key performance indicators from the past with future value drivers. This is
in line with the literature review, agreed by Allenspach (2006), Töpfer
(2000), Brühwiler, (2003), Schröder (2005) and Wolf (2010).
In the end, pointed out by the fourth interviewee, the CEO must have a
Management Cockpit, which delivers him an overview of the whole company,
where environment information is included and enables him to make appropriate
decisions as well as react to changes in time. This view is also confirmed by the
literature review, where the information about risk coming from different sources
should be combined to form a holistic system (Brühwiler, 2001). “Some
companies have developed a panel of early warning indicators, sometimes
referred to as a risk dashboard, to track movement in selected areas that are
crucial to the company’s well-being.” (Hampton, 2009, p. 63). The fourth
interviewee added that internal and external risks for all business processes and
relevant support processes must be taken into account and efficient
communication to internal and external areas should be ensured. This is in line
with the literature review, where the phase of risk identification is the most
important step, as the result of this stage is essential for all following steps
(Krystek & Fiege, 2015). Ruderer (2009) shares this view by stating that EWSs
are information tools, which have the aim to recognize the negative development
at an early stage so that the company has enough time for the reaction before
the damage sets in.

161
5.2.5 Integration in a company
The fifth interviewee indicated that the beginning of early risk recognition lies
rather in an attitude question and a question of open communication, of readiness
to scrutinize existing things, and in the importance of critical discussion inside the
company. Pedler & Abbott (2013) share this view by stating that Practice means
working with other people in sets and including one’s own personal reflective
practice. Ruderer (2009) adds that by the integration and sensitization of
employees in the critical handling process to the recognition of internal and
external changes, provides a huge contribution to the establishment of a risk
culture. The fifth participant added that the tools could only help to support when
the company has an appropriate framework for them. The theory confirms that,
whatever the aim of the single system is, the company has to be able to tailor the
framework to their needs, which includes the micro and macro environment
(Dahm & Haindl, 2011). The sixth interviewee stated that the employees must be
sensitized to the openness of critical discussion by cause and effect relationships.
The mentioned statement is in line with the literature review, however, the
employees are to be sensitized to the critical handling of the recognition of
changes in their area (Gleißner & Meier, 2001). The fourth participant added, that,
employees continuously have to deal with changes occurring in the company
environment. The fifth interviewee pointed out that this all requires analysis or
understanding of the new situation, and this knowledge, especially in SMEs is
often lacking. The literature review confirms that Practice is equated with doing,
concreteness, understanding, and know-how as opposed to Theory which is
equated with thinking, explanation, knowing, and dissection into parts (Weick,
2005).
Companies should pay attention to communication and information policy,
wherein the risk policy of the company should be written down. This generally
corresponds to the literature review, where Donnersmarck & Schatz (1999) state
that it is important to focus on organizational communicative and human aspects
and to avoid strong hierarchical structure. The fifth participant commented that
tools can help identify, describe and control the risk, but the employees should
be able to use the tools and to notice signs, coming from the company and
environment. This agrees with the literature in Kelders (1996) that, the information

162
search process of a company has to be realistic, clear and simple. Rocha-Lona
et al. (2013) recommend during the selection criteria process not only to evaluate
whether the selected tools are needed, but also whether the SMEs have the
required resources and capabilities for their implementation. The seventh
interviewee summed up with the statement that whatever the tools of any system
are, the company has to be able to tailor the framework to their own needs. The
fourth participant added that the most important goal for this system should be an
overview of the whole area. The literature review confirms this view in
Kirschkamp’s (2007, p. 13) statement, “A holistic view is used where all relevant
factors and their interdependencies have to be identified and dealt with”.
5.2.6 Tool Software appropriate for an EWS
All interviewees agreed that a holistic standard tool or software for SMEs,
according to the requirements and including the named tools, is not yet known -
existing solutions are mostly self-made. This generally corresponds to the
literature review, that the recommendation is, in general, to use the Office
applications (Ruderer, 2009), such as Excel, Visio, etc., as no EWS software,
appropriate for SMEs, exists.
5.2.7 Persons who are responsible for the appropriateness of the CO and
QM tools
All participants indicated that the responsibility for the suitability of the CO and
QM for an EWS is definitely a matter for Management and of the CO and QM
employees. This generally corresponds to the literature review by Bedenik et al.
(2012) that monitoring is not a backroom function but instead an active process
involving managers at all levels who share an awareness of the risks that the
organization faces by providing them with necessary organization flexibility. The
fourth interviewee added that, if possible, it would make sense to involve IT
experts, who can help to implement the tools and combine them appropriately.
However, the fourth expert summed up with the words that, the recognition and
monitoring of the relevant risks only work when the roles and responsibilities are
clearly defined, and a workable framework exists. This is in line with the literature

163
review, where the CEO has to set up appropriate reporting obligations for the
responsible divisions, which include all major risks and elements of risk
management and amendments thereto (Schmidt, 2015).
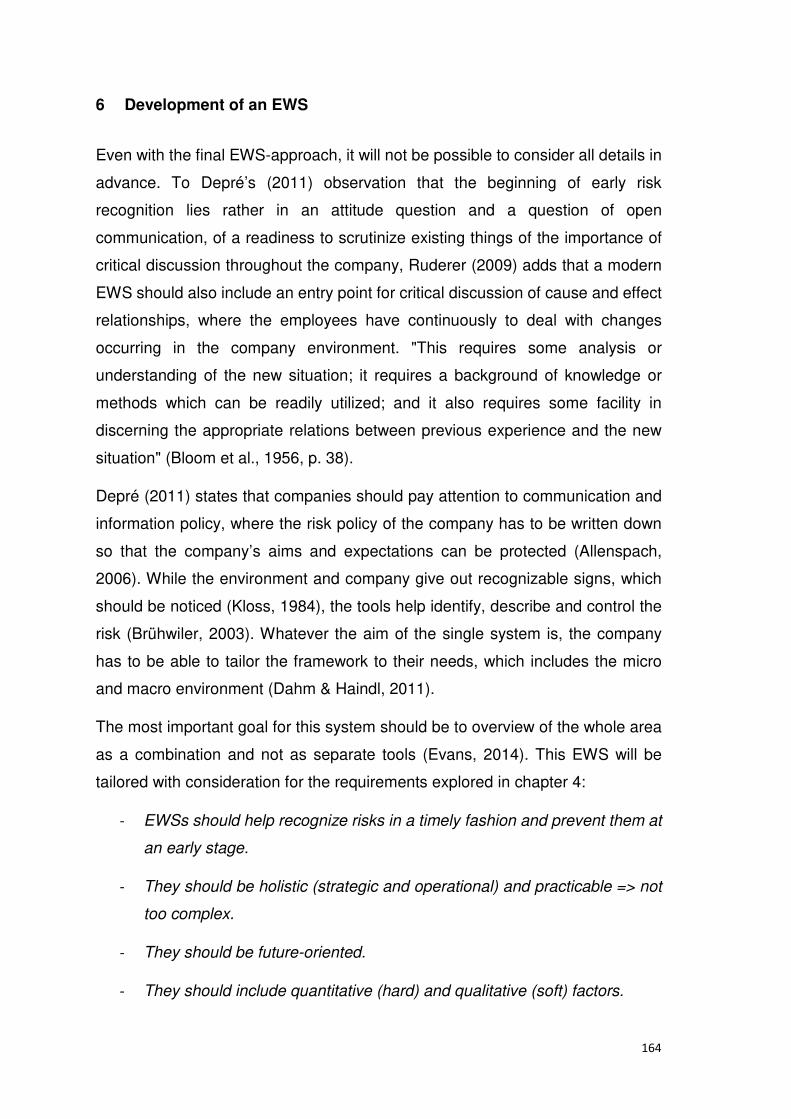
164
6 Development of an EWS
Even with the final EWS-approach, it will not be possible to consider all details in
advance. To Depré’s (2011) observation that the beginning of early risk
recognition lies rather in an attitude question and a question of open
communication, of a readiness to scrutinize existing things of the importance of
critical discussion throughout the company, Ruderer (2009) adds that a modern
EWS should also include an entry point for critical discussion of cause and effect
relationships, where the employees have continuously to deal with changes
occurring in the company environment. "This requires some analysis or
understanding of the new situation; it requires a background of knowledge or
methods which can be readily utilized; and it also requires some facility in
discerning the appropriate relations between previous experience and the new
situation" (Bloom et al., 1956, p. 38).
Depré (2011) states that companies should pay attention to communication and
information policy, where the risk policy of the company has to be written down
so that the company’s aims and expectations can be protected (Allenspach,
2006). While the environment and company give out recognizable signs, which
should be noticed (Kloss, 1984), the tools help identify, describe and control the
risk (Brühwiler, 2003). Whatever the aim of the single system is, the company
has to be able to tailor the framework to their needs, which includes the micro
and macro environment (Dahm & Haindl, 2011).
The most important goal for this system should be to overview of the whole area
as a combination and not as separate tools (Evans, 2014). This EWS will be
tailored with consideration for the requirements explored in chapter 4:
- EWSs should help recognize risks in a timely fashion and prevent them at
an early stage.
- They should be holistic (strategic and operational) and practicable => not
too complex.
- They should be future-oriented.
- They should include quantitative (hard) and qualitative (soft) factors.

165
- All business areas should be monitored.
- Internal and external factors should be considered.
- It should be a top management information system – monitored by
management.
- It should be designed for internal and external stakeholders with different
reports.
- It should match characteristics of the company (culture, structure, size and
type of management).
- The management should be responsible for the suitability of an EWS.
This will be effected by the inclusion of tools from chapter 5, shown in Figure 24,
which contain all items necessary for the solution of the problem described in
chapter 1.
Figure 24 Tools for a holistic EWS
Source: own illustration

166
The combination of the explored CO & QM tools to form a holistic EWS should
provide an answer to Question 2 from Chapter 1. Finally, the EWS approach
should be analyzed with the help of two case studies to consider its practical
suitability.
The combination of the QMS and CO tools during the construct (Figure 25) of a
holistic EWS, where each of the tools represents the model, is separated into the
three following steps in consideration of the requirements coming from the
literature review and interviews:
- Determination of context
- Risk identification
- Risk monitoring and review
6.1 QMS & CO as a construct for EWS tools
The companies within the food production industry have an absolute need for
high quality as its lack can lead to serious problems (Petersen & Nüssel, 2013)
and most of them have, for this reason, a quality management system (QMS),
where the basis is ISO 9001 (Ruderer, 2009). The QMS of ISO 9001 is
appropriate as the basis for using the company flow chart for integration of
additional management systems (Wagner & Käfer, 2010). Rothlauf (2014) states
that in the future it will not be possible to sustain one`s position for the companies
in the national and international competition without guarantee of high quality,
which stretches across the complete chain of economic value added. QMS is a
Management System for conduction and control of a company in terms of quality,
which determines the policy and aims as well as the achievement of the aims
(Giebel, 2011). Tricker (2014) adds that the ISO 9001 allows the company to align
and integrate its own QMS with other management system requirements.
The components of DIN EN ISO 9001 are: Continuous Improvement; Internal
Customer-contractor Relationship; Process-driven Organization and Working
Structure; Involvement and Motivation of all employees (Brüggemann & Bremer,
2012). To establish DIN EN ISO 9001 a company has to get their processes under
control; they have to plan them, follow them, ensure that they are effective, correct

167
them if they are deficient and constantly improve the existing processes (Tricker,
2014).
The requirements of the main points for DIN EN ISO 9001:2015 are in the areas
of:
- Quality Management System as process approach
- Consideration of Quality Aims and Policy
- Strategy and Stakeholder Orientation
- Resource Management and Knowledge Management
- Customer Approach
- Product Development and Realization
- Measurement Analysis, Risk Prevention, and Improvement (Hinsch,
2014).
In general, it can be said that Quality Management has the following eight
principles, which a company has to test and improve:
- The company has to focus on the customer
- The company is led by a leadership and involves people
- The management has to follow a systems approach while the company
has to apply the process approach and the decision-makers the factual
approach
- One of the most important principles is continual improvement and last but
not least the mutually-beneficial supplier relationship (Tricker, 2014).
The advantage of a QMS is that you have a clearly-defined process flow, clear
company structures, high transparency, increased efficiency, traceability of
products, sustainable quality consciousness, better image, reduction of mistakes,
cost cutting (Seghezzi et al., 2007).
Crönetz et al. (2009) cite EWS success factors comprising market, company
background/identity, continuous improvement, resources, structure, processes,
and competence – these factors, as described above, are regulated in ISO 9001

168
(Hinsch, 2014) and can be analyzed for discontinuities by the QMS. This
International Standard promotes the adoption of a process approach when
developing, implementing and improving the effectiveness of a quality
management system, to enhance customer satisfaction, fully understanding and
documenting customer requirements; ensuring compliance with identified
statutory legislation (Tricker, 2014). Specific requirements are considered
essential to the adoption of a process approach (DIN EN ISO 9001, 2015). The
process approach involves the systematic definition and management of
processes, and their interactions, where any activity that receives inputs and
converts them to outputs, so as to achieve the intended results is in accordance
with the quality policy and strategic direction of the organization (Tricker, 2014).
Management of the processes and the system as a whole can be achieved using
the Plan-Do-Check-Act (PDCA) cycle with an overall focus on risk-based thinking
aimed at taking advantage of opportunities and preventing undesirable results,
where often the output from one process becomes the input for another process
(DIN EN ISO 9001, 2015).
However, the additional factors of finance, aims and strategy need to be included
and can be monitored by the CO system (Vesper, 2014). Controlling supports the
Management with transparency, shows them potentials for cost cutting and
measurements for increasing profitability, but the Managers claim that they
communicate only the aim of cost cutting, without the recommendation of the
possible way of reaching them (Belkin, 2011). As risk management takes place
between the poles of customer requirements and customer satisfaction
(Brühwiler, 2001), it is proposed to use the existing QMS (Foster, 2013), where
the process is driven by customer expectation (Evans, 2014) along with a
Controlling System. Bruhn (2011) pointed out that for the efficiency of QMS QM
and CO belong together in a holistic EWS (cf. Figure 25). Weber et al. (2011)
adds that Controlling together with the Quality Management system is able to
react in a very short time to cost cutting and cash generation by means of “Plan,
Do, Check, Act”.

169
Figure 25 QMS & CO as construct for EWS tools
Source: own illustration, based on DIN EN ISO 9001:2015
The controller supports the Quality Management with process costs information,
which helps them to identify and specify reasons for a problem and define the
operative value driver. There should not only be a systematic combination, but
also a personal one (Weber & Schäfer, 2011).
This would also remove the critique that Quality Management, if anything, has
too narrow a focus and that problems are not solved from the process view, for
the reason of still focusing on the operative area and losing sight of
communication, organizational structure, and support of Top-Management

170
(Küpper et al., 2013). The criticism also often includes the lack of continuous
improvement of finance indicators, which are very important for the evaluation of
the financial impact, as well as the permanent relation to the external environment
(Weber et al., 2011).
The combination of QM & CO will be now explained in more detail. Seghezzi et
al. (2007) state that QM is a model which focuses on clients, products, processes,
etc. and BSC is a holistic Controlling, which focus on strategy and company
development. The aim of Controlling, especially of the BSC, as a holistic CO tool,
is the analysis of cause-effect connection between the areas, which makes
continuous improvement possible, and where the combination of QM with BSC
as two Management concepts, complement one another by focusing on the
customer, operating, market and employee perspective (Seghezzi et al., 2007).
This makes it possible for companies to react to changes much earlier and fulfill
the requirements of an EWS. Donnersmarck & Schatz (1999) add that as the
information obtained by the BSC and QM comes from both the internal and
external areas, it is outstandingly appropriate as an EWS, as the BSC
permanently sends signals of any deviation. Brühwiler (2003) goes a step further
and states that the BSC is appropriate as EWS by using the QMS as a basic
Management System of the whole Risk Management Process. Töpfer (2001)
concludes with the explanation that QM is system-oriented and BSC is result-
oriented, so both together build a holistic system by process building and result
control. Many concepts show that the processes are the core of the change
strategy, such as Quality Management (Belkin, 2011).
However, it is clear that there exists a strong relationship between BSC and QM,
wherein the information, according to the explanation of Seghezzi et al. (2007),
which comes from focusing on clients, processes and employees from the QMS,
will also be found in the BSC. Töpfer (2000) states that QM and BSC are two
sides of the same coin. The BSC displays the results of QM, which is a tool that
works to design and control the company (Töpfer, 2000). He adds that the
measurement results and performance indicators from the Quality Management
will be converted within the BSC into KPIs, which refer to all areas and enable
the Quality Management to operationalize and make it more useful by the use of
the scorecard.

171
As shown above, the QM, in conjunction with BSC, fulfills the requirements of
Chapter 4 as a holistic EWS by the inclusion of external and internal, strategic
and operational, qualitative and quantitative, factors. The appropriacy of BSC,
which was often criticized as too complex for SMEs, was analyzed in different
studies and confirmed for the use of SMEs (Elshamly, 2013). BSC is an easily
manageable tool, which integrates tools available in the company (here: QMS)
under the same roof to produce a holistic Management System (Töpfer, 2000).
The steps of implementation will be summarized subsequently, and the
appropriacy, by inclusion of tools, for practice will be analyzed through two Case
Studies.
The introduction process for a BSC is estimated by Töpfer (2000) to be about 6
months (as explained at the beginning of this chapter, most of the companies in
the food production industry have already implemented a QMS, and so the author
sees no need to describe this part further) and includes the following steps:
- Vision / Strategy / Aim
- Process analysis � definition of critical success factors and value drivers
- Classification of the value drivers to the areas of BSC
- Identification of KPIs
- Connection of KPIs / analysis of reasons/activity relationship
The combination of QM and BSC begins with the Mission and Vision; the
fundamental elements of "Policy and Strategy" establish the review on the basis
of sub-criteria, where the information from market, measurements and knowledge
have to match within cause-effect-relationships from the customer, operating,
market and employee perspective (Töpfer, 2000). Anyway, the development of
the EWS is related to DIN EN ISO 9001:2015, which was introduced in October
2015 (DIN EN ISO 9001, 2015), in which SMEs have to develop a risk-oriented
QMS during the following three years. This system was complemented by CO,
as described above, where the integrated tools and their use will be explained
below.

172
6.2 Determination of context
The first step during strategic early recognition according to the concepts of
Battelle Institute (1978) and Hammer (1998) is that of environment analysis,
which both define as early clarification and which is where the weak signals will
be primarily located. As Meier (2007) states that there exists a strong relationship
between Risk and Quality, where both (here: regulation of ISO 31000:2009 and
DIN EN ISO 9001:2015) require as a starting point the determination of context
by the observation of the internal and external company environment and the
identification of factors, which could have an impact on the company, this stage
could be used during the above described construct, as allocation of weak
signals. This is marked in figure 26 as Number 1. The appropriate tools will be
described during this chapter.

173
Figure 26 Determination of company context
Source: own illustration
6.2.1 Weak Signals
The strategic early recognition can be seen as rooted in Ansoff’s (1976) concept
of weak signals, which are inadequately defined and vaguely structured pieces
of information, which forewarn of the occurrence of strategic discontinuities (e.g.
changes of trend). “The concept of weak signals is based on the assumption that
discontinuities in technological, economic, social and political environment do not
appear at random, neither are they unpredictable, but rather that they can be

174
spotted by means of weak signals, since such discontinuities are set in motion by
people and their interests” (Bedenik et al., 2012).
"Weak signals" according to Ansoff (1976) are indisputable in the scientific
literature. The early perception of relevant, qualitative, however imperfect and not
clearly defined, information is one of the primary tasks of the early Enlightenment
(Hammer, 1998). Conjectures, predictions, dissemination of new ideas and views
in the media, opinions of key individuals or influential institutions, as well as
expectations about imminent events can be examples of weak signals. Such
information from the business environment with relatively unstructured content
can indicate innovations, needs, and discontinuities (disasters). Weak signals are
distinguished in particular by the fact that they are relatively unstructured
information whose informational value is severely limited. They often refer to
uncertain, utopian or apparently unrealistic ideas. They also often affect creeping
changes, are mostly intuitive and qualitative in nature and do not allow clear
conclusions (Bedenik et al., 2012).
Due to the variety of interpretation possibilities such as "third variable" (Krystek,
1987) and their initially small influence on the overall system, they initially remain
unnoticed, because the sooner the information is perceived, the more difficult the
interpretation and forecast of their development are (Hauff, 2010). Only after
accumulating and exceeding tolerance limits, they can lead to abrupt changes in
the level or direction of the system, where it is possible to recognize clearly the
importance and practical relevance of such soft factors (Liebl, 1996). Ansoff
(1976) distinguishes between five uncertainty levels (States of Ignorance), where
each has a different information content.
As shown in the figure 27, the first uncertainty condition (Sense of
Threat/Opportunity) represents the highest level of ignorance in which it is only
known that a threat or opportunity is present. Neither its form nor its source can
be determined. In the second stage (Source of Threat/Opportunity) it is now
possible to identify the source of the change, but the precise characteristics of
the threat or opportunity are not yet determined. This is achieved only in the third
stage of uncertainty (Threat/Opportunity Concrete). Only here it is possible to
determine the exact nature of the impact and the timing of the threat or

175
opportunity. Based on this, during the fourth stage (Response Concrete) the
counteractions and strategies can be developed. Finally, in the fifth stage
(Outcome Concrete) the consequences of the proposed measures and their
impact on the company's success can be determined (Ansoff, 1976).
Figure 27 Knowledge-State of Discontinuity
Source: Kirschkamp (2007)
As a representation of appropriate counteractions, Ansoff (1976) developed the
Strategic Issue Analysis. Therein, the impact of unusual events on the respective
business segment is estimated and analyzed. In parallel, during a ready
diagnosis, the reactivity of the individual business units is analyzed. After this
opportunity-susceptibility-analysis the efficiency of reactions observed and
appropriate priorities, readiness levels, and measures are defined by cost-benefit
analysis (Koslowski, 1994).
However, at first the Weak Signals should be detected. Two ways exist: by
monitoring, which is the analysis of the environment limited to a single

176
phenomenon, and by scanning, which is the activity of acquiring information
(Kirschkamp, 2007).
6.2.1.1 Scanning and Monitoring
Weak signals, as shown in the table 9, will be recorded by direct or non-direct
observation of early enlightenment relevant environmental and corporate
divisions (Liebl, 1996). While in the directed search a defined observation area is
monitored with predetermined indicators, the non-directional observation
corresponds to a dynamic environment analysis outside specified fields of
observation and indicators (Hammer, 1998). Such scanning, which, in principle,
includes all forms of information-gathering, is suitable. In contrast, monitoring is
an activity equivalent to an in-depth search for additional information on
previously identified phenomena (Liebl, 1996).
Undirected search Directed search
Informal
The scanning for weak
signals outside the
domain and without a
focus on a specific
topic.
The scanning for weak
signals inside the
domain and without a
focus on a specific topic.
Scanning
Formal
The scanning for weak
signals outside the
domain,
concentrating on a
specific theme.
The scanning for weak
signals inside the
domain, concentrating
on a specific theme.
The observation and
deeper search for
information outside
the domain,
concentrating on the
specific topic
regarding an
identified signal.
The observation and
deeper search for
information inside the
domain, concentrating
on the specific topic
regarding an identified
signal.
Monitoring
Table 9 Differentiation of scanning and monitoring by basic activities during the detection phase
Source: Krystek and Müller-Stewens (1993)

177
In contrast to the informal search, during the formal observation the examined
topic is known (Koslowski, 1994). The directional and non-directional monitoring
of the business environment through a monitoring and scanning system is a
prerequisite for further analysis. The quality of forecast also depends on the
scanning frequency, the orientation dimension of observation areas and the
information efficiency (Hammer, 1998). With continuity, the integration of the
scanning in the corporate culture and the necessary financial support increases
(Koslowski, 1994). The probability of detection of discontinuities to analyze their
effects and to develop appropriate reactions increases with the breadth of the
observations (Liebl, 1996). A free exploration enables the observer, in addition to
the experiencing of the recovery of data and the realization of new views and
methods, to point out the existing data gaps and can trigger a targeted search
(Koslowski, 1994).
6.2.1.2 Sources of Weak Signals
In this context, the question arises, where and what could be possible sources of
these weak signals. There are basic differences between internal and external
sources (Koslowski, 1994). Internal sources include primarily the controlling and
accounting. However, information from memos, reports and card files can be
helpful. It is also important not to forget the knowledge and personal experience
of corporate members (Hauff, 2010). Also, if the external information gap about
markets, competitors, economic cycle and law, is still big in SMEs, which is a
latent danger for decision-making, the manager should be aware which
information is necessary, where the sources are for this information and which
methods can provide this information (Mischon, 1982).
External sources naturally still include newspapers, magazines or books. To this
can be added personal information, for example through information from
seminars or fairs (Röttger, 2005). Another important source of weak signals is the
Internet (Krystek et al., 2007), especially since this offers a variety of information,
to which one has a flexible, timely and resource-efficient access (Sonnenschein,
2005).
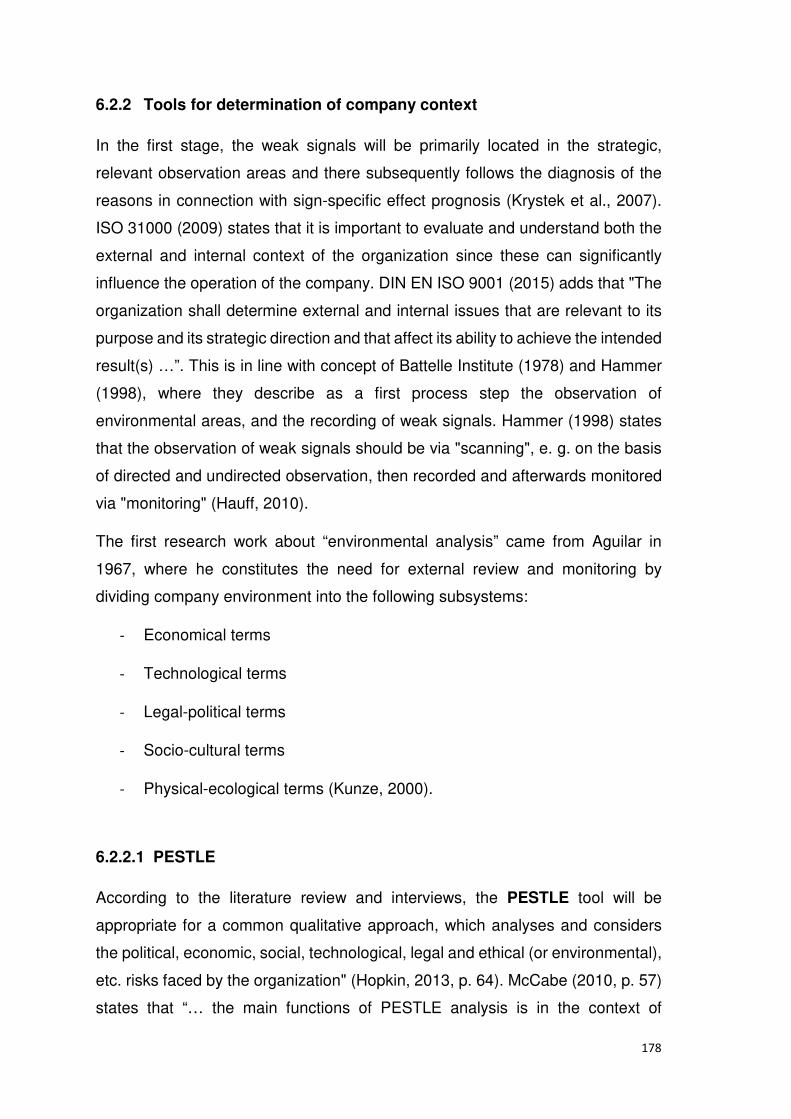
178
6.2.2 Tools for determination of company context
In the first stage, the weak signals will be primarily located in the strategic,
relevant observation areas and there subsequently follows the diagnosis of the
reasons in connection with sign-specific effect prognosis (Krystek et al., 2007).
ISO 31000 (2009) states that it is important to evaluate and understand both the
external and internal context of the organization since these can significantly
influence the operation of the company. DIN EN ISO 9001 (2015) adds that "The
organization shall determine external and internal issues that are relevant to its
purpose and its strategic direction and that affect its ability to achieve the intended
result(s) …”. This is in line with concept of Battelle Institute (1978) and Hammer
(1998), where they describe as a first process step the observation of
environmental areas, and the recording of weak signals. Hammer (1998) states
that the observation of weak signals should be via "scanning", e. g. on the basis
of directed and undirected observation, then recorded and afterwards monitored
via "monitoring" (Hauff, 2010).
The first research work about “environmental analysis” came from Aguilar in
1967, where he constitutes the need for external review and monitoring by
dividing company environment into the following subsystems:
- Economical terms
- Technological terms
- Legal-political terms
- Socio-cultural terms
- Physical-ecological terms (Kunze, 2000).
6.2.2.1 PESTLE
According to the literature review and interviews, the PESTLE tool will be
appropriate for a common qualitative approach, which analyses and considers
the political, economic, social, technological, legal and ethical (or environmental),
etc. risks faced by the organization" (Hopkin, 2013, p. 64). McCabe (2010, p. 57)
states that “… the main functions of PESTLE analysis is in the context of

179
‘environmental scanning’, an analytic process described as necessary in terms of
understanding about events and trends in the external environment”. Breitkreuz
& Lange (2011) add that the PESTLE analysis is a model which adds to the
environmental analysis. Allenspach (2006), in contrast, states that it belongs
more to the strategic work, where the main-, and sub-, aims will be analyzed.
Notwithstanding the fact, according to the research from Bedenik et al. (2012),
that this tool is not well known in practice, we see a high degree of need for weak
signals, as described above, to analyze and to fix the environment of the
company, which can be best done by a systematic tool like PESTLE.
However, the scanning and monitoring should include the micro and macro
environment (Trustorff, 2012). Ruderer (2009) narrows it down by stating that the
scanning and monitoring of an EWS should primarily focus on the external area
including macroeconomic, political, social and ecological environment by the
inclusion of the supplier’s sales market. On the other hand, the direction of an
EWS concerning the internal area is marginal. Rieser (1980) adds the factor of
the technological environment.
Furthermore, Mischon (1982) recommends the determination of the
organizational context by subdivision in different areas (external, intercompany
and internal areas), followed by reasons/symptoms and indicators, which will be
explained in chapter 6.4 and summarized in a table. Ohligschläger & Below
(2015) describe that the external issues arising from legal, technological,
competitive, market, cultural, social and economic environments, whether
international, national, regional or local. ISO 31000 (2009) mentions the same
areas and adds regulatory, financial, key drivers and trends having an impact on
the objectives of the organization and relationships with, and perceptions and
values of, external stakeholders, which should be considered.
Mischon (1982) also names the intercompany scope by including suppliers,
customers, competitors, and banks. Ohligschläger & Below (2015) add that
besides the customers, there are other people, owners, cooperation partners,
society, occupational unions, and associations. The DIN EN ISO 9001:2015
claims to understand the needs and expectations of interested parties, where
"The organization shall monitor and review information about these interested

180
parties and their relevant requirements." (DIN EN ISO 9001, 2015, p. 19). Hinsch
(2014), in contrast, states that the company has to analyze the requirements and
the expectations of the stakeholders and adjust their strategic plan according to
the interested parties.
Additionally, even if the internal area is often ignored, it includes important
information which should be searched for amongst the governance,
organizational structure, roles and accountabilities; policies, objectives, and the
strategies that are in place to achieve them; the capabilities, understood in terms
of resources and knowledge (e.g. capital, time, people, processes, systems and
technologies); information systems, information flows and decision-making
processes (both formal and informal); relationships with, and perceptions and
values of, internal stakeholders; the organization’s culture; standards, guidelines
and models adopted by the organisation; and form and extent of contractual
relationships” (ISO 31000, 2009, p. 10). The understanding of the internal context
can be also facilitated by considering issues related to values and performance
of the organization, which could be a combination of internal and external factors
(DIN EN ISO 9001, 2015). Ohligschläger & Below (2015) add that the company
has to monitor and review the information about the interested parties and
analyze how they interact with each other.
6.2.2.2 Cross-Impact-Analysis
The interaction can be analyzed by CIA (Liebl, 1996). “Cross-Impact-Analysis
is a method used in forecasting exercises aimed at measuring the correlation
between future events (variables)” (Ferretti, 2016). It is a method, which shows
the interdependency during a problem area and creates understanding for
connections (Wirtschaftslexikon, 2016). CIA is applied to identify how
developments in one area interact with those in another (Schlüter, 2004). Its
ability is to show how one situation impacts another situation (Ferretti, 2016).
Here, various events of their interactions will be examined and evaluated (Liebl,
1996). This is in line with the concept of Hammer (1998) where he states that the
results must be subjected to a first relevance test during the first step. The
examined interdependencies especially include the effect of each on the
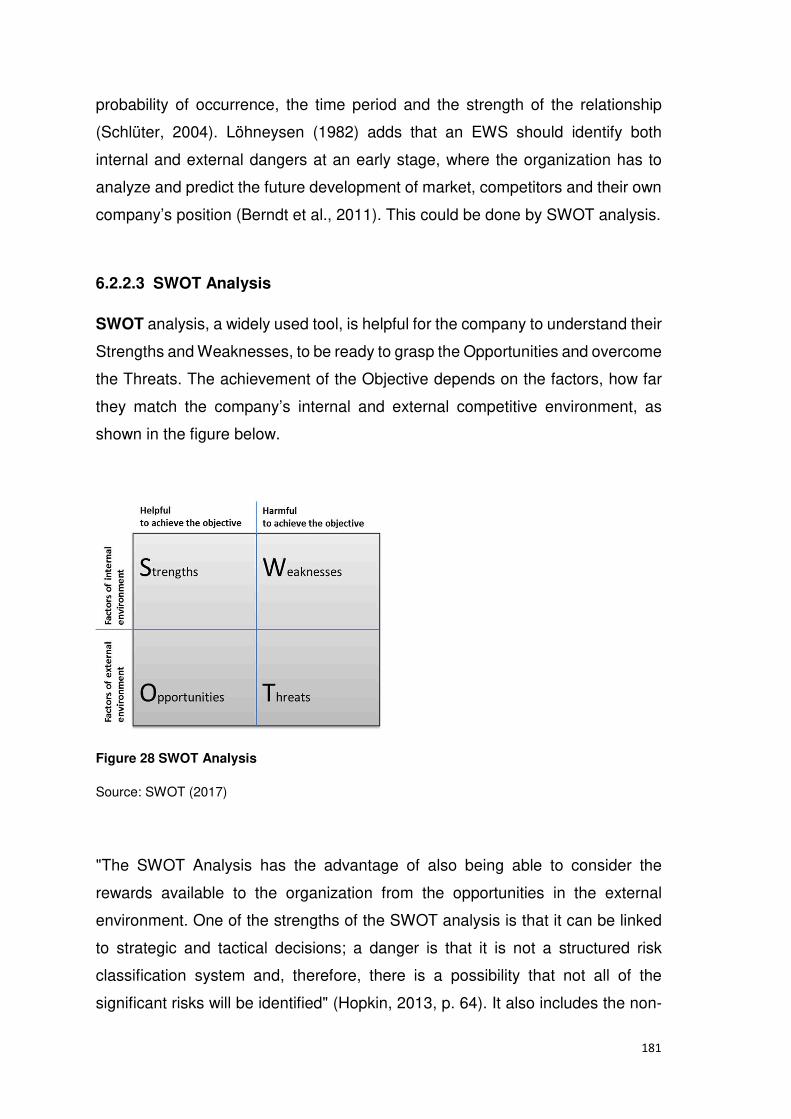
181
probability of occurrence, the time period and the strength of the relationship
(Schlüter, 2004). Löhneysen (1982) adds that an EWS should identify both
internal and external dangers at an early stage, where the organization has to
analyze and predict the future development of market, competitors and their own
company’s position (Berndt et al., 2011). This could be done by SWOT analysis.
6.2.2.3 SWOT Analysis
SWOT analysis, a widely used tool, is helpful for the company to understand their
Strengths and Weaknesses, to be ready to grasp the Opportunities and overcome
the Threats. The achievement of the Objective depends on the factors, how far
they match the company’s internal and external competitive environment, as
shown in the figure below.
Figure 28 SWOT Analysis
Source: SWOT (2017)
"The SWOT Analysis has the advantage of also being able to consider the
rewards available to the organization from the opportunities in the external
environment. One of the strengths of the SWOT analysis is that it can be linked
to strategic and tactical decisions; a danger is that it is not a structured risk
classification system and, therefore, there is a possibility that not all of the
significant risks will be identified" (Hopkin, 2013, p. 64). It also includes the non-

182
financial aims and can be used as a qualitative tool (Allenspach, 2006). In
summary, it can be said that SWOT can be seen as a matrix, where the relevant
results are summarized, analyzed and used as a basis for further actions.
However, after the determination of the organizational context, the company also
has to identify sources of risk, areas of impact, events, by including changes in
circumstances, their causes, as well as their potential consequences and adjust
their strategic plan accordingly (Hauff, 2010). Hammer (1998) adds that after the
observation of weak signals via "scanning", e.g. on the basis of directed and
undirected observation, they should be recorded (Hauff, 2010) and after the first
relevance test, the risks have to be identified by the application of appropriate
tools.
6.3 Risk Identification
The phase of risk identification includes the collection of actual and future
(potential and latent) risks, which is the most important step during risk
management, where the result of this stage is essential for all following steps
(Krystek & Fiege, 2015). The aim of this phase is to identify all risks which are
essentially dangerous for the target achievement (Altstetter, 2008). Ruderer
(2009) explains that the organization should identify sources of risk, areas of
impact, events, by including changes in circumstances, their causes, and their
potential consequences, for the reason that after prediction and clarification
activity, the counteraction could be carried out by the decision makers.
However, as risk management takes place between the poles of customer
requirements and customer satisfaction (Brühwiler, 2001), it is proposed for the
second stage to use the existing QMS (Foster, 2013), where the process is driven
by customer expectation (Evans, 2014) and by using the Plan-Do-Check-Act
(PDCA) cycle with an overall focus on risk-based thinking aimed at taking
advantage of opportunities and preventing undesirable results, where often the
output from one process becomes the input for another process (DIN EN ISO
9001, 2015). Furthermore, Crönetz et al. (2009) cite EWS success factors
comprising market, company background/identity, continuous improvement,
resources, structure, processes, and competence. These factors, as described

183
above, are regulated in ISO 9001 (Hinsch, 2014), which affirms the
appropriateness of analysis of the recognized discontinuities from the first stage
during the QMS.
The risk identification in the EWS context is located in the described construct
during the QMS, which is marked in figure 29 by Number 2. The appropriate tools
will be described in this chapter.
Figure 29 Methods for risk identification
Source: own illustration

184
6.3.1 Tools for risk identification
Hauff (2010) states that with the identification of a weak signal, the documentation
and categorization begin with a simultaneous relevance test (for example,
reinforcing of existing weak signals). From the collected information, which can
additionally be supported by Creativity methods (Brainstorming or Brainwriting),
specific diffusions or behavior patterns can be found by mathematical and
statistical methods and prognoses made. By taking into account the likelihood of
occurrence and rankings for their relevance, the discontinuity can be assessed
more accurately. According to the concept of Hammer (1998) risk and opportunity
random ranges permit a transparent presentation of different stages of the
diffusion process and the urgency of the implementation of reaction strategies.
6.3.1.1 Diffusion Theory
Existing or emerging problems that can not be solved over a long period by an
accepted model of a scientific field (paradigm), call for new approaches. A
paradigm change, as a result of the concretization of vague guesses, is usually
associated with a deeper impact on the social structure. It is necessary to
recognize such changes early, as the new ideas, after having been analyzed by
representatives of conventional paradigms, will diffuse throughout society, and -
by new structured principles, views, and values - trigger change. Due to
uncertainties regarding existing paradigms and invariants of diffusion support
(Innovation attitude) the implementation of such change is possible. The diffusion
theory includes empirically more or less secure rules for the diffusion of events,
ideas, innovations. The infection effect in the spread of new forms of behavior in
the focus of diffusion research, whose results are shown in structural curves
(diffusion functions). They interpret distribution patterns, which were derived from
empirical studies (Krystek & Müller-Stewens, 1993).
However, the detection of diffusion patterns is divided into three different types of
infection. Innovations spread either by infection of a constant percentage of
uninfected persons per unit of time or by exponential infection, where the new
ideas are transmitted from subject to subject. Also, combinations of constant and
exponential extending diffusions can be observed (Hammer, 1998). The benefit
185
of the practical application of diffusion functions as an early enlightenment
concept lies in the time gain, which leads to a better adjustment to changes in the
business environment.
It is possible to set limits on trend reactions earlier and to make better decisions
and greatly reduce risk, especially in long-term investment projects. Trend lines,
which are adapted to the situation, representing the designed diffusion functions,
are based on several considerations. Changes do not run randomly, but
represent development mechanisms and follow a distribution pattern. Special
events (weak signals) are usually the trigger for changes. The recording of such
signals can be improved by setting up a "corporate radar" (Hammer, 1998). With
the systematic and continuous monitoring of risks and opportunities, strategic
thinking can begin. The amplification of signals and their meanings, enable the
planning and preparation of concrete measures, where failures and over-
reactions can be avoided by timely warnings and adequate preparation and
response times.
6.3.1.2 Trend Landscape
To be able to handle this flood of information, Liebl (1996) recommends using
one of the well-known instruments for early detection: the generation of trend
landscapes. This is especially helpful in relation to the processing of the
information obtained through the scanning and monitoring. Herein the
development of individual discovered trends should be checked for correlations
and thematically combined or aggregated to curable trends (Schlüter, 2004). This
combination of trends to form trend landscapes has several advantages as a
result:
- the cognitive load can be manageable (Neubauer & Solomon, 1977)
- the flood of information leads quickly to clarifying failure (Wilensky, 1967)
- system relationships can be far better diagnosed in such sufficiently
demarcated analysis units (Liebl, 1996).
The recovery of the trend landscapes can be accomplished for example with the
help of the cross-impact analysis (Liebl, 1996). Here, various events of their

186
interactions will be examined and evaluated. The examined interdependencies
especially include the effect of each on the probability of occurrence, the time
period and the strength of the relationship. The individual factors will be assessed
separately with 0 to 1 and listed in the form of a matrix so that these interactions
can be evaluated quantitatively (Schlüter, 2004). Trends with high
interdependence can then be combined to Trend Landscapes (Krystek & Müller-
Stewens, 1993).
In this stage, the weak signals will be primarily located in the strategic relevant
observation areas and there subsequently follows the diagnosis of the reasons in
connection with sign specific effect prognosis (Krystek & Müller-Stewens, 1993).
Based on the prognosis results, appropriate scenarios will be built (Hauff, 2010).
6.3.1.3 Scenario technique
The term "scenario" comes from Latin and means scene representation.
Analogous to the situation created by stage and scenes giving a thematic outline
to a play, so should scenarios create a framework for strategic planning (Götze,
1993). In general, a scenario represents a future situation and the development
of the path from today into the future. The description of the general business-
related scenario technique and its practical application varies in the literature.
According to studies, it is used by more than 60% of the (surveyed) enterprises
for forecasting (Koslowski, 1994). It has, therefore, despite former fierce criticism,
gained ground as a strategic tool in practice. For the most plausible description
of scenarios, the probabilities of relevant environmental developments are
aggregated, using quantitative and qualitative data. This essential condition will
be created to prepare for various future developments of the company. In order
to answer the questions about the origin of a hypothetical situation and the
respective alternatives progressively, different analysis, forecasting, creativity
and brainstorming techniques are integrated into a stepped approach, whose
main task is to convert collected strategic information into new knowledge and
consistent alternatives. The resulting focus on key uncertainties, in scenario
creation, usually leads to the indication of a trend scenario, which is a surprise-

187
free development by creating a positive and negative extreme scenario (contrast
scenarios), by which it will be supplemented, shown in the figure below.
Figure 30 Scenario Funnel
Source: Krystek et al. (2007)
Opportunities and potential risks can be obtained through the recognition of
factors and their mode of action on the development direction of the overall
scenario. Thus objectives and problems can be discovered, existing plans
checked and strategic alternatives developed, evaluated and decided (Götze,
1993). There are different, method-dependent approaches to creating a scenario.
The multi-stage scenario process begins with the task analysis. Its aims and
strategies of the company are evaluated and summarized in order to analyze the
subject matter of the present situation. Basically operational potentials and risk
moments are revealed for example by SWOT analysis, already explained, during
the determination of organization context. In addition, an existing portfolio
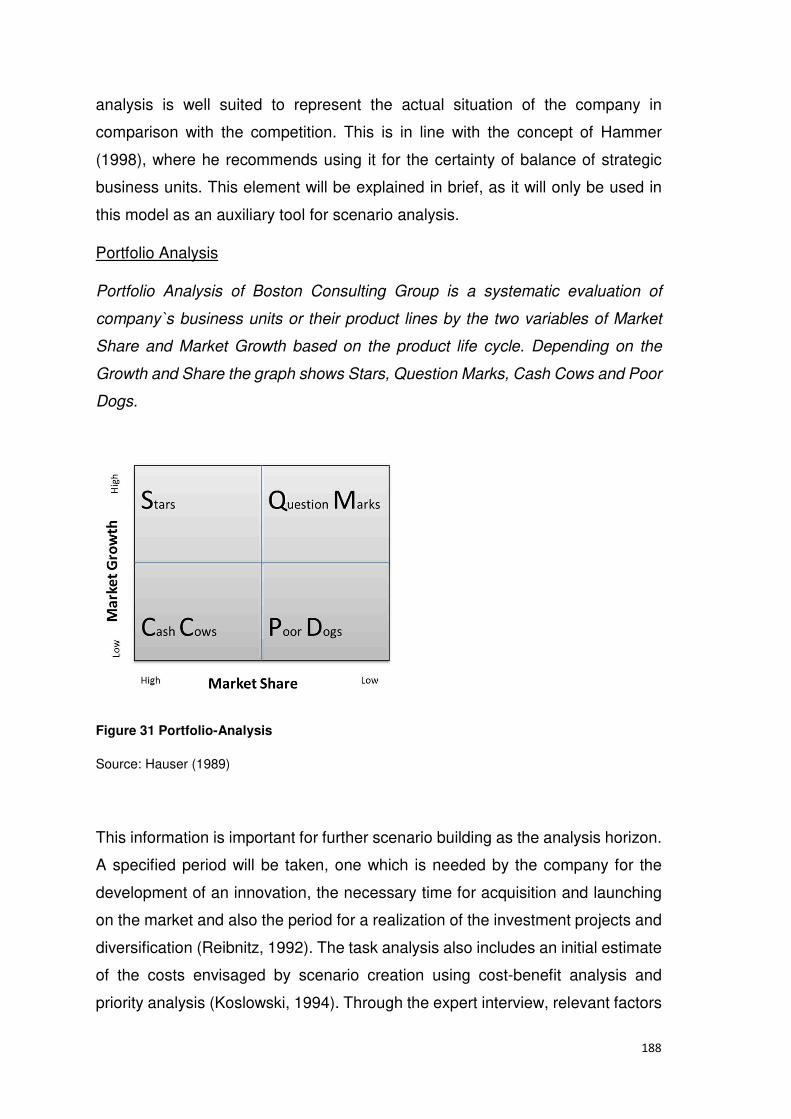
188
analysis is well suited to represent the actual situation of the company in
comparison with the competition. This is in line with the concept of Hammer
(1998), where he recommends using it for the certainty of balance of strategic
business units. This element will be explained in brief, as it will only be used in
this model as an auxiliary tool for scenario analysis.
Portfolio Analysis
Portfolio Analysis of Boston Consulting Group is a systematic evaluation of
company`s business units or their product lines by the two variables of Market
Share and Market Growth based on the product life cycle. Depending on the
Growth and Share the graph shows Stars, Question Marks, Cash Cows and Poor
Dogs.
Figure 31 Portfolio-Analysis
Source: Hauser (1989)
This information is important for further scenario building as the analysis horizon.
A specified period will be taken, one which is needed by the company for the
development of an innovation, the necessary time for acquisition and launching
on the market and also the period for a realization of the investment projects and
diversification (Reibnitz, 1992). The task analysis also includes an initial estimate
of the costs envisaged by scenario creation using cost-benefit analysis and
priority analysis (Koslowski, 1994). Through the expert interview, relevant factors

189
in the local and neighboring systems are specified in the following impact
analysis. Subsequent measurement and presentation of influences and their
interdependencies in networking diagrams lead to statements about the system
dynamics of the environment (Reibnitz, 1992). Based on the factors obtained,
descriptive KPIs will be determined by trend projections. For further scenario
development, critical descriptors with marked inconsistency are of particular
importance. In addition, indicators with a low level of information that were
previously classified as relevant, are important in terms of the early enlightenment
in the environment development. For the purposes of monitoring, they will be
observed and with the increase of information will be integrated into the scenario.
Different developments of critical descriptors can lead to mutual gains or
exclusions (Koslowski, 1994).
Cross Impact Analysis or cluster analysis allows the verification of various
alternatives for consistency and logic (Götze, 1993). During the interpretation, the
consistent adoption bundles with uncritical descriptors are supplemented, and the
interaction evaluated. A likely, optimistic and pessimistic scenario is created.
During a subsequent analysis after problem or opportunity fields' derivation, the
necessity of action will be determined. The results serve as an orientation for
future planning phases. External and internal, abruptly occurring disruption
events (Hammer, 1998), which may not be unfavorable, but have a significant
effect on the company, require the development of preventive and reactive
measurements. The disruption event analysis designates such events and
integrates them into the scenario. The identification of trend reversals, their
entrance likelihood, timing, and significance are carried out by creative
techniques or Discontinuity Survey.
The scenario transfer represents the interface with other decision-making tools.
With its extension, during the construction of the scenario lessons learned in
connection with a repeated check of the results, it is possible to develop a guiding
strategy. By incorporating techniques from other scientific areas, the scenario
technique meets the requirement of forecasting as a multi-paradigm research. It
is used because of the variety of its analysis and interpretations as a basis for
further design possibilities. Complex, internally consistent pictures of the future
can be predicted, critical factors and their impact are highlighted. Scenarios allow

190
a conscious projection of discontinuities and simulation of effects and counter-
strategies. Early identification of opportunities and threats is possible, so that
action can be taken before the onset of disorders. The success of the scenario
technique depends largely on the know-how and the selection of participants
(Götze, 1994) and their information supply. By thinking and planning in
alternatives, there is an awareness of the detection of weak signals and their
detection by a high level of heterogeneity much more likely (Koslowski, 1994).
However, obtaining results by this forecasting method, depending on the analysis
of intensity and the presence of already-applied KPI, portfolio or other analytical
instruments, is a relatively high personnel-, and time-consuming activity (Götze,
1993). This mostly corresponds with the existing concepts of Battelle Institute
(1980) and Hammer (1998), where their recommendation, based on prognosis
results, is to build scenarios, which will be compared with the strategic planning
for sufficient deviation.
Comparison between the premises of the strategic planning and the sign specific
scenario results
The premises from the sign specified scenario derived statement will be
compared with strategic planning. Only if there is an adequate deviation between
premises of the strategic planning and scenario results will the next step follow
(Hauff, 2010).
Evaluation of the deviation determination
Before the search for alternative treatments, the relevance of weak signals and
the urgency of possible action should be determined. If it does not show enough
relevance for the development of the company, the process of the strategic early
recognition can, at this point, be stopped or started with a new search for weak
signals (Hauff, 2010).
6.3.1.4 Planning
After selection of the relevant discontinuity there follows under the direction of
known planning techniques, the development of strategic alternative treatments
for the handling of the imminent change (Hauff, 2010). It is important that the

191
company knows its strengths and weaknesses and plans accordingly. This
should include business strategy, finance, investment and personal plans, as well
as market and competition analysis, which should include risk analysis,
observation of macroeconomic facts and product developments (Hinsch, 2014).
Krystek (1987) adds that planning helps to rethink all possible
events/developments with crisis potential in advance in order to react fast when
a crisis occurs.
When planning, the organization shall consider the issues and determine the risks
and opportunities to avoid undesirable effects (Ohligschläger & Below, 2015). “A
plan prepared to take advantage of, or to minimize the effect of, an event which
is considered to be unlikely to occur but which, if it did, would have a considerable
impact on the organization's ability to achieve the objective” (Krystek, 1987, p.
132). Risk orientation is a task of top management (Hinsch, 2014) and has to be
able to give assurance that the management system can achieve its intended
result(s); enhance desirable effects; prevent, or reduce, undesired effects and
achieve improvement (DIN EN ISO 9001, 2015).
"The organization shall determine and provide the resources needed for the
establishment, implementation, maintenance and continual improvement of the
quality management system.
The organization shall consider:
a) The capabilities of, and constraints on, existing internal resources;
b) What needs to be obtained from external providers” (DIN EN ISO 9001,
2015, p. 25-26).
This especially includes People, Infrastructure, Environment for the operation of
processes, Monitoring and Measuring Resources, Organizational Knowledge,
Competence, Awareness, Communication and Documented Information (Tricker,
2014).
The adoption of a management system has to be a strategic decision for an
organisation that can help to improve its overall performance and provide a sound
basis for sustainable development initiatives, where the design and
implementation will be influenced by its varying needs, objectives, products

192
provided, processes employed and the size and structure of that organisation
(Tricker, 2014). Hinsch (2014) adds that the ISO requires the clear strategic
position of an organization.
Strategic Management means that you make a plan for the future for about 5 to
10 years, where you set an aim. During this period things will be changed, such
as markets, environment and so on (Fiedler, 2001). To be prepared and to be
able to recognize these occurrences, the company has to have a working
Strategic Management System, which should consider, after determination of the
context, the identified sources of risk, areas of impacts, events, by including
changes in circumstances, their causes and their potential consequences
(Ruderer, 2009).
A successful leader has to know the company processes, constantly develop new
goals, innovate, make sure that the organization is still true to its core values, and
continues to nurture a culture that fosters continual learning (Frontiera & Leidl,
2012). This considers factors and criteria like customers, quantity and costs and
time simultaneously (Seghezzi et al., 2007). All spheres from customer to
employee to subcontractor should be taken into account by the support of
appropriate tools.
6.3.1.5 Turtle Diagram
Turtle Diagram is a useful tool for describing, understanding and analyzing
processes. This utilizes four legs to represent four questions about a process
(with whom, with what, how, how many); and a head and tail to represent the
questions about the process inputs (what should we receive) and the process
outputs (what should we deliver to meet expectations); the shell of the turtle is
used for the process name (Jaeger, 2016). It sensitizes people to interfaces,
shows dependencies, transparency and determines measurements (TÜV, 2013).
The gathered data is useful for risk identification and builds the basis for a
systematic risk management (Benes & Groh, 2014). The consolidation of all risks
from all processes can be used as the basis for a holistic risk management (TÜV,
2013). At the end is it appropriate to conduct an SWOT-Analysis for validation of

193
the process, which shows improvement opportunity at the same time (Hallbauer
et al., 2015).
6.3.1.6 FMEA
Failure modes and effects analysis (FMEA), also known as failure modes, effects,
and criticality analysis, is used to identify ways a process or product can fail to
meet critical customer requirements (Foster, 2013). It is used to determine high-
risk functions or product features based on the impact of a failure, where it
systematically considers each component of a system, identifying, analyzing, and
documenting the possible failure modes within a system and the effects of each
failure on the system (Pyzdek & Keller, 2013).
Brühwiler (2003, p. 48) explains it in more detail, “This standard establishes
requirements and procedures for performing a failure mode, effects, and criticality
analysis (FMECA) to systematically evaluate and document by item failure mode
analysis, the potential impact of each functional or hardware failure on mission
success, personnel and system safety, system performance, maintainability, and
maintenance requirements. Each potential failure is ranked by the severity of its
effect so that appropriate corrective actions may be taken to eliminate or control
the high-risk items". Ruderer (2009) adds that the FMEA concentrates more on
the effect of the failure than the cause, where the aim is to avoid the potential
failure during the development of a product or establishment of a process, which
means it is also an appropriate tool for the food production industry.
FMEA is a preventative model, where it is important to recognize the failure as
early as possible (Romeike & Hager, 2013). FMEA uses a nine-step process:
1) Assign an identifier to each component
2) List functions for each part
3) List one or two failure modes for each function
4) Describe effects of each failure mode
5) Determine hazard likelihood and categorize

194
6) Estimate likelihood of failure
7) Estimate failure detection
8) Identify highest risks
9) Eliminate or reduce highest risks (Foster, 2013).
The main problem during the risk management process is that the risks which will
be not recognized, can also not be analyzed and managed, which could mean
enormous harm for the company (Altstetter, 2008). Ellenbürger et al. (2009)
recommend combining the tools according to the risk profile for maximized
completeness of risk identification. Schmitz (2006) states that especially the
FMEA and HACCP in combination for the food production industry have a wide
range of method steps to build up self-control systems for risk control and risk
monitoring, which should be analyzed individually for each company.
6.3.1.7 HACCP
“Hazard Analysis and Critical Control Point (HACCP) has been recognized
internationally as a logical tool used in the food industry to identify potential food
safety hazards so that preventive actions can be taken to mitigate the potential
risks. The system continues to be used at all stages of the food supply chain”
(Reuvid, 2013, p. 151). Petersen & Nüssel (2013) describe HACCP as a QM
method, which consists of seven following principles:
- Procedure of a Hazard Analysis
- Determination of Critical Control Points
- Determination of Critical Limits
- Monitoring of Critical Control Points
- Determination of Corrective Actions
- Verification of the HACCP system
- Documentation

195
Ruderer (2009) adds that HACCP is an important tool in the food production
industry for a systematic risk identification. Romeike & Hager (2013) go a step
further and state that HACCP is a method which can save the food production
industry and at the end protect the consumer.
“The aim of this step is to generate a comprehensive list of risks based on those
events that might create, enhance, prevent, degrade, accelerate or delay the
achievement of objectives, where it is important to identify the risks associated
with not pursuing an opportunity, as comprehensive identification is critical,
because a risk that is not identified at this stage will not be included in further
analysis” (ISO 31000, 2009, p. 17).
The principles I and II of COSO II are to identify all possible occurrences, without
risk evaluation, which could have a positive or negative effect on the execution of
strategy or achievement of objectives (Hillebrand, 2005). Identification should
include risks whether or not their source is under the control of the organization,
even though the risk source or cause may not be evident (Crönetz et al., 2009).
Risk identification should include an examination of the knock-on effects of
particular consequences, including cascade and cumulative effects, where it has
to sample all possible information about known and unknown risks and to
summarize those (Altenähr et al., 2009). It should also identify what might
happen, where it is necessary to consider all possible causes and scenarios that
show what consequences can occur (Schmidt, 2015).
6.3.1.8 Fault Tree Analysis
Fault Tree Analysis (FTA) is a top-down, deductive failure analysis, which
analyses all possible reasons for one undesired deviation (a major event), which
by interrelation cause the disruption (Ruderer, 2009). Allenspach (2006) states
that the FTA has the advantage that it also considers ‘soft facts', such as
technology, people, etc. Ruderer (2009) adds that the deviation from qualitative
to quantitative is also possible within this method. Brühwiler (2003), in contrast,
states that FTA is a quantitative tool, which calculates the probability of
occurrence of complex scenarios, when the connection of the event is known. He

196
adds that this method traces this event back to its root for the finding of reasons.
"Fault tree analysis (FTA) is an analytical tool that graphically renders the
combination of faults that lead to failure of a system" (Foster, 2013, p. 202). It is
an appropriate tool for reliability and safety analysis (Marshall, 2012). Foster
(2013) adds that the technique is useful for describing and assessing the events
within a system. Romeike & Hager (2013) go a step further and state that fault
tree analysis is an appropriate tool for simulation by which causes will be
analyzed with the aim of producing a statement of liability, security, and
availability. For the security of the analysis results, it is also possible to use the
Delphi-Method (Löhr, 2010). In Hammer's (1998) third step there follows
verification through objective and reasonable relevance, which is done by using
a so-called discontinuity survey of experts (similar to Delphi Method) in terms of
their assessment of a specific question. Müller & Zeiser (1980) add that,
according to this survey, three aims should subsequently be reached:
determination of the potential impact of potential changes, determination of the
probability of the appearance of these and finally the assessment of the necessity
and urgency of reaction strategies.
6.3.1.9 Delphi Method
This is a method of expert survey for creating quantitative forecasts, which has
proved itself in the generation of forecast information and assessment of changed
constellations and discontinuities. The basic concept refers to the generally better
results in the structuring and analyzing of problems by a group of experts
compared with individual assumptions (Götze, 1993). The experts estimate
anonymously, via standardized questionnaire, future developments, both
qualitatively and quantitatively. The consensus of opinion obtained at the end
builds a basis for strategic planning (Koslowski, 1994). Carrying out the Delphi
Method is performed by a so-called monitor group, which can include, in addition
to corporate employees, consultants or market researchers, responsible for
defining the problem domain, the preparation of questionnaires, the evaluation of
results as well as providing additional information (Götze 1994).

197
The quality of the results depends primarily on the expertise of the respondents
with respect to the subject area and method of application. A combination of in-
house and external experts prevents operating and industry blindness. The scope
and design of the questionnaire focus on the accuracy of the material and
temporal classification of possible future events. The obtained data will be
analyzed after the survey and aggregated to form a group judgment, where the
quantitative results will be analyzed statistically, so that quartile margins, whose
combined scattering, and outliers can be identified. Qualitative statements, in
contrast, will be, as far possible without overlapping, combined to form
homogeneous cluster class statement summaries, making the recognition of
structures possible. In order to achieve a general consensus, by checking and
possible modification of the method of taking statements, it repeatedly confronts
experts with the statistical results (Götze, 1993).
The final qualitative and quantitative forecast arises from the answers with the
greatest frequency distribution and the median of the last results (Koslowski,
1994). The Delphi Method fulfills the requirements of a process for early
enlightenment. Trends and uncertainties in certain fields of research can be
assessed realistically. Although the expert composition and questions contain a
certain potential for manipulation, this method, through a structured, targeted
approach and anonymity, is more effective than a group discussion (Götze,
1994).
By the flexible use of time and space, a greater number of expert interviews is
possible, which leads to a wider resulting range of views. The isolated
examination of the scope of duties, rigid approach and the individual discretion of
issues, limit the creativity release and the possibilities of the collection of
additional information and weak signals. The unsuitability of the median as a
consensus opinion indicator and signal detection instrument (Götze, 1993),
reinforces the importance of the review, discussion, and gathering of outside
opinions. Despite the relatively high time and resource consumption, the Delphi
Method with specific modifications supports the forecast function well and forms
a solid basis for further analysis and forecasting instruments (Koslowski, 1994).

198
“If the opinion of one expert on an uncertain point is good, the opinion of many
experts will be better” (Löhr, 2010, p. 86).
6.3.2 Summary of Risk Identification
For the reason that the risks should be identified as fully as possible, after the
Diffusion Theory, Trend Landscape, Scenario Technique, Portfolio Analysis and
Planning, follows the detail analysis by following tools: FMEA has the task of
system components, TURTLE of processes, HACCP of critical points during the
food industry, Fault Tree Analysis has the task of identification of a major event
during risk management. Delphi Method, Check Sheets or creativity methods,
such as Brainstorming or Brainwriting, can be used for supporting the above
methods.
However, the main point here is to identify the correct problem (Crönetz et al.,
2009), where the aim is not to identify all of the risks, but those which could
endanger the company aim (Brühwiler, 2003). Ruf (2011) in contrast states that
all possible risks should be identified and monitored. Allenspach (2006) adds that
as many methods of risk identification as possible should be used for reduction
of the blind spots.
Mayer (2008) in contrast refers to § 91 AktG and states that the risk identification
includes only those risks which could endanger the substance of the company.
Schäfer (2001) confirms this definition of § 91 AktG and adds that it would mean
that only the avoidance of illiquidity or over-indebtedness is the aim. According to
the German Law of §§ 17 – 19 InsO illiquidity, the threat of illiquidity or over-
indebtedness means insolvency, which are the last stages of the development of
the crisis process (Crone & Werner, 2012).
At the end the risk identification as a part of the EWS should also consider
recognition of the crisis signs, which could arise very quickly by the oversight of
one or more risks (Schäfer, 2001). An Early Warning System does not focus on
the solution to the problems when they have already reached a certain level, but
it should be possible to discover them early, before they have a disadvantageous
impact on the company (März, 1983). “To finish first, you first must finish”

199
(Pocalyko, 2011, p. 1). Most companies don`t die because they are wrong; most
die because they don`t commit themselves - they fritter away their valuable
resources (Kautt, 2013).
6.4 Risk Monitoring and Review
According to ISO 31000 “The organization’s monitoring and review processes
should encompass all aspects of the risk management process for the purpose
of ensuring that controls are effective and efficient in both design and operation;
obtaining further information to improve risk assessment; analyzing and learning
lessons from events (including near-misses), changes, trends, successes and
failures; detecting changes in the external and internal context, including changes
to risk criteria and the risk itself which can require revision of risk treatments and
priorities; and identifying emerging risks. Progress in implementing risk treatment
plans provides a performance measure. The results can be incorporated into the
organization's overall performance management, measurement and external and
internal reporting activities. The results of monitoring and review should be
recorded and externally and internally reported as appropriate, and should also
be used as an input to the review of the risk management framework” (ISO 31000,
2009, p. 20).
Hinsch (2014) explains it in a more pragmatic way when he states that the
organization should monitor and review information about external and internal
issues, which can include positive and negative factors or conditions for
consideration or so-called risks and chances, which can influence the company.
Brühwiler (2001) sums up with the explanation that the top management should
review the organization’s quality management system at planned intervals, as the
risk management takes place between the poles of customer requirements and
customer satisfaction which builds the landscape of monitoring and review, to
ensure its continuing suitability, adequacy, effectiveness and alignment with the
strategic direction of the organisation, which will be carried out in this model
during the construct, by CO (BSC), described in Chapter 6 and indicated in figure
32 by number 3 and will be explained as a tool in more detail in this chapter.

200
Figure 32 Methods for risk monitoring and review
Source: own illustration
6.4.1 Balanced Scorecard
Wolf (2010) states that BSC as CO tool is appropriate for monitoring and review
and would accordingly fulfill the requirements mentioned above. He adds that the
BSC is based on different characteristics by including the company strategy,
overall view, connection of KPI’s and perspectives by cause and effect, and would
be appropriate as EWS. Brühwiler (2003) in contrast states that the BSC is not
appropriate as “stand-alone” for an EWS, as it does not include the environment,
and is more a target system, where the QM is a leading model, which describes

201
the important elements, processes and functions of a company by the
determination of the organisation context, and together they can build the
appropriateness for an EWS (Brühwiler, 2003).
However, the BSC was developed by Kaplan and Norton in the 90s, and moves
away from the traditional one-dimensional structure by adding the Financial,
Customer, Internal Business Process, as well as Learning and Growth, shown in
the figure below, and combines Vision and Strategy with the Objectives,
Measures, Targets and Initiatives (Weber & Schäffel, 2011).
Figure 33 Balanced Scorecard
Source: own illustration, adapted from Kaplan & Norton (1996)

202
The BSC is a strategic tool, appropriate for designing the whole planning,
monitoring, and control process, which combines the key performance indicators
from the past with the future value drivers (Allenspach, 2006), measurable by
Company Value = Shareholder, Market, Customer, People, Future Value (Töpfer,
2000). Schröder (2005) states that the BSC combines, in comparison with the
Du-Pont-KPI concept (focusing only on KPI's), both the aims and KPIs. This
means that in contrast to a traditional target agreement the BSC does not only
focus on quantitative factors but also on qualitative, as the four stages, in the
cause and effect networking as the previous design area also has to include the
qualitative aims (Töpfer, 2000). Wolf (2010) adds that the conventional KPI-
systems are past and figure/quantitative oriented, where the relation to the
success process and company strategy is missing and the BSC in contrast, can
be described as a link between strategy development and implementation in the
operative business. This was described in the literature review within Concept of
Hammer (1998) as a difficult point, without the naming of an appropriate tool.
Furthermore, Schröder (2005) denotes the BSC as an aim-, rather than a KPI-,
system, where the qualitative aims play a big role, especially for risk
management, where not all information is decision-based but can also be solely
information-based. This means that all relevant risks have to be monitored and
all possible changes to them should be recognized as early as possible
(Altstetter, 2008). According to DIN EN ISO 9001 (2015, p. 9) "Risk-based
thinking enables an organization to determine the factors that could cause its
processes and its quality management system to deviate from the planned
results, to put in place preventive controls to minimize negative effects and to
make maximum use of opportunities as they arise". Reuvid (2013) states that the
organization should establish procedures to monitor and measure the
performance of the asset integrity management system, which should include
qualitative and quantitative measurements: KPIs, audit findings, incident
investigation, etc.

203
6.4.1.1 Extension of BSC
The Balanced Scorecard as a key performance indicator system combines the
strategically significant result figures and performance drivers in four
perspectives. These four perspectives, however, are not fixed. Thus, Kaplan and
Norton expressly recommend providing an adjustment of the basic structure of
the Balanced Scorecard according to corporate and strategic circumstances
(Kaplan & Norton 1996). This means that, depending on the company size or
structure, some further areas of the company could be important. These areas
can be added to the existing BSC as a further perspective, but it is important to
note that this should not become too granular, as otherwise the significance of
the individual KPIs could lose value or the complexity of the BSC could increase
- the choice of perspectives must be strongly geared to the formulated vision and
strategy of the company. For example, each company is in close contact with
credit institutions, but hopefully only a few of them have such strategic
communication with the credit institution that it is necessary to work out key
figures from a lender's perspective (Friedag & Schmidt, 2002).
The need for further perspectives is usually evident during the scanning phase or
development of the company's vision and strategy, when the company will
discover risks that are not covered by the four perspectives. However, examples
of further perspectives could be:
- Supplier perspective
- Lending perspective
- Public Perspective
- Communication Perspective
6.4.1.2 Sustainability Scorecard
Another extension of the existing BSC could be the Sustainability Scorecard. In
all sectors of the economy, a high value is now placed on sustainable trade and
business. Also - or especially - in food production, this trend is gaining more and
more weight, as more and more must be produced in less space and the

204
environment has to be protected. The sustainable and careful use of resources -
both employees and the environment - is of essential importance. A food
manufacturer, for example, is associated with ecological and social aspects of its
products (ingredients, packaging) and production (production methods, suppliers,
emissions, etc.) (Figge et al., 2001). A central task of corporate management is
therefore the efficient handling of shortages.
In order to support appropriate decisions, a company's management generally
establishes management systems. In addition to economic shortages, ecological
and social scarcities are increasingly becoming part of management's activities.
The overcoming of these three shortages is currently being discussed under the
buzzword of sustainability (Nutzinger & Radke, 1995). Where companies
voluntarily increase their environmental or social performance beyond the legally
required minimum, image enhancements (which are difficult to monetarise) or
similar competitive advantages are the major motivation. Environmental
protection measures can also lead to cost reductions, especially in material- and
energy-intensive sectors (Figge et al., 2001). Environmental management
includes all systematic economic activities with the aim of an efficient reduction
of the environmental impact (Schaltegger & Figge, 2000). The term "social
management" means all measures that permit the efficient achievement of social
goals. According to the 3-pillar concept, the concept of sustainability
encompasses ecological, social and economic aspects (Nutzinger & Radke
1995).
Sustainability management would therefore include all activities that allow the
achievement of sustainability goals, the achievement of environmental, social and
economic goals. However, such a definition contradicts the current usage of the
term "sustainability". In general parlance, sustainability today is understood
primarily as its ecological and social aspects. We therefore refer to the
management which aims at simultaneously achieving ecological, social and
economic goals, as value-oriented sustainability management.
An integration of environmental and social aspects into the Balanced Scorecard
offers the opportunity to manage environmental and social aspects in a value-
oriented manner (Deegen, 2001). Thus, the Balanced Scorecard can be used for

205
identification and purposeful management of those environmental and social
aspects that are complementary to the achievement of a company's economic
goals. Through this integrative approach, such a Sustainability Balanced
Scorecard meets the central requirement of the sustainability concept for a
sustainable improvement of corporate performance in economic, ecological and
social terms (Figge et al., 2001).
The special suitability of the Balanced Scorecard for value-oriented integration of
all three sustainability dimensions results from the fact that the Balanced
Scorecard extends the scope of success-related aspects beyond financial
parameters. This also makes it possible to take into account non-monetarised
and non-monetarisable as well as unquantified and non-quantifiable soft factors.
Environmental and social aspects often point to these characteristics (Sepp,
1996). Interrelationships with the permanent success of a company can usually
only be formulated qualitatively. It is, therefore, advisable to identify the
environmental and social aspects relevant for economic success and to integrate
them into the systematics of the Balanced Scorecard (Figge et al., 2001).
In principle, three options for integrating environmental and social aspects into
the balanced scorecard are conceivable:
- Environmental and social aspects can be fully integrated into the existing
four perspectives of the Balanced Scorecard and can be thus subsumed
- The Balanced Scorecard can be extended to include an additional
perspective for the consideration of environmental and social aspects
- A special environmental and/or social scorecard can be derived
An additional separate perspective on the integration of environmental and social
aspects should be introduced if these aspects explicitly constitute a strategic
aspect of corporate performance.
However, according to Ruderer (2009) there follows, after risk identification, the
determination, which is critical for the countable monitoring area, as well as the
definition of the early warning indicators. The basic model for an indicator-
oriented early recognition, outlined below, should be built to recognize patterns
that predict an inadmissible risk that may take place in the future (Duckert, 2011).

206
6.4.1.3 Early Warning Indicators
The determination of an early warning indicator follows from the identification of
risks/problems recognized as critical (Ruderer, 2009). For the use of early
warning indicators, which are branch-, or company-, specific, the employees
should be sensitized to the critical handling of recognized changes in the
company and environment (Ruderer, 2009). Early warning indicators can be
considered as diagnostic signs for the detection of hidden events, which could be
various kinds of positive and negative trends or developments in the environment
(Rothwell, 2010).
The following described approach will often be adopted in the research and
literature and is also recognized/accepted in practice (Schlüter, 2004; Geissler,
1995). The determination of the organizational context, already explained in
chapter 6.2, can be subdivided into different areas (external, intercompany and
internal), followed by reasons/symptoms, indicators, and summarized in the table
(Mischon, 1982). Ropega (2011) differentiates between reasons, which directly
or indirectly evoke a phenomenon, and symptoms, which are the sign of a risk or
of a beginning, as well as an already existing, crisis. Krystek (1987) adds the step
of determination to the Early Warning Indicator for each monitoring area with
required size and tolerances.
During the determination of the relevant indicators, the linking and networking of
indicators should especially be considered (Gomez & Probst, 1997). Based on
these causal chains, causes of opportunities and risks can be immediately
identified (Schlüter, 2004). Krystek et al. (2007) point out that all indicator lists,
which can be found in the literature, have only the character of a collective
example, and emphasize the importance of individual intuition and personal
experience in finding appropriate indicators (Hauff, 2010).
The chart below shows only a few possible indicators, which should be analyzed
individually for each company.

207
External Pressure
Area Reasons / Symptoms Indicators
Economic cycle Negative Development Stock Index
Money Quantity of
Central Bank
Planning and Building
Permission
International
Economic Cycle
(Levy-Livermore,
1995)
Structure crisis Low Confidence in the
Organization
Bad Communication
Lack of contribution for decision
finding
Import Restrictions
Trade and Payment
Balance Sheet
Consumer and Life
Form (Tatje, 2001)
Political & Social
Development
Health Policy
Law Changes
Health Insurance
System
Unemployment Rate
Social Climate
Birth Rate
Measure of
Environment
Protection
Education and
Qualification Standard
(Wiedmann, 1984)
Table 10 External Pressure
Source: Compiled by author

208
The individual design of indicators should, as far as possible, also determine the
time interval between the signal of the indicator and the signaled event in addition
to the causal chains already mentioned (Krystek et al., 2007). The self-developed
indicators should be reviewed for suitability based on relevance tests (Krystek &
Müller-Stewens, 1993).
Besides the external area influence, the intercompany scope struggles with the
company, which includes suppliers, customers, competitors and banks (Mischon,
1982), where the possible reasons and symptoms, with the indicators, will be
summarized and shown in overview in the chart below.

209
Intercompany Scope
Area Reasons / Symptoms Indicators
Banks Interest rate
Exchange rate
Amount of money
Savings rate
Stock Exchange Prices
Finance- and Money
policy (Levy-Livermore,
1995)
Suppliers Price Policy
Conditions
Production capacity
Creditworthiness of
suppliers (Mischon,
1982)
Customers Purchase behavior
Demand volume
Order-Quantity of Key
Customer
Diversification of Key
Customers
IFO of Customers
Business Policy of Key
Customer (Krystek et
al., 2007)
Competitors Price Policy
Program Policy
Market Share
Research and
Innovation Behavior of
Competitors
Marketing Activity
(Wiedmann, 1984)
Table 11 Intercompany Scope
Source: Compiled by author
Ohligschläger & Below (2015) add that besides the customers, there are also
people, owners, cooperation partners, society, occupational unions, and

210
associations. The ISO 9001:2015 also requires an understanding of the needs
and expectations of interested parties, where "The organization shall monitor and
review information about these interested parties and their relevant requirements"
(DIN EN ISO 9001, 2015, p. 19). The company has to analyze the requirements
and the expectations of the stakeholder and adjust their strategic plan according
to the interested parties (Hinsch, 2014). Ohligschläger & Below (2015) add that
the company has to monitor and review the information about the interested party.
In addition, the Information needed from internal areas should be searched for
in the governance, organizational structure, roles and accountabilities; policies,
objectives, and the strategies that are in place to achieve them; the capabilities,
understood in terms of resources and knowledge (e.g. capital, time, people,
processes, systems and technologies); information systems, information flows
and decision-making processes (both formal and informal); relationships with,
and perceptions and values of, internal stakeholders; the organization’s culture;
standards, guidelines and models adopted by the organisation; and form and
extent of contractual relationships” (ISO 31000, 2009, p. 10). Understanding the
internal context can also be facilitated by considering issues related to values and
performance of the organization, which could be a combination of internal and
external actors (DIN EN ISO 9001, 2015).
The internal area, shown below with the reasons/symptoms and indicators, will
very often be ignored and not recognized as a crisis factor.

211
Internal Pressure
Area Reasons / Symptoms Indicators
Company management Lack of Qualification /
Skills
Lack of Information feed
Insufficient Knowledge of
Leadership
Stubbornness (Mischon,
1982)
Company structure Inefficient Marketing
Complexity
Market Share
Turnover
Sales Trend
Price and Costs
Development
Resources / Supply Focusing on one supplier Resource Possibilities
(Levy-Livermore, 1995)
Production Old Products
Delivery Delay
High Claim Rate
Lack of Product Variation
Product Mix
Market-Share/Product
Kind of Quality
Degree of Efficiency for
Engine (Krystek et al.,
2007)
Sales Market Share Decline
Turnover Decline
Result/Area (Mischon,
1982)
Financial structure Lack of Capital
High-Interest Rate
High Capital Commitment
High Advance Payment
Working Capital
Equity (Deppe, 1992)
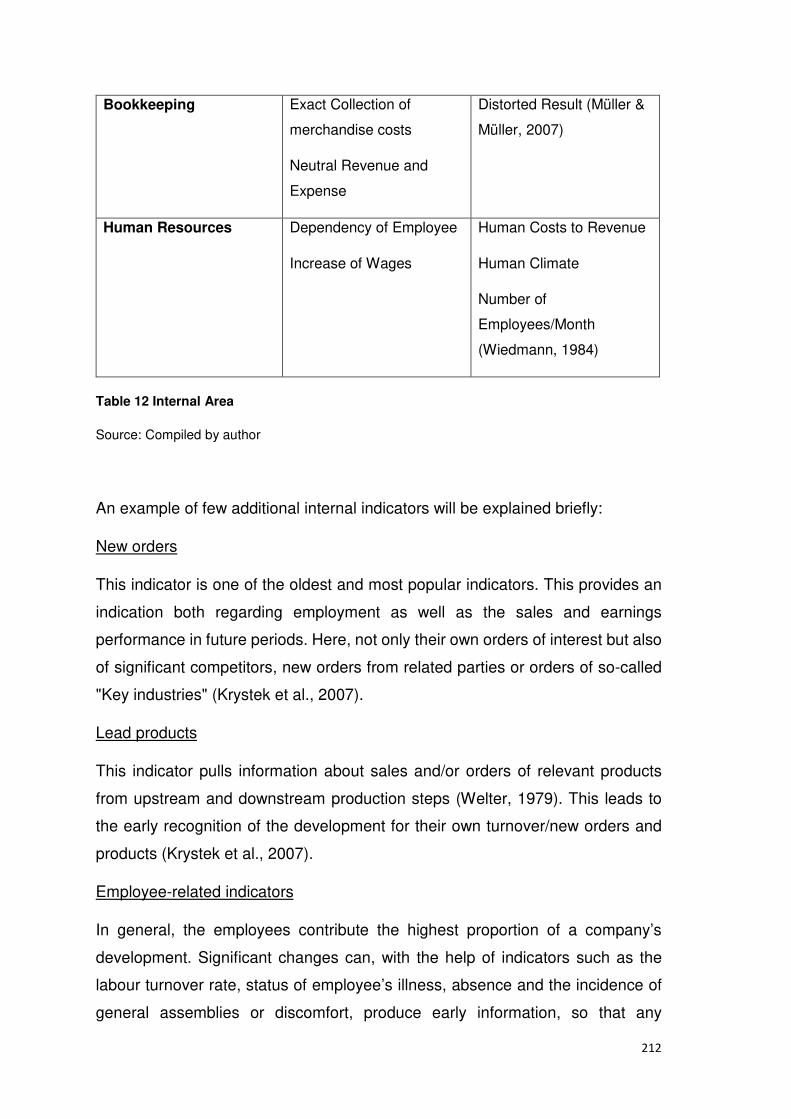
212
Bookkeeping Exact Collection of
merchandise costs
Neutral Revenue and
Expense
Distorted Result (Müller &
Müller, 2007)
Human Resources Dependency of Employee
Increase of Wages
Human Costs to Revenue
Human Climate
Number of
Employees/Month
(Wiedmann, 1984)
Table 12 Internal Area
Source: Compiled by author
An example of few additional internal indicators will be explained briefly:
New orders
This indicator is one of the oldest and most popular indicators. This provides an
indication both regarding employment as well as the sales and earnings
performance in future periods. Here, not only their own orders of interest but also
of significant competitors, new orders from related parties or orders of so-called
"Key industries" (Krystek et al., 2007).
Lead products
This indicator pulls information about sales and/or orders of relevant products
from upstream and downstream production steps (Welter, 1979). This leads to
the early recognition of the development for their own turnover/new orders and
products (Krystek et al., 2007).
Employee-related indicators
In general, the employees contribute the highest proportion of a company’s
development. Significant changes can, with the help of indicators such as the
labour turnover rate, status of employee’s illness, absence and the incidence of
general assemblies or discomfort, produce early information, so that any

213
downstream phenomena such as productivity reduction or fail, up to strike and
plant occupations, can be counteracted (Krystek et al., 2007).
Furthermore, the crucial requirements for an indicator-based early detection are,
according to Krystek et. al (2007) formulated as follows:
Earliness: The risks and chances must be received by the indicator sufficiently
early so that there will be enough time for the planning and introduction of
countermeasures. Furthermore, the foreknowledge of this, which should be
constant, as far as possible, is of great importance.
Uniqueness: Changes or developments to be uniquely identified by the
indicators in order to limit the danger of misinterpretation can be largely prevented
and the loss of time for subsequent interpretation may be minimized or
eliminated.
Completeness: The respective areas of observation of an indicator must each
be fully covered.
Flexibility: indicators should be able to adapt, to a certain extent, to changes in
their viewing area. This should be done as far as possible with the same efficiency
of the statement.
Financial Defensibility: The acquisition and maintenance of an indicator are to
be financially justifiable. This means that the information benefits of the indicator
have to compensate this effort.
However, these selection criteria represent a maximum possible catalog, which
cannot be met by all indicators used in practice (Krystek et al., 2007).
Furthermore, after the determination of the early warning indicators, in order to
implement a value-oriented management, control variables that drive the values
of individual stakeholders need to be identified (Giebel, 2011). Töpfer (2000)
distinguishes between value drivers, success factors, and value generators.
Value drivers in this context are the internal reasons for customer-, and market-,
based impact on the external success factors – both are operative and
strategically focused- which are viewed together with the financial results (Giebel,
2011). The company never focuses on one aim alone but has to tie several aims
together, beginning with the top strategic company aims by breaking them down
214
to the lowest level (Schröder, 2005). Töpfer (2000) describes the value drivers as
Human Engagement, Customer Satisfaction, Cost Reduction, followed by
Turnover, Cash Flow and Shareholder Value increase. Giebel (2011) adds that
these value generators (internal/external) are elements which define the Free
Cash Flow and, in the final analysis, the Shareholder Value.
6.4.1.4 Cause-and-Effect Relationships
In monitoring, it is not only important to observe and analyze the individual KPIs
and their development, but also to be aware of the interactions of the KPIs. Some
developments can already be explained quickly, because they are caused by the
changes in one or more other KPIs. In order to own or build up this awareness, it
is necessary for the established KPIs that have been worked out for the BSC to
create a so-called Cause-and-Effect Map. This contains the information whereby
KPI exerts an influence on one or more other KPIs (Gleißner, 2004). The
Balanced Scorecard is not a loose collection of indicators in four perspectives. It
should also ensure coherence between the perspectives. To this end, the
perspectives are to be logically linked via cause-effect chains. This enables a
better communication of the strategy and alignment of all company resources and
activities with the implementation of the strategy. "The Balanced Scorecard
provides a framework to describe and communicate strategy in a consistent and
insightful way" (Kaplan & Norton 2001, p. 10).
The cause-effect chains clarify the causal assumptions of the chosen strategy.
This allows two things: On the one hand, all corporate activities can be aligned
with the strategy, and on the other hand, it can be checked early on whether the
strategy is successfully translated (Kaplan & Norton 1996). Thus, the contribution
also becomes softer, i.e. considering non-monetarisable and long-term success
factors, transparent and controllable. The presentation of the interactions
between the individual KPIs and the inclusion of risks or early warning indicators
make it possible to examine deviations between the planned values of a key
figure and the actually realised key figures ("actual values") for causes of
deviations. This contributes decisively to an increase of acceptance to the
responsible peoples. Experience has shown that the acceptance of a traditional
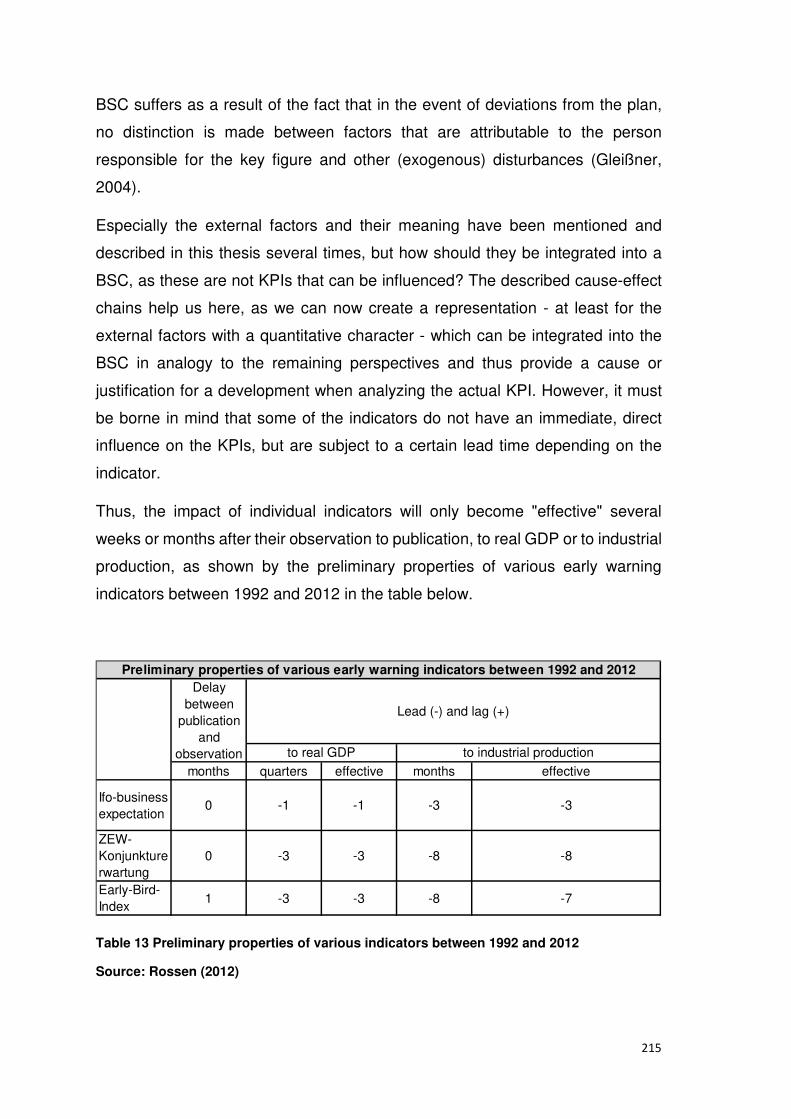
215
BSC suffers as a result of the fact that in the event of deviations from the plan,
no distinction is made between factors that are attributable to the person
responsible for the key figure and other (exogenous) disturbances (Gleißner,
2004).
Especially the external factors and their meaning have been mentioned and
described in this thesis several times, but how should they be integrated into a
BSC, as these are not KPIs that can be influenced? The described cause-effect
chains help us here, as we can now create a representation - at least for the
external factors with a quantitative character - which can be integrated into the
BSC in analogy to the remaining perspectives and thus provide a cause or
justification for a development when analyzing the actual KPI. However, it must
be borne in mind that some of the indicators do not have an immediate, direct
influence on the KPIs, but are subject to a certain lead time depending on the
indicator.
Thus, the impact of individual indicators will only become "effective" several
weeks or months after their observation to publication, to real GDP or to industrial
production, as shown by the preliminary properties of various early warning
indicators between 1992 and 2012 in the table below.
Table 13 Preliminary properties of various indicators between 1992 and 2012
Source: Rossen (2012)
months quarters effective months effective
Ifo-business expectation
0 -1 -1 -3 -3
ZEW-Konjunkturerwartung
0 -3 -3 -8 -8
Early-Bird-Index
1 -3 -3 -8 -7
Delay between
publication and
observation
Lead (-) and lag (+)
to real GDP to industrial production
Preliminary properties of various early warning indicators between 1992 and 2012

216
These are few additional indicators to the chapter 6.4.1.3, which now will be
explained briefly:
"Early Bird": This is a composite indicator, which has been developed by
Commerzbank and the magazine "Wirtschaftswoche", which is published
regularly. It includes not only the short-term real interest rate but also the so-
called Purchasing Managers’ Index (PMI), as well as indicators of price
competitiveness (Krystek et al., 2007).
IFO indicator "business climate": This qualitative indicator is based on a large
monthly survey, which expresses the expectations of participating companies in
the survey for business development for the next 3 to 6 months (Nerb, 2001).
"ZEW-economic cycle expectation": This indicator is based on a survey that has
been developed by the Mannheim Centre for European Economic Research
(ZEW). Questioned here are 350 financial analysts and institutional investors in
order to assess the current situation and the development of the next 6 months
(Krystek et al., 2007).
Anyway, in the case of qualitative external factors (such as an embargo, for
example), the effect cannot be (exactly) quantified, but also here causes or
effects on parts of the BSC can be derived. Since risks, as well as earnings and
growth perspectives, determine the value of a company to a large extent, risk
ratios and individual risks must be consistently taken into account.
These are derived directly from the company's risk management system, which
can be fully networked with the BSC. The risks are exactly the possible causes
of deviations from the specified plan values of the scorecard. For each key figure
of the scorecard, it has proven to be useful to consider which (exogenous)
disturbance variables could trigger deviations from the plan. In this way, risks are
automatically assigned to the key figures of the scorecard, which brings with it a
link between corporate strategy and risk management (Gleißner, 2004).
In conclusion it could be said, that the advantage of the combination of QM and
BSC, as described in chapter 6.1, lies in a holistic system of process building and
result control and enables the company to monitor and measure much more
purposefully, to establish the control criteria more holistically and makes it

217
possible to improve faster and more sustainably (Töpfer, 2000). The QM builds
the infrastructure for the whole QMS and the BSC as a holistic Controlling, which
focuses on strategy, planning figures and company development, subsequently
translating the mostly qualitative information from QM into quantitative, meaning
that the content result quality will be established and determined by BSC (Weber
& Schäffel, 2011). Töpfer (2000) adds that the measurement results and
performance indicators from the Quality Management will be transferred during
the BSC into KPIs, which refer to all areas/perspectives, and enables the Quality
Management to operationalize and make them more useful by score card. In
conclusion, he ends with the explanation that QM measures to review and BSC
reviews to improve, which means for the company that this combination only
works when the combination of the components and criteria of QM and the
indicators and measurements of the BSC is consistent and meaningful. The
figures show the areas which need to be improved (Gehringer & Michel, 2000).
The following KPIs, which were described in the literature review as the most
important (Nagel et al., 2013), are only given as an example, and have to be
adjusted individually according to the requirements of the company.
6.4.1.5 Key Risk, Performance and Control Indicators
Operating figures systems in procurement analysis
Operating ratios in the evaluation of relative importance of procurement to
an organization
Quota of good and material input = material input x 100 / turnover
Share of material costs = material cost x 100 / total cost
Purchase volumes = total value of purchase
Operating figures of economic efficiency
Purchase volume share = purchase volume x 100 / turnover
Procurement cost share = procurement costs x 100 / purchase volumes
Delivery cost share = delivery cost of a period x 100 / purchase volumes

218
Storage costs = purchase costs x 100 / average stock
P = price reduction of own selling price / reduction of cost price
Structural operating figures and framework ratios
Average purchase value by each supplier = total purchase volume / number of
suppliers
Service level (%) = total number of satisfied need requirements / number of all
need requirements
On schedule = total number of on schedule deliveries / total number of deliveries
Complaints quota = value of complaint supplies x 100 / total number of supplies
Rejection quota = number of rejected supplies x 100 / total number of supplies
Supply delay quota = number of late supplies x 100 / number of supplies
Average replacement quota = average time necessary for ordering and delivery
+ average delivery time + average check time, stocking time and retrieval time
Import share = imported materials x 100 / total sum of all materials
Average warehouse stock = (opening stock + closing stock) x 100 / 2
Turnover rate = cost of goods (goods turnover) / average warehouse stock
Operating figures in production analysis
Operating ratios in the evaluation of relative meaning of production for the
company
Program spread = indicates a number of different products which are to be
manufactured in a production period
Manufacturing depth = the extent to which adjoining production stages are
established within a company
Manufacturing cost share = manufacturing costs x 100 / production cost
Material intensity = material costs x 100 / production costs

219
Salary share = direct labour costs x 100 / manufacturing costs
Production performance = actual output quantity of production pre-time unit,
normally per day, on all products or for individual products
Operating ratios for economic efficiency
Production costs relation = current production costs / target production costs
Personnel costs share = personnel cost of production area / capital expenditure
Total performance per worker
On schedule delivery = number of on schedule deliveries x 100 / number of
deliveries
Number of production disturbances
Variety of parts = number of required different types of materials needed in the
production of a group of products or production program
Stock capital commitment = warehouse stock x calculated interest rate
Turnover rate = average turnover per period / average warehouse stock
Structural ratios and framework ratios
Structure of equipment’ age = ∑ of age of all or specific equipment / number of
machines
Number of installed machines of the same type in a production center
Fixed assets: absolute or average value of asset investments
Maintenance costs of all machines in a particular time frame
Maintenance costs of a machine per machine hour = maintenance costs per year
/ utilization period x operating time
Stock flexibility: degree of adaptability of available potentials
Development flexibility = degree of development flexibility of available potentials
Machine idle time = capacity – utility time
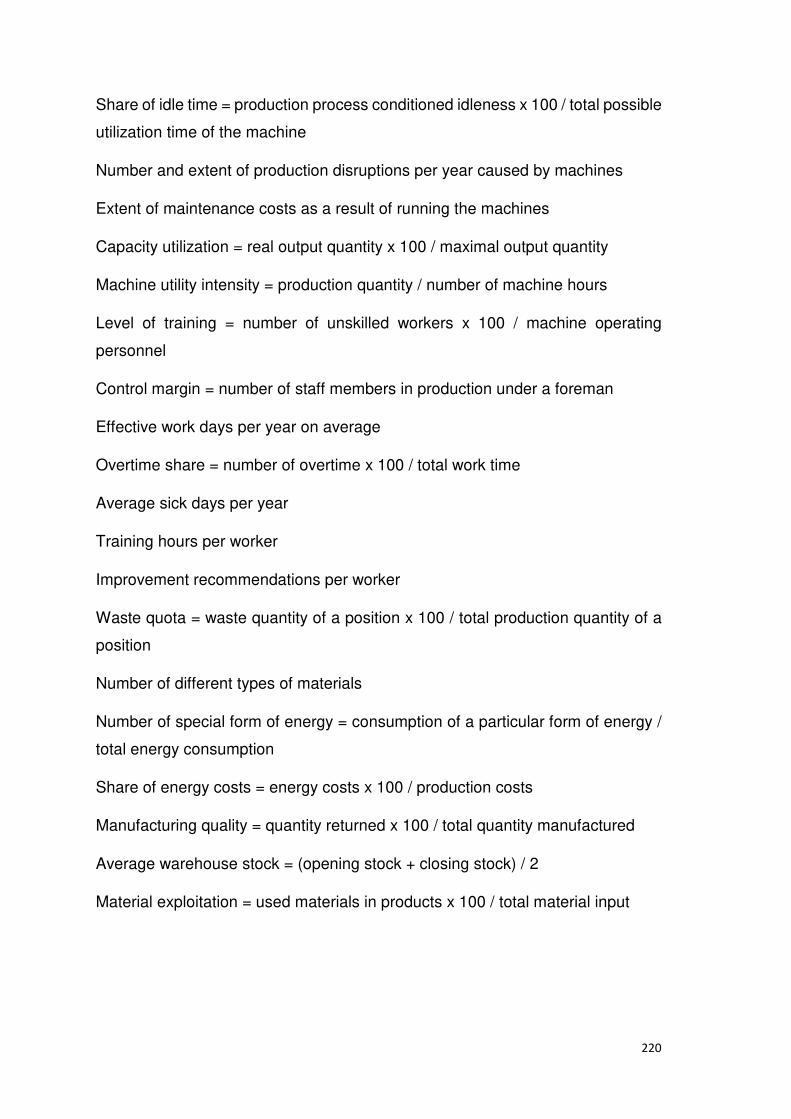
220
Share of idle time = production process conditioned idleness x 100 / total possible
utilization time of the machine
Number and extent of production disruptions per year caused by machines
Extent of maintenance costs as a result of running the machines
Capacity utilization = real output quantity x 100 / maximal output quantity
Machine utility intensity = production quantity / number of machine hours
Level of training = number of unskilled workers x 100 / machine operating
personnel
Control margin = number of staff members in production under a foreman
Effective work days per year on average
Overtime share = number of overtime x 100 / total work time
Average sick days per year
Training hours per worker
Improvement recommendations per worker
Waste quota = waste quantity of a position x 100 / total production quantity of a
position
Number of different types of materials
Number of special form of energy = consumption of a particular form of energy /
total energy consumption
Share of energy costs = energy costs x 100 / production costs
Manufacturing quality = quantity returned x 100 / total quantity manufactured
Average warehouse stock = (opening stock + closing stock) / 2
Material exploitation = used materials in products x 100 / total material input

221
Operating figure system in distribution analysis
Operating ratios of economic efficiency
Single-tier profit margin: turnover – variable costs = profit margin I – fixed costs =
operating result (profit/loss)
Two-tier profit margin: turnover – variable costs = profit margin I – product fixed
costs = profit margin II – general fixed costs = operating result (profit/loss)
Turnover rate of finished products = average turnover of an article / average
warehouse stock of an article
Order processing costs = order processing costs / turnover
Average costs of customer processing
Distribution cost per order
Personnel efficiency = total turnover / average personnel population
Advertisement benefit = advertisement conditioned turnover / (profit margin –
advertisement costs)
Order profitability = profit margin of an order x 100 / order volume
Order cost intensity = costs of the order x 100 / turnover with the order
Structural and scope operating ratios
Break-even-point = fix costs / (turnover – variable costs)
Break-even-point = fix costs / (1 – variable costs) / turnover
Turnover structure = part turnover x 100 / total turnover
Turnover structures relating to product groups = product group turnover of x
dimension / total turnover of the product groups (x100)
Turnover main focus = product group turnover of customer groups / total turnover
of customer groups (x100)
Customer turnover = total turnover / number of customers
Export quota = turnover in foreign markets / total turnover

222
Operating figures with reference to the sales object
Sales program = type and quantity of products which are to be sold in a certain
period
Product program relation = sales program / production program
Market potential = the maximum absorption of a market concerning a certain
product or a group of products
Sales potential = the maximum sales volume of a product or a group of products
of an organization in a particular market
Market volume = the actual realized sales volume of an entire branch
Sales volume = the actual realized sales volume of an organization
Sales quota = sales volume x 100 / sales potential
Share of decrease in turnover = turnover decrements / turnover
Market share = turnover or sales of the company x 100 / turnover or sales of total
market
Relative market share = market share of the company x 100 / market share of
strongest rival
Degree of familiarity = positive feedback tempo x 100 / number of those
interviewed
Share of new products = turnover with new products x 100 / total turnover
Product profitability = profit margin of the product / total profit margin
Share of product turnover = turnover of a product / total turnover
Operating figures with reference to sales activities
Preparedness to deliver = total sum of immediately delivered demands / total sum
of demanded products (x100)
Order entry for each article group
Orders development = actual order entries x 100 / order entries of comparable
period

223
Order range = order stock in days / daily production
Average order size = turnover x 100 / number of orders
Average delivery time
Complaint quota = value or number of complaints x 100 / value of number of total
deliveries
Complaint structure = value or number of certain complaints / value or number of
all complaints (x100)
Intensity of sales promotion = input into sales promotion / product turnover
Advertisement benefits = advertisement input / product turnover
Degree of exhaustion of area = number of customers in a region x 100 / number
of customer of a possible region
Rebate intensity = turnover decrement in monetary unit / part turnover (x100)
Service intensity = number of customers x 100 / number of service personnel
Operating ratios with reference to customers
Share of customers = number of customers of a specific customer group / total
number of customers (x100)
Customer index = number of customers in the examined period / number of
customers in base period (x100)
Customer profitability = profit margin / customer turnover (x100)
Operating figures for financial analysis
Investment ratios
Capital constitution = fixed assets x 100 / current assets
Investment intensity = fixed assets x 100 / total assets
Intensity of current asset = current assets / total assets (x100)

224
Analysis of investment policy
Investment quota = net investment in tangible assets / opening stock of tangible
assets (x100)
Investment coverage = amortization on tangible assets / additions to tangible
assets (x100)
Rate of amortization = amortization on tangible assets / closing stock of tangible
assets (x100)
Turnover-related investment analysis
This ratio examines the relationships between asset and turnovers of a company:
Plant utilization = turnover / tangible assets (x100)
Supply inventory = stocks / turnover (x100)
Turnover rate of fixed assets = (amortization of fixed assets + asset disposals) /
average stock of fixed assets (x100)
Turnover rate of current assets = turnover / average stock of current assets
Turnover rate of total assets = turnover / total assets (x100)
Whereby the average stock = (opening stock + closing stock) / 2
Duration of claims = average stock in goods claims x 100 / turnover
Financing ratios
Analyzing financing structure
Own capital quota = own capital / total capital (x100)
Strain co-efficiency = credit capital / total capital (x100)
Statistical debt to equity ratio =credit capital / own capital (x100)
Dynamic debt to equity ratio = credit capital / cash flow (x100)
Reserve quota = reserves / total capital (x100)

225
Analysis of the duration of financing
Supplier credit duration = average number of creditors / stock receipt (x360)
Duration of bill credit = average number of bill credit debt / stock receipt (x360)
Duration of debt redemption = (credit capital – available funds) / year’s cash-flow
Liquidity ratios
Statistical liquidity analysis
Coverage degree A = own capital x 100 / fixed assets
Coverage degree B = (own capital + long term credit capital) / fixed assets (x100)
Coverage degree C = (own capital + long term credit capital) / (fixed assets + long
term committed current assets) (x100)
Liquidity first degree (cash liquidity) = means of payment / short-term
commitments
Liquidity second degree (short term liquidity) = (means of payment + short term
claims) / short-term commitments
Liquidity third degree (medium term liquidity, working capital ratio) = (means of
payment + short term claims + stocks) / short-term commitments
Working capital = + current assets (assets convertible to cash within a year) –
short-term commitments
Dynamic liquidity analysis
Cash flow
+retained profits + newly accumulated reserve funds + amortization + flat rate
value adjustments = Cash flow in the strict sense
+Year profit or loss – accumulated profits (profit brought forward) + accumulated
deficit (deficit carried forward) + reserve allocation – release of reserve + increase
in long-term provisions – release of long-term provisions + amortization and
adjustment of value of fixed assets and participations – appreciations + extra

226
ordinary, operative expenses in other accounting periods – extra ordinary,
operative incomes in other accounting periods = Cash flow in broader sense
Cash flow statement
Source of funds
+allocation in reserve (compulsory reserves, reserves for own shares, statutory
reserves, other profit reserves) – withdrawals from reserves + amortization on
fixed assets + amortization on participations + increment of initial capital (capital
stock) + rise in long-term commitments + rise in medium-term commitments +
increment of provisions (reserves) + reduced warehouse stock = Total sum of
available funds
Profitability indices
Profit oriented profitability indices
Return on equity = profit / own capital (x100)
Overall capital profitability = (profit + interests on credit capital) / (own capital +
credit capital) (x100)
Turnover profitability = profit / turnover (x100) or = orderly operating results /
turnover (x100)
Return on investment or the DuPont Operating ratio system:
1) Turnover profitability = profit / turnover
2) Capital turnover = turnover / capital
3) ROI = profit / capital
Cash flow oriented profitability ratios
Own capital profitability = cash flow / own capital (x100)
Overall capital profitability = cash flow / (own capital + credit capital) (x100)
Turnover profitability = cash flow / turnover (x100)
Results ratios
Personnel intensity = personnel expenses / total expenses (x100)

227
Material intensity = material expenses / total expenses (x100)
Turnover predominance = turnover x 100 / total returns
Miscellaneous operating figures
+Turnover + increment of stock of finished and unfinished products – decrement
of stock of finished and unfinished products + self-produced machines,
equipment = Total performance + miscellaneous returns = Company
performance – expenses on raw materials and utilities – external aggregates –
services = Gross additional value created – amortization = Additional value
created (Net additional value created)
Shareholder Value = Value of the company – Credit capital (external capital)
Operating figure system for the analysis of technological potentials
R&D – Potential
Number of employees in the R&D (division)
Qualification of R&D staff
Fluctuation rate
R&D division = retiring staff members (R&D) / average number of staff members
(R&D) (x100)
Number of hours for further training of employees in the R&D division
Extent of running costs of R&D division, classified according to individual
technologies or products or product groups
Extent of investment costs in the R&D division
Employee contribution = employees in the R&D division / total number of
employees (x100)
Research intensity = investment in R&D / year’s turnover (x100)
Innovation strength = working hours of R&D staff on new development, further
development and care of assortment

228
Creativity of staff or R&D
Number of introduced ideas (in total, per staff, per team)
Number of actualized ideas (in total, per staff, per team)
Number of attempted models or prototypes
Number of actualized prototypes
Number of patents
Success ratios
Innovation rate = share of turnover of new and improved products in % (products
younger than five years)
Share of profit of new and improved products in %
Earnings from sale of patents
Received license fees
Success of R&D activities = finished products x 100 / begun projects
Time to market = development duration of new products unit they appear on the
market (in months)
Operating figure system for personnel analysis
Personnel requirement and structure
Personnel intensity = personnel costs / turnover (x100)
Net personnel requirement is estimated as follows: +gross personnel requirement
– personnel stock at period t0 + departing/retirements – confirmed new personnel
Capacity utilization = work volume (required working hours) / working hours
(available hours per worker)
Qualification structure = number of workers with certain qualification / total
number of workers (x100)

229
Average age of personnel (years) = total sum of ages of the personnel / average
age of the personnel
Degree of personnel provision = actual number employed / required number of
workers (x100)
Employee based productivity
Turnover per staff
Profit per staff
Additional wealth generation by staff
Personnel input
Performance index = observed current performance / normal performance (x100)
Overtime rate = overtime / normal working hours (x100)
Management spread = 1 / number of personnel
Rate of idle time = time at work place without working / available time (x100)
Staff contentment
Number of relocation requests per department
Fluctuation rate = number of voluntary retirements per year / average number of
employees (x100)
Average duration of membership in a company (years) = total sum of duration of
membership in the company / total number of personnel
Rate of absence = number off missed work days in a year / number of possible
working days in a year (x100)
Motivation and competence development
Suggestions for improvement rate = submitted improvement suggestions / total
number of workers in annual average (x100)
Intensity of further training = total number of further training days / total number
of employees (training time)

230
Qualification structure
Content and boundary of the terms economic efficiency, productivity,
profitability and return on investment
Principle of economic efficiency
Economic efficiency = output / input
Economic efficiency = return / expenditure
The Principle of productivity
Productivity = performance quantity (output) / resources (output) or output
quantity / resources
Labor productivity = performance / quantitative labor input
Material resource productivity = performance / quantitative material input
Principle of profitability
Profitability = profit / capital (x100)
Return on equity = profit / equity capital (x100)
Total capital profitability = (profit + interest on credit capital) / total capital
Return on investment (ROI)
ROI = turnover profitability x capital turnover x 100 (Nagel et al., 2013).
6.4.1.6 Monitoring of the defined Indicators and KPIs
Specifying the tolerances of each indicator according to the target value
To be able to recognize the deviation from the target value, which should be
determined and defined during the first step, the areas where the indicator is
allowed to move without triggering a signal must now be defined. Once the
indicator leaves the upper or lower tolerance range, a signal is triggered (Hauff,
2010). In addition to the warning area, an area identified as critical for survival
can be set with a higher priority. As shown in the figure 34, could it be done as

231
visualization by a traffic light for each area/perspective during the BSC as a
Manager Cockpit (Gehringer & Michel, 2000). It shows the connection and
visualization during the BSC (Schelz & Seidel, 2011) of some KPIs (Return on
Investment, Cash flow, On schedule delivery, Share of idle time, Customer index,
Market share, Suggestions for improvement rate, Training hours per worker),
which were described in chapter 6.4.1.5.

232
Figure 34 BSC as Manager Cockpit
Source: own illustration

233
The determining of all values must be done extremely carefully. If the limits are
set too tightly, a high incidence of partly unnecessary signals will occur. If the
limits are, in contrast, set too wide, the company runs the risk of receiving no
warning signals or of getting them too late (Schlüter, 2004).
Nomination of observers
Once all observation areas, indicators, and limits have been set, the indicator
values must be observed and followed. To this end, employees must be
nominated who, part-time and with the least possible expenditure of time, pursue
the development of the indicator values of their work environment and file reports,
as soon as the tolerance limits have been exceeded or fallen below (Krystek et
al., 2007). However, this means, consequently, that the success of an early
warning system depends, not insignificantly, on the motivation and commitment,
as well as the qualification, of the employees (Hauff, 2010).
Definition of tasks of information processing sites
Next, the task which information processing bodies must perform, the so-called
peripheral (sensor) units of observers and headquarters are defined (Schlüter,
2004)
An approximate summary of these tasks is as follows (Hauff, 2010):
- Receiving, downloading and checking of incoming signals
- Conducting plausibility checks
- Impact analysis
- Initiation of appropriate strategies and measures
The first point is usually the observer’s task, the central office is responsible for
the other three tasks (Schlüter, 2004).
Configuration of information channels
Finally, all remaining lines of communication for the acquisition, processing, and
dissemination of early information must be set up (Geissler, 1995). The target is
a flow which is a flow of information between the business environment, the early
warning system and the companies that can be guaranteed to be present in a
234
smoother, more comprehensive and complete way (Hauff, 2010). This includes
the design of information exchange between observer and central office in the
form of channels of communication and the reporting frequency (Krystek et al.,
2007).
Far-sighted corporate management requires early information so that the
company's management has a larger field of action for crisis-prevention or
opportunity tackling (Jacob, 1986). The CEO has to set up appropriate reporting
obligations for the responsible divisions, which include all major risks and
elements of risk management and amendments thereto (Schmidt, 2015). "What
is even more important is that, in addition to developing such measures, they be
a part of the reports that reach top management so that awareness is created at
the highest level" (Gopinath, 2005, p. 26). Hinsch (2014) explains it in more detail,
where he says that the PDCA cycle begins with the Input as Customer
Requirements and ends with the Output as Customer Satisfaction; here the Input
is planned (Plan) by the Resource Management, Production (Do) by the value-
added process and the Monitoring, Measurement, and Analysis of process
performance (Check) of Customer Satisfaction, where the top management has
to take action (Act) resulting from awareness.
In summary it can be said that the increase of the company value is only possible
by the interrelation of Shareholder Value, Market, Customer, People and Future
Value (Töpfer, 2000). Gleißner (2004) adds that the BSC shows value drivers
such as the market, people and process perspective, which influence the
turnover, costs (effective for payment) and finally the company value is
determined by Free Cash Flow, which will be discounted by WACC (weighted
average cost of capital) depending on risk. Wolf (2010) confirms that for value-
oriented management it is important to have a holistic view by including Risk
Management and the development of value drivers, which are measurable by
DCF (Discounted Cash Flow). A value-oriented management requires a
deliberate reflection of strategic and operative risks, which helps to make realistic
decisions, increasing the competitiveness and the company value (Gleißner &
Meier, 2001).

235
However, Meier (2007) states that no method exists which displays the complete
process; in conclusion, this means that the single methods (here: tools) can be
used as modules/components for the whole process.
Figure 35 Tools overview during QMS & CO
Source: own illustration
The appropriate tools, as shown in figure 35 above, for ‘determination of context'
(PESTLE, Cross-Impact-Analysis, SWOT Analysis) and ‘risk identification'
(Creativity Methods, Planning, Diffusion Theory, Trend Landscape, Scenario,
FMEA, Delphi-Method, Fault Tree Analysis, HACCP, Turtle Diagram) which were
already shown and explained above and at the end the BSC as ‘risk monitoring

236
and review’ tool builds, by using the QMS as basis, a holistic EWS for German
food production SMEs. Töpfer (2000) adds that the advantage of this multi-level,
networked with regards to content-integration, approach is that the risks will be
recognized on time and are controllable according to the formulated aims.
According to the literature review and interviews, no EWS software, appropriate
for SMEs exists. The recommendation is, in general, to use Office applications
(Ruderer, 2009), such as Excel, Visio, etc., as named by an interviewee. This
EWS approach was developed by the writer on the basis of literature/interview,
own logical approach and then validated by the informal exchange of ideas with
experts. From the experience of company practice, and also derivable from the
research, it seems that there does not exist a perfect tool, as all tools contain
"fuzziness" due to the measurements of soft (qualitative) factors, which are very
important for company success, but much more difficult to measure than the hard
(quantitative) factors (Töpfer, 2000).
The implementation in practice begins with the leadership giving information
about the introduction of BSC through human interaction (Töpfer, 2000).

237
7 Phase III: Case Study approach
The previous phases, including a systematic literature review and semi-structured
interviews, helped to identify best-practice elements for the development of an
EWS. In the present Phase III two case studies have been used in order to
confirm or disconfirm the identified best-practice elements. The relevant findings
were used as a template with which to confirm, disconfirm or refine the empirical
results by the case studies.
The advantage of case study is that the researchers test or explore theories of
real-life situations (Kumar, 2011). Gerring states that a natural advantage of a
case study research is the exploratory nature, which “is all about ‘casing’ –
defining the topic, including the hypothesis of primary interest, the outcome, and
the set of cases that offer relevant information vis-à-vis the hypothesis” (Gerring,
2009, p. 41). "Gathering information through face-to-face contact with individuals
goes back many years" (Zikmund, 2010, p. 209), where a case study researcher
should be able to ask good questions, to be a good listener, adaptive, flexible,
unbiased by preconceived notions, must have a firm grasp of the issues being
studied and bring high ethical standards to the research (Yin, 2014).
"Listening, therefore, goes beyond the mere hearing of spoken words and
requires an intuitive understanding of the interviewee`s actual meaning" (Ng &
Coakes, 2014, p. 64). In sum, it is important to have enough theoretical
knowledge and to be a good listener in order to be able to handle the challenge
in a case study.
However, the bounding of the case, which is important to determine the scope of
data collection (Quinlan, 2011), was realized by the knowledge-gain of two Food
Production Companies. From this, I obtained answers to research question from
experts' practical experience for practical appropriateness.
7.1 Phase III: Case Studies
Two studies were used in Phase III to confirm and refine best-practice elements
for EWSs (Yin, 2014). The two studies were within two separate and independent
medium-size companies. The first study was in a company, which is specialized
238
in food production industry for fruits and vegetables, and the second study within
an organization, which is also active in the food production industry, this time for
milk products. The studies involved three semi-structured interviews per study of
the senior management of relevant functions: quality, controlling and the general
management. German was used both for the interview questions and interviews
themselves, as German is the corporate language within these companies.
The EWS approach was developed during the Phase II by the writer on the basis
of literature/interview, own logical approach and then validated by the informal
exchange of ideas with experts. The development was based on the findings from
Literature Review and for practicable development of the final EWS approach,
with the help of CO and QM experts, best-practice CO and QM tools, appropriate
for an EWS within the food production industry, were explored. The developed
model was shown to the companies with the aim of analyzing the appropriateness
of implementation and use in SMEs of best-practice elements designed by
experts and literature review.
The responses of the interviewees in the face-to-face interviews were recorded
by writing, as the audio recording was unwelcome. The notes were made by the
interviewer, which were read to the interviewees after each answer for
verification. This approach was shown during the interview to the participants,
where the answers from Phase III were used subsequently for confirmation and
refining of the EWS for practical appropriateness in Phase IV.
7.2 Expert Interviews within the Case Study
The following main results for the practical use of an EWS in the Food Production
Industry were given by the CO, QM and General Managers (Interview answers
from Phase III):
7.2.1 EWS-Existing in the company
All interviewees agreed that EWSs are definitely an important topic in the Food
Production Industry. Ruderer (2009) shares this view by stating that EWSs are
information tools, which have the aim of recognizing the negative development at

239
an early stage so that the company has enough time for the reaction before the
damage sets in. The thirteenth interviewee pointed out the following regulations:
EG 178/2002 (general principles and requirements of food law, establishing the
European Food Safety Authority and procedures for food safety), which takes the
following factors into account:
- The normal conditions under which food is used by the consumer;
- Information provided to the consumer;
- The effect on health, in the short and long term;
- Cumulative toxic effects;
- Specific sensitivities of certain consumer groups, for example, children.
EG 2073/2005 (microbiological criteria for foodstuffs), which lays down the
microbiological criteria for certain micro-organisms and the implementing rules to
be complied with by food business operators when implementing the general and
specific hygiene measures.
LFGB (Lebensmittel- Bedarfsgegenstände- und Futtermittelgesetzbuch �
German Code on consumer items and animal feed).
This builds the framework for the evaluation of food and further proceedings
during a company’s Crisis Management, which is a part of the HACCP concept.
All participants confirmed that Crisis Prevention occurs by fundamentals of
HACCP, where all manufacturing processes are regularly verified. This is in line
with the literature review by Romeike & Hager (2013) and their statement that
HACCP is a method which aims to save the food production industry and in the
end to protect the consumer.
The tenth interviewee added that it helps to prevent large-scale disease by the
improvement of information on, and thus prevention of, health hazards that are
causally attributable to food consumption. Reuvid (2013, p. 151) agrees with this
opinion, as shown by the statement “HACCP has been recognized internationally
as a logical tool used in the food industry to identify potential food safety hazards
so that preventive actions can be taken to mitigate the potential risks. The system
continues to be used at all stages of the food supply chain”. To be able, in both a

240
timely and complete way, to protect the health of consumers, the company has
to get warnings on prominent food and possibly product recalls of dangerous
food. This view is also confirmed by the literature review, where it is stated that
the information about risk coming from different sources should be combined to
form a holistic system (Brühwiler, 2001). The work of Ruderer (2009) where he
emphasises early stage recognition in order to give ample time for reaction is also
pertinent, together with Hampton’s (2009 p. 63) comments on the use of a risk
dashboard, as stated previously.
7.2.2 Tools use for EWS
HACCP, Planning, ERP were named by the ninth, tenth and thirteenth participant.
The HACCP and Planning as tools for EWS were also named by the literature
review authors such as Ruderer, 2009; Reuvid, 2013 and Romeike & Hager, 2013
(HACCP), as well as Hauff, 2010; Krystek, 1987 and Ohligschläger & Below,
2015 (Planning). The ERP could be seen as confirmed by Dahm & Haindl (2001),
where they state, that whatever the aim of the single system is, the company has
to be able to tailor the framework to their needs.
7.2.3 Satisfaction with current tools
All interviewees agreed that EWSs should be holistic (strategic and operational)
and practicable – the current tools focusing either on QM or to CO. Several
authors also pointed out the need for a more holistic approach (Bedenik et al.,
2012; Purvinis et al., 2005; Kurschus et al., 2015).
The eleventh interviewee added that the system could bring together more
additional information, such as market information, which would help to check the
direction in which the values go for a quick response. This generally
corresponded with the literature review of Bedenik et al. (2012, p. 672) and the
statement “The role of EWSs as an instrument for crisis aversion is in: revealing
weak signals, transferring important information about environmental changes,
prevention of business crisis, and constructing a creative base for timely and
appropriate response.” Löhneysen (1982) states that an EWS should identify both
241
internal and external dangers at an early stage. The operative EWSs are based
on KPIs relating to past performance, and the strategic EWSs predict the future
development of market, competitors, and company by supplementing each other
(Berndt, et al., 2011).
7.2.4 Critical interfaces
All participants confirmed that a standard tool or software for SMEs does not exist
and so this obliges companies to utilize self-made solutions. This matches the
findings during the literature review, that the recommendation is, in general, to
use Office applications (Ruderer, 2009), such as Excel, Visio, etc., as no EWS
software, appropriate for SMEs, exists. They added that the company has to bring
the strategy, performance, and operational, financial, economic area more closely
together, to be more future-oriented, which is sometimes not easy.
7.2.5 Used tools for communication and cooperation of involved party
All interviewees agreed that Meetings, E-Mail, and Phone are used for
communication concerning this topic. The literature review in general shares the
view of Kelders (1996) that it is important to have appropriate processes for
information search.
7.2.6 Medium for obtaining of information for the company’s protection
The eighth, twelfth and thirteenth participant named Articles and Meetings as an
appropriate medium for obtaining information for the company. The literature
review names journals, books, radio, TV, Internet, blogs or social media as the
source for the location and recognition of relatively weak signs (Trustorff, 2012).
Rocha-Lona et al. (2013) recommend during the selection criteria process not
only to evaluate whether the selected tools are needed, but also whether the
SMEs have the required resources and capabilities for their implementation.

242
7.2.7 Information process provided for the external company protection
The thirteenth participant indicated that the Crisis Management System describes
the process of communication. This generally corresponds to the literature
review, where Donnersmarck & Schatz (1999) state that it is important to focus
on organizational communicative aspects, where all relevant factors have to be
identified and dealt with. The EWS is designed for internal and external
stakeholders with different reports, based on central systems. The twelfth
interviewee added that some processes are extended to external suppliers and
their value-added processes; other risks, barriers to trade or from natural
disasters are checked and adapted if necessary. Hauser (1989) shares this view
and states that the company has to fix both the external and internal areas of
monitoring and, for each area, there should be developed an indicator that sends
a signal every time access changes. Kirschkamp (2007, p. 13) states that “A
holistic view is used where all relevant factors and their interdependencies have
to be identified and dealt with”.
The eight participants summed up with the explanation that data is prepared in
accordance with demand, especially in small businesses. This corresponds with
the literature, where the CEO has to set up appropriate reporting obligations for
the responsible divisions, which include all major risks and elements of risk
management and amendments thereto (Schmidt, 2015). The eight participant
added, that the top management is interested in liquidity figures, etc. This view is
confirmed by the literature, that far-sighted corporate management requires early
information so that the company's management has a larger field of action for
crisis-prevention or opportunity tackling (Jacob, 1986). "What is even more
important is that, in addition to developing such measures, they be a part of the
reports that reach top management so that awareness is created at the highest
level" (Gopinath, 2005, p. 26).
At this point, the developed EWS was presented

243
7.2.8 Critical comments on the developed EWS
All interviewees agreed that EWSs should be not too complex. This matches the
statement of Kelders (1996) that the information search process of a company
has to be realistic, clear and simple. They added that EWS has to fulfill the claim
of providing the possibility of reacting to information quickly, which means that
the analysis of the information should be easy to handle. "In the SME sector, the
company's crisis identification is specific because of the nature of SME business
management which creates the strong dependability of business results on
human resources and environmental factors" (Kurschus et al., 2015, p. 152).
Furthermore, the information search and information processing expenditure is
enormous, so that it is not manageable for SMEs for the reason of lack of
sufficient technological and human resources, in comparison to big companies,
to overview the whole area (Schlüter, 2004). The management has to start with
the company policy and strategic plan, reducing complexity, so that the
exploration of information could be found close to the symptoms, without an
endless search for alternative problems (Kelders, 1996). The thirteenth
participant indicated that some tools demonstrated require a certain knowledge,
which is often not available in SMEs. This is in line with the literature review where
Rocha-Lona et al. (2013) recommend during the selection criteria process not
only to evaluate whether the selected tools are needed, but also whether the
SMEs have the required resources and capabilities for the implementation. The
literature reveals that "Board members, CEOs, and divisional directors are the
main users of early warning systems, while the lack of experts for gathering and
analysis of indicators, as well as the absence of management initiatives, are the
crucial reasons for deficiency in early warning systems implementation" (Bedenik
et al., 2012, p. 672).
7.2.9 Additional requirements for the developed EWS according to the
requirements of the Turnaround Consultants (see Phase I)
Additional requirements for the Phase I, which were already named by
Turnaround Consultants, Interim Managers and Lectures, and shown to other
interviewees, were not named.

244
7.2.10 Realizable constellation of this system in praxis
All interviewees indicated that all business areas have to be monitored. The
literature reveals that the Scanning and Monitoring should include the micro and
macro environment (Trustorff, 2012). The necessary risk indicators must be
identified, properly selected and analyzed, which could be done by an integrated
financial Controlling system. Krystek et al. (2007) explain that early warning
indicators have to fulfill some demand and demonstrate the following attributes;
singularity, completeness, timely availability of information and economic
justification. The internal and external risks for all business processes and
relevant support processes must be taken into account, which could be done by
QM and GM. However, the whole thing will need effective and efficient
communication to internal and external areas. This generally corresponds to the
literature review, that especially during the SMEs, the management has to start
with the company policy and strategic plan, reducing complexity, so that the
exploration of information could be found close to the symptoms, without an
endless search for alternative problems (Kelders, 1996).
7.2.11 Measurable risk criteria, which should be integrated into this system
All participants agreed that all risks, which could be of danger for the company
should be included. This is in line with the literature review by Schmidt (2015) that
the risk identification should include all risks which need to be considered during
the decision-making process by management.
7.2.12 Additional benefit for the company through use of this EWS
The benefits of the use were named by the interviewees especially in a holistic
EWS by the inclusion of external and internal, strategic and operational,
qualitative and quantitative, factors. These main points were also shown during
the Phase I as requirements which an EWS in the Food Production Industry has
to fulfill, by Literature Review, Turnaround experts, Interim Managers and
Lecturers, where the EWS should help recognize risks in a timely fashion and
prevent them at an early stage, to be holistic (strategic and operational) and

245
practicable, future-oriented, include quantitative (hard) and qualitative (soft)
factors, be able to monitor all business areas, consider internal and external
factors and it should be designed for internal and external stakeholders with
different reports.
7.2.13 Additional effort, which participants have to bear for the system use
All participants agreed that the management should take the responsibility for the
use and suitability of an EWS. According to theory, Brühwiler (2001) states that
the CEO is responsible for the risk management, which is the first step in any
process or, to be precise, a management process. According to COSO II, the
management has the responsibility for identifying all external and internal risks
which could have an effect on the strategy or company aim (Hillebrand, 2005).
Monitoring is not a backroom function but instead an active process involving
managers at all levels who share an awareness of the risks that the organization
faces by providing them with necessary organizational flexibility (Bedenik et al.,
2012). The eighteenth participant indicated that some additional education of
some users would be needed. This is in line with the literature review, that often
SMEs lack of sufficient technological and human resources, in comparison to big
companies (Schlüter, 2004). It should be a top management information system
– monitored by management. The literature indicates that the CEO has to set up
appropriate reporting obligations for the responsible division (Schmidt, 2015).
“The purpose of the early warning systems is to indicate all the possible changes
in the earliest crisis phase, in order for management to have enough time to
consider reactive activities and to provide the largest possible number of
measures available for countering the crisis, which increase the manager’s
sensitivity to changes” (Bedenik et al., 2012, p. 675).
7.2.14 Aspects, which could make the use of this system difficult in praxis
The thirteenth interviewee pointed out that the beginning of early risk recognition
lies rather in an attitude question and a question of open communication, of a
readiness to scrutinize existing things of the importance of critical discussion
throughout the company, which is often missing, especially in SMEs. This
246
generally corresponds to the literature review by Ruderer (2009) that a modern
EWS does not only predict as early as possible the future development but is also
an entry point for critical discussion of cause and effect relationships, where the
employees have continuously to deal with changes occurring in the company
environment. The thirteenth interviewee added that this system requires a
background of knowledge or methods, where the responsibility for the suitability
of an EWS is definitely a management matter, which is often questionable. The
literature reveals that "Board members, CEOs, and divisional directors are the
main users of early warning systems, while the lack of experts for gathering and
analysis of indicators, as well as the absence of management initiatives, are the
crucial reasons for deficiency in early warning systems implementation" (Bedenik
et al., 2012, p. 672). Kurschus et al. (2015) add that ”In the SME sector the
company’s crisis identification is specific because of the nature of SME business
management which creates the strong dependability of business results on
human resources and environmental factors“.
7.2.15 Increased assurance of the company survival
All participants claimed that the (working) world is becoming increasingly
complex: inconstant, uncertain, ambiguous and complex environment and the
only way to respond to such developments in good time, without trying to
dominate the uncertainty, is to recognize risks in a timely fashion and prevent
them at an early stage. This is consistent with past studies. In his study, Abebe
(2012) defines environmental scanning as "the managerial activity of learning
about events and trends in the organization's environment". “The purpose of the
early warning systems is to indicate all the possible changes in the earliest crisis
phase, in order for management to have enough time to consider reactive
activities and to provide the largest possible number of measures available for
countering the crisis, which increase the manager’s sensitivity to changes”
(Bedenik et al., 2012, p. 675). Pedler & Abbott (2013) describe the connecting of
feelings and lived experience with awareness of our ‘theory-in-use’ as ‘thinking
on one’s feet’ by reflection-in-action that builds new understandings which inform
our actions in evolving situations. "This provides a basis for future action and
generates new or modified ideas in the process" (Reynolds, 1998, p. 186). All

247
interviewees agreed that EWSs help to detect crises and counter them in order
to control early, which increases the possibility of protecting assets and, in the
end, of securing jobs. This is in line with the literature review and Hampton (2009)
where he states that good risk information can be used to develop early warning
systems that alert an organization to potentially dangerous situations. The eighth
interviewee indicated that EWSs have to meet the requirements of risk
management and help to connect to the future through information sampling. This
view is also shared by Bedenik et al. (2012, p. 672) in the explanation that
“Indicators and EWSs are becoming more important as they can predict possible
future changes in their early stages and thereby reduce the time needed to make
adequate decisions“.
The interviewees of the last validation round confirmed that the developed EWS
approach is appropriate as a holistic model by including qualitative and
quantitative tools, for risk/crisis identification, as well as for monitoring and review
of them. The interviewees recognized that this EWS could lead to better
communication and in the end help to connect to the future through information
sampling, which helps recognize risks/crises earlier.
The gain of internal and external information was named by interviewees as
confirmation of the suitability of daily use for this EWS. The demonstrated tools
of the EWS were also confirmed, except for a few comments, as appropriate for
practical use during this topic.

248
8 Phase IV: Refining
Phase IV is the last of four phases and deals with the Refinement of best practices
in the respective categories. For the purpose of analysis and confirmation, the
interview protocols were transcribed and categorized. Thus the research so far
has identified the following best practice elements and aspects in the respective
industry, which were also confirmed by the case studies:
- PESTLE
- SWOT Analysis
- Planning
- FMEA
- HACCP
- Turtle Diagram
- Fault Tree Analysis (FTA)
- Creativity methods
- Balanced Scorecard (BSC)
As Yin (2009) recommended further investigation and refinement of best
practices, subsequently, the aggregated results of the interviews were integrated
into the corresponding model by analysis consideration of the theoretical basis
and recognition with the statements from the practice. For this reason, the
technical, financial, organizational, and operational sight were taken into account.
At the end, this approach enables the verification of a practicable EWS, which
was compared, validated and now refined appropriately by suggestion for
implication as follows:
Practical appropriateness from a technical point of view
For the practical use of the EWS it is necessary to fulfill some technical
requirements. The use of the tools is Microsoft-based, where an interface to the
company software/ERP and to the internet is necessary, which should be no
problem nowadays. All participants should have access to the system. Besides

249
the technical restrictions, it is important that the participants are motivated for
open and cooperative teamwork. In conclusion, the EWS is basically appropriate,
from a technical point of view, for practical use.
Practical appropriateness from an organizational point of view
According to figure 14, it is fundamental that an interface to QM and CO systems
exists. For the introduction of the EWS in a company it is important to consider
the company culture and common understanding. In summary, according to the
interviews, the appropriateness from an organizational point of view can be
confirmed.
Operational capability of the tools
In general, it can be said that the developed tools are appropriate as best-practice
for use during the EWS.
Practical appropriateness from a financial point of view
As the EWS is Microsoft-Office based, the writer assumes that most companies
fulfill the requirements for it and that no further investment would be necessary.
The developed EWS could not, due to the time constraints, be tried/implemented
in practice. For this reason, it is not possible to say with 100% guarantee, whether
the approach is workable in practice. From the literature and interviews, it was
possible to ensure the practical basis of the EWS approach, and this can be used
for further research of validation. The possibility of new factors arising cannot be
excluded and, in this case, those new factors should be taken into account by
modification of the approach.

250
9 Conclusion
This chapter provides a conclusion from the findings generated in this thesis and
provides an overview of the contributions arise from this research, limitations of
this thesis, as well as possibilities for further research.
9.1 Summary and Discussion of the Results
The aim of this thesis was to develop a holistic EWS approach for the food
production industry. It starts with the initial literature review to capture both the
theoretical and empirical aspects of this topic, which makes explicit the
philosophical stance taken in the development of the early warning system. It
considers the development stages of EWS in the Business Economics literature,
forms of appearance, followed by the description of different models and finishing
with the EWS approaches. In addition, it includes a synthesis section, which
demonstrates to what extent there is agreement between workers and to what
extent there is disagreement, summarized in a table with key literature sources
and the contributions they have made. Finally, the literature review finishes with
an indication of what gaps in knowledge exist and which of these gaps this work
aims to fill. This is summarized during a conceptual framework developed from
the results of the literature review, where the research questions and objectives
can be shown with regard to what they specifically address. The first research
question and research objective aim to establish requirements for a successful
EWS and added knowledge on the objectives with regard to having a framework
for EWS building. The second research question and objective address points
about knowledge creation on the best-practice CO & QM tools and the
appropriate combination of them. The last question and objective analyse the
practical and integrative approach, which builds a contribution to practice. This is
displayed in Figure 36.

251
Figure 36 Conceptual framework - context of the research questions and objectives
Source: own illustration
This structured literature review on this given topic, the identified specific need
for research in this area as well as the connections between topics displayed as
shown in Figure 36 thereby demonstrate the first contributions of this thesis to
knowledge and practice.
However, based on the literature and the resulting gap in research, three
research questions were deduced:
1) What are the requirements for a successful early warning system
(EWS) with respect to company crisis in SMEs within the food
production industry, as identified by turnaround/interim managers?
2) Which controlling (CO) and quality management (QM) tools are
appropriate for a successful EWS for SMEs in the food production

252
industry and how they can be combined to form an integrated
framework?
3) Which tools can be used to anticipate and define a potential company
crisis in SMEs in the food production industry?
To answer these research questions theoretical and empirical analysis were
conducted, where the research was split into 4 phases, which was developed
sequentially. Each phase, however, uses semi-structured interviews as its core
data generation mechanism. Such an approach to interviewing enabled me to
address the complexities of the topic through conversation with experts and at
the end reach the objectives. It will be systematically shown how in turn each of
the research objectives was met.
For the answering of the research questions, the most important results will be
summarized and discussed.
1) What are the requirements for a successful early warning system
(EWS) with respect to company crisis in SMEs within the food
production industry, as identified by turnaround / interim managers?
Besides the requirements found during the literature review, which also formed
the structure of the interviews, the results from both sources were defined and
categorized, followed by the development of the following unified listing.
Requirements, which an EWS in the Food Production Industry has to fulfill,
identified the following main points by the Turnaround experts which also comply
with the literature review:
EWSs should:
- help recognize risks in a timely fashion and prevent them at an early stage
- be holistic (strategic and operational) and practicable, so not too complex
- be future-oriented
- include quantitative (hard) and qualitative (soft) factors
- monitor all business areas
253
- consider internal and external factors
- be a top management information system – monitored by management
- be designed for internal and external stakeholders with different reports
- match characteristics of the company (culture, structure, size and type of
management)
- be under the responsibility of the management with reference to its
suitability
The 1st research objective was to identify the requirements for EWSs in SMEs
in the food production industry. This was first addressed during the first phase in
Chapter Four with the identification of requirements for a successful EWS from
literature review. To be able to meet this research objective, besides the
requirements found during the literature review, which also helped to form the
structure of the interviews, three turnaround/interim management experts
participated in semi-structured interviews. This method generated rich data,
which were exploratory in nature. As DIN EN ISO 9001:2015 only came in in
October 2015 and mandates a risk - oriented quality management system, this
research required an approach that is able to explore tools that might have been
not considered as relevant, or important, previously. Issues that emerged from
the interviews were also examined within the literature (Yin, 2014). The
requirements for EWS, as a result, were defined and categorized, compared
these to those identified in the literature and developed a unified listing drawing
on both sources, which was shown to the interviewee during Phase II for
answering the second question.
2) Which controlling (CO) and quality management (QM) tools are
appropriate for a successful EWS for SMEs in the food production
industry and how can they be combined to form an integrated
framework?
The toolkit of CO and QM is very large, and it was necessary, with the help of two
CO and QM experts, to identify these tools most appropriate for EWSs, which
match the requirements identified by turnaround/interim management experts
and literature review. In chapter five, during the second phase, the unified list of

254
the requirements from phase one, which was the starting point for the third stage
of literature review and also for the semi-structured interview, was shown to the
interviewees before interview. It was important to explore CO and QM tools not
only from the literature but also from the empirical view as best-practice with the
help of two CO and two QM experts, independent of the case companies,
appropriate for recognizing risk factors of company failure and matching the
requirements of a successful EWS. Here, too, were the findings from both
sources defined, categorized, compared and unified for the subsequent
development of an EWS.
Before the tools are shown, the following comment from an interviewee should
be noted:
The beginning of early risk recognition lies rather in an attitude question and a
question of open communication, of readiness to scrutinize existing things, and
in the importance of critical discussion inside the company. The tools can only
help to support when the company has an appropriate framework for them.
Employees must be sensitized to an openness of critical discussion by cause and
effect relationships. Employees continuously have to deal with changes occurring
in the company environment. This all requires analysis or understanding of the
new situation, and this knowledge, especially in SMEs, is often lacking.
Companies should pay attention to communication and information policy,
wherein the risk policy of the company should be written. The tools can help
identify, describe and control the risk, but the employees should be able to use
the tools and to notice signs, coming from the company and environment.
As a result, the following tools were classified as ‘best-practice-elements’ by the
interview of CO & QM experts (integrated framework of this tools is shown in
chapter 7):
- PESTLE is a model which adds to the environmental analysis and
considers the political, economic, social, technological, legal and ethical
(or environmental) risks faced by the organization.
- SWOT is helpful for a company to understand their Strengths and
Weaknesses, to be ready to grasp the Opportunities and overcome the
Threats.

255
- Planning helps to rethink all possible events/developments with crisis
potential in advance in order to react fast when a crisis arrive.
- FMEA is used to identify ways a process or product can fail to meet critical
customer requirements.
- TURTLE analyses processes by recognition of their weaknesses,
effectiveness, and efficiency, as well as the interfaces and their
dependencies.
- HACCP is used in the food industry to identify potential food safety
hazards so that preventive actions can be taken to mitigate the potential
risks.
- Fault Tree Analysis is a failure analysis, which analysis all possible
reasons for an undesired deviation (a major event), which by interrelation
cause the disruption.
- Creativity methods, such as Brainstorming or Brainwriting can be used for
supporting the above methods, by data-gathering.
- BSC is a strategic tool appropriate for designing the whole planning,
monitoring, and control process, which combines the key performance
indicators from the past with future value drivers.
The interviewees also pointed out that
In the end, the CEO must have a Management Cockpit, which delivers him an
overview of the whole company, where environment information is included and
enables him to make appropriate decisions as well as react to changes in time.
The internal and external risks for all business processes and relevant support
processes must be taken into account, and efficient communication to internal
and external areas should be ensured.
However, the 2nd research objective was to combine the explored CO and QM
tools appropriate for an EWS for a German food production to a holistic approach.
To meet the second objective, the aggregated results from the literature and
interviews were integrated into the corresponding chapter 6, where a holistic
EWS was developed by the combination of the tools. The development approach

256
was divided into 3 stages: determination of the context, followed by risk
identification and finished by risk monitoring and review. The EWS approach was
developed by the writer on the basis of literature/interview, own logical approach
and then validated by the informal exchange of ideas with experts. Each stage
shows the recommended best-practice tools, which were explored by the CO and
QM experts, and also tools additionally found in literature, by an explanation of
their uses and aims.
3) Which tools can be used to anticipate and define a potential company
crisis in SMEs in the food production industry?
For answering the third research question, the developed model was shown to
the companies during the Case Study with the aim of analyzing the
appropriateness of implementation and use in SMEs.
The 3rd research objective was to analyze implementation issues and
considerations relevant to EWS tools in the food production SME context. For this
reason, two Case Studies were used within two separate and independent
medium-size companies. The first study was in a company, which is specialized
in food production industry for fruit and vegetables. The second study was within
an organization, which is also active in the food production industry, this time for
milk products. The studies involved three semi-structured interviews per study of
the senior management of relevant functions: quality, controlling and general
management.
The interviewees of the last validation round confirmed that the developed EWS
approach is appropriate as a holistic model by including qualitative and
quantitative tools, for risk/crisis identification, as well as for monitoring and review
of them. However, the following comments from the interviewees should be taken
into consideration:
Whatever the tools of any system are, the company has to be able to tailor the
framework to their own needs. The most important goal for this system should be
an overview of the whole area.
Finally, after confirmation for practical appropriateness of the developed EWS
approach by case studies, the model was refined, and a recommendation for

257
implementation was described. The recommendation implementation takes into
consideration the financial, organizational, operational and technical aspects.
9.2 Limitations
The research limitations within the context of the current study refer to the aspects
that have not been completely attained or were only achieved to a certain extent.
Overall the current study is constructed from strong evidence including literature
review, interviews, and case studies.
The first level of limitations is created by the research philosophy, i.e.
constructivism; research methodology, i.e. inductive, qualitative, multiple case
study research. This means that the development of the EWS approach was
based on the literature review and interviewees with different professional
backgrounds, such as Tunaround Consultant, Imterim Managers, Lecturer,
Interim Management Advisor, Controlling, Controlling Advisor, Business Manager
for Competence Center Controlling, DIN EN ISO 9001 ff./ HACCP lead Auditor,
DIN EN ISO 9001:2015 Advisor. Furthermore, two Case Studies with
professionals from Controlling, Quality Management and General Management
departments, were involved. These results provide a baseline that can be utilized
for this purpose, however, it is limited to the named professional area. To
interview even a wider circle of professionals, such as e.g. bank or tax
consultants, who are also involved in risk or early warning areas, but only limited
to a very narrow sector, would possibly contribute additional/different content.
Based on the outlined problem, this work, according to the described sector and
requirements, delivers a model of a holistic EWS integrating both a QM and CO
tools for food production SMEs. For this reason, the results of this research are
only applicable to the defined sector; any transfer to other industries requires
further investigation. This could be done by further research, such as Case Study
or Action Research e. g., where developed EWS approach could be analysed
and refined for further branches, large or internationally-active companies.
Furthermore, the EWS has not been implemented and tested within an SME
environment to find out how effective it is in practice. Through implementing this

258
EWS in practice, it would be possible to test and improve it accordingly. The use
of the recommended tools with their appropriate use was described, verified and
confirmed as best-practice tools by practical experts during interviews and case
studies. As the developed EWS could not, due to time constraints, be
tried/implemented in practice, it is not possible to say with 100% guarantee, if this
approach is workable in practice. From the literature and interviews, it was
possible to ensure the practical basis of the EWS approach, which can be used
for further research of validation. The possibility may not be excluded that during
its use new recognitions could arise, which have to be considered. In this case,
the recognitions should be taken into account by the modification of the approach,
which could be done by further action or modification of this model during further
research.
After this summary and discussion of the results of this work, the Contribution to
Knowledge and Practice will be described.
9.3 Contribution to Knowledge
From the literature review during Chapter Two, as already summarized in the
overview and presented in a chronological sequence, it has been shown that the
development of EWS has grown historically and has been formulated in more
detail and partly adapted to the circumstances. With the awareness that risks
exist for companies and that they can be detected even at an early stage in order
to initiate adequate countermeasures, it was seen that it was necessary to come
to a very detailed division between operational, strategic, qualitative and
quantitative, internal and external areas and EWSs. Numerous tools, concepts
and methods have also been developed in the literature, in order to identify
individual risks and risk areas within a company, branch, etc. (Ruderer, 2009),
but a holistic EWS, shown in figure 37 below, including all mentioned factors, was
missing.

259
Figure 37 Holistic EWS
Source: own illustration
Figure 37, above, illustrates the main contribution, based on the identified gap,
where a holistic EWS was developed during Chapter Six by the combination of
explored tools,

260
Figure 38 Comparison of tools from previous concepts and developed model
Source: own illustration
Figure 38 illustrates the comparison of previous tools and the developed model.
Previous tools thus, operative (KPIs, Projections, Indicators) are included in the
BSC and strategic (Diffusion Theory, Creativity Methods, Trend Landscape,
Cross-Impact-Analysis, Scenario Analysis, SWOT Analysis, Strategic Planning
and Portfolio Analysis) are reinforced by additional tools (PESTLE, FMEA,
HACCP, Fault Tree Analysis, Delphi Method, Turtle Diagram and BSC). The link
between strategy development and implementation in the operative business,
which was described during the literature review within Concept of Hammer
(1998) as a difficult point without naming an appropriate tool, as previously noted,
was solved by BSC.
261
Furthermore, based on the answers to the research questions, a contribution to
knowledge is also presented by the requirements for a successful EWS and the
exploration of appropriate QM and CO tools for EWS, which match the identified
requirements and are appropriate to recognize risk factors of company failure.
This contribution will be now described specifically.
The first contribution to knowledge was achieved through the first phase of this
research, by the identification of requirements for a successful EWS from
literature review, followed by the semi-structured interview. The findings from the
theoretical and empirical area were compared, categorized and established to a
unified list. The outcome helps to establish a basis from both points of view,
theoretical and practical, for requirements, which can be considered during EWS
development.
The second contribution to knowledge arises from the second phase of this
research, where the unified list of the requirements from phase one, were used
as a starting point for the exploration of the CO and QM tools, appropriate for
recognizing risk factors of company failure, from the literature review and also
from the semi-structured interview. The findings from both sources were defined,
categorized, compared and unified for the subsequent development of an EWS.
The aggregated results from the literature and interviews can be used for an
integration into an existing system or combined to form a holistic EWS, which is
limited to German food production industry.
The third and main contribution was created through the sequential use of the
data from the research phases by consideration of requirements for an EWS,
inclusion and combination of explored CO and QM tools, which offers an holistic
EWS for German food production industry. The evidence was gathered from the
empirical study within the SMEs, in order to review how it could be implemented
and used in practice.
There is no evidence in the literature from previous theoretical or empirical
studies that a holistic EWS exists which includes CO and QM tools. The
framework matches the phases of ISO 31000 by starting from the ‘Determination
of Context’, through ‘Methods of Risk Identification’, to ‘Methods for Risk
Monitoring and Review’.

262
Moreover, it fulfills the requirements of several authors, who point out the need
for a more holistic approach including both quantitative (operative) and qualitative
(strategic) factors (Bedenik et al., 2012; Purvinis et al., 2005; Kurschus et al.,
2015).
9.4 Contribution to Practice
This work makes a seminal contribution to the EWS in business. Such a
comprehensive, systematic approach (CO + QM) is currently unknown, both in
research and also practice. Therefore, the work represents a new, innovative and
implementable practical model.
First, the practical part of the current study is concerned with the analysis of the
interviews collected from Consultants, Interim Managers, CO and QM experts, as
well as GMs from the SMEs. To validate the results of the interviews the
researcher categorized each interview, according to activities of the development
of the EWS. This allowed a comparison of the interviewees and determined
whether they had views which were compatible, or contradictory. The case study
also contributes by being based on interviews.
Second, the developed EWS may support managers by recognizing risks/crises
at an early stage within the SMEs, as follows:
Synthesis of development phases
This framework enables the development of the EWS as a process, by
interconnecting the development phases. The results of one phase are the input
for the next phase, such that they depend on each other. The EWS allows a
holistic view of the phases, as it starts with the ‘Determination of Context’,
followed by the ‘Identification of Risks’ and finishes with ‘Risk Monitoring and
Review’.
Activity in each phase are highlighted and positioned
A set of tools is suggested for each phase, where the unified list of the
requirements from phase one were used as a starting point for the exploration of
the CO and QM tools, appropriate for recognizing risk factors of company failure,

263
from the literature review and also from the semi-structured interview. The
findings from both sources were defined, categorized, compared and unified for
the subsequent development of an EWS. However, for the first stage
(Determination of Context) the best practice tools were identified as PESTLE and
SWOT; for the second stage (Risk Identification) Planning, FMEA, HACCP,
Turtle-Diagram, FTA and Creativity methods; for the third stage (Risk Monitoring
and Review) BSC. The aggregated results from the literature and interviews can
be used for integration into an existing system or combined to form a holistic
EWS, limited to German food production industry. This provides guidance to
managers for every activity.
Tools related/connected to phases
Each of the tools during the EWS has a specific purpose and are joined together
on the basis that they would overcome each other's limitations. While PESTLE
analysis, for example, is only used at the beginning of the process, the BSC, in
contrast, is responsible for risk/crisis monitoring and review.
A flexible and coherent process
The suggested framework allows for the simultaneous application of phases in a
dynamic process. By using this framework, the manager is able to deal with every
stage by different tools, as they address different activities or tasks.
The possibilities of implementation are explicitly considered
The suggested EWS was analyzed for practical use during the Case Study,
where the developed model was shown to the companies with the aim of analysis
of its appropriateness for implementation and use in SMEs, as well as for
refinement. The two studies were within two separate and independent medium-
size companies. Both companies are German producers of food with QM and CO
departments, which confirmed the EWS for practical implication. Furthermore it
would be refined by inclusion of the technical, financial, organizational, and
operational sight.
After a summary and contribution to knowledge and practice, the findings are
critically assessed, and the need for further research necessity is explained.

264
9.5 Critical Assessment and Further Research Possibilities
Based on the outlined problem, this work, according to the described sector and
requirements, delivers a model of a holistic EWS integrating both a QMS and CO
tools for food production SMEs. The results are based on literature review and
empirical research. The recommendations for the different phases were based
on the food sector and SMEs, which were also taken into consideration during
the empirical research.
First, the EWS, developed during this work, enables companies in the food
production industry to use the framework by individual tailoring suitable for the
company. The use of the recommended tools with their appropriate use was
described, verified and confirmed as best-practice tools by practical experts
during interviews and case studies. As the developed EWS could not, due to time
constraints, be tried/implemented in practice, it is not possible to say with 100%
guarantee, if this approach is workable in practice. From the literature and
interviews, it was possible to ensure the practical basis of the EWS approach,
which can be used for further research into validation. It is not excluded that new
factors could arise during use, which has to be considered. In this case, the
factors should be taken into consideration by modification of the approach, which
could be done by further actions or modification of this model during further
research, where Action Research in this context would possibly be suitable and
which will be explained shortly below.
Case Study is different to Action Research (AR). Whereas Case Study considers
organizational phenomena without changing them, Action Research intervenes
by creating organizational change and simultaneously studies the impact, where
it is directly involved (Kock, 2007). AR is a methodology based on philosophy and
practice, which can be enhanced by learning improvement and articulation of the
reasons for, and potential significance of the research (McNiff & Whitehead,
2010). Practice means working with other people in sets and including one’s own
personal reflective practice (Pedler & Abbott, 2013).
Weick (2005) narrows it further by stating that Practice is equated with doing,
concreteness, understanding, and know-how as opposed to Theory which is
equated with thinking, explanation, knowing that, and dissection into parts. "If you

265
want to get ahead, get a theory" (Schön, 1983, p. 56). "The relationship between
theory and practice is a correspondent, complementary, incommensurable,
coordinate, parallel, reciprocal, conceptually equivalent, and methodologically
equivalent" (Weick, 2005, p. 454).
All research has the objective of creating new knowledge, testing the validity of
knowledge claims, and generating new theory (McNiff & Whitehead, 2010). Kurt
Lewin, known as the father of AR (McNiff & Whitehead, 2010) defined action
research as “…a way in which researchers could bridge the gap between practice
and theory” (Donnelly et al., 2012, p. 8). The recent description of AR is presented
as a way of improving practice through knowledge creation in contrast with
traditional forms of research by manipulating variables in order to demonstrate a
causal relation between them (McNiff & Whitehead, 2010).
A further definition, which is complicated, but more detailed, agreed by Whitehead
(2009, p. 86), is the idea that: “…if yours is a situation in which: people reflect and
improve (or develop) their own work and their own situations; by tightly interlinking
their reflection and action; and also making their experience public not only to
other participants but also to other persons interested in and concerned about the
work and the situation, i.e. their public theories and practices of the work and the
situation, then yours is a situation in which action research is occurring”.
The practice base of AR means that all people, who are investigating the situation
they are in, can become researchers (McNiff & Whitehead, 2010). The difference
to empirical research, where the real question will be asked about the
experimental methods, is found in AR in the query about discourse (Moser &
Zedler, 1983). Moser & Ornauer (1978) describe ‘reproductive AR' as the
overcoming of a worker or other people resistance and ‘dialectic AR' as the
transformation of passive resistance into active opposition. Revans (1966)
explains it in a very simple way by the possibility of change for everybody after
recognizing its necessity.
Even though there is a lot of literature about AR, which states that it should be a
qualitative research method that emphasizes collaboration between researchers
and practitioners (Kock, 2007). Moser (1977) in contrast states that AR offers a
wide range of methods, which can be quantitative or qualitative. Frei (1984)

266
claims that AR can only be a methodology to ensure the growth of knowledge,
but not a method, which was often mixed in the past.
“AR combines theory, research, and practice” (Donnelly et al., 2012, p. 3). In
contrast to this quite broad description, Huang (2010) does not separate
understanding and action and states that legitimate understanding is only
possible through action.
McNiff & Whitehead (2010) posed a lot of questions about appropriateness,
generation, validation, and qualification to produce a theory. In traditional terms,
‘theory' has a normative status, which has to fulfill the criteria with regard to the
best-practice element so that it can be accepted in the research area (Sandberg,
2012). Huang (2010, p. 93) narrows this definition by stating: "Theory without
practice is not a theory but speculation".
Senghaas-Knobloch (2001, p. 155) distinguishes between organizational and
action theory: "When someone is asked how he would behave under certain
circumstances, the answer he usually gives is his espoused theory of action for
that situation. This is the theory of which he gives allegiance and which, upon
request, he communicates to others. However, the theory that actually governs
his action is his theory-in-use, which may or may not be compatible with his
espoused theory; furthermore, the individual may or may not be aware of the
incompatibility of the two theories”.
A different understanding of theory could be arrived at by the use of multi-media
explanations from action research (Whitehead, 2009). However, Kock (2007)
summarizes the different explanations and states that theory, and most of its
forms, provides a basis for action as validation.
Action is the intended change of existing reality and research is a production of
knowledge (Moser & Ornauer, 1978). For this reason, AR is a perfect model to
use as an opportunity for the combination of theory with action (Cremer, 1980).
Some of the best organizational ARs are also known to business leaders as
consultants, who do work for practitioners, which can overlap and engage more
systematically with knowledge creation (Huang, 2010). The appropriateness of
AR for consultants is also affirmed by Senghaas-Knobloch (2001), where she
explains that the association as “joint reality” between client and consultant is

267
necessary as a basic requirement. Kock (2007) in contrast narrows it by the
explanation that consultants could make some significant contributions to AR and
can envision that some consultants will add AR to their toolkit.
An iterative cycle of AR was characterized by the problem of
identification/diagnosis, planning, action taking, and evaluation of the outcomes
(Donnelly et al., 2012). In contrast, the exploratory action research approach for
practical and industry-based research, iteratively plans (theorizes), acts, (teaches
practice/theory), observes (barriers and opportunities) and reflects
(documents/disseminates), whilst integrating design thinking (Price et al., 2013).
AR also brings problems particularly between the intentions of the researchers
and the intentions of the members of the host organization, because the
researchers and practitioners may not share the same values and they are likely
to have different goals (Kock, 2007). For this reason Pieper (1977, p. 314) states
that “ideally action-research should be undertaken by a team which is small
enough to function as a group but which is sufficiently large to represent different
personality types, social values, and talents”.
When making a decision to act, the researcher has to be clear about how to
proceed. It is not possible to act out of a desire to have things, or manipulate
others or to implement a certain policy. To be an Action Researcher, means
constantly to evaluate, check and act honestly and openly for the benefit of others
(McNiff & Whitehead, 2010). Furthermore, the researcher should be a "real
researcher", which means, being interested in the scientific knowledge gained
during AR and not only taking the view "I don`t know, but I do know how to study
the problem" (Pieper, 1977, p. 291). The action researcher, seeing the
intervention as a necessary component at work, creates organizational change
and simultaneously studies the impact of this change (Kock, 2007).
The basis is that analysis, intervention, organization theory and intervention
theory combine together (Cremer, 1980). When someone reflects-in-action, when
he does not separate thinking from doing by being independent of the established
theory, he becomes a researcher in practice (Schön, 1983). "Intervention
produces practical improvements" (Huang, 2010, p. 100). It is an interesting and
relevant method of AR, which should be done by insider-as-researcher,

268
especially in the diagnosing and reflective learning stages of AR because they
can modify and hopefully improve their direction setting process (Kock, 2007).
In a practitioner’s reflective conversation, where he is a part of it, he acts as an
agent by including his own contribution, which may foil his projects and reveal
new ideas (Schön, 1983). Gosling & Mintzberg (2003) put the ‘self' as a subject
for reflection, where through the process of change, action pulls relationships,
organization, self and context together. "Through the unintended effects of action,
the situation talks back – the practitioner, reflecting on this back-talk, may find
new meanings in the situation which lead him to a new reframing" (Schön, 1983,
p. 135).
Rosner (2007) describes three types of intervention such as structure work,
process work, and test, where each of them has a different task, such as test e.g.
the test of a hypothesis. Cremer (1980) states that the intervention method,
including group dynamics, plan/decision, and empirical process, structures the
action methodically and in content.
Kock (2007) makes it clear to his readers early on that there is no consensus
about AR being compatible with many epistemologies, positivism included.
Creswell (2009) narrows it by the statement that Positivism represents the
traditional form of research, which goes more in the direction of quantitative and
not qualitative research.
If it were possible for somebody as a researcher to do AR, it would help to confirm
and validate best-practice elements of EWS in practice. The internal researcher
can provide access to sensitive data and is capable of systematically evaluating
organizational interventions, accompanied by sufficient trust or organizational
knowledge (Kock, 2007).
As a constructivist researcher I see reality as being constructed, and especially
with AR, there will be a changing of predictable and unpredictable factors in spite
of it (Creswell, 2009). This will start with guidance by an explicit framework of
ideas, identification of an appropriate real-world problem situation and, guided by
an appropriate methodology, initiation of actions which bring improvements in the
situation. Reflection on the changes will lead to learning which, in turn, will

269
generate new insights, new understandings, and new knowledge, where the
researcher has judge the chosen methodology (Kock, 2007).
As previously stated, my goal is to confirm and validate best-practice elements of
EWS in practice, which could be best done by an AR. It could start with the
analysis of the explored CO and QM tool and finish with the implementation of
the developed EWS by consideration of the main problem of time for
counteraction.
Following a concrete description of suggestions for implementation steps, it will
enable the researcher to further develop, if appropriate, the EWS from this
research. It is important in this way to show if the developed EWS includes
weaknesses, which should be to change into strengths if possible. The further
steps will define the application scenarios for the refining of the developed
system.
The plan will include the theoretical part from the point of view of the manager,
who will use it in practice, the analysis results for the implementation of the
developed EWS by including Controlling and Quality Management as a tool.
These tools will then be implemented in the praxis as Action, which will be
observed, evaluated and discussed with the possible decision of a new loop if
necessary.
However, it would make sense to have several loops during the AR cycle to make
sure that it is appropriate for practice, even if it will be very challenging and time-
consuming.
Second, further research could also be carried out by the analysis of the process
along the complete supply chain by the consideration of suppliers, clients, etc. It
would have the advantage that upstream and downstream risks, especially those
which cause each other, would be recognized much earlier. This is an additional
area for further research, which should begin with a broader analysis of the
organizational context, through the analysis of tools, which are used for
identification, as well as for monitoring and review of the risks by both suppliers
and customers. In the first phase, the tools from suppliers and clients could be
identified and analyzed. This would be followed by the identification for
appropriateness, followed by the third phase, by analysis of appropriateness for
270
implementation or the linking of the identified tools to the EWS developed during
this research. This would be followed for practical verification by a Case Study or
Action Research, where the research processes were already described above.
It would enable the researcher to extend, in the best case, the developed EWS
in this research, from one for only one-company to the cross-company EWS.
Third, the development of this work was only based on German SMEs. Based
on the outlined problem, this work, according to the described sector and
requirements, delivers a model of a holistic EWS integrating both QM and CO
tools for food production SMEs. For this reason, the results of this research are
only applicable to the defined sector; any transfer to other industries requires
further investigation. This could be done by further research, where the
developed EWS approach could be analysed and refined for further branches or
internationally- active companies. In particular, the international aspect was not
considered, and so this could be extended to the international arena.
Internationally-active companies, working globally and also producing products,
which are in response to the demands of the international market, will raise further
questions and considerations and will need to have different systems of analysis
and monitoring. This is an additional area for further research, which should begin
with a broader analysis of the organizational context, through the analysis of tools
for identification of the risks coming from abroad, to the method of risk monitoring
and review. In the first phase, the risks from abroad could be identified and
analyzed. This would be followed by the identification, if appropriate, of additional
tools for identification and monitoring of them. The third phase could include the
analysis of the implementation of the identified tools to the EWS developed during
this research. This would be followed by the practical verification by a Case Study
or Action Research. It would enable the researcher to extend, in the best case,
the developed EWS in this research from one for only the German Sector to the
International.
The results of this study may hopefully facilitate future research that can expand
on its findings and be conducted in different sectors.
After these critical comments and further research possibilities, the implications
for practice are presented.

271
9.6 Implications for Practice
The success of EWS is of essential importance for organizations, where
companies should consider Early Warning information throughout the whole
company. The companies should consider company structure, try to implement
the EWS in an already existing system (here: QMS), analyze the practicability
and avoid complexity.
For the success of the EWS it is not only important to look at an appropriate
structure and suitable processes, but more important is the culture of the
company, the qualification of employees and the communication process. To
secure the workability of the EWS the commitment of CEOs, as well as the
acceptance from the employees, which have to handle them, is of great
significance.
EWS does not prevent failure, but it helps to recognize risks/crises at an early
stage before it is too late. Most business failures happen as a knock-on effect
from outside or inside a company (Ropega, 2011). “… in today`s world, it is not a
question of if or whether an organization will experience crisis; it is only a matter
of what type of crisis will occur, what form it will take, and when it will happen”
(Roselieb, 2008, p. 135).
Companies should try to use external, personal as well as internal, impersonal
sources more to get data about future trends. They should try to scan with a
broader scope, interpret the information during an open communication and
analyze the variables further if necessary. Only companies, which are able to
identify, monitor and handle risks/crises, as well as opportunities at an early
stage, will be able to survive.

272
References
Abebe, M. (2012). Executive attention patterns, environmental dynamism and corporate
turnaround perfomance. Leadership & Organization Development Journal, pp.
684-701.
ACCA. (2008). ACCA Association of Chartered Certified Accountants - Business Failure.
Retrieved from http://www.accaglobal.com
Ackemann, H. (1986). Frühwarn- und Früherkennungssysteme zur Beurteilung von
Unternehmenskrisen in Bauindustriellen Unternehmen, p. 28. Göttingen: Georg-
August-Universität.
Aguilar, F. (1967). Scanning the business environment. New York: Macmillan.
Allenspach, M. (2006). Beratung in integriertem Risiko-Management. Gossau: Cavelti.
Altenähr, V., Nguyen, T., & Romeike, F. (2009). Risikomanagement kompakt. Karlsruhe:
VVW.
Altman, E. (1968, 09). Financial ratios, discriminant analysis and the prediction of
corporate bankruptcy. Journal of Banking & Finance, pp. 589-609.
Altman, E. (2000, 05). Predicting Financial Distress of Companies: Revisisting the Z-
Score and ZETA Models. New York Universiity Papers, pp. 1-54.
Altman, E. (2002). Revisiting Credit Scoring Models in a Basel 2 Environment. Retrieved
from Working Paper, Stern School of Business New York University:
http://archive.nyu.edu
Altstetter, S. (2008). Bedeutung und Umsetzung einer ganzheitlichen Risikoidentifikation
zur Etablierung eines effizienten Risikomanagement-Systems in Unternehmen.
Kassel: Kassel University Press.
Ansoff, H. (1976). Managing Surprise and Discontinuity - Strategic Response to Weak
Signals. Zeitschrift für betriebswirtschaftliche Forschung, pp. 129-152.
Ansoff, H. (1984). Implanting strategic management. Englewood Cliffs: Prentice-Hall
Internat.
Argenti, J. (1976). Corporate Collapse: The Causes and Symptoms. New York: McGraw-
Hill.

273
Argyris, C. (1982). Reasoning, learning, and action: individual and organizational. San
Francisco: Jossey-Bass.
Arlinghaus, O. (2007). Praxishandbuch Turnaround Management. Wiesbaden: Gabler.
Battelle-Institut. (1978). Soziales und politisches Frühwarnsystem zur Erkennung von
Veränderungen im Umfeld der Unternehmen. Frankfurt: Battelle-Institut.
Battelle-Institut. (1980). Frühwarnsystem für die Strategische Unternehmensführung. Ein
Radar zur Erkennung von technologischen, wirtschaftlichen, politischen und
sozialen Veränderungen im Umfeld der Unternehmen. Frankfurt: Battelle Institut.
Beaver, W. (1966). Financial ratios as predictors of failures. Journal of Accounting
Research, pp. 71-111.
Bedenik, N., Drilo, D., & Labaš, D. (2012). Early Warning System - Theoretical and
empirical analysis. International Conference of the Faculty of Economics, (pp.
672-684). Sarajevo.
Belkin, V. (2011). Multikriterielles Controlling von Geschäftsprozessen. Köln: JOSEF
EUL VERLAG.
Benes, G., & Groh, P. (2014). Grundlagen des Qualitätsmanagements. München:
Hanser.
Berndt, M., Brinkmann, J., Mantell, G., Pamminger, A., Strötges, M., & Warmers, J.
(2011). Sanierung von Firmenkunden. Heidelberg: Finanz Colloquim.
Bertram, U. (1993). Früherkennungsorientierte Steuerung: theoretische Grundlagen und
Anwendungen für Versicherungsunternehmungen. Hannover: Univ. Diss.
Bloom, B., Engelhart, M., Furst, E., Hill, W., & Krathwohl, D. (1956). The categories of
the cognitive domain are referred to as Bloom's Taxonomy of Learning. New
York: McKay.
Bogner, A., Littig, B., & Menz, W. (2009). Experteninterviews. Wiesbaden: VS.
Bötzel, S. (1993). Diagnose von Konzernkrisen. Köln: Dr. Otto Schmidt.
Bratschitsch, R. (1981). Unternehmenskrisen - Ursachen, Frühwarnung, Bewältigung.
Stuttgart: Poeschel.
Breitkreuz, G., & Lange, B. (2011). Controlling - Kompakt. Aacheen: Shaker.

274
Bretz, A., & Kobuss, J. (2012). Erfolgreich als Designer - Designbusiness gründen und
entwickeln. Basel: De Gruyter.
Brockhoff, K. (1999). Forschung und Entwicklung: Planung und Kontrolle. München:
Oldenburg.
Brüggemann, H., & Bremer, P. (2012). Grundlagen Qualitätsmanagement. Wiesbaden:
Springer .
Bruhn, M. (2011). Qualitätsmanagement für Dienstleistungen. Heidelberg: Springer.
Brühwiler, B. (2001). Unternehmensweites Risk Management als Frühwarnsystem.
Bern: Haupt.
Brühwiler, B. (2003). Risk Management als Führungsaufgabe. Bern: Haupt.
Brymann, A., & Bell, E. (2003). Business Research Methods. New York: Oxford
University Press.
Businessdictionary. (2015, 12 26). Business dictionary. Retrieved from
www.businessdictionary.com/definition/discontinuity.html
Commission. (2017, 01 22). Europäische Kommission. Retrieved from
eu.europa.eu/growth/smes/buusiness-friendly-environment/sme-definition_de
COSO. (2014, 11). COSO Committee of sponsoring organizations of the treadway
commission. Retrieved from https://www.coso.org/Pages/default.aspx
Cremer, C. (1980). Transparenz wissenschaftlicher Prozesse durch Aktionsforschung?
Frankfurt: Lang.
Creswell, J. (2009). Research Design. California: Sage.
Crone, A., & Werner, H. (2012). Modernes Sanierungsmanagement. München: Vahlen.
Crönetz, O., Kögler, P., & Zimmert, O. (2009). Früherkennung von Erfolgsfaktoren.
Sternenfels: Wissenschaft & Praxis.
Dahm, M., & Heindl, C. (2011). Lean Management und Six Sigma. Berlin: Erich Schmidt.
Davies, M. (2007). Doing a Successful Research Project. New York: Palgrave.
Deegen, T. (2001). Centre for Sustainability Management. Von Ansatzpunkte zur
Integration von Umweltaspekten in die "Balanced Scorecard": www.uni-
lueneburg.de/csm/ abgerufen

275
Deppe, D. (1992). Dynamische Ertrags- und Finanzplanung zur Früherkennung und
Abwehr von Unternehmenskrisen in Mittelständischen Unternehmen. Köln: Josef
Eul.
Depré, P. (2011). Praxis-Handbuch Compliance. Regensburg: Walhalla.
DIN. (1997). DIN EN ISO 9000 ff/ÖNORM EN ISO 9000 ff/SN EN ISO 900 ff für kleine
und mittelständische Unternehmen (KMU). Berlin: Beuth.
DIN. (2015). DIN EN ISO 9001. Berlin: Beuth.
Donnelly, C., Simmons, G., Armstrong, G., & Fearne, A. (2012, 09). The Role of AR in
the Study of Small Business Marketing and Retailer Loyalty Card Data. NUI
Maynooth.
Donnersmarck, M., & Schatz, R. (1999). Frühwarnsysteme. Fribourg: InnoVatio.
Duckert, G. (2011). Practical Enterprise Risk Management. Hoboken: John Wiley &
Sons, Inc.
Eidleman, G. (1995). Z scores - A Guide to Failure Prediction. The CPA Journal, pp. 52-
53.
Ellenbürger, F., Ott, P., Frey, C., & Boetius, F. (2009). Mindestanforderungen an das
Risikomanagement (MaRisk) für Versicherungen. Stuttgart: Schäffer-Poeschel.
Elshamly, A. (2013, 06). Developing a strategic framework in SMEs. Developing a
strategic framework in SMEs. UK: University of Gloucestershire.
Enterprise Risk Management Integrated Framework. (09 2004). Von
www.coso.org/documents/coso_erm_executivesummary.pdf abgerufen
Evans, R. (2014). Quality and Performance Excellence. USA: Cengage.
Faulhaber, P., & Landwehr, N. (2006). Crisis Survival for German Mid-Caps. Frankfurt:
Campus.
Ferretti, J. (2016, 03). Liaise Kit. Retrieved from http://www.liaise-kit.eu/ia-method/cross-
impact-analysis
Fiedler, R. (2001). Einführung in das Controlling. München: Oldenbourg .
Figge, F., Hahn, T., Schaltegger, S., & Wagner, M. (2001, 04). Centre for Sustainability
Managament. Retrieved from Sustainability Balanced Scorecard: ww.uni-
lueneburg.de/csm/

276
Flick, U. (2010). An Introduction to Qualitative Research. London: Sage.
Foster, T. (2013). Managing Quality. Harlow: Pearson Education.
Frei, F. (1984). Risiken und Chancen. Bremen: Universität Bremen.
Friedag, H., & Schmidt, W. (2002). Balanced scorecard: mehr als ein Kennzahlensystem.
Freiburg: Haufe.
Frontiera, J., & Leidl, D. (2012). Team Turnarounds: A Playbook for Transforming
Underperforming Teams. Oxford: Wiley.
Fulmer, J., Moon, J., Gavin, T., & Erwin, M. (1984, 07). A bankruptcy classification model
for small firms. Journal of Commercial Bank Lending, pp. 25-37.
Gehringer, M., & Michel, W. (2000). Frühwarnsystem Balanced Scorecard. Düsseldorf:
Metropolitan.
Geissler, H. (1995). Organisationslernen und Weiterbilduung: die strategische Antwort
auf die Herausforderungen der Zukunft. Neuwied: Luchterhand.
Gerring, J. (2009). Case Study Research. New York: Cambridge University Press.
Giebel, M. (2011). Wertsteigerung durch Qualitätsmanagement: Entwicklung eines
Modells zur Beschreibung der Wirkmechanismen und eines Vorgehenskonzepts
zu dessen Eiinführung. Kassel: Kassel Univ. Press.
Gleißner, W. (2004). Future Value. Wiesbaden: Gabler.
Gleißner, W., & Meier, G. (2001). Wertorientiertes Risiko-Management für Indusrie und
Handel. Wiesbaden: Gabler.
Gomez, P., & Probst, G. (1997). Die Praxis des ganzheitlichen Problemlösens: vernetzt
denken, unternehmerisch handeln, persönlich überzeugen. Bern: Haupt.
Gopinath, C. (2005). Recognizing Decline: The Role of Triggers. Mid-American Journal
of Business, pp. 21-27.
Gosling, J., & Mintzberg, H. (2003, 11). The Five Minds of a Manager. Harvard Business
Review, pp. 54-63.
Götze, S. (1994). Die multikriterielle Entscheidungsfindung als Modell für die simultane
Produktenwicklung. Karlsruhe: Univ. Diss.
Götze, U. (1993). Szenario-Technik in der strategischen Unternehmensplanung.
Göttingen: Univ. Diss.

277
Götze, U., & Mikus, B. (2000). Zeitgerechtes Controlling. Wiesbaden: Gabler.
Hahn, D. (1979). Frühwarnsysteme, Krisenmanagement und Unternehmensplanung.
Zeitschrift für Betriebswirtschaft, pp. 25-46.
Hallbauer, M., Weltring, R., & Crezelius, S. (2015, 11). Instrument Turtle-Methode.
Retrieved from https://www.inf.uni-
hamburg.de/de/inst/ab/itmc/research/completed/promidis/instrumente/turtle-
methode
Hammer, R. (1998). Strategische Planung und Frühaufklärung. München: Oldenburg.
Hampton, J. (2009). Fundamentals of Enterprise Risk Management. New York:
Amacom.
Hauff, S. (2010). Früherkennung im Human Resouurce Management Sozio-kulturelle
Entwicklungen und die Antizipierbarkeit von Personalrisiken. Mering: Rainer
Hampp.
Hauschildt, J. (2001). Krise, Krisendiagnose und Krisenmanagement. Frankfurter
Allgemeine Zeitung, 31.
Hauschildt, J., & Leker, J. (2000). Krisendiagnose durch Bilanzanalyse. Köln: Dr. Otto
Schmidt.
Hauser, M. (1989). Früherkennung von Krisen Industrieller Unternehmungen durch
Portfolio-Analyse. Freiburg: Hochschul Verlag.
Hillebrand, W. (2005). Das Früherkennungs- und Überwachungssystem bei
Kapitalgesellschaften. Düsseldorf: IDW.
Hinsch, M. (2014). Die neue ISO 9001:2015 - Status, Neuerungen und Perspektiven.
Heidelberg: Springer.
Hohlberger, H., & Damlachi, H. (2010). Sanierung im Mittalstand. Marburg: Tectum.
Hopkin, P. (2013). Risk Management. London: Kogan Page.
Hornstein, J. (2009). Modellgestützte Optimierung des Führungsstils während eines
Turnarounds. Wiesbaden: Gabler.
Horváth, P., & Gleich, R. (2012). Controlling umsetzen. Stuttgart: Schäffer-Poeschel .
Huang, N. (2010, 06 10). What is good action research? Retrieved from
http://arj.sagepub.com

278
IfM. (2016). Institut für Mittelstandsforschung. Retrieved from www.ifm-bonn.org
Inderst, C., Bannenberg, B., & Poppe, S. (2013). Compliance. Heidelberg: C.F. Müller.
InsO. (2012). InsO InsolvenzO . München: dtv.
ISO. (2009). ISO 31000:2009. Berlin: Beuth.
Jacob, H. (1986). Früherkennung und Steuerung von Unternehmensentwicklungen.
Wiesbaden: Gabler.
Jaeger, M. (2016, 03 23). Haeger-Holland, Inc. - a Leading Provider of Management
Consulting and Educational Services. Retrieved from
www.jhoti.com/turtle_diagram.asp
Janßen, S., & Riediger, H. (2015). Praktikerhandbuch Risikoinventur. Heidelberg: Finanz
Colloquium .
Kaplan, R., & Norton, D. (1996). Balanced Scorecard. Boston: HBS Press.
Kaplan, R., & Norton, D. (2001). The Strategy-Focused Organization: How Balanced
Scorecard Companies Thrive in the New Business Environment. Boston: Harvard
Business Press.
Kästner, M. (2012). Risikomanagement im deutschen Mittelstand. Lohmar: Eul Verlag.
Kautt, G. (2013, 05). Prepare your firm for success. Financial Planning, p. 37.
Kelders, C. (1996). Unterstützung strategischer Entscheidungsprozesse. Stuttgart: M &
P.
Kirsch, W., & Trux, W. (1979). Strategische Frühaufklärung und Portfolioanalyse.
Zeitschrift für Betriebswirtschaft, pp. 47-69.
Kirschkamp, A. (2007). A Contingency-Based View of Chief Executive Officers Early
Warning Behavior. Wiesbaden: Gabler.
Klausmann, W. (1983). Entwicklung der Unternehmungsplanung. Giessen: Univ. Diss.
Kloss, U. (1984). Ein Frühwarnsysteem als Instrument zur Überwachuung der
strategischen und operativen Umsetzung und Realisierung der
Unternehmenspolitik. St. Gallen: D-Druck-Spescha.
Kock, N. (2007). Information Systems Action Research. Heidelberg: Springer.

279
Koslowski, F. (1994). Konzeption einer personalbezogenen Frühaufklärung in
Management und Controlling. Göttingen: Univ. Diss.
Kötzle, A. (1993). Die Identifikation strategisch gefährdeter Geschäftseinheiten. Berlin:
Duncker & Humblot.
Krüger, W. (1988, 01). Die Erklärung von Unternehmenserfolg: Theoretischer Ansatz
und empirische Ergebniss. Die Betriebswirtschaft, pp. 27-43.
Krystek, U. (1987). Unternehmungskrisen. Wiesbaden: Gabler.
Krystek, U. (2015, 11 15). Krisenmanagement. Retrieved from
http://wirtschaftslexikon.gabler.de/Archiv/10532/krisenmanagement-v11.html
Krystek, U., & Fiege, S. (2015, 11 22). Risikomanagement. Retrieved from
http://wirtschaftslexikon.gabler.de/Arrchiv/7669/risikomanagement-v10.html
Krystek, U., & Müller-Stewens, W. (1993). Frühaufklärung für Unternehmen. Stuttgart:
Schäffer-Poeschel.
Krystek, U., Moldehauer, R., & Angster, E. (2007). Handbuch Krisen- und
Restrukturierungsmanagement. Stuttgart: Kohlhammer.
Kumar, V. (2011). Research Methodology. London: Sage.
Kunze, C. (2000). Competitive Intelligence. Aachen: Shaker.
Küppler, H., Friedl, G., Hofmann, C., Hofmann, Y., & Pedell, B. (2013). Controlling:
Konzeption, Aufgaben, Instrumente. Stuttgart: Schäffel-Pöschel.
Kurschus, R., Cvilikas, A., & Sarapovas, T. (2015). The criteria to identify company`s
crisis in SME sector. Retrieved from Inzinerine Ekonomika-Engineering
Economics, 2015, 26(2), 152-158: http://dx.doi.org/10.5755/j01.ee.26.28779
Laue, J., & Kunz, J. (2014). Das wirksame Compliance-Management-System. Herne:
nwb.
Leker, J. (1993). Fraktionierende Frühdiagnose von Unternehmenskrisen. Köln: Dr. Otto
Schmidt.
Levy-Livermore, A. (1995). Economic Analyses of Financial Crises. Aldershoot: Avebury.
Liebl, F. (1996). Strategische Frühaufklärung: trends - issues - stakeholders. München:
Oldenburg.
Löbig, M. (2010, 01). Controlling & Management. p. 64.

280
Löhneysen, U. (1982). Die Rechtzeitige Erkennung von Unternehmungskrisen mit Hilfe
von Frühwarnsystemen. 47. Göttingen: Dissertation der Georg-August-
Universität zu Göttingen.
Löhr, B. (2010). Integriertes Risikocontrolling für Industrieunternehmen. Frankfurt: Peter
Lang.
Löw, K. (2008). Typisierung, Messung und Bewertung von Risiken im Rahmen des
Risikomanagements. Hamburg: Kovac.
Marshall, J. (2012). WMG. Retrieved from www2.warwick.ac.uk
März, T. (1983). Interdependenzen in einem Kennzahlensystem. München: VVF .
Mayer, H. (2008). Interview und schriftliche Befragung. München: Oldenbourg.
Mayer, M. (2008). Die Leistungsfähigkeit von Risikomanagementsystemen im Hinblick
auf ausgewählte Unternehmensrisiken. Berlin: TUB.
McAteer, T. (2014, 05 05). The other side of change, and what does it take to get there?
Retrieved from www.degroote.mcmaster.ca/articles/side-change-take-get/
McCabe, S. (2010). Marketing Communications in Tourism and Hospitality. London:
Routledge.
McGivern, R. (2013). The Practice of Market Research. Edinburgh: Pearson.
McNamee, S., & Hosking, D. (2013). Research and social change. London: Routledge.
McNeil, A., Frey, R., & Embrechts, P. (2015). Quantitative Risk Management. New
Jersey: Princeton University Press.
McNiff, J., & Whitehead, J. (2010). You and Your Action Research Project. New York:
Routledge.
Meier, P. (2007). Risikomanagement: Risiken beherrschen - Chancen nutzen. Berlin:
Beuth.
Miles, M., Huberman, M., & Saldana, J. (2014). Qualitative Data Analysis. Los Angeles:
Sage.
Mischon, C. (1982). Beiträge zur Mittelstandsforschung. Göttingen: Otto Schwartz & Co.
Moser, H., & Ornauer, H. (1978). Internationale Aspekte der Aktionsforschung. München:
Kösel.

281
Moser, H., & Zedler, P. (1983). Aspekte qualitativer Sozialforschung. Opladen: Leske.
Müller, D., & Müller, A. (2007). Risikosteuerung der Kreditvergabe. Hamm: Neue
Wirtschafts-Briefe.
Müller, G., & Zeiser, B. (1980). Zufallsbereiche zur Beurteilung frühaufklärender Signale.
Zeitschrift für Betriebswirtschaft, pp. 605-619.
Müller, R. (1986). Krisenmanagement in der Unternehmung. Frankfurt: Peter Lang.
Müller-Merbach, H. (1977). Frühwarnsysteme zur betrieblichen Krisenerkennung und
Modelle zur Beurteilung von Krisenabwehrmaßnahmen. In H. Plötzender,
Computergestützte unternehmensplanung (pp. 419-438). Stuttgart: Oldenbourg.
Myers, M. (2013). Qualitative Research in Business & Management. London: Sage.
Nagel, K., Faix, W., Keck, G., Sailer, J., Djalali, A., Horne, A., & Kisgen, S. (2013).
General Management Tools. Stuttgart: Steinbeis-Edition.
Nerb, M. (2001). Customer Service Management als Basis für interorganisationales
Dienstmanagement. München: Techn. Univ.
Neubauer, F., & Solomon, N. (04 1977). A managerial approach to environmental
assessment. Long Range Planning, S. 13-20.
Ng, W., & Coakes, E. (2014). Business Research. London: Kogan Page.
Nunes, P., & Breene, T. (2011, 01-02). Reinvent Your Business before It`s Too Late.
Harvard Business Review.
Nutzinger, H., & Radke, V. (1995). Das Konzept der nachhaltigen Wirtschaftsweise:
Historische, theoretische und politische Aspekte. Marburg: Metropolis.
Ohligschläger, J., & Below, F. (2015). Die ISO 9001:2015. Köln: TÜV Media.
Oxford Dictionary. (2016). Retrieved from https:/en.oxforddictionariws.com/definition/risk
Pannucci, C., & Wilkins, E. (2010, 08). Identifying and Avoiding Bias in Research. Plast
Reconstr Surg., pp. 619-625.
Pappas, C. (2016, 03 29). 5 Benefits of iterative design in eLearning. Retrieved from
http://elearningindustry.com
Pedler, M., & Abbott, C. (2013). Facilitating Action Learning. Maidenhead: McGraw-Hill.

282
Pedler, M., Burgoyne, J., & Boydell, T. (2013). A Manager's Guide to Self-development.
London: McGraw-Hill.
Petersen, B., & Nüssel, M. (2013). Qualitätsmanagement in der Agrar- und
Ernäherungswirtschaft. Düsseldorf: Symposion.
Pieper, H. (1977). Theorie, Praxis, Technik und Alltag: wissenstheoretische Grundlagen
der Aktionsforschung. Hamburg: Univ. Diss.
Pocalyko, M. (2011, 06/07). The Turnaround Director. NACD Directorship, p. 1.
Pratt, K. (2009). Design Patterns for Research Methods: Iterative Field Research.
Retrieved from http://www.citeseerx.ist.psu.edu
Price, R., Wrigley, C., Dreiling, A., & Brucolo, S. (2013). Design led innovation: Shifting
from smart follower to digital strategy leader in the Australian airport sector. IEEE
Tsinghua International Design Management Symposium: Design-Driven
Business Innovation (pp. 251-258). Brisbane: Queensland University of
Technology.
Purvinis, O., Sukys, P., & Virbickaite, R. (2005). Research of Possibility of Bankruptcy
Diagnostics Applying Neutral Network. Engineering Economics, pp. 16-22.
Pyzdek, T., & Keller, P. (2013). The Handbook for Quality Management. New York:
McGraw-Hill.
Quinlan, C. (2011). Business Research Methods. Hampshire: Cengage.
Reibnitz, U. (1992). Szenario-Technik: Instrumente für die unternehmerische und
persönliche Erfolgsplanung. Wiesbaden: Gabler.
Reimer, M., & Fiege, S. (2009). Perspektiven des Strategischen Controllings.
Wiesbaden: Gabler.
Reineke, W. (1997). Krisenmanagement. Essen: Stamm.
Reuvid, J. (2013). Managing Business Risk. London: Kogan Page.
Revans, R. (1966). The Theory of Practice in Management. London: MACDONALD.
Reynolds, M. (1998, 06). Reflection and critical reflection in management learning.
Management Learning, pp. 183-200.
Rieke, T. (2009). Prozessorientiertes Risikomanagement. Berlin: Logos.
Rieser, I. (1980). Frühwarnsysteme für die Unternehmungspraxis. München: VVF.

283
Rigg, C., & Trehan, K. (2008). Critical reflection in the workplace: is it just too difficult?
Journal of European Industrial Training, pp. 219-237.
Rocha-Lona, L., Garza-Reyes, J., & Kumar, V. (2013). Building Quality Management
Systems. Boca Raton: CRC.
Romeike, F. (2005, 04/05). Frühwarnsysteme im Unternehmen. RATINGaktuell, pp. 21-
27.
Romeike, F., & Hager, P. (2013). Erfolgsfaktor Risiko - Management 3.0. Wiesbaden:
Springer.
Ropega, J. (2011, 07 20). The Reasons and Symptoms of Failure in SME. International
Atlantic Economic Societa. Springer.
Roselieb, F. (2008). Krisenmanagement in der Praxis: von erfolgreichen
Krisenmanagern lernen. Berlin: Schmidt.
Rosner, S. (2007). Systemaufstellung als Aktionsforschung. München: Hampp.
Rossen, A. (2012). Frühindikatoren: gute Vorlaufeigenschaften. Wirtschaftsdiesnt, pp.
575-576.
Rothlauf, J. (2014). Total Quality Management in Theorie und Praxis. München: De
Gruyter.
Rothwell, W. (2010). Effective Succession Planning. NewYork: Amacom.
Röttger, U. (2005). Strategisches Issues Management. zfo - Zeitschrift Führung +
Organisation , pp. 139-146.
Ruderer, C. (2009). Unternehmensweites Risikomanagement in milchverarbeitenden
Unternehmen. Hamburg: Dr. Kovač.
Ruf, S. (2011). Konzeption eines prozessorientierten Referenzmodells für das
Risikomanagement von Multi-Kanal-Systemen. Frankfurt: Peter Lang.
Ryan, V. (2016). How iterative designing works. Retrieved from
http://www.technologystudent.com
Sambrook, S., & Stewart, J. (2000, 03). Factors influencing learning in European learning
oriented organisations. Journal of European Industrial Training, pp. 209-221.
Sandberg, B. (2012). Wissenschaftlich Arbeiten von Abbildung bis Zitat. München:
Oldenbourg.

284
Saunders, M., Lewis, P., & Thornhill, A. (2012). Research Methods for Business
Students. Edinburgh: Pearson.
Schäfer, J. (2001). Das Überwachungssystem nach § 91 Abs. 2 AktG unter
Berücksichtigung der besonderen Pflichten des Vorstandes. Lohmar: Josef Eul.
Schafer, S. (2011, Summer). Implementing a Quality Control Review Process: The Need
for Quality Control Review. The Appraisal Journal.
Schaltegger, S., & Figge , F. (2000, 03). Environmental shareholder value: economic
success with corporate environmental management. Corporate Social
Responsibility and Environmental Management, pp. 29-42.
Schaper, C. (2010). Strategisches Management in der Landwirtschaft. Göttingen:
Cuvillier.
Schelz, I., & Seidel, U. (2011). Excel-Handbuch für Controller. Münchern: Pearson.
Schlüter, C. (2004). Strategische Frühinformationssysteme für KMU. Aachen: Shaker.
Schmidt, V. (2015). Compliance-Funktion nach MaRisk. Heidelberg: FCH.
Schmitz, U. (2006). Konzeption eines wertorientierten Führungsinformationssystems:
Anforderungen, Aufbau, Instrumente und Implementierung. Chemnitz: Techn.
Univ. Diss.
Schneider, S. (1997). Interpretation in Organizations: Sensemaking and Strategy.
European Journal of Work and Organizational Psychology, pp. 93-102.
Schön, D. (1983). The Reflective Practitioner. New York: Basic Books.
Schönwald, S. (2011). Fallsammlung Körperschaftsteuer. Herne: NWB.
Schröder, R. (2005). Risikoaggregation unter Beachtung der Abhängigkeiten zwischen
Risiken. Baden-Baden: Nomos.
Schulenburg, N. (2008). Entstehung von Unternehmenskrisen. Wiesbaden: Gabler.
Schwartz, P., Mennin, S., & Webb, G. (2002). Problem-Based Learning. London: Kogan
Page.
Seghezzi, H., Fahrni, F., & Herrmann, F. (2007). Integriertes Qualitätsmanagement.
München: Carl Hanser.

285
Senghaas-Knobloch, E. (2001). Macht, Kooperation und Subjektivität in betrieblichen
Veränderungsprozessen: mit Beispielen aus Aktionsforschung und
Prozeßberatung in Klein- und Mittelbetrieben. Münster: Lit.
Sepp, H. (1996). Strategische Frühaufklärung. Wiesbaden: DUV.
Sévon, G. (1994). Action and reflection in business. Helsingfors: Svenska
Handelshögskolan.
Sonnenschein, O. (2005). Einsatzmöglichkeiten moderner Informations- und
Kommunikationstechnologien im Rahmen der strategischen Früherkennung.
Frankfurt: Lang.
Springate, G. (1978). Predicting the possibility of failure in a Canadian firm. Burnaby:
Simon Fraser University.
Stewart, J., & Rogers, P. (2012). Developing People and Organisations. London: Kogan
Page Publishers.
SWOT. (2017). SWOT-Analyse. Retrieved from swot-analyse.net
Taffler, R., & Tisshaw, H. (1977). Going, going, gone - Four factors which predict.
Accountancy, pp. 50-54.
Tatje, D. (2001). Von Streß in Organisationen zu Organisationen im Streß: ein
unternehmenskultureller Ansatz zur Erklärung von Unternehmenskrisen.
München: Hampp.
Töpfer, A. (1999). Plötzliche Unternehmenskrisen - Gefahr oder Chance? Neuwied:
Luchterhand.
Töpfer, A. (2000). Das Management der Werttreiber: Die Balanced Score Card für die
Wertorientierte Unternehemenssteuerung. Frankfurt: Frankfurter Allgemeine
Zeitung.
Tricker, R. (2014). ISO 9001:2008 for Small Businesses. New York: Routledge.
Trustorff, J. (2012). Risikoorientierte Unternehmensführung. Saarbrücken:
Akademikerverlag.
TÜV. (2013, February). Prozessanalyse anhand des Turtle-Modells. Retrieved from
http://www.tuev-sued.de/uploads/images/1362664470097634950080/28432-
broschuere-prozessanalyse-weboptimiert.pdf

286
Verschuren, P. (2003). Case study as a research strategy: some ambiguities and
opportunities. International Journal of Social Research Methodology, pp. 121-
139.
Vesper, O. (2014). Controlling in den USA: Eine konzeptionelle Analyse aus deutschr
Perspektive. Kassel: University press.
Wagner, K., & Käfer, R. (2010). PQM Prozessorientiertes Qualitäts-Management.
München: Carl Hanser.
Watton, P., Collings, J., & Moon, J. (2001, 04). Reflective Writing. Retrieved from
www.exeter.ac.uk/fch/work-experience/reflective-writing-guidance.pdf
Weber, H. (1995). Die IBM - Kultur. München: Computerwoche .
Weber, J., & Janke, R. (2013). Controlling in Zahlen. Weinheim: WILEY-VCH.
Weber, J., & Schäffer, U. (2008). Introduction to Controlling. Stuttgart: Schäffer-Pöschel.
Weber, J., & Schäffer, U. (2011). Einführung in das Controlling. Stuttgart: Schäffer-
Poeschel.
Weber, J., Vater, H., Schmidt, W., & Reinhard, H. (2011). Turnaround - Navigation in
stürmischen Zeiten: Maßnahmen zur Krisenbewältigung und Auswirkungen auf
die Rollen von CFOs und Controllern. Weinheim: Wiley-VCH.
Weick, K. (2005). Theory and Practice in the Real World. Oxford: University Press.
Weick, K., Sutcliffe, K., & Obstfeld, D. (2005). Organizing and the Process of
Sensemaking. OrganizationScience, pp. 409-421.
Welsch, C. (2010). Organisationale Trägheit und ihre Wirkung auf die strategische
Früherkennung von Unternehmenskrisen. Wiesbaden: Gabler.
Welter, J. (1979). Betriebliches Frühwanrsystem am Beispiel der Ruhrkohle AG. ZfbF, p.
117 ff.
Whitehead, J. (2009, 03 09). Generating living theory and understanding in action
research studies. Retrieved from http://arj.sgepub.com
Wiedmann, K. (1984). Frühwarnung, Früherkennung, Frühaufklärung. Mannheim:
Universität Mannheim.
Wilensky, H. (1967). Organization intelligence: Knowledge and policy in governmental
and industry. New York: Basic Books.

287
Wirtschaftslexikon. (2016, 03). Cross-Impact-Analysis. Retrieved from
http:/wittschaftslexikon.gabler.de/Definition/cross-impact-analyse.html#definition
Wolf, R. (2010). Risikoorientiertes Netzwerkcontrolling. Lohmar: EUL.
Wolf, W. (1996). Das Machiavelli-Syndrom. Wiesbaden: Gabler.
Woll, A. (2007). Vokswirtschaftslehre. München: Vahlen.
Wood, M., & Welch, C. (2010). Are 'Qualitative' and 'Quantitative' Useful Terms for
Describing Research? Portsmouth.
Yin, R. (2009). Case Study Research. California: Sage.
Yin, R. (2014). Case Study Research. California: Sage.
Zikmund, W. (2010). Business Research Methods. Canada: Cengage.

288
Annex
Interview guideline
Datum: Ort:
Unternehmung / Organisation: Gesprächsbeginn, -ende:
Gesprächspartner: Position des
Gesprächspartners:
Einführung
„Bei Unternehmenspleiten bzw. Beinahezusammenbrüchen wurden in vielen
Fällen Risiken nicht rechtzeitig erkannt oder die Frühwarnindikatoren ignoriert
oder ausgesessen. Reagiert wurde – wenn überhaupt – erst, als die Katastrophe
da war. Nur wenige Unternehmen greifen zur Einschätzung ihrer Risikolage auf
Frühwarnindikatoren zurück, obwohl Frühwarnsysteme ein unverzichtbares
Element jeder gezielten Unternehmenssteuerung sein sollten. Doch wie
funktionieren Frühwarnsysteme in der Unternehmenspraxis am effektivsten?“
(Romeike, 2005, p. 22).
Phase I
(Anforderungen an das Frühwarnsystem in der Lebensmittelindustrie)
I.1 Sind Frühwarnsysteme ein Thema in der heutigen Zeit?
I.2 Welche Anforderungen muss ein Frühwarnsystem in der
Lebensmittelindustrie erfüllen?
I.3 Welche betriebswirtschaftlichen Bereiche muss es erfassen können?
I.4 Welchen Stellenwert sollte es im Unternehmen einnehmen?
I.5 Auf welche Interessensgruppen muss es abgestimmt sein?
I.6 Gibt es für ein Frühwarnsystem eine geeignete Software?
I.7 Wer sollte die Verantwortung für die Eignung des Frühwarnsystems tragen?

289
Phase II
(CO-tools)
II.1 Sind Frühwarnsysteme ein Thema in Ihrer Praxis?
II.2 Folgende Anforderungen wurden uns an ein Frühwarnsystem durch die
Sanierungsberater für die Lebensmittelindustrie aufgelistet
(Interviewantworten v. Block I):
- FWS sollen helfen Risiken rechtzeitig zu erkennen um diesen frühzeitig
entgegensteuern zu können.
- Sollten umfassend (strategisch und operativ) und praktikabel sein� nicht zu
komplex.
- Zukunftsorientiert sein.
- Quantitative (harte) und qualitative (weiche) Faktoren berücksichtigen.
- Alle betriebswirtschaftlichen Bereiche erfassen.
- Interne und externe Faktoren berücksichtigen.
- Es muss ein Topmanagement-Informationssystem sein und von der
Geschäftsleitung überwacht werden.
- Grundsätzlich auf alle internen und externen Beteiligten mit
unterschiedlichen Reports ausgelegt sein.
- Passend zu den Unternehmenseigenschaften sein (Kultur, Struktur, Größe
und Führungsstil).
- Für die Eignung des FWS ist die Geschäftsleitung verantwortlich.
Würden Sie dem zustimmen?

290
II.3 Welche CO-tools können Sie hierzu als ‚geeignete Tools‘ abgestimmt auf
die Anforderungen empfehlen? Was sollen diese bezwecken?
II.4 Welche davon würden Sie als ‚best-practice-elements‘ einstufen?
II.5 Wie können diese in das Unternehmen integriert werden?
II.6 Gibt es hierzu eine geeignete Software?
II.7 Wer sollte die Verantwortung für die Eignung der CO-tools tragen?

291
(QM-tools)
II.8 Sind Frühwarnsysteme ein Thema in Ihrer Praxis?
II.9 Folgende Anforderungen wurden uns an ein Frühwarnsystem durch die
Sanierungsberater für die Lebensmittelindustrie aufgelistet
(Interviewantworten v. Block I):
- FWS sollen helfen Risiken rechtzeitig zu erkennen um diesen frühzeitig
entgegensteuern zu können.
- Sollten umfassend (strategisch und operativ) und praktikabel sein� nicht zu
komplex.
- Zukunftsorientiert sein.
- Quantitative (harte) und qualitative (weiche) Faktoren berücksichtigen.
- Alle betriebswirtschaftlichen Bereiche erfassen.
- Interne und externe Faktoren berücksichtigen.
- Es muss ein Topmanagement-Informationssystem sein und von der
Geschäftsleitung überwacht werden.
- Grundsätzlich auf alle internen und externen Beteiligten mit
unterschiedlichen Reports ausgelegt sein.
- Passend zu den Unternehmenseigenschaften sein (Kultur, Struktur, Größe
und Führungsstil).
- Für die Eignung des FWS ist die Geschäftsleitung verantwortlich.
Würden Sie dem zustimmen?
II.10 Welche QM-tools können Sie hierzu als ‚geeignete Tools‘ abgestimmt auf

292
die Anforderungen empfehlen? Was sollen diese bezwecken?
II.11 Welche davon würden Sie als ‚best-practice-elements‘ einstufen?
II.12 Wie können diese in das Unternehmen integriert werden?
II.13 Gibt es hierzu eine geeignete Software?
II.14 Mit der Überarbeitung der ISO 9001 kommt im Herbst eine ISO 9001:2015
Norm raus, die eine Risikoorientierung fordert – was bedeutet das für die
Unternehmen?
II.15 Wer sollte die Verantwortung für die Eignung der QM-tools tragen?

293
Phase III
(Case Study)
III.1 Gibt es in Ihrem Unternehmen ein Frühwarnsystem?
III.2 Welche ‚Tools‘ werden hierzu eingesetzt?
III.3 Wie zufrieden sind Sie mit den jetzigen Hilfsmitteln?
III.4 Welche Schnittstellen sind besonders kritisch?
III.5 Wie wird eine gesicherte und effiziente Kommunikation und Kooperation
unter den Beteiligten geschaffen? Werden dafür Werkzeuge des CO / QM
eingesetzt, die für alle verbindlich sind?
III.6 Wie wird die Holschuld einer Information zur Unternehmenssicherung
sichergestellt?
III.7 Wie wird die Bringschuld einer Information zur externen
Unternehmenssicherung sichergestellt?
An dieser Stelle wird dem Interviewpartner das entwickelte
Frühwarnsystem vorgestellt und folgende Fragen diskutiert.
III.8 Welche kritischen Anmerkungen haben Sie zum entwickelten
Frühwarnsystem?
III.9 Welche Anforderungen würden Sie an das entwickelte Frühwarnsystem
noch stellen, unter Beachtung der Anforderungen der Sanierungsberater
(siehe Block I)?
III.10 In welcher Konstellation sehen Sie dieses System am ehesten in die
Praxis umsetzbar?
III.11 Was sind messbare Risiko-Kriterien, die in dieses System integriert
werden sollten?
III.12 Welchen Mehrwert könnte man mit diesem Frühwarnsystem für das
Unternehmen erreichen?
III.13 Welchen zusätzlichen Aufwand müsste für das System durch die
Beteiligten betrieben werden?

294
III.14 Was sind Aspekte, die den Einsatz des Systems in der Praxis erschweren
würden?
III.15 Kann Ihrer Meinung nach mit diesem System die Existenzsicherung des
Unternehmens erhöht werden?