National High School Center Early Warning System … betterhighschools.org i ntroduction The Early...
43
betterhighschools.org National High School Center Early Warning System Tool v2.0 Technical Manual February 2011
Transcript of National High School Center Early Warning System … betterhighschools.org i ntroduction The Early...

betterhighschools.org
National High School Center Early Warning System Tool v2.0Technical Manual
February 2011

ii
A b o u t t h e t o o l A n d t e c h n i c A l M A n u A l
The Early Warning System (EWS) Tool v2.0 and Technical Manual are offered by the National High School Center, a central source of information and expertise on high school improvement issues that does not endorse any interventions or conduct field studies. Funded by the U.S. Department of Education, the National High School Center serves the Regional Comprehensive Centers in their work to build the capacity of states across the nation to effectively implement the goals of the Elementary and Secondary Education Act relating to high schools.
The National High School Center is housed at the American Institutes for Research (AIR). The contents of this tool and guide were developed under a grant from the U.S. Department of Education. However, these contents do not necessarily represent the policy of the U.S. Department of Education, and you should not assume endorsement by the federal government.
PR/Award # S283B050028 Funding Agency: U.S. Department of Education
This tool was developed in collaboration with Matrix Knowledge Group. Matrix helps their clients collect, analyze, and report data to improve organizational performance. For more information about Matrix, visit their website at www.matrixknowledge.com.
d i s c l A i M e r
The National High School Center at the American Institutes for Research, along with the software developer, Matrix Knowledge Group, have taken reasonable professional care in the preparation of the EWS Tool v2.0 and related documentation. Although the National High School Center has made reasonable efforts to develop a tool that provides educators with a means to identify students who are at risk for dropping out, we can neither guarantee absolute accuracy of analysis or predictive power of the identification, nor accept responsibility for recommendations that are made on the basis of the outputs. The National High School Center offers this tool with the expectation that all users will adhere to federal, state, and local regulations regarding data privacy. The National High School Center cannot be held liable for misuse of student-level data or the tool itself by users.
betterhighschools.org

iii
betterhighschools.org
c o n t e n t s
Introduction ...................................................................................................................................................................................... 1The High School Dropout Problem and Early Warning Systems ................................................................................................ 1The National High School Center Early Warning System Tool ................................................................................................... 1
Getting Started .................................................................................................................................................................................. 2Opening the Tool ....................................................................................................................................................................... 2
Excel 2010 ........................................................................................................................................................................... 2Excel 2007 ........................................................................................................................................................................... 3Pre-2007 Versions of Excel................................................................................................................................................... 3
Saving the Tool ........................................................................................................................................................................... 4Tool Organization and Navigation .................................................................................................................................................... 5
More Info Buttons ...................................................................................................................................................................... 5Main Menu ................................................................................................................................................................................ 5
Tool Setup Pages ............................................................................................................................................................................... 6School Information .................................................................................................................................................................... 6Tool Settings .............................................................................................................................................................................. 7
Risk Indicator Thresholds .................................................................................................................................................... 8Intervention Settings ................................................................................................................................................................ 10
Data Input Pages ............................................................................................................................................................................. 11Student Information ................................................................................................................................................................. 11Updating Student Information Data During the School Year ................................................................................................... 13Student Pre-High School Risk Status ........................................................................................................................................ 14Student Performance ............................................................................................................................................................... 15
Outputs and Reports Pages ............................................................................................................................................................. 17Student Risk Status .................................................................................................................................................................. 17Assigning Interventions to Students .......................................................................................................................................... 18Reports Control Panel .............................................................................................................................................................. 20
Reports ............................................................................................................................................................................................ 21School-Level Reports ................................................................................................................................................................ 21Student-Level Reports .............................................................................................................................................................. 23
Predefined Student-Level Reports ...................................................................................................................................... 23Custom Student-Level Reports .......................................................................................................................................... 25
Detailed Student Report ........................................................................................................................................................... 26Student-Level Intervention Summary Report ........................................................................................................................... 26
Importing Data ............................................................................................................................................................................... 28Exporting Data ............................................................................................................................................................................... 29Printing Reports .............................................................................................................................................................................. 30Endnotes ......................................................................................................................................................................................... 31References ....................................................................................................................................................................................... 32Appendices ....................................................................................................................................................................................A–1
Appendix 1—Import Data Templates .....................................................................................................................................A–2Appendix 2—Backing Up Data ..............................................................................................................................................A–5Appendix 3—Custom Report Field Definitions......................................................................................................................A–6

c o n t e n t s
Introduction ...................................................................................................................................................................................... 1The High School Dropout Problem and Early Warning Systems ................................................................................................ 1The National High School Center Early Warning System Tool ................................................................................................... 1
Getting Started .................................................................................................................................................................................. 2Opening the Tool ....................................................................................................................................................................... 2
Excel 2010 ........................................................................................................................................................................... 2Excel 2007 ........................................................................................................................................................................... 3Pre-2007 Versions of Excel................................................................................................................................................... 3
Saving the Tool ........................................................................................................................................................................... 4Tool Organization and Navigation ................................................................................................................................................... 5
More Info Buttons ...................................................................................................................................................................... 5Main Menu ................................................................................................................................................................................ 5
Tool Setup Pages ............................................................................................................................................................................... 6School Information .................................................................................................................................................................... 6Tool Settings .............................................................................................................................................................................. 7
Risk Indicator Thresholds .................................................................................................................................................... 8Intervention Settings ................................................................................................................................................................ 10
Data Input Pages ............................................................................................................................................................................. 11Student Information ................................................................................................................................................................. 11Updating Student Information Data During the School Year ................................................................................................... 13Student Pre-High School Risk Status ........................................................................................................................................ 14Student Performance ............................................................................................................................................................... 15
Outputs and Reports Pages ............................................................................................................................................................. 17Student Risk Status .................................................................................................................................................................. 17Assigning Interventions to Students .......................................................................................................................................... 18Reports Control Panel .............................................................................................................................................................. 20
Reports ............................................................................................................................................................................................ 21School-Level Reports ................................................................................................................................................................ 21Student-Level Reports .............................................................................................................................................................. 23
Predefined Student-Level Reports ...................................................................................................................................... 23Custom Student-Level Reports .......................................................................................................................................... 25
Detailed Student Report ........................................................................................................................................................... 26Student-Level Intervention Summary Report ........................................................................................................................... 26
Importing Data ............................................................................................................................................................................... 28Exporting Data ......................................................................................................................................................................... 29
Printing Reports .............................................................................................................................................................................. 29Endnotes ........................................................................................................................................................................................... 1References ......................................................................................................................................................................................A-2Appendices .....................................................................................................................................................................................A-3
Appendix 1—Import Data Templates ......................................................................................................................................A-4Appendix 2—Backing Up Data ...............................................................................................................................................A-7

1
betterhighschools.org
i n t r o d u c t i o n
The Early Warning System (EWS) Tool v2.0 is a Microsoft Excel-based tool developed by the National High School Center at the American Institutes for Research in collaboration with Matrix Knowledge Group. The tool enables schools, districts, and states to identify students who may be at risk of dropping out of high school and to monitor these students’ responses to interventions. The intended purpose is to support students with an increased risk of disengagement, in order to get them back on track for graduation. The high school dropout Problem and early Warning systems
The high school dropout problem has been called a national crisis. According to the National Center for Education Statistics, only 74.9% of public high school students graduate with a diploma.1 Both historically and currently, the problem is particularly severe among students of color, English language learners (ELLs), disadvantaged students, and students with disabilities.2
States, districts, and schools are increasingly interested in using early warning systems to identify students who are at risk of dropping out of high school. Informed by current research on the academic and behavioral predictors of dropping out,3 such early warning systems are a promising approach—or may even be a necessary prerequisite—to effective dropout prevention.4 The intent of an early warning system is to use readily available data to systematically identify students who are at risk for dropping out of high school. Identified students can then be matched with interventions to help them get on track for graduation.5
The identification of students at risk for dropping out of high school is based on solid research. Long-term studies in large urban school districts, including Chicago and Philadelphia, provide information about powerful indicators that can predict, by the end of the first year of high school and even during the first semester, whether students will complete high school.6 In particular, research by the Consortium on Chicago School Research (CCSR) demonstrates that the most powerful indicators in high school are related to engagement (i.e., attendance) and course performance (i.e., course failures, grade point average [GPA], and credit accumulation).
Subsequent research has confirmed that these indicators are equally predictive of graduation outcomes for students with disabilities.7 Although additional research has not been conducted with other student groups (e.g., English language learners, disadvantaged students), the foundational research included students in all these groups, suggesting that the indicators are appropriate for use with diverse populations. The national high school center early Warning system tool
In 2008, the National High School Center developed a simple, Excel-based Early Warning System (EWS) Tool, which we now refer to as the EWS Tool v1.0. This tool allowed high school administrators and teachers to keep track of students in their first year of high school by entering data on absences, course failures, grade point averages, and credit attainment, by semester, into the tool. The EWS Tool v1.0 was programmed to automatically calculate indicators of risk (‘flags’) using a set of thresholds or benchmarks for each indicator that was based on the research described above. If, at any point, a student’s performance fell below a given threshold, the student would be flagged as being at risk of dropping out. Administrators and teachers could use the information about flagged students to direct supports and resources to keep students in school and on track for graduation. Table 1 summarizes the indicators and thresholds used in the EWS Tool v1.0.
Based on years of work with states, districts, and high schools, the National High School Center has developed a new version of the tool—the EWS Tool v2.0. Still using the Microsoft Excel operating platform and the same indicators of risk as the EWS Tool v1.0, the EWS Tool v2.0 has enhanced functionality and features. Some of the new features include the capability to do the following:

2
betterhighschools.org
• Import and/or enter student demographic and performance data
• Include a locally defined pre-high school indicator that is based on students’ performance data in middle grades
• House an inventory of dropout prevention (and related) interventions available to students
• Assign students to intervention programs and monitor student response to and progress in the interventions
• Create multiple graphical and tabular reporting options that allow users to quickly access school-level summary reports, detailed student-level reports, and individual student reports
• Use preset or customized reporting features
This technical manual provides basic information about how to use the EWS Tool v2.0. For additional information on implementing an early warning system or about using the EWS Tool v2.0, please see the National High School Center’s Early Warning System (EWS) Implementation Guide.8
G e t t i n G s t A r t e d
The EWS Tool v2.0 can be downloaded at no cost from the National High School Center Web site (www.betterhighschools.org/ews.asp). To use the tool, you will need a PC computer with Microsoft Excel version 2003 or later, or a Mac computer with either Excel 11.0 (part of Office 2004) or Excel 14.0 (part of Office 2011).
NOTE The EWS Tool v2.0 cannot be run on Mac computers using Excel 12.0 (part of Office 2008), as this version does not support Visual Basic for Applications (VBA) macros.
opening the tool
To open the tool, double click the file icon or name where it is saved. Alternatively, you can open the file within Excel by clicking ‘Open’ on the ‘File’ tab. After locating the file, click the ‘Open’ button.
The EWS Tool v2.0 uses macros to automate tasks that expand the functionality and make the tool easy to navigate. To use all the features, you must enable macros immediately after opening the excel file. Depending on your version of Excel, different messages will remind you to enable macros.
Excel 2010
In Excel version 2010, you may see a security warning telling you that macros have been disabled. By clicking ‘Enable Content,’ you will allow the macros to be used (see Exhibit 1).
Table 1: Indicators and Thresholds Used in the EWS Tool v1.0 and v2.0
Indicator Time Frame Benchmark (flag)Attendance First 20 or 30 days, each grading
period, end of year (annual)Missed 10% or more of instructional time
Course failures Each grading period, end of year (annual)
Failed one or more semester courses (any subject)
Grade point average
Each grading period, end of year (annual)
Earned 2.0 or lower (on a 4-point scale)
CCSR ‘on track’ indicator
End of year (annual) Failed two or more semester core courses, or accumulated fewer credits than the number required for promotion to the next grade

3
betterhighschools.org
Excel 2007
In Excel version 2007, you will see the warning shown in Exhibit 2 if you try to click on a button before enabling macros. To enable macros, click ‘Options...’ at the top of your screen, as shown in Exhibit 3. Then select ‘Enable this content’ as shown in Exhibit 4 before clicking ‘OK.’
Pre-2007 Versions of Excel
In older versions of Excel, the warning will be similar to that in Exhibit 2, and is shown in Exhibit 5.
Exhibit 4: Macro Security Options in Excel 2007
Exhibit 2: First Macro Warning in Excel 2007
Exhibit 3: Second Macro Warning in Excel 2007
Exhibit 5: Macro Warning in Pre-2007 Excel
Exhibit 1: Macro Warning in Excel 2010

4
betterhighschools.org
Exhibit 6: Saving the EWS Tool v2.0
saving the tool
The EWS Tool v2.0 must be saved as an Excel Macro-Enabled Workbook. To do this, click ‘Save As’ under the ‘File’ tab. In the dialog box, specify a unique name in the ‘File name:’ field. In the ‘Save as type:’ field, select ‘excel Macro-enabled Workbook (*.xlsm)’ from the drop-down menu (see Exhibit 6).
CAUTION If you save your workbook in a file format other than an Excel Macro-Enabled Workbook, many of the features of the EWS Tool v2.0 will not be retained.

5
betterhighschools.org
t o o l o r G A n i z A t i o n A n d n A v i G A t i o n
The EWS Tool v2.0 includes different pages that are organized into sections. Each page has a help or ‘More Info’ button. The tool is designed to be easily navigable through the Main Menu.
More info buttons
On each page of the EWS Tool v2.0, including the Main Menu, you will see one or more ‘More Info’ buttons. Clicking it opens a box that contains information about the features of the page. To close the box, simply click the ‘More Info’ button again. If the box covers the ‘More Info’ button, click on the box to select it and push ‘Delete’ on your keyboard.
Main Menu
The EWS Tool v2.0 includes multiple pages that are navigable via buttons. The Main Menu, shown in Exhibit 7, has a series of buttons divided into three categories.
tool setup buttons access three pages: (1) School Information includes fields that capture school details (name, address) and information about members of the school’s EWS team; (2) Tool Settings allows you to customize the tool to fit the school context; and (3) Intervention Settings houses a list of dropout prevention (and related) intervention programs available in the school or district.
data inputs buttons access three pages that allow you to import or enter student-level information: (1) Student Information includes names, IDs, demographics, enrollment status, and other information; (2) Student Pre-High School Risk Status holds information about pre-high school performance (if available); and (3) Student Performance houses information about high school attendance and academic performance during each grading period of the academic year.
outputs & reports buttons also access three pages: (1) Student Risk Status provides a list of all students and whether they have been identified as being at risk for dropping out, for each indicator; (2) Assign Intervention to Student enables you to document the assignment of students to intervention programs and to track their progress in those interventions; and (3) Reports Control Panel provides multiple reporting features to allow you to produce a number of different school- and student-level reports.
Exhibit 7: Main Menu

6
betterhighschools.org
You will navigate the EWS Tool v2.0 by clicking buttons from the Main Menu. Every page in the tool also has a button that will take you back to the Main Menu. For example, the School Information page (see Exhibit 8) links to the Tool Settings page via the arrow-shaped button on the top of the page. Also, many pages have direct access to related pages. Each page in the tool has unique features that, when sequentially followed, enable you to systematically identify students who are at risk of dropping out, assign available intervention programs, and monitor students’ responses to interventions, in efforts to improve the likelihood that at risk students will graduate high school.
The following sections are organized by the three categories in the Main Menu: Tool Setup, Data Inputs, and Outputs and Reports.
t o o l s e t u P P A G e s
The Tool Setup pages are designed to be completed before other data are entered into the tool and include the following:
1. School Information
2. Tool Settings
3. Intervention Settings
school information
The School Information page (see Exhibit 8) allows you to enter school information (e.g., school name, address, phone/fax numbers, Web site) and contact information for individuals who work on the school-based early warning system team.
The School Information page also allows you to upload a logo. The tool’s reports will then show your logo at the top right of each page when printed. To upload a logo, click the ‘Upload School/District Logo’ button. After clicking the button, simply locate the file (e.g., a picture file such as .gif or .jpeg) you want to insert and click ‘Select.’ It may take a few minutes to upload the logo image. Once uploaded, the logo will not be seen on this page, but it will appear on all printed reports (see Printing Reports). To preview the logo on a report, open a ‘Print Preview’ of any of the reports in the tool.
Exhibit 8: School Information Page

7
betterhighschools.org
The School Information page also has room to identify EWS team members at the school. The lead member of the team can be entered into the first row of the table. The EWS Implementation Guide describes establishing an EWS team as a key step in an effective dropout prevention strategy.
tool settings
To customize the tool settings and functions to match the local context, you can set the following options on this page:
• Grading periods (GPs): Indicate the number of grading periods (e.g., quarter, trimester, semester) used. Enter the total number of days in each grading period and the start and end dates in mm/dd/yyyy format for each grading period. note: the accuracy of these data is critical to the proper operation of the tool, especially for the calculation of student attendance indicators.
• GPA scale: Enter the maximum attainable grade point average (GPA) for the majority of students in the school. For example, if your school operates on a 4.0 scale except for designated courses such as honors or advanced placement that are weighted more heavily on a 5.0 scale, use the typical maximum attainable GPA of 4.0 instead of 5.0.
• number of credits to graduate: Enter the total number of credits required for a student to graduate from high school. • disability, race/ethnicity, disadvantaged, and ell status: These fields are automatically populated with default
settings, but they may be changed to match the school’s own categories in each of these areas. That is, the categories shown on the Tool Settings page should match the demographic categories in your own data system (from which you might import student-level demographic information). Once set, these classifications shown in Tool Settings become the options available in the drop-down menus in the corresponding fields (disabilities, race/ethnicities, ELL status, disadvantaged status) on the Student Information page.
CAUTION
Only identify students identified as “Yes” or some other designation (e.g., disability categories) in the disability, race/ethnicity, ELL, and disadvantaged fields. A “No” category designation is not necessary. It is important not to add “No” as a category designation option to the disability, race/ethnicity, ELL, and disadvantaged status fields. The EWS Tool v2.0 assumes that a student with no data in these fields on the Student Information page represents the absence of the characteristic (e.g., not ELL or not disadvantaged).
• initial attendance time period: From the pull-down menu, select either a 20-day or 30-day initial time period to first enter and report on initial student attendance data. The first 20- or 30-day attendance indicator allows you to gauge initial student risk status very early in the academic year. Users can determine whether the first 20 or 30 days are more appropriate and convenient to use. Many schools do an official “20 day count,” while other schools find they have more reliable attendance data after 30 days of school.

8
betterhighschools.org
These settings, as they are displayed on the Tool Settings page, are shown in Exhibit 9.
Risk Indicator Thresholds
The Tool Settings page also shows the ‘Risk Indicator Thresholds.’ The tool uses data on student absences and course performance and flags students as at risk if they exceed the indicator threshold on any one or more of the indicators. The tool includes default risk indicator thresholds that are automatically populated, but it also gives you the option to customize thresholds, when appropriate.
Exhibit 9: Tool Settings

9
betterhighschools.org
Default Thresholds
The tool assesses student risk status by using a variety of research-based indicators applied at various times throughout the school year:
1. Absences for the first 20 or 30 days of school.
2. Absences and course performance after each grading period.
3. End-of-year status on an annual indicator defined by the CCSR as the ‘On-Track Indicator.’ 9 The CCSR indicator is based on a combination of information about core course performance and credit accrual. In the EWS Tool v2.0, this indicator is called the ‘ccsr end of Year indicator’ and students are flagged on it if they either
• fail two or more semester-long core academic courses (or three trimester-long core courses, or four quarter-long core courses), OR
• fail to earn enough credits for promotion to the next grade.
The benchmarks used in the National High School Center’s EWS Tool v1.0 and v2.0 were noted in the Introduction. Table 2 provides details about the EWS Tool v2.0 risk indicators and default thresholds for schools with grading periods by semester, trimester, and quarter.
Table 2: Summary of Default Risk Indicators and Thresholds for Semester-Based, Trimester-Based, and Quarter-Based Schedules
Indicators Semesters Trimesters QuartersFirst 20/30-day absence rate
Missing 10% or more of instructional timeGrading period absence rate
Annual absence rate
Number of course fails (per grading period) 1 or more per grading period
Number of course fails (annual) 1 or more 1 or more 2 or moreGPA Less than half of the maximum attainable GPA*
For Calculation of the CCSR End of Year Indicator:
Number of core course fails (annual) 2 or more 3 or more 4 or more
Number of credits earned (annual) Less than 1/4 of the total number of credits required for graduation, minus 1**
* The GPA threshold is based on the information entered in the ‘GPA scale’ field on the Tool Settings page. Until the GPA scale is filled in, the GPA threshold will appear as 0.00.
** The number of core course fails (annual) threshold is based on the information entered in the ‘Number of credits to graduate’ field on the Tool Settings page. Until the number of credits to graduate is filled in, the number of core course fails (annual) threshold will appear as -1.
Exhibit 9, on the previous page, shows the Risk Indicator Thresholds on the Tool Settings page (see top right). These risk indicator settings are the automatic defaults for a school with four grading periods (quarters), a 20-day initial attendance time period, and 24 credits required for graduation.

10
betterhighschools.org
Exhibit 10 shows the Risk Indicator Thresholds on the Tool Settings page as they are displayed before the required School Information is provided. Customizing the Risk Indicator Thresholds
You are encouraged to use the default risk indicator thresholds because they are based on sound research. However, over time, some schools and districts may find that the default settings tend to over- or under-identify their students who are most at risk of dropping out of high school. Schools and districts should look at these data over time to determine whether any of the risk indicator thresholds should be adjusted. (Also see the EWS Implementation Guide for more information.) To change the risk indicator thresholds, simply type the preferred thresholds into the ‘Custom’ column and the new thresholds will automatically overwrite the default thresholds.
You are not encouraged to change the default settings on which the CCSR End of Year Indicator is calculated. However, if this automatic calculation of graduation credits produces a default that is different from the number of credits required for promotion to the next grade, simply enter the number of credits required for promotion in the row for ‘# credits earned (annual)’ in the ‘Custom’ column. intervention settings
The Intervention Settings page (see Exhibit 11) allows you to catalog up to 30 different dropout prevention (or related) interventions that are available to students. You can import or enter each unique intervention name for each program that will be included in the tool. In addition, you can identify interventions by type (attendance, behavior or academic) and tier (I, II, or III).10
Exhibit 11: Intervention Settings Page With Sample Interventions
Exhibit 10: Risk Indicator Thresholds on the Tool Settings Page Before Required School Information Is Entered

11
betterhighschools.org
Categorizing interventions by type and tier is not required for the tool to work, but when they are used, you will be able to access additional school- and student-level intervention reports. You can also include a description for each intervention. The intervention description is not required, but it may be beneficial for the implementation process. Intervention names must be listed on this page in order to assign interventions to students in the tool on the Student Interventions page.
Intervention settings may be imported using the ‘Import Data’ button. To import data from a data file, click the ‘Import Data’ button and make sure that the settings are appropriate in the Data Import dialog box (for more information, see the Importing Data section). Further details about importing and backing up data can be found in the Appendix 1—Import Data Templates section.
d A t A i n P u t PA G e s
The Data Inputs pages include three types of data:
1. Student Information
2. Student Pre-High School Risk Status
3. Student Performance
student information
The Student Information page houses name, ID number, demographic information, enrollment status, and family contact information for each student in the school (or each student in a single grade level in the school). Each row represents a single student. A unique student ID (containing onlY numeric values) and the enrollment status field must be entered for each student for the tool to work. Although other fields are not required, entering additional information will give you additional reporting options. A screen shot of the Student Information page is shown in Exhibit 12.
Use the ‘View’ drop-down menu on the top left of this page to display all the student information or only the information related to demographics, enrollment status, or contact information.
You can enter student information manually or import it from a tab delimited file or a comma-separated value file. To enter students and student data manually, simply type in the student data in the appropriate column under the last student listed. do not skip or delete rows when entering data, as these actions can cause problems in the tool. The options for the race/
Exhibit 12: Student Information Page With Sample Data

12
betterhighschools.org
ethnicity, disability, disadvantaged, and ELL status fields are available in pull-down menus derived from the categories entered on the Tool Settings page. As a reminder, for students without these characteristics (e.g., are not ELL), do not enter data—just leave the cell blank.
To import student information data from a data file, click the ‘Import Data’ button and make sure that the settings are appropriate in the ‘Data Import’ dialog box (for more information, see the Importing Data section). When you import student data, the student demographic information in the data file that is uploaded must match the demographic designation options entered in the Tool Settings page for the tool to recognize the data. (See Appendix 1—Import Data Templates for the definition of the required data format and structure when importing from an external file.)
CAUTION When entering data into the tool, do NOT skip or delete rows, as this may cause problems in the tool.
NOTEThe Student Information page should include demographic data for race/ethnicity, disability, disadvantaged, and ELL statuses that match the categories entered on the Tool Settings page. For students without these characteristics (e.g., are not ELL), simply leave the cell blank.
Student data are generally entered or imported at the beginning of the school year and must be updated throughout the year (see Updating Student Information Data During the School Year). For example, a student may transfer out or another may transfer into the school during the middle of the school year. The ‘Enrollment Status’ field helps schools track this information.
In the ‘Enrollment Status’ field on the Student Information page, you must define students as enrolled, transferred out, transferred in, graduated, or dropped out in order for students to be counted by the tool. Enrollment status and the related fields on the Student Information page are shown in Exhibit 13.
Exhibit 13: Student Information: Enrollment Status With Sample Data

13
betterhighschools.org
• enrolled: Students who are enrolled at the beginning of the year must be identified as ‘enrolled.’ For enrolled students, the ‘Date of Status Change’ and the number of days enrolled for each grading period fields next to ‘Date of Status Change’ can be left blank.
• transferred out, transferred in, dropped out, or Graduated: Changes in student enrollment status can be either imported or manually entered in the EWS Tool v2.0. For these students, enter the date of the status change and the number of days the student was enrolled for each grading period. Note that students who transfer in should be identified as ‘Transferred In’ and not as ‘Enrolled.’
− date of status change—For students who drop out, transfer out, or graduate, enter the date that the students left the school. For students who transfer in, enter the date that the students enrolled in the school.
− days for each grading period—For the tool to calculate accurate attendance rates for students who are enrolled for only part of the school year, manually enter the number of days per grading period that the student was enrolled. Be sure to enter data for each grading period, including when the student was not enrolled (0 days), was enrolled for part of the grading period (number of days enrolled during that grading period), and was enrolled for a whole grading period (this number should match the total number of grading period days entered on the Tool Setting page for that grading period).
Use the ‘View’ drop-down menu on the top left of this page to display all the student information or only the information related to demographics, contact information, or enrollment status.
NOTE
Students noted as dropped out, transferred out, or graduated in the enrollment status column on the Student Information page will have their row of data grayed-out on the Student Performance page to show that they may not have data to enter. They will also be grayed-out on the Student Risk Status page and in student-level reports.
CAUTIONIf enrollment status, date of status change, and days enrolled during each grading period are not accurately entered for part-year students (i.e., those who have transferred in or out, dropped out, or graduated), the reports may include miscalculations.
HINTDays enrolled need to be manually entered on the Student Information page only for these part-year students. Students whose enrollment status is ‘Enrolled’ for the full year are assumed by the tool to be in the school for the total number of days per grading period set in the Tool Settings page.
updating student information data during the school Year
Whenever you need to update the student information data during the school year, you should always export and save the Student Information data prior to uploading a new Student Information data file. This will allow you to update the data in the exported data file, and does not require you to create an entirely new data file each time you are updating data. To export student information data into a data file, click the ‘Export Data’ button and make sure that the settings are appropriate in the ‘Export Data’ dialog box (for more information, see the Exporting Data section).
Student identifier data (name and ID) are automatically populated on the Pre-High School, Student Performance, and Student Interventions pages based on the order they appear on the Student Information page. If you change the order of students on the Student Information page during the course of the year (i.e., if you maintain your data files in alphabetical order and a new student transfers in with a last name that begins with M, so that student now appears in the middle of the previous dataset), the student identifier data will automatically update on these other pages, and the existing student performance (including

14
betterhighschools.org
pre-high school data) and intervention data may no longer align (by row) to the appropriate students. You must re-import all of the student performance (including pre-high school data) and student interventions data on each of these pages so that the tool can re-match the data to the appropriate student IDs and re-order it to appear in the correct rows.
Therefore, if the student information data are updated during the school year and the order in which the students appear is changed, you will need to re-import all student Pre-high school data, student Performance data (for the current and previous grading periods), and student interventions data.
For information about backing up data in the tool, see Appendix 2—Backing Up Data, and for more information about updating the student information throughout the school year, please see the Importing Data section.
NOTE
Whenever you need to update the student information data, export and save the Student Information data currently in the tool, update the information in the exported data file, and then import the updated file. For information about backing up data in the tool, see Appendix 2—Backing Up Data, and for more information about updating the student information throughout the school year, please see the Importing Data section.
NOTE
If the Student Information data are updated so that the order (rows) in which the students appear is changed, you will also need to re-import the Student Pre-High School Risk data, Student Performance data for all grading periods, and the Student Interventions data to ensure that the data on these pages are re-matched to the appropriate students.
student Pre-high school risk status
The Student Pre-High School Risk Status page (Exhibit 14) allows you to record in the tool the pre-high school risk status information for each incoming student. Student names and IDs are automatically populated (drawing from the Student Information page), followed by a column labeled ‘Flag for Pre-HS Indicator of Risk’ and four other customizable fields. (Information that is in light gray throughout the tool are data that come from other pages within the tool.) The data in the ‘Flag for Pre-HS Indicator of Risk’ column indicate whether students were identified before entering high school as being at risk for dropping out. This indicator is identified as simply ‘Yes’ (for at risk) or ‘No’ (for not at risk). As with the Student Information
Exhibit 14: Student Pre-High School Risk Status Page With Sample Data

15
betterhighschools.org
page, you can enter these data manually or click the ‘Import Data’ button and make sure that the settings are appropriate in the ‘Import Data’ dialog box (for more information, see the Importing Data section). (See also Appendix 1—Import Data Templates for definition of the required data format and structure when importing from an external file.)When entering or importing student pre-high school risk status data after the start of the year, be sure to enter any new students who have recently transferred into the school into the Student Information page first. Student pre-high school risk status data cannot be entered or imported until the new students’ IDs are included on the Student Information page. Not every student will have student pre-high school risk status information available, and populating this page and these fields is optional. Omitting pre-high school data for any or all students will not affect the tool’s ability to identify students at risk for dropping out of high school, but when these data are included in the tool, additional information will be available in the tool’s reports. You are free to use the ‘Other’ fields on the Student Pre-High School Risk Status page as you wish. These fields may be used to store any additional information available from students’ pre-high school records. These fields are for informational purposes only and are not included in any data analysis or reports in the tool. For example, you may want to have a field to store the name of the school that the student came from. You can rename these field headings manually by double clicking the cell and then typing the new heading.
NOTE Student Information must be entered into the tool prior to entering or importing Student Pre-High School Risk Status data.
NOTE
The Student Pre-High School Risk Status page should include data formatted as simply ‘Yes’ (for at risk) or ‘No’ (for not at risk) for each student. If information is missing, leave the cell blank. Note that this differs from the format for student demographic characteristics on the Student Information page (where ‘No,’ or the absence of a characteristic, is indicated by a blank cell).
HINT
Save the Student Pre-High School Risk Status data source file once you have uploaded the data as a backup so that if the student information data are updated during the course of the school year, you will be able to quickly re-import the pre-high school risk status data. For information about backing up data in the tool, see Appendix 2—Backing Up Data, and for more information about updating the student information throughout the school year, please see the Importing Data section.
student Performance
The Student Performance page allows you to record student attendance and course performance data that the tool will use to calculate students’ risk status. Student names and IDs are automatically populated from the Student Information page, and the pre-high school risk indicator is automatically populated from the Student Pre-High School Risk Status page. (Information that is in light gray in throughout the tool are data that come from other pages within the tool.) Student performance data should be entered or imported at intervals throughout the school year, starting as early as the first 20 or 30 days, depending on the initial attendance time period set on the Tool Settings page, and after each grading period. If manually entering data in the tool, be sure to type directly into the tool rather than copying and pasting data in from an external source. Copying and pasting directly into the tool can overwrite formulas and affect the tool’s functionality. If you would like to copy and paste data from an external source, do so into a source file that can be imported into the tool. (See Appendix 1—Import Data Templates for definitions of the required data format and structure when importing from an external file.) Table 3 provides a summary of the student performance data to be entered or imported. Exhibit 15 shows the Student Performance page as it appears in the tool. The ‘View’ drop-down box at the top allows you to view data for a specific grading period.

16
betterhighschools.org
Table 3: Student Performance Data To Be Entered on the Student Performance PageStudent Performance Data DescriptionFirst 20/30 day absences The number of days a student missed during the first 20 or 30 days of the first grading period
Total absences The number of days a student missed during each grading period
Courses failed The number of any courses failed during each grading period
Core courses failed The number of core courses, as defined by the district and/or school, failed during each grading period
Credits earned The number of credits earned during each grading period
GPA The student grade point average at end of each grading period
HINT
If the school records course grades each semester, you are advised to still look at student risk status based on attendance on a quarterly basis. Simply set the tool on a quarter system and upload or enter data for attendance for ALL grading periods, and upload or enter data for courses failed, credits earned, and GPA only for the second and fourth grading periods (as seen in Exhibit 15).
CAUTION
When importing student performance data, be sure to enter any new students who have recently transferred into the school into the Student Information page. If student performance data include any student IDs that are not already in the Student Information page, the Student Performance page will not import those students’ data.
HINT
If manually entering data in the tool, be sure to type directly into the tool rather than copying and pasting data in from an external source. Copying and pasting directly into the tool can overwrite formulas and affect the tool’s functionality. If you would like to copy and paste data from an external source, do so into a source file that can be imported into the tool (see Appendix 1—Import Data Templates).
HINT
After uploading student performance data, save each student performance data source file (one for each grading period) to serve as a back-up so that if the student information data are updated during the course of the school year, you will be able to quickly re-import the student performance data. For information about backing up data in the tool, see Appendix 2—Backing Up Data, and for more information about updating the student information throughout the school year, please see the Importing Data section.
Exhibit 15: Performance Data Page With Sample Data

17
betterhighschools.org
Year-to-date data totals and averages for each student are automatically calculated in the far-right columns. Once the date has past the LAST day of the final grading period (as set on the Tool Settings page), the tool will calculate ‘End-of-Year’ totals and averages by using the simple sum or average of the per-grading period information. In some schools, this may not match the cumulative, end-of-year attendance or GPA information exactly, as means for calculation may vary.
o u t P u t s A n d r e P o r t s PA G e s
The Outputs and Reports pages give you a variety ways to evaluate and analyze student risk status, assign students to specific interventions, and view and print school- and student-level reports. The tool offers three Outputs and Reports pages:
1. Student Risk Status
2. Assignment of Intervention to Student
3. Reports Control Panel
student risk status
The Student Risk Status page requires no data entry. It automatically displays students and their risk status for each indicator per grading period. From this page, you can also assign interventions to individual students.
At each grading period, students can potentially be flagged for attendance and/or academic performance. At the end of the year, end-of-year totals include flags for annual attendance, total number of course failures, GPA, and the CCSR End of Year Indicator. A screen shot of the Student Risk Status page is shown in Exhibit 16.
Exhibit 16: Student Risk Status Page With Sample Data
Would like to add call outs like below:
Students who have transferred out, dropped out, or graduated are grayed out.
Students who are flagged for one or more indicators are highlighted in red.

18
betterhighschools.org
For each individual risk indicator, a ‘Yes’ signals that the student is flagged because he or she has exceeded the risk threshold for that indicator. A ‘No’ means that the student is not flagged for that indicator (i.e., did not exceed the risk threshold).
• Students who have one or more ‘Yes’ flags for risk indicators during any grading period or at the end of the year will have their name and student ID highlighted in red.
• Students who have graduated, dropped out, or transferred out of the school are grayed out.
The tool offers several ways to filter the data shown on the Student Risk Status page. First, you can set the time frame to examine students’ risk status by selecting the ‘Grading Period’ or ‘End-of-Year’ option in the ‘Time frame’ drop-down box. Additionally, you can choose to show all students or to filter the list on the basis of demographics (i.e., students with disabilities, disadvantaged students, or ELL students) by using the ‘Filter by demographics’ drop-down box.
HINT To ‘refresh’ this page to reflect updates in pre-high school or performance data entered or imported, choose a different ‘Filter by demographic’ and ‘Timeframe’ selection, and then reselect your selections of interest.
Assigning interventions to students
The Student Interventions page allows you to document the assignment of students to one or more interventions. A screen shot showing the Student Interventions page, with all students assigned to interventions, is shown in Exhibit 17. A screen shot showing the Student Interventions page for an individual student is shown in Exhibit 18.
The Student Interventions page can be accessed via the ‘Assign Intervention to Student’ button on the Main Menu or via the Student Risk Status page using either of two methods:
• On the Student Risk Status page, right-click a student’s name and select ‘Assign to Intervention’ at the bottom of the Excel drop-down menu that appears. This opens the Student Interventions page and the student’s individual record.
Exhibit 17: Student Interventions Page (All Students) With Sample Data

19
betterhighschools.org
• On the Student Risk Status page, click the ‘Interventions’ button at the top to open the Student Interventions page. The record of the last student who was assigned to an intervention will be displayed. − To view assigned interventions for all students, delete the student ID shown in the ‘Student ID’ field.− To view an individual student’s record, enter their student ID in the ‘Student ID’ field.
To assign a student to an intervention from the Student Interventions page, follow these steps:
1. Enter a student ID to pull up the individual record. (This step is done automatically if you are using the right-click menu function in the Student Risk Status page.) If the student ID is not in the file, an error message will appear (see Exhibit 19).
2. Click the ‘Assign Intervention to Student’ button. A new row will be inserted into the table. The student’s ID, first name, and last name will be automatically populated.
3. Select an intervention name from the drop-down list under the column labeled ‘Intervention.’ The list of interventions is drawn from the interventions that were entered during the setup of the tool on the Intervention Settings page.
Exhibit 19: Attempting to Add an Intervention for an Invalid Student ID
Exhibit 18: Student Interventions Page (Individual Student) With Sample Data

20
betterhighschools.org
4. Enter the date the student is assigned to begin participating in the intervention (if the start date of the intervention occurs prior to the start of the first grading period, the tool will identify it as a pre-high school intervention).
5. Enter the date when the student is scheduled to stop participating in the intervention (if the end date of the intervention is omitted, the tool will assume that the intervention is ongoing).
Enter any additional comments as desired. (Entering comments is optional; these comments are just for your own reference on this page and are not used elsewhere in the tool.) For the Student Intervention feature to function, intervention start date is required.
Because the Student Interventions data are primarily kept in the EWS Tool v2.0 (as opposed to being taken from an existing student information system), it is critical that you routinely back up these data using the ‘Export Data’ function. To export student interventions data into a data file, click the ‘Export Data’ button and make sure that the settings are appropriate in the ‘Export Data’ dialog box (for more information, see the Exporting Data section). For information about backing up data in the tool, see Appendix 2—Backing Up Data.
HINT
Export and save the student interventions data as a source file each time you update the data as a backup so that if the student information data are updated during the course of the school year, you will be able to quickly re-import the student interventions data. For information about backing up data in the tool, see Appendix 2—Backing Up Data, and for more information about updating the student information throughout the school year, please see the Importing Data section.
reports control Panel
The Reports Control Panel page enables you to create various reports based on the data that have been entered into the tool. Exhibit 20 shows a screen shot of the Reports Control Panel.
To create a school- or student-level report, simply select one from the drop-down lists, select a time frame and/or intervention name (if available), and click the associated ‘Create Report’ button. For some student-level reports, there is no applicable time frame and/or intervention option, in which case the drop-down selection boxes will be grayed out and disabled. The data in the
Exhibit 20: Basic Reports Control Panel Interface

21
betterhighschools.org
tool will be calculated and filtered automatically so that only the relevant information is displayed in the report. Further detail on the nature of the reports and the information shown in each one is provided in the following section.
NOTE The ‘Advanced Settings’ have been disabled in the EWS Tool v2.0. These features may be made available in subsequent versions of the EWS Tool.
r e P o r t s
The EWS Tool v2.0 has a large number of predefined reports accessible via the Reports Control Panel page. Four different types of reports are available:
1. school-level reports are graphical reports that show trends in student risk status across the school.
2. student-level reports show lists of students, grouped by indicators of risk and/or assigned intervention programs, and include summary information.
3. detailed student report is a simple report that can be generated for each individual student and shows student information, indicators of risk status, and any assigned interventions.
4. student-level intervention summary report is a list of all students, their indicators of risk (flagged or not flagged), and the number and types of interventions to which each student was assigned.
All reports are formatted for printing, and printouts will be branded with the school/district logo if you have uploaded it on the School Information page. The next sections walk through each type of report listed above.
school-level reports
The EWS Tool v2.0 includes several predefined school-level reports. The school-level reports show trends in student risk status across the school in graphs, with summary information. They can be used to assess the percentage of students who are flagged as ‘at risk’ on different indicators (or on all indicators) over time. Many of these reports can be filtered to show a specific time frame, group of students, or intervention program through drop-down menus in the reports (see Exhibit 21 for an example). The school-level reports do not include any identifiable student information; therefore, they are ideal for sharing with outside stakeholders.
CAUTIONSchool-level reports with a small number of students in a category (e.g., ELL students) and/or when all students in a group or subgroup are flagged may cause data to be identifiable and matched to student names. Caution should be used in dissemination of these data.
The predefined school-level reports are listed and described in Table 4.

22
betterhighschools.org
Table 4: Predefined School-Level Reports
Report Name DescriptionRisk Indicator Summary Report This report shows the number of students who are flagged and not flagged for each indicator of risk for
the selected grading period or time frame.
Risk Indicator Summary Report: Disability Categories
This report shows the number of students with disabilities who are flagged and not flagged for any indicator of risk for the selected grading period or time frame.
Risk Indicator Summary Report: Disadvantaged
This report shows the number of students who are identified as economically disadvantaged (e.g., participate in the National School Lunch Program) who are flagged and not flagged for any indicator of risk for the selected grading period or time frame.
Risk Indicator Summary Report: ELL
This report shows the number of students who are designated English language learners who are flagged and not flagged for any indicator of risk for the selected grading period or time frame.
Enrollment Status Summary Report
This report shows the number and percentage of students who are flagged and not flagged for each indicator of risk during the selected grading period or time frame, by enrollment status: (1) enrolled students, (2) students who transferred out/graduated, and (3) students who dropped out. Note: Enrollment status is based on students’ current enrollment status from the Student Information page and does not change to reflect students’ enrollment status during any particular time frame.
Intervention Summary Report: Program
This report shows the number of students who were assigned to the selected intervention program at any point during the school year. It also shows a summary of the indicators of risk for which they are flagged or not flagged for the selected grading period or time frame. Note: Use the ‘Characteristic’ drop-down menu to show results for all students or for subgroups of students. Use the ‘Intervention’ drop-down menu to select and change the intervention program shown.
Exhibit 21: School-Level Graphical Report
23
betterhighschools.org
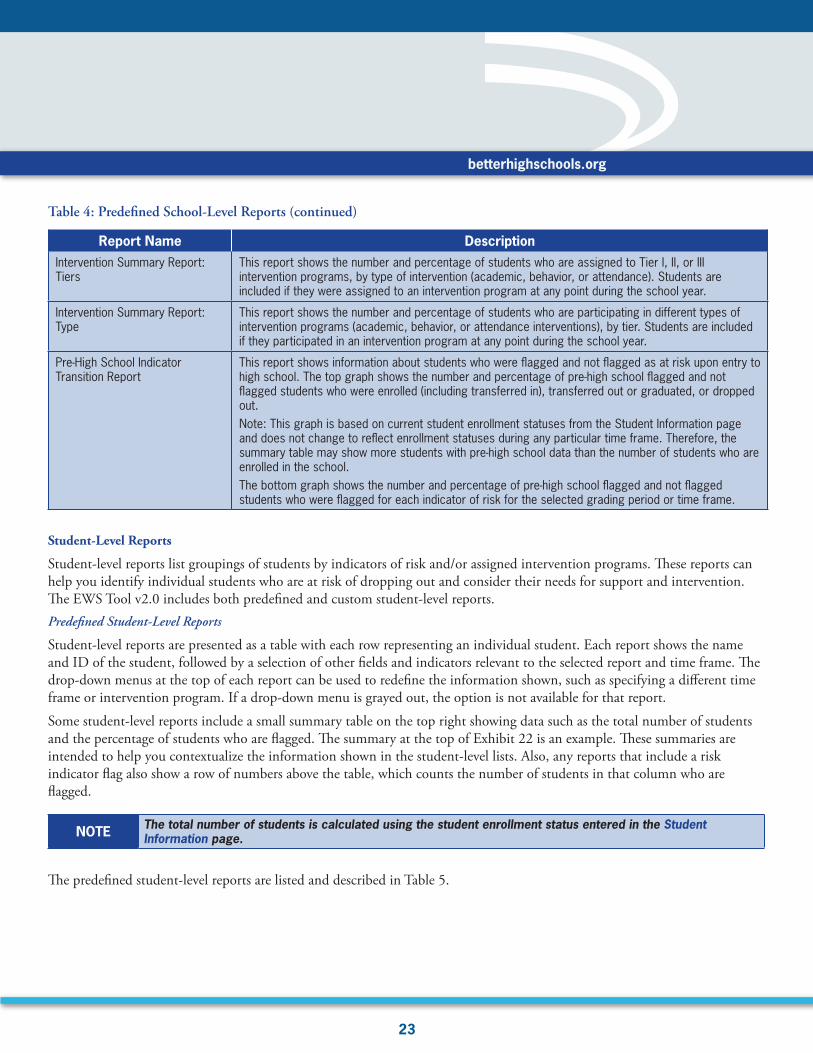
Report Name DescriptionIntervention Summary Report: Tiers
This report shows the number and percentage of students who are assigned to Tier I, II, or III intervention programs, by type of intervention (academic, behavior, or attendance). Students are included if they were assigned to an intervention program at any point during the school year.
Intervention Summary Report: Type
This report shows the number and percentage of students who are participating in different types of intervention programs (academic, behavior, or attendance interventions), by tier. Students are included if they participated in an intervention program at any point during the school year.
Pre-High School Indicator Transition Report
This report shows information about students who were flagged and not flagged as at risk upon entry to high school. The top graph shows the number and percentage of pre-high school flagged and not flagged students who were enrolled (including transferred in), transferred out or graduated, or dropped out. Note: This graph is based on current student enrollment statuses from the Student Information page and does not change to reflect enrollment statuses during any particular time frame. Therefore, the summary table may show more students with pre-high school data than the number of students who are enrolled in the school.The bottom graph shows the number and percentage of pre-high school flagged and not flagged students who were flagged for each indicator of risk for the selected grading period or time frame.
student-level reports
Student-level reports list groupings of students by indicators of risk and/or assigned intervention programs. These reports can help you identify individual students who are at risk of dropping out and consider their needs for support and intervention. The EWS Tool v2.0 includes both predefined and custom student-level reports. Predefined Student-Level Reports
Student-level reports are presented as a table with each row representing an individual student. Each report shows the name and ID of the student, followed by a selection of other fields and indicators relevant to the selected report and time frame. The drop-down menus at the top of each report can be used to redefine the information shown, such as specifying a different time frame or intervention program. If a drop-down menu is grayed out, the option is not available for that report.
Some student-level reports include a small summary table on the top right showing data such as the total number of students and the percentage of students who are flagged. The summary at the top of Exhibit 22 is an example. These summaries are intended to help you contextualize the information shown in the student-level lists. Also, any reports that include a risk indicator flag also show a row of numbers above the table, which counts the number of students in that column who are flagged.
NOTE The total number of students is calculated using the student enrollment status entered in the Student Information page.
The predefined student-level reports are listed and described in Table 5.
Table 4: Predefined School-Level Reports (continued)

24
betterhighschools.org
Table 5: Predefined Student-Level Reports
Report Name DescriptionFlagged Student Report
This report shows a list of students who are flagged for any indicators of risk and for which indicators they are flagged for the selected grading period or time frame.
Flagged Student Report: Disabilities
This report shows a list of students with disabilities who are flagged for any indicators of risk, for which indicators they are flagged, and their assigned interventions for the selected grading period or time frame.
Flagged Student Report: Disadvantaged
This report shows a list of economically disadvantaged students (e.g., participate in the National School Lunch Program) who are flagged for any indicators of risk, for which indicators they are flagged, and their assigned interventions for the selected grading period or time frame.
Flagged Student Report: ELL
This report shows a list of students who are designated as English language learners who are flagged for any indicators of risk, for which indicators they are flagged, and their assigned interventions for the selected grading period or time frame.
Pre-HS Risk Report This report shows a list of students who were flagged for the pre-high school indicator of risk (if available).
Pre-HS Risk Transition Report
This report shows a list of all students who were flagged for the pre-high school indicator of risk and whether they are flagged for attendance and/or any academic indicators during the selected grading period or time frame. It also shows their assigned interventions during the selected grading period or time frame.
Exhibit 22: Example of a Flagged Student Report for Quarter 1

25
betterhighschools.org
Report Name DescriptionOff- to On-Track Report
This report shows a list of students who ARE NOT flagged for any indicators of risk in the selected grading period, but who WERE flagged in the previous grading period. It also shows the interventions in which these students are participating during the selected grading period or time frame.Note: For the End of Year time frame, the report shows students who ARE NOT flagged for any end of year indicators of risk, but who WERE flagged for any indicators of risk in the final grading period of the year. For the Full Year time frame, the report shows students who ARE NOT flagged for any end of year indicators of risk, but who WERE flagged for the pre-high school indicator of risk and/or any indicators of risk during the school year.
On- to Off-Track Report
This report shows a list of students who ARE flagged for any indicators of risk in the selected grading period, but who WERE NOT flagged in the previous grading period. It also shows the interventions in which these students are participating during the selected grading period or time frame.Note: For the End of Year time frame, the report shows students who ARE flagged for any end of year indicators of risk, but who WERE NOT flagged for any indicators of risk in the final grading period. For the Full Year time frame, the report shows students who ARE flagged for any end of year indicators of risk, but WERE NOT flagged for any indicators of risk during the first grading period.
Flagged Student Intervention Report
This report shows a list of all students who are flagged for any indicators of risk, for which indicators they are flagged and their assigned interventions for the selected grading period or time frame.
Intervention Report This report shows a list of students assigned to participate in the selected intervention program and the indicators of risk for which they are flagged during the selected grading period or time frame. Use the ‘Intervention’ drop-down menu to change the intervention program shown.
Under-Credited Student Report
This report shows a list of students who did not obtain sufficient credits for promotion at the end of the school year (based on the information provided in the Tool Settings page). For each student, the report shows the indicators of risk for which they are flagged and their assigned interventions for each grading period.
Student Dropout Report
This report shows a list of students who dropped out of high school during any point of the school year. It shows the date of their enrollment status change (i.e., when they dropped out), the indicators of risk for which they are flagged, and their assigned interventions for the selected grading period or time frame.
Custom Student-Level Reports
Custom student-level reports can be created by specifying a time frame and desired data fields for inclusion. Follow these steps to create a custom report (see Exhibit 23):
1. Select a custom report (i.e., 1–5) and time frame from the drop-down list of available student-level reports.
NOTE
Time frame does not confine the report to the given time frame; rather, it enables you to create and save additional custom reports. For instance, Custom Report 1 for Grading Period 1 can store report settings different from those of Custom Report 1 for another grading period. Data specific to a grading period can be selected in Step 3.
2. Click the ‘Create report’ button.
3. Select the fields you want to display in the report either by double-clicking the field names or by selecting each one and clicking the ‘>’ button (up to a maximum of 27). Select multiple fields by holding the control key.
HINT Be sure to include student names and/or IDs if you want the information in the report to be identifiable. If you do not want the report to include identifiable information, do not include names or IDs.
Table 5: Predefined Student-Level Reports (continued)

26
betterhighschools.org
4. Click ‘Save and create report’ to save a copy of the list of selected fields and generate the report.
Once the field list is saved and the report created, the report is saved as ‘Custom Report 1, Grading Period 1’ or ‘Custom Report 1, Grading Period 2,’ and so on. That is, the same report can be rerun at a later date, and the list of fields will be automatically populated. Custom reports show data for all students, both flagged and not flagged, during the time frame selected. For a list of available fields and definitions, see Appendix 3—Custom Report Field Definitions. detailed student report
The detailed student report shows information about an individual student. To create a detailed student report, click the ‘Create Report’ button to the right of ‘Detailed Student Report’ on the Reports Control Panel and search for a student by entering a first name, a last name, or a student ID in the search parameters fields (Exhibit 24) and press ‘Enter’ on your keyboard.
Once the search parameters have identified a student, information for that student will be displayed, including demographics, enrollment information, risk indicator flags, assigned interventions, and any comments that were entered on the Student Information page. A screen shot of an example Detailed Student Report is shown in Exhibit 25.
HINTThis report is meant to identify one student at a time. When you search by name, if more than one student is found with the same first or last name, the report will indicate that additional search parameters need to be used.
This report is expressly designed for school and district staff to use when talking with students and their families about students’ risk status and progress through the school year. (See the EWS Implementation Guide for more information on this part of the dropout prevention process.)student-level intervention summary report
The student-level intervention summary report shows all students, their indicators of risk (flagged or not flagged), and the number of interventions of each type (attendance, behavior, or academic) assigned to each student during a selected grading period (Exhibit 26). (The ‘View’ drop-down menu provides options to display information for pre-high school, each grading period, or end of year.)
Exhibit 24: Searching for a Student in the Detailed Student Report
Exhibit 23: Custom Report Dialog Box

27
betterhighschools.org
Exhibit 26: Student-Level Intervention Summary Report
Exhibit 25: Detailed Student Report

28
betterhighschools.org
End-of-year data show the total number of interventions assigned to each student over the course of the year. In the ‘End of Year’ view, if a single intervention was assigned to a student over multiple grading periods, that program will be counted only once in the totals.
i M P o r t i n G d A t A
One of the main new features of the EWS Tool v2.0 is the ability to import data. Data may be imported into five pages:
1. Intervention Settings
2. Student Information
3. Student Pre-High School Risk Status
4. Student Performance
5. Student Interventions
Each page has an ‘Import Data’ button, which gives you access to the ‘Data Import’ dialog box. The ‘Data Import’ dialog box will automatically identify the type of data (e.g., student information, student performance) on the basis of on which page the data import button was clicked. For example, if you click the ‘Import Data’ button on the Student Information page, the ‘Data Import’ dialog box will automatically assume that student information is being imported.
In the ‘Data Import’ dialog box (Exhibit 27), you must select the appropriate settings. First, select the file format of the source files by clicking the appropriate radio button under ‘File Format.’ Source files can be comma separated value (.csv) files or tab delimited (.txt) files. Next, select the desired outcome, or ‘Action.’ Two import actions are available—overwrite and Append. The first time that data are imported, use the ‘Overwrite’ option. After that, use care when using ‘Overwrite’ because any data in the tool will be irreversibly deleted. When appending data, the tool will add the data from the source (.csv or .txt) file to the first empty row in the relevant table. It is important to note that you can append data only to the student information and intervention settings sheets. When importing Student Performance data, you also need to be use the drop-down menu to select the grading period. Last, identify the actual data file by clicking the ‘Browse...’ button.
NOTE
Users of Excel 14.0 (part of Office 2011) for Macs cannot use the ‘Browse’ button within the ‘Data Import’ dialog box to locate the file they want to import. These users must copy the path of the file for import (such as “C:\Desktop\EWS\Student_Performance_Q4.txt”) and paste it into the text box to the left of the ‘Browse’ button. Then they can choose the appropriate settings for the import file and press ‘Import.’
Exhibit 27: Data Import Dialog Box

29
betterhighschools.org
Information on how to create a source file, including the format of each file type of data, can be found in Appendix 1—Import Data Templates.
NOTES
Data must be imported or entered into the Student Information page before data can be imported into any other pages. At a minimum, the Student Information needs to include student ID and Enrollment Status in order to work.When importing Student Pre-High School Risk Status data and Student Performance data after the start of the year, be sure to first enter or import information on any new students who have transferred into the school into the Student Information page. Uploaded student performance data that are not associated with an existing student ID will not be captured. If you get an error when uploading student performance data, check to make sure that student information data have been previously entered or imported.
HINTIf exporting data from a Student Information System, please note that some Student Information Systems export data into Excel files set to “Accounting” format, which can add extra spaces to cells and cause problems in the tool. Be sure that your source files are set to “General” format.
e x P o r t i n G d A t A
One feature of the EWS Tool v2.0 is the ability to export data that may only be maintained in the tool. Data may be exported from two pages:
• Student Information • Student Interventions
Both of these pages have an ‘Export Data’ button, which allows you to export and the save the data in a source file.
In the ‘Export Data’ dialog box (Exhibit 28), you must select the appropriate settings for the export file. You will be prompted to save the data as either a tab delimited file (.txt) or comma separated value file (.csv) in the same location that the tool is saved. The default format for saving the export files is tab delimited (.txt) and the file name will include the name of the page and the current date. For example, if you decide to export the data from the Student Information page on January 11, 2011, the default settings will automatically name the file ‘StudentInfo_1_11_2011.txt’ and it will be saved in the same location that the tool is currently saved. You have the option to use the default file name and file save location settings, or you may choose to customize these by typing in an alternate file name or path.
Exhibit 28: Export Data Dialog Box
30
betterhighschools.org
P r i n t i n G r e P o r t s
All the reports accessible by the Report Control Panel page can be printed. When printed, each will display the school logo if one was uploaded on the Tool Settings page. The reports are set to print (e.g., charts) on one page, but because of the variations in the amount of data in the tool (e.g., the number of students), the settings may not be perfect. You may want to adjust the print settings so that your reports print clearly and use as few pages as necessary. Below are some commonly used customizations.
NOTE These printing instructions are written to apply to Microsoft Excel version 2007 or later. For older versions of Excel, please refer to the Excel Help menu for print settings instructions.
repeat row and column headers. Select which row and/or column headings to print on every page of the student-level report, if the report spans more than one printed page.
1. Click ‘Print Titles’ on the Page Layout tab.
2. Click the Sheet tab, and then do one or both of the following:
• In the Rows to repeat at top box, type the reference of the rows that contain the column labels or highlight the rows, using your mouse.
• In the Columns to repeat at left box, type the reference of the columns that contain the row labels.
redefine the print area. Identify a portion of a report to print.
1. On the report to be printed, select what you want to print.
2. Click ‘Print Area’ on the Page Layout tab.
3. Click ‘Set Print Area.’
scale the print output. Resize the output by constraining the number of pages a report prints on by width or height or by percentage of its original size. On the Page Layout tab, in the Scale to Fit group, do one of the following:
• To reduce the width of a report to fit a maximum number of pages, select the number of pages that you want in the ‘Width’ list.
• To decrease the height of the printed report to fit a maximum number of pages, select the number of pages that you want in the ‘Height’ list.
• To increase or decrease the printed report to a percentage of its actual size, select the percentage that you want in the ‘Scale’ box.
You can check the results of your print set-up customization by clicking ‘Print Preview’ at any time.
HINT Printing some reports, such as the Risk Indicator Summary Report, for individual grading periods may prevent the need to reformat full year reports that print across many pages.

31
betterhighschools.org
e n d n o t e s
1. See Stillwell, 2010.
2. See Greene & Winters, 2005; Stillwell, 2010; U.S. Department of Education, 2006.
3. See Allensworth & Easton, 2005, 2007; Balfanz, Herzog, & MacIver, 2007; Neild & Balfanz, 2006; Silver, Saunders, & Zarate, 2008.
4. See Dynarski et al., 2008.
5. See Heppen & Therriault, 2008; Kennelly & Monrad, 2007; Jerald, 2006; Neild, Balfanz, & Herzog, 2007; Pinkus, 2008.
6. See Allensworth & Easton, 2005; 2007; Balfanz & Herzog, 2005.
7. See Gwynne, Lesnick, Hart, & Allensworth, 2009.
8. The EWS Implementation Guide is available at http://www.betterhighschools.org/ews.asp. The EWS Implementation Guide provides information about using the EWS Tool v2.0 as part of a seven-step process of establishing and implementing a comprehensive early warning system for dropout prevention.
9. See Allensworth & Easton, 2005.
10. Tiers refer to the intensity of the intervention program as used in tiered intervention, or Response to Intervention, models for dropout prevention. In schools using tiered models for dropout prevention, Tier I interventions are generally provided to all students (e.g., positive behavior programs). Tier II interventions are provided to students who are at risk for dropping out, at a moderate cost per student (e.g., mentoring and tutoring programs). Tier III interventions are the most intensive programs, provided at a higher cost per student (e.g., one-on-one support programs with full wraparound services). See the EWS Implementation Guide for more information.

32
betterhighschools.org
r e f e r e n c e s
Allensworth, E. M., & Easton, J. Q. (2005). The on-track indicator as a predictor of high school graduation. Chicago, IL: Consortium on Chicago School Research at the University of Chicago.
Allensworth, E., & Easton, J. Q. (2007). What matters for staying on-track and graduating in Chicago Public High Schools: A close look at course grades, failures and attendance in the freshman year. Chicago: Consortium on Chicago School Research.
Balfanz, R., & Herzog, L. (2005). Keeping middle grades students on-track to graduation: Initial analysis and implications. Presentation at the second Regional Middle Grades Symposium, Philadelphia.
Balfanz, R., Herzog, L., & MacIver, D. J. (2007). Preventing Student Disengagement and Keeping Students on the Graduation Path in Urban Middle-Grades Schools: Early Identification and Effective Interventions. Educational Psychologist, 42(4), 223–235.
Dynarski, M., Clarke, L., Cobb, B., Finn, J., Rumberger, R., & Smink, J. (2008). Dropout prevention: A practice guide (NCEE 2008–4025). Washington, DC: National Center for Education Evaluation and Regional Assistance, Institute of Education Sciences, U.S. Department of Education.
Greene, J., & Winters, M. (2005). Public high school graduation and college-readiness rates: 1991–2002. New York: Manhattan Institute for Policy Research.
Gwynne, J., Lesnick, J., Hart, H. M., & Allensworth, E. M. (2009, December). What matters for staying on-track and graduating in Chicago Public Schools: A focus on students with disabilities. Chicago, IL: Consortium on Chicago School Research, University of Chicago.
Heppen, J., & Therriault, S. B. (2008). Developing early warning systems to identify potential high school dropouts. Washington, DC: National High School Center.
Jerald, C. (2006). Identifying potential dropouts: Key lessons for building an early warning data system. Washington, DC: Achieve, Inc.
Kennelly, L., & Monrad, M. (2007). Approaches to dropout prevention: Heeding early warning signs with appropriate interventions. Washington, DC: National High School Center.
Neild, R. C., & Balfanz, R. (2006). Unfulfilled promises: The dimensions and characteristics of Philadelphia’s dropout crisis, 2000–2005. Baltimore: Johns Hopkins University, Center for Social Organization of Schools.
Neild, R. C., Balfanz, R., & Herzog, L. (2007). An early warning system. Educational Leadership, 65(3), 28–33.
Pinkus, L. (2008). Using early-warning data to improve graduation rates: Closing cracks in the education system. Washington, DC: Alliance for Excellent Education.
Silver, D., Saunders, M., & Zarate, M. E. (2008). What factors predict high school graduation in the Los Angeles Unified School District?, California Dropout Research Project (Vol. Policy Brief 14). Santa Barbara: UC Santa Barbara Graduate School of Education.
Stillwell, R. (2010). Public school graduates and dropouts from the Common Core of Data: School year 2007–08 (NCES 2010-341). Washington, DC: National Center for Education Statistics, Institute of Education Sciences, U.S. Department of Education.
U.S. Department of Education, National Center for Education Statistics. (2006). The Condition of Education 2006 (NCES 2006-071). Washington, DC: U.S. Government Printing Office.

betterhighschools.org
A–1
APPENDICES
Appendix 1—Import Data Templates
Appendix 2—Backing Up Data
Appendix 3—Custom Report Field Definitions

A–2
betterhighschools.org
APPendix 1—iMPort dAtA teMPlAtes
When data are imported, the source file must match the following templates to ensure that data are imported correctly. The first row of data of your source file must contain the field names, which serve as column headings.
CAUTION
Be sure that your data do not include any extra spaces before or after text or in blank cells. Extra spaces in the source file data may cause errors in the tool.If exporting data from a Student Information System, please note that some Student Information Systems export data into Excel files set to “Accounting” format, which can add extra spaces to cells and cause problems in the tool. Be sure that your source files are set to “General” format.
HINT Blank source file templates are available at http://www.betterhighschools.org/ews.asp.
Student Information
Field/Column Heading Format Other DetailsFirst Name Text
Last Name Text
Student ID Text or number
Grade Number
Date of birth Date
Gender Text M or F
Ethnicity Text Ethnicities should exist in the tool settings sheet
Disability Text Disabilities should exist in the tool settings sheet. Do not use “No” for the absense of a disability (leave blank)
Disadvantaged Text Must exist in Disadvantaged status list in tool settings; Do not use “No” for ‘not disadvantaged’ (leave blank)
ELL status Text Must exist in ELL status list in tool settings; Do not use “No” for ‘not ELL’ (leave blank)
Enrollment status Text Enrollment status should exist in the list of available options
Date of status change Date Must be entered for any transfers, dropouts, or graduates
Quarter 1 days*
Number
If the student has transferred or dropped out, these fields should contain the number of days in each grading period that are applicable to the student
NOTE: Each of these four columns needs to exist, even if your school only has two or three grading periods, in order for the tool to import data correctly.
Quarter 2 days*
Quarter 3 days*
Quarter 4 days*
Guardian(s) Text Name of guardian or guardians
Phone Text Phone number for guardian
Email Text Email address for guardian
Comments Text Any additional information relevant to the student
* Note that these field/column headings will change depending on what grading period format has been selected in the settings. When importing data for semesters or trimester formats, you must have the same number of fields/columns (e.g., for semesters, you should have semester 1 days, semester 2 days, and then two blank fields).

A–3
betterhighschools.org
HINT You can quickly create a template of this file by opening an empty tool and clicking on the ‘Export Data’ button on the Student Information page and saving the file.
Intervention Settings
Field/Column Heading Format Other Details
Intervention name Text Must be unique
Intervention type Text Must be ‘Attendance,’ ‘Academic,’ or ‘Behavior’
Tier Text Must be I, II, or III
Description Text Any additional details (not used elsewhere in the tool)
Student Pre-High School Risk Status
Field/Column Heading Format Other DetailsStudent ID Text or number Must match the IDs used in the student information sheet
Text Flagged students must be coded as ‘Yes’ and not flagged students as ‘No’, based on prior middle school information, if available
Other 1 Any
Other 2 Any
Other 3 Any
Other 4 Any
Student Performance
Field/Column Heading Format Other DetailsStudent ID Number or text Must match the IDs used in the student information sheet
Early attendance absences* Number
Total absences Number
Courses failed (all) Number
Courses failed (core) Number
Credits earned Number
GPA Number This is a GPA that should be representative only for the grading period
* Required only for the first grading period.

A–4
betterhighschools.org
Student Interventions
Field/Column Heading Format Other DetailsStudent ID Number or text Must match the IDs used in the student information sheet
First Name Text
Last Name Text
Intervention TextNOTE: Two columns need to exist here (leave one blank)
Assigned Interventions must exist in the Intervention Settings sheet
Start Date Date Start date must be entered for student to appear in intervention reportsNOTE: Dates before the start of the school year will be counted as pre-HS interventions
End Date Date If no end date appears, the student will appear in the intervention through the end of the year
Comments Text
HINT You can quickly create a template of this file by opening and empty tool and clicking on the ‘Export Data’ button on the Student Interventions page and saving the file.
CAUTION Be sure that your data does not include any extra spaces before or after text, or in blank cells. Extra spaces in the source file data may cause errors in the tool.

A–5
betterhighschools.org
APPendix 2—bAckinG uP dAtA
It is important to save backup data files for the Intervention Settings page, Student Information page, Student Pre-High School Risk Status page, Student Performance page, and Student Interventions page to protect the information housed in the tool in case data are changed or erased. Additionally, if the Student Information data is updated during the school year and the order that the students appear in is changed, you will need to have all of the Pre-High School data, Student Performance data (for the current and previous grading periods), and Student Interventions data saved in order to re-import it and re-match this data to the appropriate students.
To create backup data files for the intervention settings page, student Pre-high school risk status page, and student Performance page, you can copy the data directly from these pages and paste it into a new tab delimited (.txt.) or comma separated value (.csv) file.
To create backup data files for the student information page and the student interventions page, data may be exported and saved as a data file using the ‘Export Data’ button. In the ‘Export Data’ dialog box (Exhibit 29), you must select the appropriate settings for the export file. You will be prompted to save the data as either a tab delimited file (.txt) or comma separated value file (.csv) in the same location that the tool is saved. The default format for saving the export files is tab delimited (.txt) and the file name will include the name of the page and the current date. For example, if you decide to export the data from the Student Information page on January 11, 2011, the default settings will automatically name the file ‘StudentInfo_1_11_2011.txt’ and it will be saved in the same location that the tool is currently saved. You have the option to use the default file name and file save location settings, or you may choose to customize these by typing in an alternate file name or path.
Exhibit 29: Export Data Dialog Box

A–6
betterhighschools.org
APPendix 3—custoM rePort field definitions
The following table lists each field that the tool uses to generate reports, the format of the data, and a description of what the field indicates. Note that the available fields are affected by what grading period type has been selected in the Tool Settings page. The following fields are based on a quarterly grading period.
Field Name DescriptionLast Name Last name of the student
First Name First name of the student
Student ID Student ID number
Grade Grade of the student
Phone # Home telephone number
Guardian(s) Name of guardian or guardians
Email Email address for guardian
Date of Birth Student date of birth
Gender Student gender
Ethnicity Student ethnicity
Disability Student disability
Disadvantaged Disadvantaged status of the student
ELL Status English language learner status of the student
Enrollment Status Current enrollment status
Date of Status Change Date of enrollment status change
Any Disability Students with any disability
Any ELL Students who are ELLs
Any Disadvantaged Students who are disadvantaged
Any Characteristic Includes students with disabilities, those who are ELL and disadvantaged
Pre-HS Indicator Flag for the pre-HS indicator
GP # First 20/30 Day Attendance Flag for early attendance indicator
GP # Attendance Flag for GP # attendance indicator
GP # Course Fails Flag for GP # course fails
GP # GPA Flag for GP # GPA
GP # Any Flag Flag for students who have at least one flag in GP #
GP # Any Attendance Flag Flag for students who have at least one attendance flag in GP # (i.e., first 20/30 day or overall attendance)
GP # Any Academic Flag Flag for students who have received at least one academic flag in GP #
Any Flag Flag for students who have at least one flag during any grading period
Any Attendance Flag Flag for students who have at least one attendance flag during any grading period
Any Academic Flag Flag for students who have at least one academic flag during any grading period
End of Year Attendance Flag Flag for overall year attendance

A–7
betterhighschools.org
Field Name DescriptionEnd of Year Course Fails Flag Flag for overall year course fails
End of Year GPA Flag Flag for final GPA score
CCSR Indicator Flag Flag for CCSR end-of-year indicator (based on course fails and credits earned flags)
End of Year Core Course Fails Flag Flag for overall year core course fails
End of Year Credits Earned Flag Flag for overall year credits earned
End of Year Any Flag Flag for students who have at least one end of year flag
End of Year Any Academic Flag Flag for students who have at least one academic end of year flag
GP # Both Attendance and Academic Flags Flag for students who have both attendance and academic flags in GP #
End of Year Both Attendance and Academic Flags Flag for students who have both attendance and academic end of year flags
Participated in Tier 1 Attendance Intervention Flag for students who have participated in a Tier I attendance intervention
Participated in Tier 2 Attendance Intervention Flag for students who have participated in a Tier II attendance intervention
Participated in Tier 3 Attendance Intervention Flag for students who have participated in a Tier III attendance intervention
Participated in Tier 1 Behavior Intervention Flag for students who have participated in a Tier I behavior intervention
Participated in Tier 2 Behavior Intervention Flag for students who have participated in a Tier II behavior intervention
Participated in Tier 3 Behavior Intervention Flag for students who have participated in a Tier III behavior intervention
Participated in Tier 1 Academic Intervention Flag for students who have participated in a Tier I academic intervention
Participated in Tier 2 Academic Intervention Flag for students who have participated in a Tier II academic intervention
Participated in Tier 3 Academic Intervention Flag for students who have participated in a Tier III academic intervention
Pre-HS Interventions All interventions participated in prior to entering the 9th grade
GP # Interventions All interventions participated in during GP #
All Interventions All interventions participated in over the course of the year