DEVELOPMENT OF 2010 OIL AND GAS EMISSIONS PROJECTIONS FOR THE
26
773 San Marin Drive, Suite 2115, Novato, CA 94998 415.899.0700 ENVIRON International Corporation DEVELOPMENT OF 2010 OIL AND GAS EMISSIONS PROJECTIONS FOR THE DENVER-JULESBURG BASIN Prepared for Colorado Department of Public Health and Environment Air Pollution Control Division Prepared by Amnon Bar-Ilan John Grant Ron Friesen Alison K. Pollack ENVIRON International Corporation 773 San Marin Drive, Suite 2115 Novato, CA 94998 Doug Henderer Daniel Pring Buys & Associates 300 E. Mineral Ave., Suite 10 Littleton, CO 80122 Andrew Bremner Independent Petroleum Association of Mountain States (IPAMS) 410 17th Street, Suite 1920 Denver, CO 80202 Phase III Oil & Gas Emissions Inventory Project http://www.wrapair.org/forums/ssjf/documents/eictts/oilgas.html April 30, 2008
Transcript of DEVELOPMENT OF 2010 OIL AND GAS EMISSIONS PROJECTIONS FOR THE

773 San Marin Drive, Suite 2115, Novato, CA 94998 415.899.0700
ENVIRON International Corporation
DEVELOPMENT OF 2010 OIL AND GAS EMISSIONS PROJECTIONS FOR THE DENVER-JULESBURG BASIN
Prepared for Colorado Department of Public Health and
Environment Air Pollution Control Division
Prepared by Amnon Bar-Ilan
John Grant Ron Friesen
Alison K. Pollack ENVIRON International Corporation
773 San Marin Drive, Suite 2115 Novato, CA 94998
Doug Henderer
Daniel Pring Buys & Associates
300 E. Mineral Ave., Suite 10 Littleton, CO 80122
Andrew Bremner
Independent Petroleum Association of Mountain States (IPAMS) 410 17th Street, Suite 1920
Denver, CO 80202
Phase III Oil & Gas Emissions Inventory Project http://www.wrapair.org/forums/ssjf/documents/eictts/oilgas.html
April 30, 2008
April 2008
G:\IPAMS\Technical_Reports\D-J_Basin\CDPHE_Submission\2010_Proj_Emiss_D-J_Basin_043008.doc i
TABLE OF CONTENTS
Page INTRODUCTION..........................................................................................................................1 GEOGRAPHIC GROUPING.......................................................................................................1 PARAMETERS PROJECTED ....................................................................................................2 PROJECTION METHODOLOGIES FOR GEOGRAPHIC GROUPINGS.....................................................................................................4
Weld County ........................................................................................................................4 Yuma County .......................................................................................................................8 All Other Counties .............................................................................................................12
SCALING FACTOR DEVELOPMENT AND UNCONTROLLED 2010 EMISSIONS .....................................................................................15
Weld and Yuma County.....................................................................................................15 All Other Counties in the D-J Basin ..................................................................................16
CONTROLLED 2010 EMISSIONS...........................................................................................17 SUMMARY RESULTS...............................................................................................................18
TABLES
Table 1 Scaling parameter for each oil and gas source category considered in this inventory ........................................................................................................................2
Table 2 Scaling factors for the four parameters used in the projection analysis for the three geographic groupings..........................................................................................17
Table 3 Summary of federal and state “on-the-books” regulations affecting the oil and gas source categories considered in this inventory ......................................................17
Table 4 2010 emissions of all criteria pollutants by county for the D-J Basin .........................21 Table 5 2010 NOx emissions [ton/yr] by county and by source category for the D-J
Basin ............................................................................................................................22 Table 6 2010 VOC emissions [ton/yr] by county and by source category for the D-J
Basin. ...........................................................................................................................23
FIGURES
Figure 1 Gas production historical data for Weld County (from the IHS database)....................4 Figure 2 Oil production historical data for Weld County (from the IHS database).....................5 Figure 3 Well count historical data for Weld County (from the IHS database)...........................6 Figure 4 Spud count historical data for Weld County (from the IHS database) ..........................7
April 2008
G:\IPAMS\Technical_Reports\D-J_Basin\CDPHE_Submission\2010_Proj_Emiss_D-J_Basin_043008.doc ii
Figure 5 Gas production historical data for Yuma County (from the IHS database)..................8 Figure 6 Oil production historical data for Yuma County (from the IHS database)....................9 Figure 7 Well count historical data for Yuma County (from the IHS database)........................10 Figure 8 Spud count historical data for Yuma County (from the IHS database) .......................11 Figure 9 Gas production historical data for all other counties in the D-J Basin combined
(from the IHS database) ...............................................................................................12 Figure 10 Oil production historical data for all other counties in the D-J Basin combined
(from the IHS database) ...............................................................................................13 Figure 11 Well count historical data for all other counties in the D-J Basin combined
(from the IHS database) ...............................................................................................14 Figure 12 Spud count historical data for all other counties in the D-J Basin combined
(from the IHS database) ...............................................................................................15 Figure 13 2010 NOx emissions by source category and by county in the D-J Basin ..................19 Figure 14 2010 VOC emissions by source category and by county in the D-J Basin.................19 Figure 15 2010 NOx emissions proportional contributions by source category in the DJ
Basin ............................................................................................................................20 Figure 16 2010 VOC emissions proportional contributions by source category in the DJ
Basin ............................................................................................................................20

April 2008
G:\IPAMS\Technical_Reports\D-J_Basin\CDPHE_Submission\2010_Proj_Emiss_D-J_Basin_043008.doc 1
INTRODUCTION
This document outlines the projection methodologies used in generating the 2010 model-ready emissions from oil and gas sources in the Denver-Julesburg (D-J) Basin to be used in the upcoming Denver metropolitan-area ozone SIP modeling. These methodologies will use as a starting point the 2006 baseline D-J Basin oil and gas emissions inventory as approved by CDPHE. This methodology description is broken down into subsections which describe:
• Geographic grouping of data – regional differences in production or activity are factored into the projection methodology by geographic region
• Projected parameters – four basic parameters are projected forward to 2010 for purposes of developing scaling factors: well counts, spud counts, gas production and oil production
• Scaling factors and developing uncontrolled emissions projections – the projected parameters are used to develop scaling factors (incorporating geographic groupings), and these scaling factors are applied to the 2006 baseline emissions
• Application of “on-the-books” regulations and control measures – existing regulations are summarized for their impacts on the future year emissions and applied to adjust the 2010 inventory.
Projections for years beyond 2010 (not addressed in this methodology) will likely include additional parameters and will be based on these 2010 projections as the start year. Following the discussion of the methodology, the results of the 2010 emissions projections for the D-J Basin are presented in graphical and tabular formats. GEOGRAPHIC GROUPING The projections for 2010 have been conducted separately for 3 geographic groupings in the D-J Basin:
1. Weld County 2. Yuma County 3. All other counties in the D-J Basin combined
The reason for conducting this grouping is that the majority of 2006 production, well counts and spud (drilling event) counts occur in Weld and Yuma County. Weld and Yuma Counties combined represent 94% and 87% of all gas and oil production respectively in the D-J Basin in 2006. Weld and Yuma Counties combined represent 87% and 95% of all wells and spuds respectively in the D-J Basin in 2006. Because oil and gas exploration and production activities differ significantly in Weld and Yuma Counties, these two counties are each treated separately.
April 2008
G:\IPAMS\Technical_Reports\D-J_Basin\CDPHE_Submission\2010_Proj_Emiss_D-J_Basin_043008.doc 2
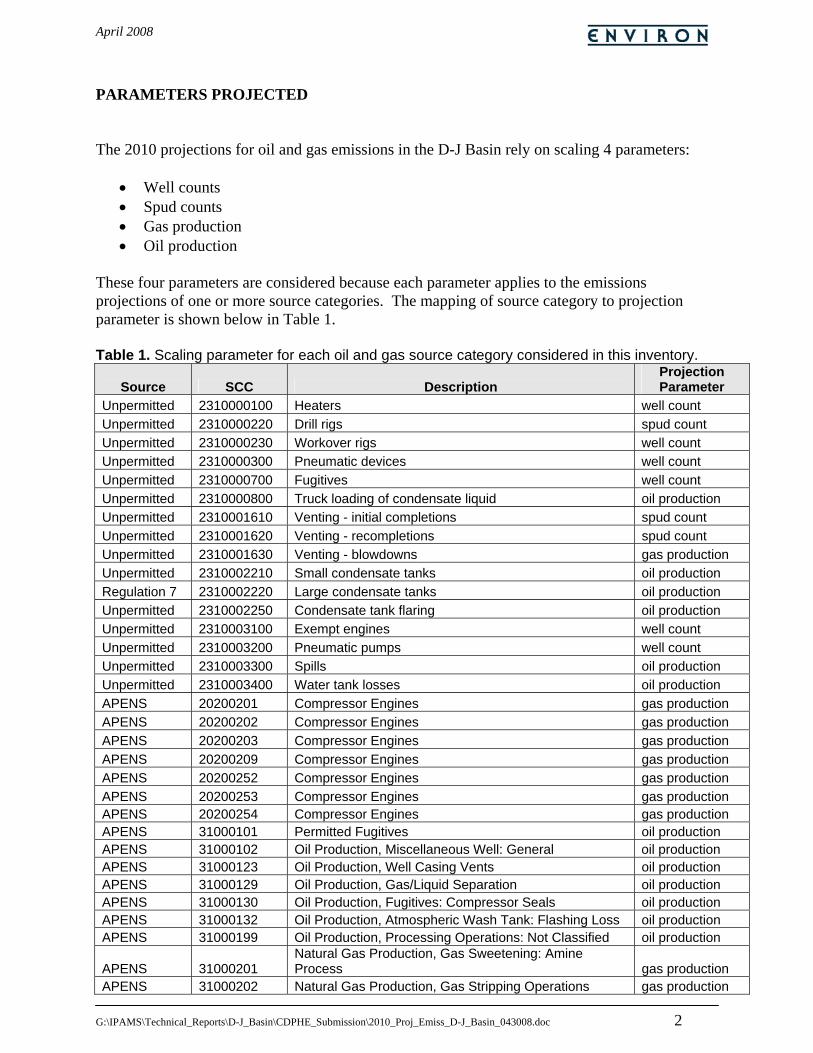
PARAMETERS PROJECTED The 2010 projections for oil and gas emissions in the D-J Basin rely on scaling 4 parameters:
• Well counts • Spud counts • Gas production • Oil production
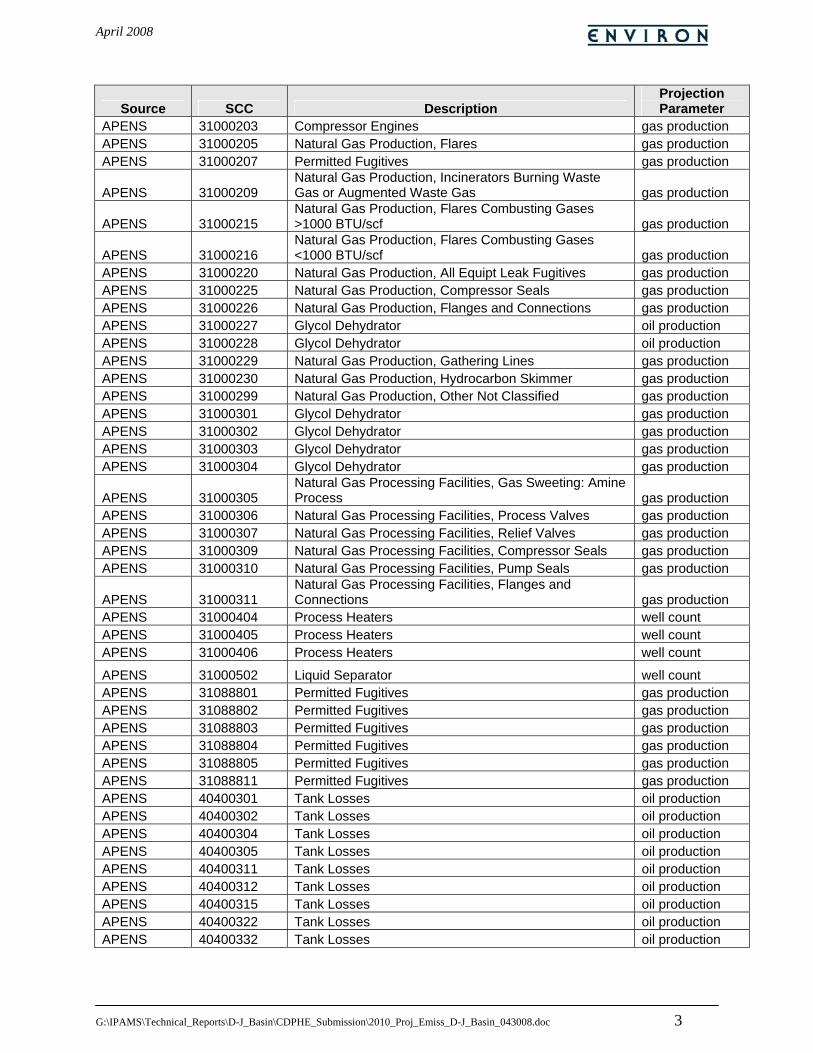
These four parameters are considered because each parameter applies to the emissions projections of one or more source categories. The mapping of source category to projection parameter is shown below in Table 1. Table 1. Scaling parameter for each oil and gas source category considered in this inventory.
Source SCC Description Projection Parameter
Unpermitted 2310000100 Heaters well count Unpermitted 2310000220 Drill rigs spud count Unpermitted 2310000230 Workover rigs well count Unpermitted 2310000300 Pneumatic devices well count Unpermitted 2310000700 Fugitives well count Unpermitted 2310000800 Truck loading of condensate liquid oil production Unpermitted 2310001610 Venting - initial completions spud count Unpermitted 2310001620 Venting - recompletions spud count Unpermitted 2310001630 Venting - blowdowns gas production Unpermitted 2310002210 Small condensate tanks oil production Regulation 7 2310002220 Large condensate tanks oil production Unpermitted 2310002250 Condensate tank flaring oil production Unpermitted 2310003100 Exempt engines well count Unpermitted 2310003200 Pneumatic pumps well count Unpermitted 2310003300 Spills oil production Unpermitted 2310003400 Water tank losses oil production APENS 20200201 Compressor Engines gas production APENS 20200202 Compressor Engines gas production APENS 20200203 Compressor Engines gas production APENS 20200209 Compressor Engines gas production APENS 20200252 Compressor Engines gas production APENS 20200253 Compressor Engines gas production APENS 20200254 Compressor Engines gas production APENS 31000101 Permitted Fugitives oil production APENS 31000102 Oil Production, Miscellaneous Well: General oil production APENS 31000123 Oil Production, Well Casing Vents oil production APENS 31000129 Oil Production, Gas/Liquid Separation oil production APENS 31000130 Oil Production, Fugitives: Compressor Seals oil production APENS 31000132 Oil Production, Atmospheric Wash Tank: Flashing Loss oil production APENS 31000199 Oil Production, Processing Operations: Not Classified oil production
APENS 31000201 Natural Gas Production, Gas Sweetening: Amine Process gas production
APENS 31000202 Natural Gas Production, Gas Stripping Operations gas production
April 2008
G:\IPAMS\Technical_Reports\D-J_Basin\CDPHE_Submission\2010_Proj_Emiss_D-J_Basin_043008.doc 3
Source SCC Description Projection Parameter
APENS 31000203 Compressor Engines gas production APENS 31000205 Natural Gas Production, Flares gas production APENS 31000207 Permitted Fugitives gas production
APENS 31000209 Natural Gas Production, Incinerators Burning Waste Gas or Augmented Waste Gas gas production
APENS 31000215 Natural Gas Production, Flares Combusting Gases >1000 BTU/scf gas production
APENS 31000216 Natural Gas Production, Flares Combusting Gases <1000 BTU/scf gas production
APENS 31000220 Natural Gas Production, All Equipt Leak Fugitives gas production APENS 31000225 Natural Gas Production, Compressor Seals gas production APENS 31000226 Natural Gas Production, Flanges and Connections gas production APENS 31000227 Glycol Dehydrator oil production APENS 31000228 Glycol Dehydrator oil production APENS 31000229 Natural Gas Production, Gathering Lines gas production APENS 31000230 Natural Gas Production, Hydrocarbon Skimmer gas production APENS 31000299 Natural Gas Production, Other Not Classified gas production APENS 31000301 Glycol Dehydrator gas production APENS 31000302 Glycol Dehydrator gas production APENS 31000303 Glycol Dehydrator gas production APENS 31000304 Glycol Dehydrator gas production
APENS 31000305 Natural Gas Processing Facilities, Gas Sweeting: Amine Process gas production
APENS 31000306 Natural Gas Processing Facilities, Process Valves gas production APENS 31000307 Natural Gas Processing Facilities, Relief Valves gas production APENS 31000309 Natural Gas Processing Facilities, Compressor Seals gas production APENS 31000310 Natural Gas Processing Facilities, Pump Seals gas production
APENS 31000311 Natural Gas Processing Facilities, Flanges and Connections gas production
APENS 31000404 Process Heaters well count APENS 31000405 Process Heaters well count APENS 31000406 Process Heaters well count
APENS 31000502 Liquid Separator well count APENS 31088801 Permitted Fugitives gas production APENS 31088802 Permitted Fugitives gas production APENS 31088803 Permitted Fugitives gas production APENS 31088804 Permitted Fugitives gas production APENS 31088805 Permitted Fugitives gas production APENS 31088811 Permitted Fugitives gas production APENS 40400301 Tank Losses oil production APENS 40400302 Tank Losses oil production APENS 40400304 Tank Losses oil production APENS 40400305 Tank Losses oil production APENS 40400311 Tank Losses oil production APENS 40400312 Tank Losses oil production APENS 40400315 Tank Losses oil production APENS 40400322 Tank Losses oil production APENS 40400332 Tank Losses oil production

April 2008
G:\IPAMS\Technical_Reports\D-J_Basin\CDPHE_Submission\2010_Proj_Emiss_D-J_Basin_043008.doc 4
PROJECTION METHODOLOGIES FOR GEOGRAPHIC GROUPINGS For each geographic grouping, the methodology for obtaining the 2010 value of each projection parameter (well count, spud count, oil production and gas production) is described below. In general, the methodologies were developed by obtaining the historical data for the parameter in the geographic grouping using the IHS database, and projecting a trend line forward from 2006 to 2010. The IHS database is a tool to query COGCC data, and previous work has confirmed that IHS data is consistent with COGCC’s data. In some cases, a different methodology was applied as noted below. Weld County Gas Production - Gas production in Weld County has been plotted for the years 1970 – 2006 below in Figure 1.
0
50,000,000
100,000,000
150,000,000
200,000,000
250,000,000
1970 1975 1980 1985 1990 1995 2000 2005
Year
Gas
Pro
duct
ion
[mcf
]
Figure 1. Gas production historical data for Weld County (from the IHS database). Because production activity differed greatly in Weld County in the years prior to 1997 from what has occurred from 1997 – 2006, only the period 1997 – 2006 is considered in this analysis. During this period, gas production peaked in 2004 and has been declining from 2004 – 2006. This decline is the result of the depletion of the J Sands formation. New drilling in the Codell formation is producing significantly higher oil production. However, the major companies in the D-J Basin have indicated that they intend to continue drilling activities in Weld County and expect gas production from their operations to continue to grow at 5% per year1.
1 Data provided by Anadarko Petroleum Corp. and Noble Energy Inc.

April 2008
G:\IPAMS\Technical_Reports\D-J_Basin\CDPHE_Submission\2010_Proj_Emiss_D-J_Basin_043008.doc 5
Based on this information, the methodology used to estimate 2010 gas production in Weld County was to grow 2006 gas production in the county by 5% per year for the years 2006 – 2010. Oil Production – Oil production in Weld County has been plotted for the years 1970 – 2006 below in Figure 2.
0
2,000,000
4,000,000
6,000,000
8,000,000
10,000,000
12,000,000
14,000,000
1970 1975 1980 1985 1990 1995 2000 2005
Year
Oil
Prod
uctio
n [b
bl]
Figure 2. Oil production historical data for Weld County (from the IHS database). Similarly to gas production, oil activity has differed greatly from 1999 – 2006 than from past activity before 1999. Data from 1999 – 2006 is considered in this projection methodology. Based on information from the major production companies in Weld County2, it was assumed conservatively that growth in oil production would continue following the trend observed from 1999 – 2006. A linear curve was best fit to the 1999 – 2006 oil production data, and this curve was extrapolated to 2010.
2 Data provided by Anadarko Petroleum Corp. and Noble Energy Inc.

April 2008
G:\IPAMS\Technical_Reports\D-J_Basin\CDPHE_Submission\2010_Proj_Emiss_D-J_Basin_043008.doc 6
Well Count – Well counts in Weld County have been plotted for the years 1970 – 2006 below in Figure 3.
0
2000
4000
6000
8000
10000
12000
14000
1970 1975 1980 1985 1990 1995 2000 2005
Year
Wel
l Cou
nt
Figure 3. Well count historical data for Weld County (from the IHS database). Based on the historical data shown in Figure 3, a second order curve was best fit to the 1999 – 2006 well count data for Weld County and extrapolated to 2010.

April 2008
G:\IPAMS\Technical_Reports\D-J_Basin\CDPHE_Submission\2010_Proj_Emiss_D-J_Basin_043008.doc 7
Spud Count – Spud counts in Weld County have been plotted for the years 1970 – 2006 below in Figure 4.
0
200
400
600
800
1000
1200
1970 1975 1980 1985 1990 1995 2000 2005
Year
Num
ber o
f Spu
ds
Figure 4. Spud count historical data for Weld County (from the IHS database). Based on the increased activity from 1999 – 2006 as described above, only this data was considered for purposes of projecting Weld County spud counts. A linear curve was best fit to the spud count data from 1999 – 2006 and extrapolated to 2010. For each year between 2006 – 2010, the spud count was evaluated and totaled and this total was compared to the 2010 well count projection to assess whether the total drilling activity added to the 2006 existing well count matched reasonably well with the prediction for 2010 well count. It was found that spud count projections matched reasonably well with well count projections.

April 2008
G:\IPAMS\Technical_Reports\D-J_Basin\CDPHE_Submission\2010_Proj_Emiss_D-J_Basin_043008.doc 8
Yuma County Gas Production - Gas production in Yuma County has been plotted for the years 1970 – 2006 below in Figure 5.
0
5,000,000
10,000,000
15,000,000
20,000,000
25,000,000
30,000,000
35,000,000
40,000,000
1970 1975 1980 1985 1990 1995 2000 2005
Year
Gas
Pro
duct
ion
[mcf
]
Figure 5. Gas production historical data for Yuma County (from the IHS database). Production of gas in Yuma County has accelerated recently, from 2004 – 2006 due to increased activity in this area. Therefore gas production data from 2004 – 2006 was used for purposes of projecting gas production to 2010. A linear curve was best fit to the gas production data from 2004 – 2006 and extrapolated to 2010. This is likely to conservatively overestimate the gas production in this county for 2010.

April 2008
G:\IPAMS\Technical_Reports\D-J_Basin\CDPHE_Submission\2010_Proj_Emiss_D-J_Basin_043008.doc 9
Oil Production - Oil production in Yuma County has been plotted for the years 1970 – 2006 below in Figure 6.
0
200
400
600
800
1,000
1,200
1,400
1,600
1970 1975 1980 1985 1990 1995 2000 2005
Year
Oil
Prod
uctio
n [b
bl]
Figure 6. Oil production historical data for Yuma County (from the IHS database). Yuma County has had little or no oil production during the period 1970 – 2006, and no oil production from 1996 – 2006. It was assumed that there is no oil production in Yuma County in 2010.

April 2008
G:\IPAMS\Technical_Reports\D-J_Basin\CDPHE_Submission\2010_Proj_Emiss_D-J_Basin_043008.doc 10
Well Count – Well counts in Yuma County have been plotted for the years 1970 – 2006 below in Figure 7.
0
500
1000
1500
2000
2500
3000
3500
1970 1975 1980 1985 1990 1995 2000 2005
Year
Wel
l Cou
nt
Figure 7. Well count historical data for Yuma County (from the IHS database). Due to the increased recent activity in Yuma County as described above, well count data from 2004 – 2006 was used to project 2010 well counts. A linear curve was best fit to the 2004 – 2006 well count data and projected to 2010.

April 2008
G:\IPAMS\Technical_Reports\D-J_Basin\CDPHE_Submission\2010_Proj_Emiss_D-J_Basin_043008.doc 11
Spud Count – Spud counts in Yuma County have been plotted for the years 1970 – 2006 below in Figure 8.
0
100
200
300
400
500
600
700
1970 1975 1980 1985 1990 1995 2000 2005
Year
Num
ber o
f Spu
ds
Figure 8. Spud count historical data for Yuma County (from the IHS database). There has been a substantial increase in the number of annual spuds in Yuma County from 2004 – 2005, however there were fewer spuds recorded in 2006. Based on information from the major producing companies3 this is likely due to the lack of availability of drilling equipment in Yuma County as activity in other major basins in Colorado and other states is utilizing much of the available drilling capacity. Therefore the number of spuds was projected to remain constant from 2006 – 2010.
3 Data provided by Anadarko Petroleum Corp. and Noble Energy Inc.

April 2008
G:\IPAMS\Technical_Reports\D-J_Basin\CDPHE_Submission\2010_Proj_Emiss_D-J_Basin_043008.doc 12
All Other Counties Gas Production - Gas production in all other D-J Basin counties combined has been plotted for the years 1970 – 2006 below in Figure 9.
0
5,000,000
10,000,000
15,000,000
20,000,000
25,000,000
30,000,000
35,000,000
40,000,000
1970 1975 1980 1985 1990 1995 2000 2005
Year
Gas
Pro
duct
ion
[mcf
]
Figure 9. Gas production historical data for all other counties in the D-J Basin combined (from the IHS database). Figure 9 shows that from 1992 – 2006 gas production has declined in this geographic grouping. An exponential curve was best fit to the gas production data in all other counties combined in the years 1992 – 2006, and extrapolated to 2010.

April 2008
G:\IPAMS\Technical_Reports\D-J_Basin\CDPHE_Submission\2010_Proj_Emiss_D-J_Basin_043008.doc 13
Oil Production – Oil production in all other D-J Basin counties combined has been plotted for the years 1970 – 2006 below in Figure 10.
0
1,000,000
2,000,000
3,000,000
4,000,000
5,000,000
6,000,000
7,000,000
8,000,000
9,000,000
10,000,000
1970 1975 1980 1985 1990 1995 2000 2005
Year
Oil
Prod
uctio
n [b
bl]
Figure 10. Oil production historical data for all other counties in the D-J Basin combined (from the IHS database). Figure 10 shows that from 1985 – 2006 oil production has declined in this geographic grouping. An exponential curve was best fit to the oil production data in all other counties combined in the years 1985 – 2006, and extrapolated to 2010.

April 2008
G:\IPAMS\Technical_Reports\D-J_Basin\CDPHE_Submission\2010_Proj_Emiss_D-J_Basin_043008.doc 14
Well Count – Well counts in all other D-J Basin counties combined have been plotted for the years 1970 – 2006 below in Figure 11.
0
500
1,000
1,500
2,000
2,500
1970 1975 1980 1985 1990 1995 2000 2005
Year
Wel
l Cou
nt
Figure 11. Well count historical data for all other counties in the D-J Basin combined (from the IHS database). Well counts in the combined other counties in D-J Basin is primarily driven by activity in Adams county, which borders the large oil and gas development area in Weld County. As described above, a significant increase in activity in this area has been observed since 1999. Based on this information, a linear curve was best fit to the well count data for all other counties in the D-J Basin combined for the years 1999 – 2006, and extrapolated to 2010.

April 2008
G:\IPAMS\Technical_Reports\D-J_Basin\CDPHE_Submission\2010_Proj_Emiss_D-J_Basin_043008.doc 15
Spud Count – Spud counts in all other D-J Basin counties combined have been plotted for the years 1970 – 2006 below in Figure 12.
0
100
200
300
400
500
600
700
800
900
1970 1975 1980 1985 1990 1995 2000 2005
Year
Num
ber o
f Spu
ds
Figure 12. Spud count historical data for all other counties in the D-J Basin combined (from the IHS database). Figure 12 shows that from 1985 – 2006 spud counts have declined in this geographic grouping. An exponential curve was best fit to the spud count data in all other counties combined in the years 1985 – 2006, and extrapolated to 2010. SCALING FACTOR DEVELOPMENT AND UNCONTROLLED 2010 EMISSIONS Scaling factors were generated for each geographic grouping for each parameter considered here: gas production, oil production, well count and spud count. The ratio of the value of each of these parameters in each geographic grouping in 2010 to their values in 2006 is the scaling factor for that parameter for purposes of this projection. A more detailed description is given below for each geographic grouping. Weld County and Yuma County The projected 2010 values of each of the four parameters for each of these two counties were ratioed to the value of the respective parameter in 2006, following Equation (1):
Equation (1) 2006
2010W
Wfi =

April 2008
G:\IPAMS\Technical_Reports\D-J_Basin\CDPHE_Submission\2010_Proj_Emiss_D-J_Basin_043008.doc 16
where:
fi is the scaling factor for either Weld or Yuma County for parameter i (gas production, oil production, well count or spud count) W2006 is the value of parameter i in 2006 W2010 is the projected value of parameter i in 2010
All Other Counties in the D-J Basin Because all other counties were combined for purposes of projecting gas production, oil production, well count, and spud count, the projected parameters were apportioned to each county in this grouping based on the 2006 fractions of that county’s gas production, oil production, well count or spud count. The scaling factors for each county in this grouping are estimated according to Equation (2):
Equation (2) ⎟⎠⎞⎜
⎝⎛×=
2006
2010, Q
Qcf countyii
where:
fi is the scaling factor for each county in the “other counties” grouping for parameter i (gas production, oil production, well count or spud count) ci,county is the fraction of parameter i for all combined counties that is assigned to each specific county based on 2006 data Q2006 is the value of parameter i in 2006 for all other combined counties Q2010 is the projected value of parameter i in 2010 for all other combined counties
Emissions were therefore projected to 2010 for each county in the D-J Basin using the scaling factors derived above for each county. Uncontrolled 2010 emissions were estimated according to Equation (3): Equation (2) 2006,,,2010,, countyjcountyicountyj EfE ×= where:
Ej,county,2010 are the projected emissions in a specific county in 2010 for source category j Ej,county,2006 are the 2006 baseline emissions in a specific county for source category j fi is the scaling factor for each county for parameter i (gas production, oil production, well count or spud count)
The scaling factor based on the appropriate parameter (gas production, oil production, well count or spud count) is selected for each source category as described in Table 1. The scaling factors for the four parameters used in this analysis for each of the three geographic groupings is presented in Table 2 below.
April 2008
G:\IPAMS\Technical_Reports\D-J_Basin\CDPHE_Submission\2010_Proj_Emiss_D-J_Basin_043008.doc 17
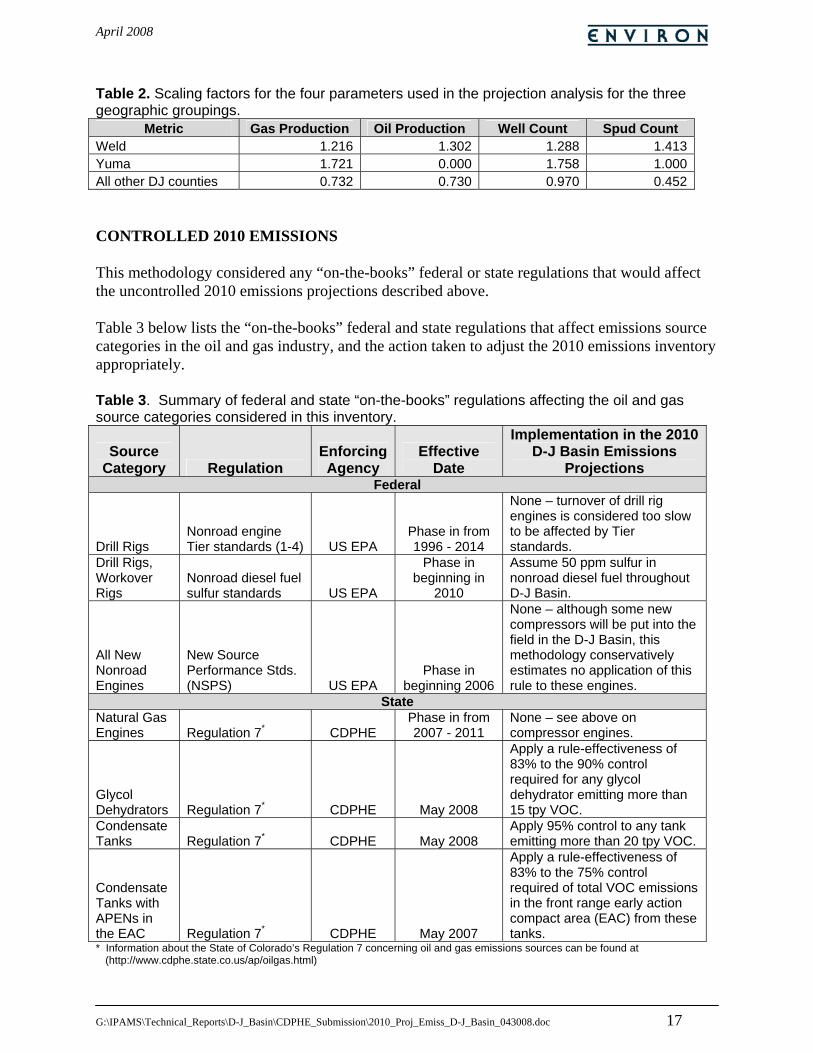
Table 2. Scaling factors for the four parameters used in the projection analysis for the three geographic groupings.
Metric Gas Production Oil Production Well Count Spud Count Weld 1.216 1.302 1.288 1.413Yuma 1.721 0.000 1.758 1.000All other DJ counties 0.732 0.730 0.970 0.452 CONTROLLED 2010 EMISSIONS This methodology considered any “on-the-books” federal or state regulations that would affect the uncontrolled 2010 emissions projections described above. Table 3 below lists the “on-the-books” federal and state regulations that affect emissions source categories in the oil and gas industry, and the action taken to adjust the 2010 emissions inventory appropriately. Table 3. Summary of federal and state “on-the-books” regulations affecting the oil and gas source categories considered in this inventory.
Source Category Regulation
Enforcing Agency
Effective Date
Implementation in the 2010 D-J Basin Emissions
Projections Federal
Drill Rigs Nonroad engine Tier standards (1-4) US EPA
Phase in from 1996 - 2014
None – turnover of drill rig engines is considered too slow to be affected by Tier standards.
Drill Rigs, Workover Rigs
Nonroad diesel fuel sulfur standards US EPA
Phase in beginning in
2010
Assume 50 ppm sulfur in nonroad diesel fuel throughout D-J Basin.
All New Nonroad Engines
New Source Performance Stds. (NSPS) US EPA
Phase in beginning 2006
None – although some new compressors will be put into the field in the D-J Basin, this methodology conservatively estimates no application of this rule to these engines.
State Natural Gas Engines Regulation 7* CDPHE
Phase in from 2007 - 2011
None – see above on compressor engines.
Glycol Dehydrators Regulation 7* CDPHE May 2008
Apply a rule-effectiveness of 83% to the 90% control required for any glycol dehydrator emitting more than 15 tpy VOC.
Condensate Tanks Regulation 7* CDPHE May 2008
Apply 95% control to any tank emitting more than 20 tpy VOC.
Condensate Tanks with APENs in the EAC Regulation 7* CDPHE May 2007
Apply a rule-effectiveness of 83% to the 75% control required of total VOC emissions in the front range early action compact area (EAC) from these tanks.
* Information about the State of Colorado’s Regulation 7 concerning oil and gas emissions sources can be found at (http://www.cdphe.state.co.us/ap/oilgas.html)
April 2008
G:\IPAMS\Technical_Reports\D-J_Basin\CDPHE_Submission\2010_Proj_Emiss_D-J_Basin_043008.doc 18
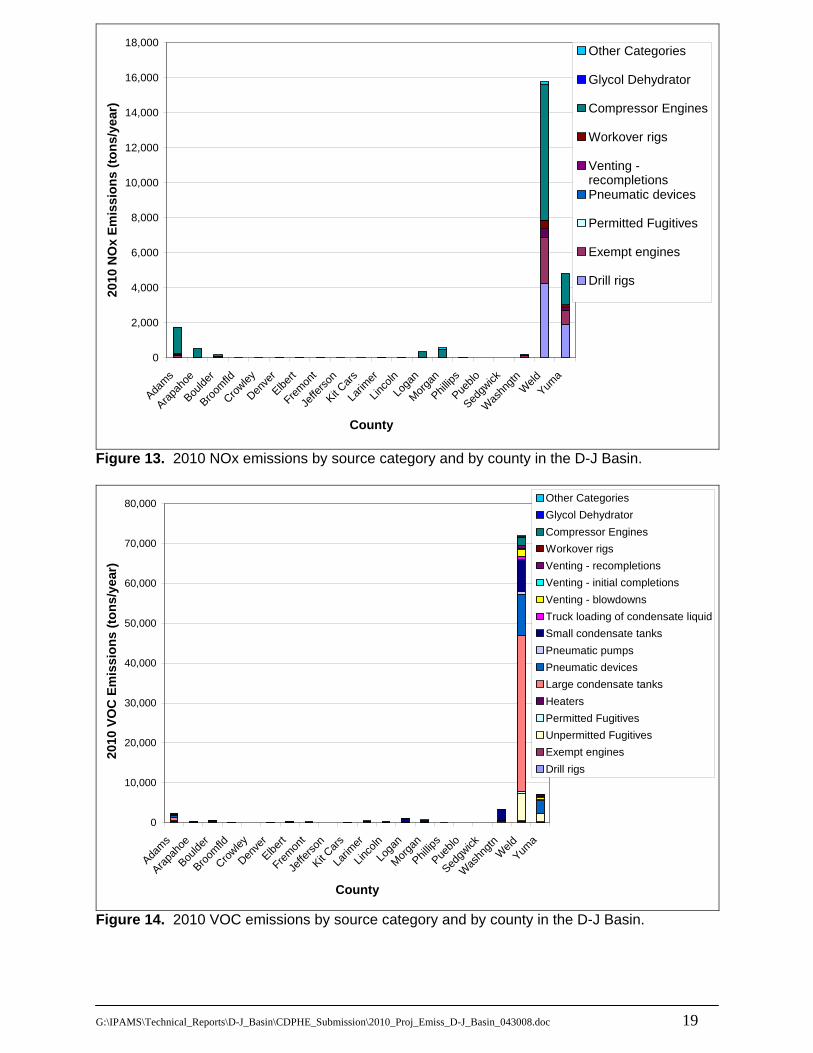
The uncontrolled 2010 emissions were adjusted based on the proposed action described in Table 3 to account for each regulation that may affect any oil and gas source category considered in this inventory. The methodology recognizes that there are a number of voluntary and/or required control measures that have been partially implemented since 2006, and/or will be implemented completely by the calendar year 2010. However, these controls were not incorporated into this base case 2010 projection, but rather could form part of the controls to be included in a control scenario. The resulting controlled 2010 emissions are considered the final 2010 oil and gas emissions inventory projection for purposes of the Denver metropolitan area ozone SIP modeling. SUMMARY RESULTS The scaling factors were applied to the baseline 2006 inventory, and “on-the-books” regulations were applied to the uncontrolled 2010 emissions projections to generate the final 2010 emissions projections and results are presented below. Figure 15 shows that compressor engines and drilling rigs combined account for almost 80% of NOx emissions in 2010. Similarly, Figure 16 shows that permitted and unpermitted condensate tanks and pneumatic devices account for approximately 77% of VOC emissions in 2010.
G:\IPAMS\Technical_Reports\D-J_Basin\CDPHE_Submission\2010_Proj_Emiss_D-J_Basin_043008.doc 19
0
2,000
4,000
6,000
8,000
10,000
12,000
14,000
16,000
18,000
Adams
Arapah
oe
Boulde
r
Broomfld
Crowley
Denve
rElbe
rt
Fremon
t
Jeffe
rson
Kit Cars
Larim
er
Linco
lnLo
gan
Morgan
Phillip
s
Pueblo
Sedgw
ick
Was
hngtn W
eldYum
a
County
2010
NO
x Em
issi
ons
(tons
/yea
r)
Other Categories
Glycol Dehydrator
Compressor Engines
Workover rigs
Venting -recompletionsPneumatic devices
Permitted Fugitives
Exempt engines
Drill rigs
Figure 13. 2010 NOx emissions by source category and by county in the D-J Basin.
0
10,000
20,000
30,000
40,000
50,000
60,000
70,000
80,000
Adams
Arapah
oe
Boulde
r
Broomfld
Crowley
Denve
rElbe
rt
Fremon
t
Jeffe
rson
Kit Cars
Larim
er
Linco
lnLo
gan
Morgan
Phillip
s
Pueblo
Sedgw
ick
Was
hngtn W
eldYum
a
County
201
0 VO
C E
mis
sion
s (to
ns/y
ear)
Other CategoriesGlycol DehydratorCompressor EnginesWorkover rigsVenting - recompletionsVenting - initial completionsVenting - blowdownsTruck loading of condensate liquidSmall condensate tanksPneumatic pumpsPneumatic devicesLarge condensate tanksHeatersPermitted FugitivesUnpermitted FugitivesExempt enginesDrill rigs
Figure 14. 2010 VOC emissions by source category and by county in the D-J Basin.

April 2008
G:\IPAMS\Technical_Reports\D-J_Basin\CDPHE_Submission\2010_Proj_Emiss_D-J_Basin_043008.doc 20
Drill rigs26%
Exempt engines15%
Other Categories1%
Workover rigs3%
Heaters3%
Compressor Engines52%
Figure 15. 2010 NOx emissions proportional contributions by source category in the DJ Basin.
Large condensate tanks45%
Other Categories1%
Pneumatic devices17%
Permitted Fugitives1%
Venting - recompletions1%
Truck loading of condensate liquid
1%
Venting - initial completions
1%
Small condensate tanks14%
Pneumatic pumps1%
Venting - blowdowns2%
Unpermitted Fugitives11%
Drill rigs0%
Glycol Dehydrator0%
Compressor Engines3%
Figure 16. 2010 VOC emissions proportional contributions by source category in the DJ Basin.

April 2008
G:\IPAMS\Technical_Reports\D-J_Basin\CDPHE_Submission\2010_Proj_Emiss_D-J_Basin_043008.doc 21
Table 4. 2010 emissions of all criteria pollutants by county for the D-J Basin.
County NOx
[tons/yr] VOC
[tons/yr] CO
[tons/yr] SOx
[tons/yr] PM
[tons/yr] Adams 1,718 2,246 716 9 15Arapahoe 546 299 187 0 3Boulder 174 594 135 0 3Broomfield 13 143 9 0 0Crowley 46 1 62 0 0Denver 29 76 13 0 1Douglas 0 0 0 0 0Elbert 34 282 22 0 1El Paso 0 0 0 0 0Fremont 12 250 7 0 0Jefferson 4 0 7 0 0Kit Carson 6 104 3 0 0Larimer 35 471 22 0 1Lincoln 10 341 8 0 0Logan 357 104 133 1 6Morgan 583 728 541 97 3Phillips 28 39 18 0 1Pueblo 0 0 0 0 0Sedgwick 1 9 0 0 0Teller 0 0 0 0 0Washington 212 3,309 156 0 6Weld 15,768 71,930 10,688 19 555Yuma 4,832 7,127 2,684 4 176Totals 24,408 88,989 15,412 131 771
April 2008
G:\IPAMS\Technical_Reports\D-J_Basin\CDPHE_Submission\2010_Proj_Emiss_D-J_Basin_043008.doc 22
Table 5. 2010 NOx emissions [ton/yr] by county and by source category for the D-J Basin.
County Drill rigs Exempt engines Heaters
Workover Rigs
Compressor Engines
Glycol Dehydrator
Other Categories Totals
Adams 11 147 29 29 1,494 0 8 1,718Arapahoe 5 17 3 3 518 0 0 546Boulder 14 38 8 7 107 0 0 174Broomfield 0 10 2 2 0 0 0 13Crowley 0 0 0 0 46 0 0 46Denver 11 6 1 1 11 0 0 29Douglas 0 0 0 0 0 0 0 0Elbert 2 10 2 2 19 0 0 34El Paso 0 0 0 0 0 0 0 0Fremont 3 6 1 1 0 0 0 12Jefferson 0 0 0 0 4 0 0 4Kit Carson 3 2 0 0 0 0 0 6Larimer 0 22 4 4 4 0 0 35Lincoln 2 2 0 0 6 0 0 10Logan 14 19 4 4 317 0 0 357Morgan 2 11 2 2 468 6 93 583Phillips 5 3 1 1 19 0 0 28Pueblo 0 0 0 0 0 0 0 0Sedgwick 0 1 0 0 0 0 0 1Teller 0 0 0 0 0 0 0 0Washington 36 75 15 15 71 0 0 212Weld 4,255 2,598 514 504 7,734 6 157 15,768Yuma 1,906 803 159 156 1,808 0 0 4,832Totals 6,267 3,769 746 731 12,625 12 259 24,408

April 2008
G:\IPAMS\Technical_Reports\D-J_Basin\CDPHE_Submission\2010_Proj_Emiss_D-J_Basin_043008.doc 23
Table 6. 2010 VOC emissions [ton/yr] by county and by source category for the D-J Basin.
County Drill rigs Fugitives
Large condensate
tanks Pneumatic
devices Pneumatic
pumps
Small condensate
tanks
Truck loading of
condensate liquid
Venting - blowdowns
Venting - initial
completions Venting -
recompletions Compressor
Engines Glycol
Dehydrator Other
Categories Totals
Adams 1 450 729 595 43 127 17 37 1 1 155 32 58 2,246
Arapahoe 0 59 100 68 5 18 2 2 1 1 13 16 14 299
Boulder 1 102 238 167 11 41 5 13 1 2 9 0 4 594
Broomfield 0 25 57 42 3 10 1 4 0 0 0 0 1 143
Crowley 0 0 0 0 0 0 0 0 0 0 1 0 0 1
Denver 1 15 26 23 2 5 1 1 1 1 0 0 1 76
Douglas 0 0 0 0 0 0 0 0 0 0 0 0 0 0
Elbert 0 26 0 40 3 156 2 1 0 0 1 0 53 282
El Paso 0 0 0 0 0 0 0 0 0 0 0 0 0 0
Fremont 0 16 0 25 2 204 2 0 0 0 0 0 1 250
Jefferson 0 0 0 0 0 0 0 0 0 0 0 0 0 0
Kit Carson 0 5 0 8 1 87 1 2 0 0 0 0 0 104
Larimer 0 59 153 90 7 154 5 1 0 0 0 0 2 471
Lincoln 0 5 0 8 1 318 3 0 0 0 0 0 5 341
Logan 1 49 0 74 5 847 9 1 1 2 33 7 10 104
Morgan 0 32 0 44 3 376 4 2 0 0 108 17 143 728
Phillips 0 8 0 13 1 0 0 3 1 1 6 6 0 39
Pueblo 0 0 0 0 0 0 0 0 0 0 0 0 0 0
Sedgwick 0 1 0 2 0 5 0 0 0 0 0 0 0 9
Teller 0 0 0 0 0 0 0 0 0 0 0 0 0 0
Washington 3 200 0 303 22 2,690 27 12 4 5 9 6 29 3,309
Weld 295 7,317 38,985 10,513 761 7,784 902 1,654 413 556 2,155 127 469 71,930
Yuma 132 2,128 0 3,225 235 0 0 475 185 249 296 121 82 7,127
Totals 434 10,498 40,288 15,238 1,104 12,821 980 2,208 608 819 2,786 332 872 88,989


![Assessment of GHGs and SLCPs emissions projections in Asia ... · Assessment of GHGs and SLCPs emissions projections in Asia based on SSP scenarios by using AIM/Enduse[Global] Tatsuya](https://static.fdocuments.in/doc/165x107/5d5ccdfd88c9936f1b8bc21d/assessment-of-ghgs-and-slcps-emissions-projections-in-asia-assessment-of.jpg)